Article

Simulating the Evolution of the Land and Water Resource System under Different Climates in Heilongjiang Province, China

School of Water Conservancy and Civil Engineering, Northeast Agricultural University, Harbin 150030, China
*
Author to whom correspondence should be addressed.
Water 2018, 10(7), 868; https://doi.org/10.3390/w10070868
Submission received: 11 May 2018 / Revised: 26 June 2018 / Accepted: 26 June 2018 / Published: 29 June 2018
(This article belongs to the Special Issue Adaptive Catchment Management and Reservoir Operation)

Abstract

:
Heilongjiang Province is under the pressure of a water shortage due to climate change, population growth and economic development. To effectively manage regional land and water resources, this paper describes a system dynamics model that was built to simulate the interaction between land and water resources and socioeconomic factors, as well as the evolution of regional land and water resources in different climates in Heilongjiang Province. The results show that the declining trend of unused land area and the water supply–demand ratio will not stop, even under the most optimistic (e.g., humid climate) climate conditions, if the current land use patterns continue. Therefore, measures should be taken to manage the unreasonable usage patterns of land and water resources in this region. This study simulated the evolution of regional land and water resources for five scenarios under an arid climate by changing the net irrigation quota for paddy fields, the water quota for industrial use, forestland area, annual change rate of farmland area, and the growth rate of the gross industrial output value. Further, a combined scenario that can maximally reduce the regional land and water resource sustainable risk was identified. The simulation of the combined scenario showed that it can effectively increase the degree of regional land and water resource use in the region, as well as reduce the risks that threaten these resources. This study provides theoretical support for the efficient use of land and water resources in the future.

1. Introduction

Land and water resources are important for human survival; they not only show a region’s resource endowment, but also determine the region’s agricultural and industrial development patterns [1,2,3]. In recent years, the evolution of regional land and water resources has become more dynamic and complex than ever due to climate change, relevant policies, and economic development. More and more scholars have been working on sustainable management of land and water resource systems.
System dynamics (SD) is a method developed by Forrester et al. [4] to study the structure of a system. This method establishes a systematic model with a series of interrelated and feedback variables to study a system’s past, present, and future. This model can be used to reproduce and analyze the dynamic behaviors of a system [5,6,7]. With the increasing complexity, dynamics, and variability of modern society, approaches based on a comprehensive system theory (e.g., SD, cybernetics and information theory) help people to understand nonlinear and time-varying phenomena [8]. The present study uses the SD model because the land and water resource system is the result of the interplay of social, ecological, and economic factors [9], and the model can help us to analyze the evolution of the land and water resource system in the long term [10,11].
At present, land and water resource systems are often used as an important factor of a subsystem in regional environmental [12] or agricultural systems [13]. In a regional environmental system, water and land resources can be used as key components of the resource subsystem; by analyzing the production and consumption of land and water resources, the overall impact of the resource subsystem on the regional environmental system can be analyzed. In agricultural systems, which are based on land and water resources, SD can be used to simulate the dynamic changes in land and water resources to promote the dynamic development of agricultural systems, evaluate the agricultural system as a whole, and analyze the rationality of agricultural models to guarantee the development of agricultural systems.
This paper describes an SD model of the land and water resource system in Heilongjiang Province, which was built to simulate the evolution of the system under different conditions (e.g., economic policies, climate change) and can systematically analyze the land and water use patterns, analyze the interaction between the conditions and results, and identify the potential risks of using regional land and water resources in the region. This study can solve the conflicts between the demand (for future economic development and grain production) and the limited land and water resources, provide guidance for the sustainable use of regional land and water resources, and realize sustainable socioeconomic development.

2. The Study Area

Heilongjiang Province is located in northeastern China; the latitude ranges between 43°26′ and 53°33′ and longitude between 121°11′ and 135°05′ (Figure 1). The province has a temperate continental monsoon climate with high summer temperatures, abundant rainfall, a long winter, and cold and dry weather. The annual sunshine duration is approximately 2300–2800 h, the annual average temperature is approximately −7.9 to 7 °C, and the annual rainfall is approximately 360–830 mm; the solar energy resource is abundant. With its vast territory, the province had farmland area accounting for 11.75% of the country’s total in 2015 and is an important grain production base.
In recent years, the Chinese government has adopted a series of economic policies which have helped the economic development of the province, and the province’s grain production had increased over a consecutive 12-year period, from 2003 to 2015. However, with the economic development and grain production increase, the province presented a sharp increase in water demand and a trend of land resource overdevelopment, resulting in an imbalance between the supply and demand of regional land and water resources. Moreover, the imbalance curbed the region’s economic development and grain production. The “12 consecutive years of increase in grain production” stopped in 2016.

3. The Model and Data Sources

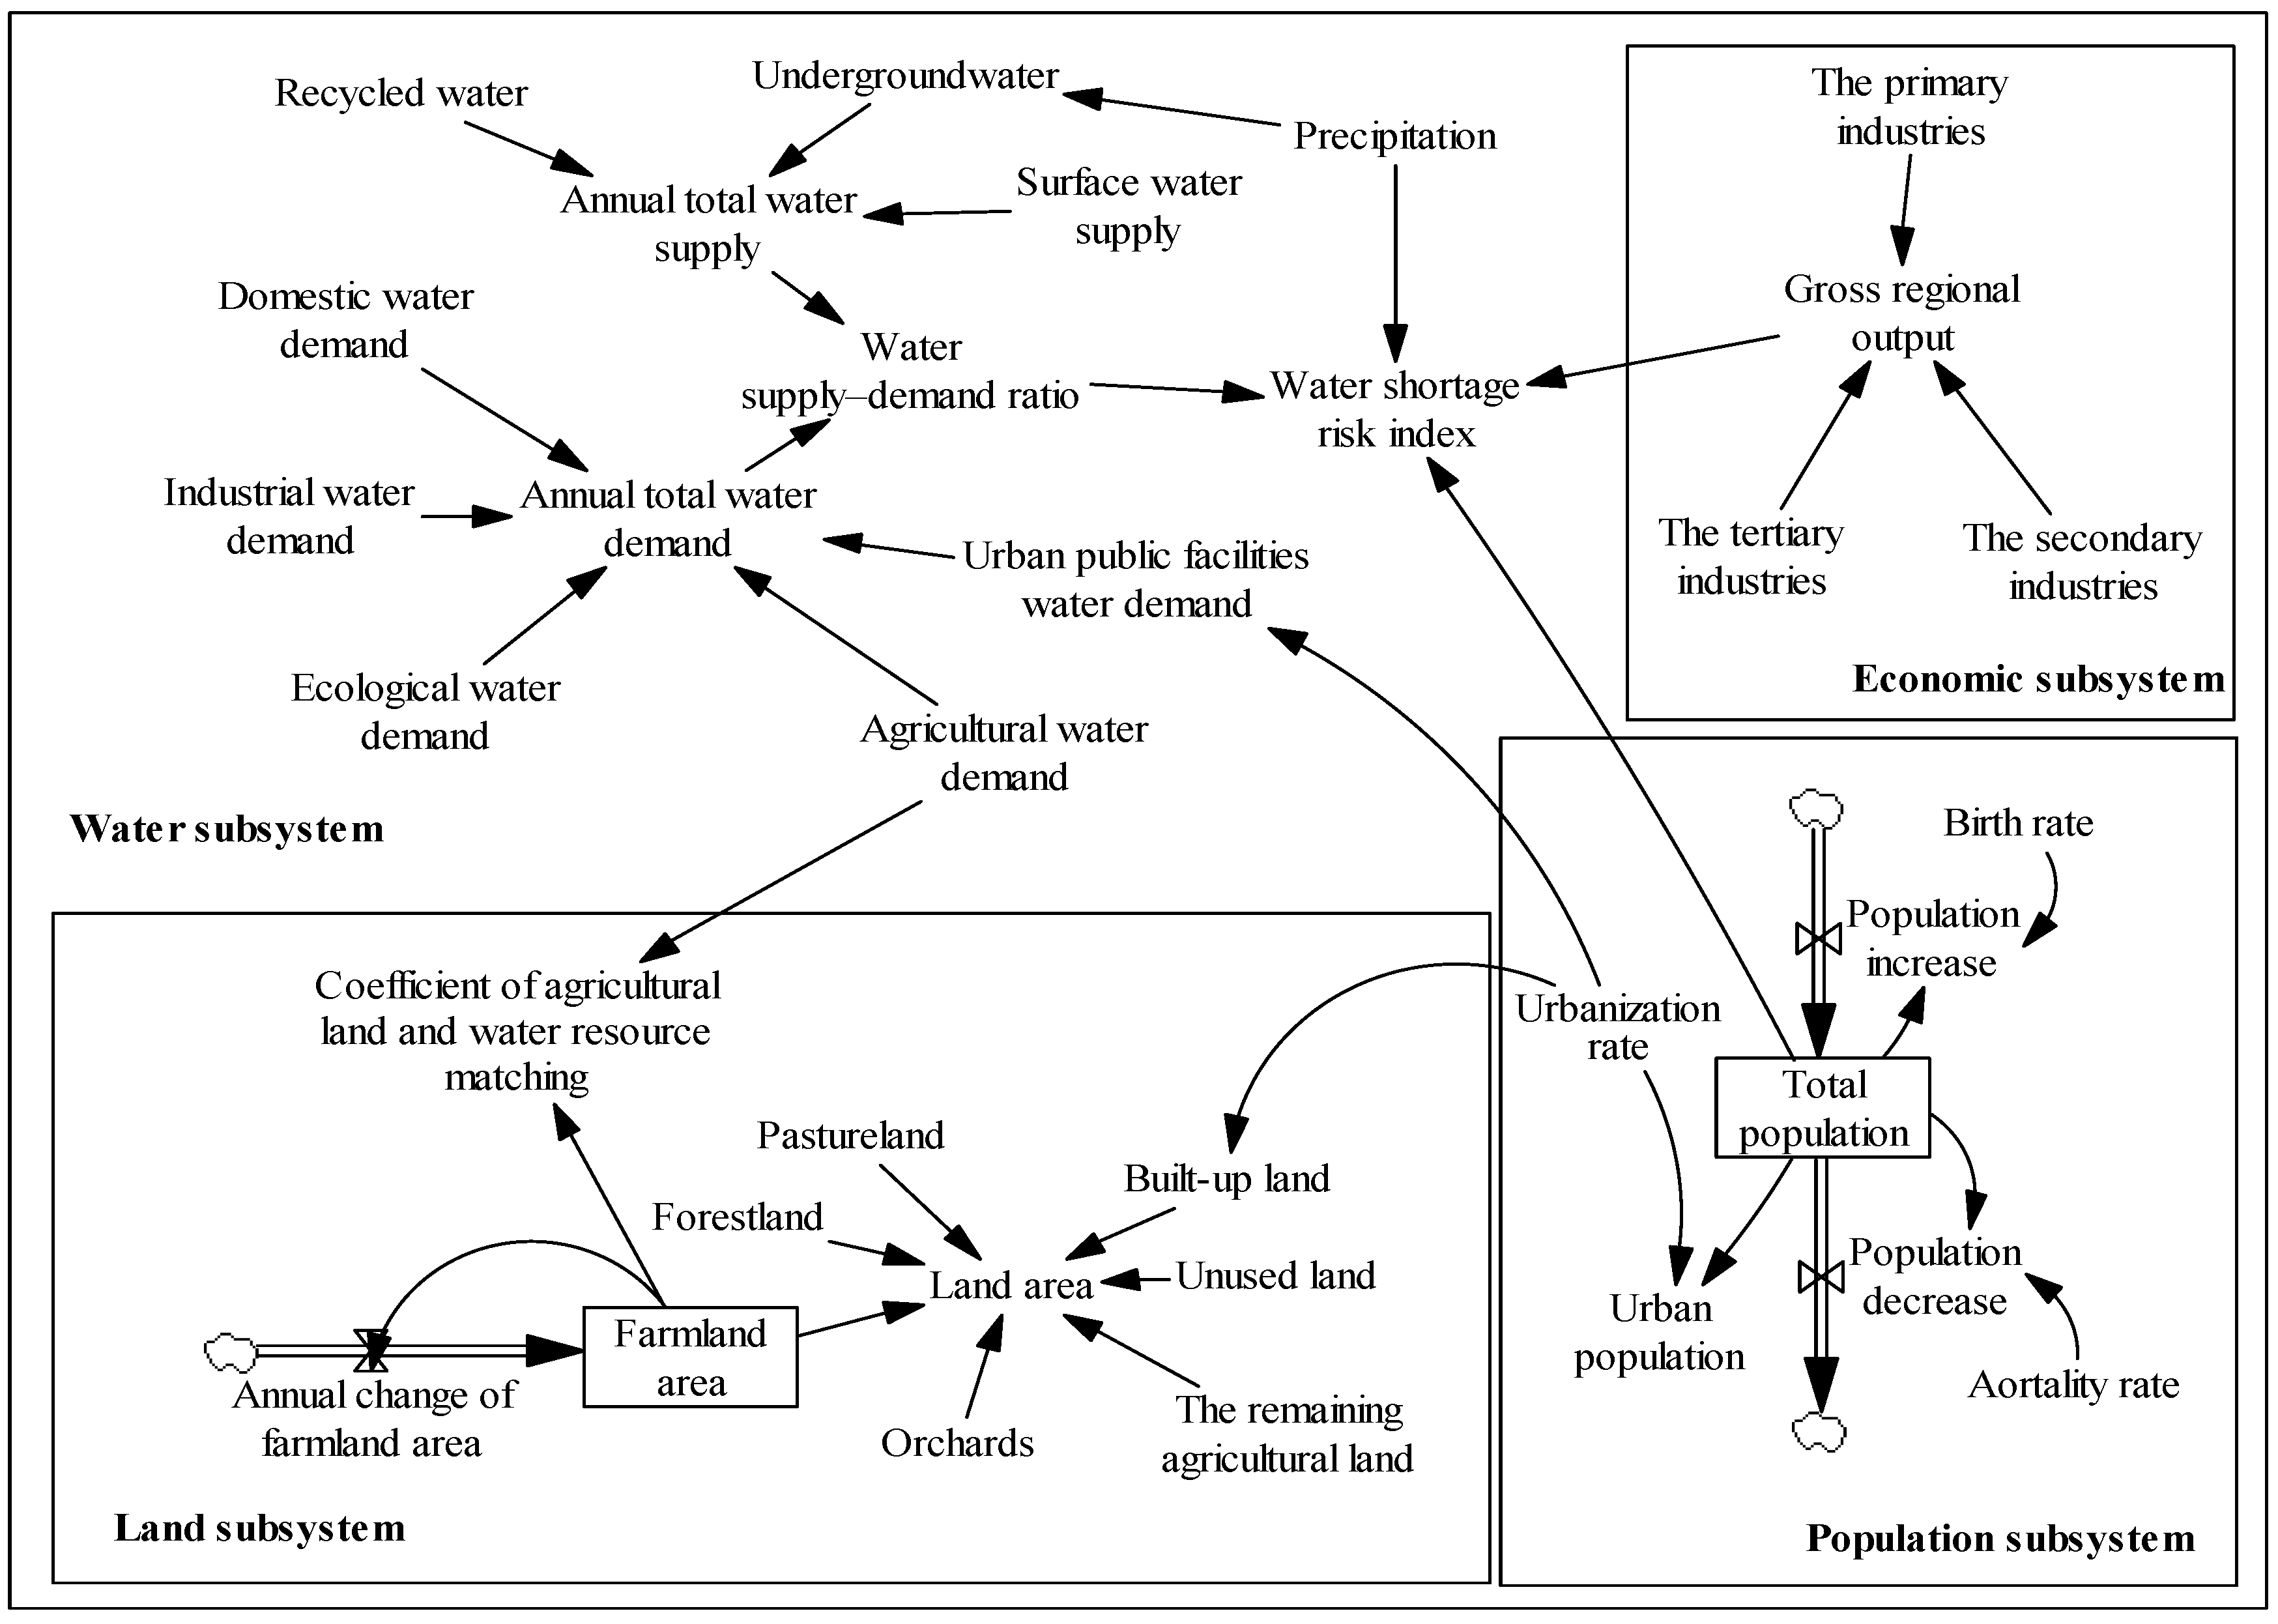
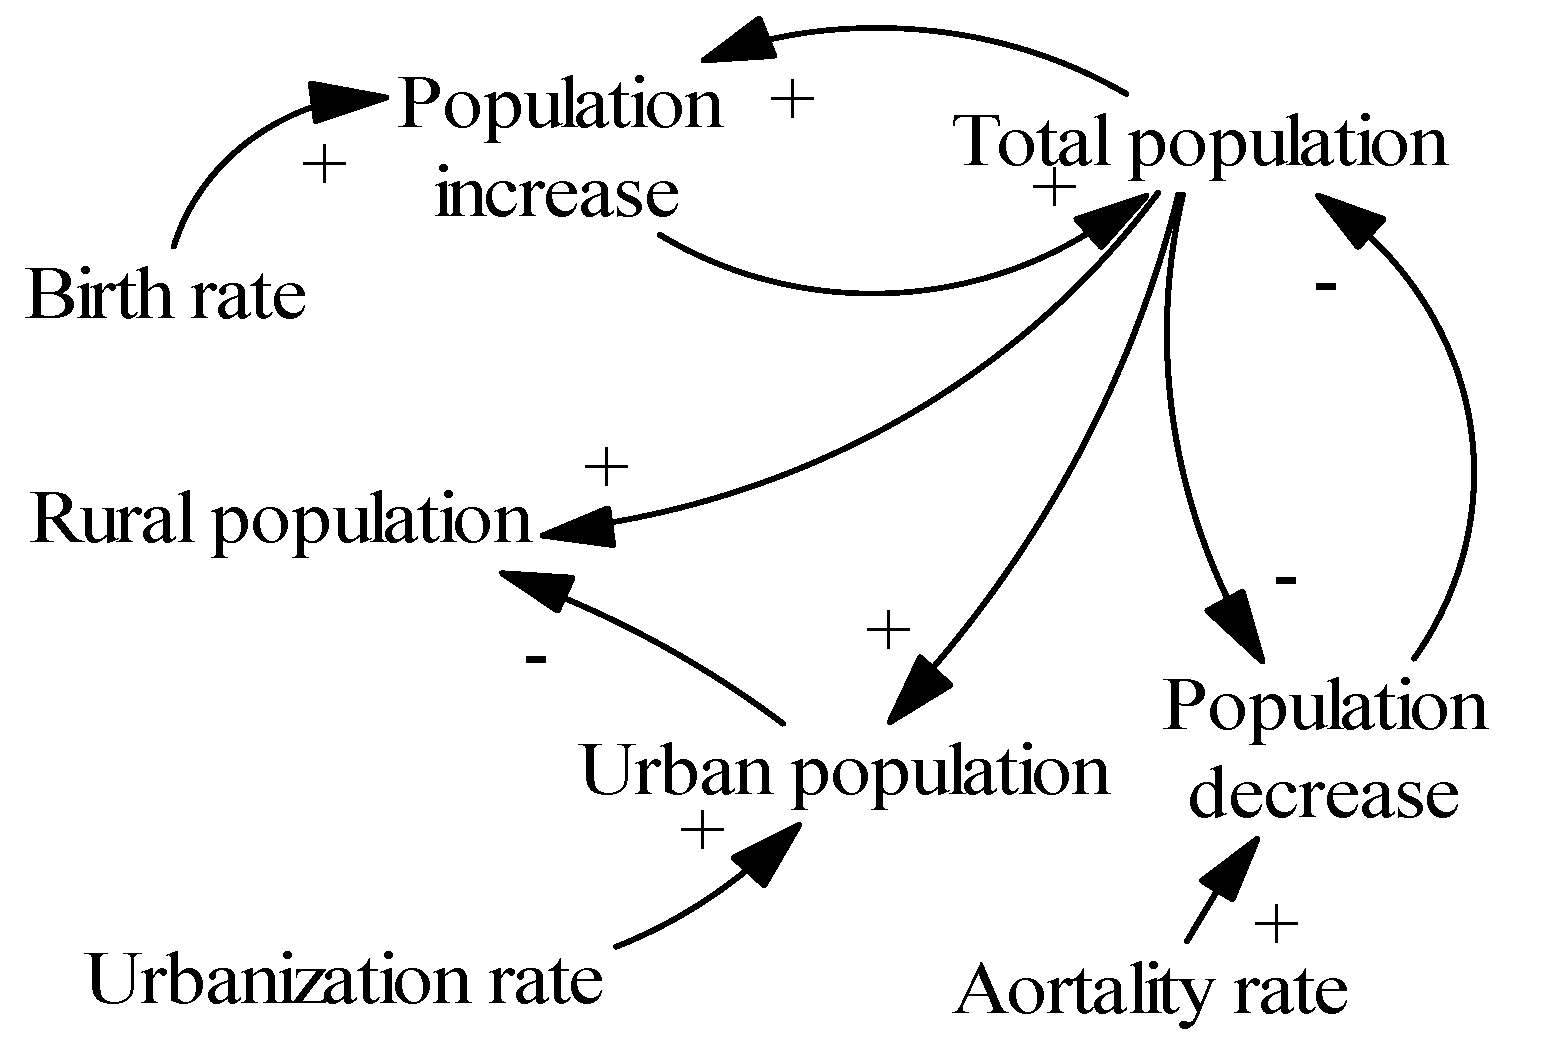
3.1. System Dynamics

System dynamics has enormous advantages for the analysis of complex dynamic feedback systems. This advantage makes it widely used in nature, resources, society, engineering, and other fields, and its application requires software support. With the development and popularization of computer technology, system dynamics software has been greatly improved. From many versions of the software, this study selected Vensim-DSS, which was developed by Ventana Corporation in the United States. This software can set the flowchart, the writing equation, the feedback loop analysis, and the output graph form. This study used Vensim to model the simulation flowchart and used the Equations function to assign calculation equations and parameters to various variables, and then used the Run a Simulation function to express the changes in each variable in the form of a chart. Additionally, structural analysis and data set analysis of the model were performed, and the changes in other characteristic variables were observed by changing one of the variables; the operating results were compared to provide a comprehensive analysis of the plan.

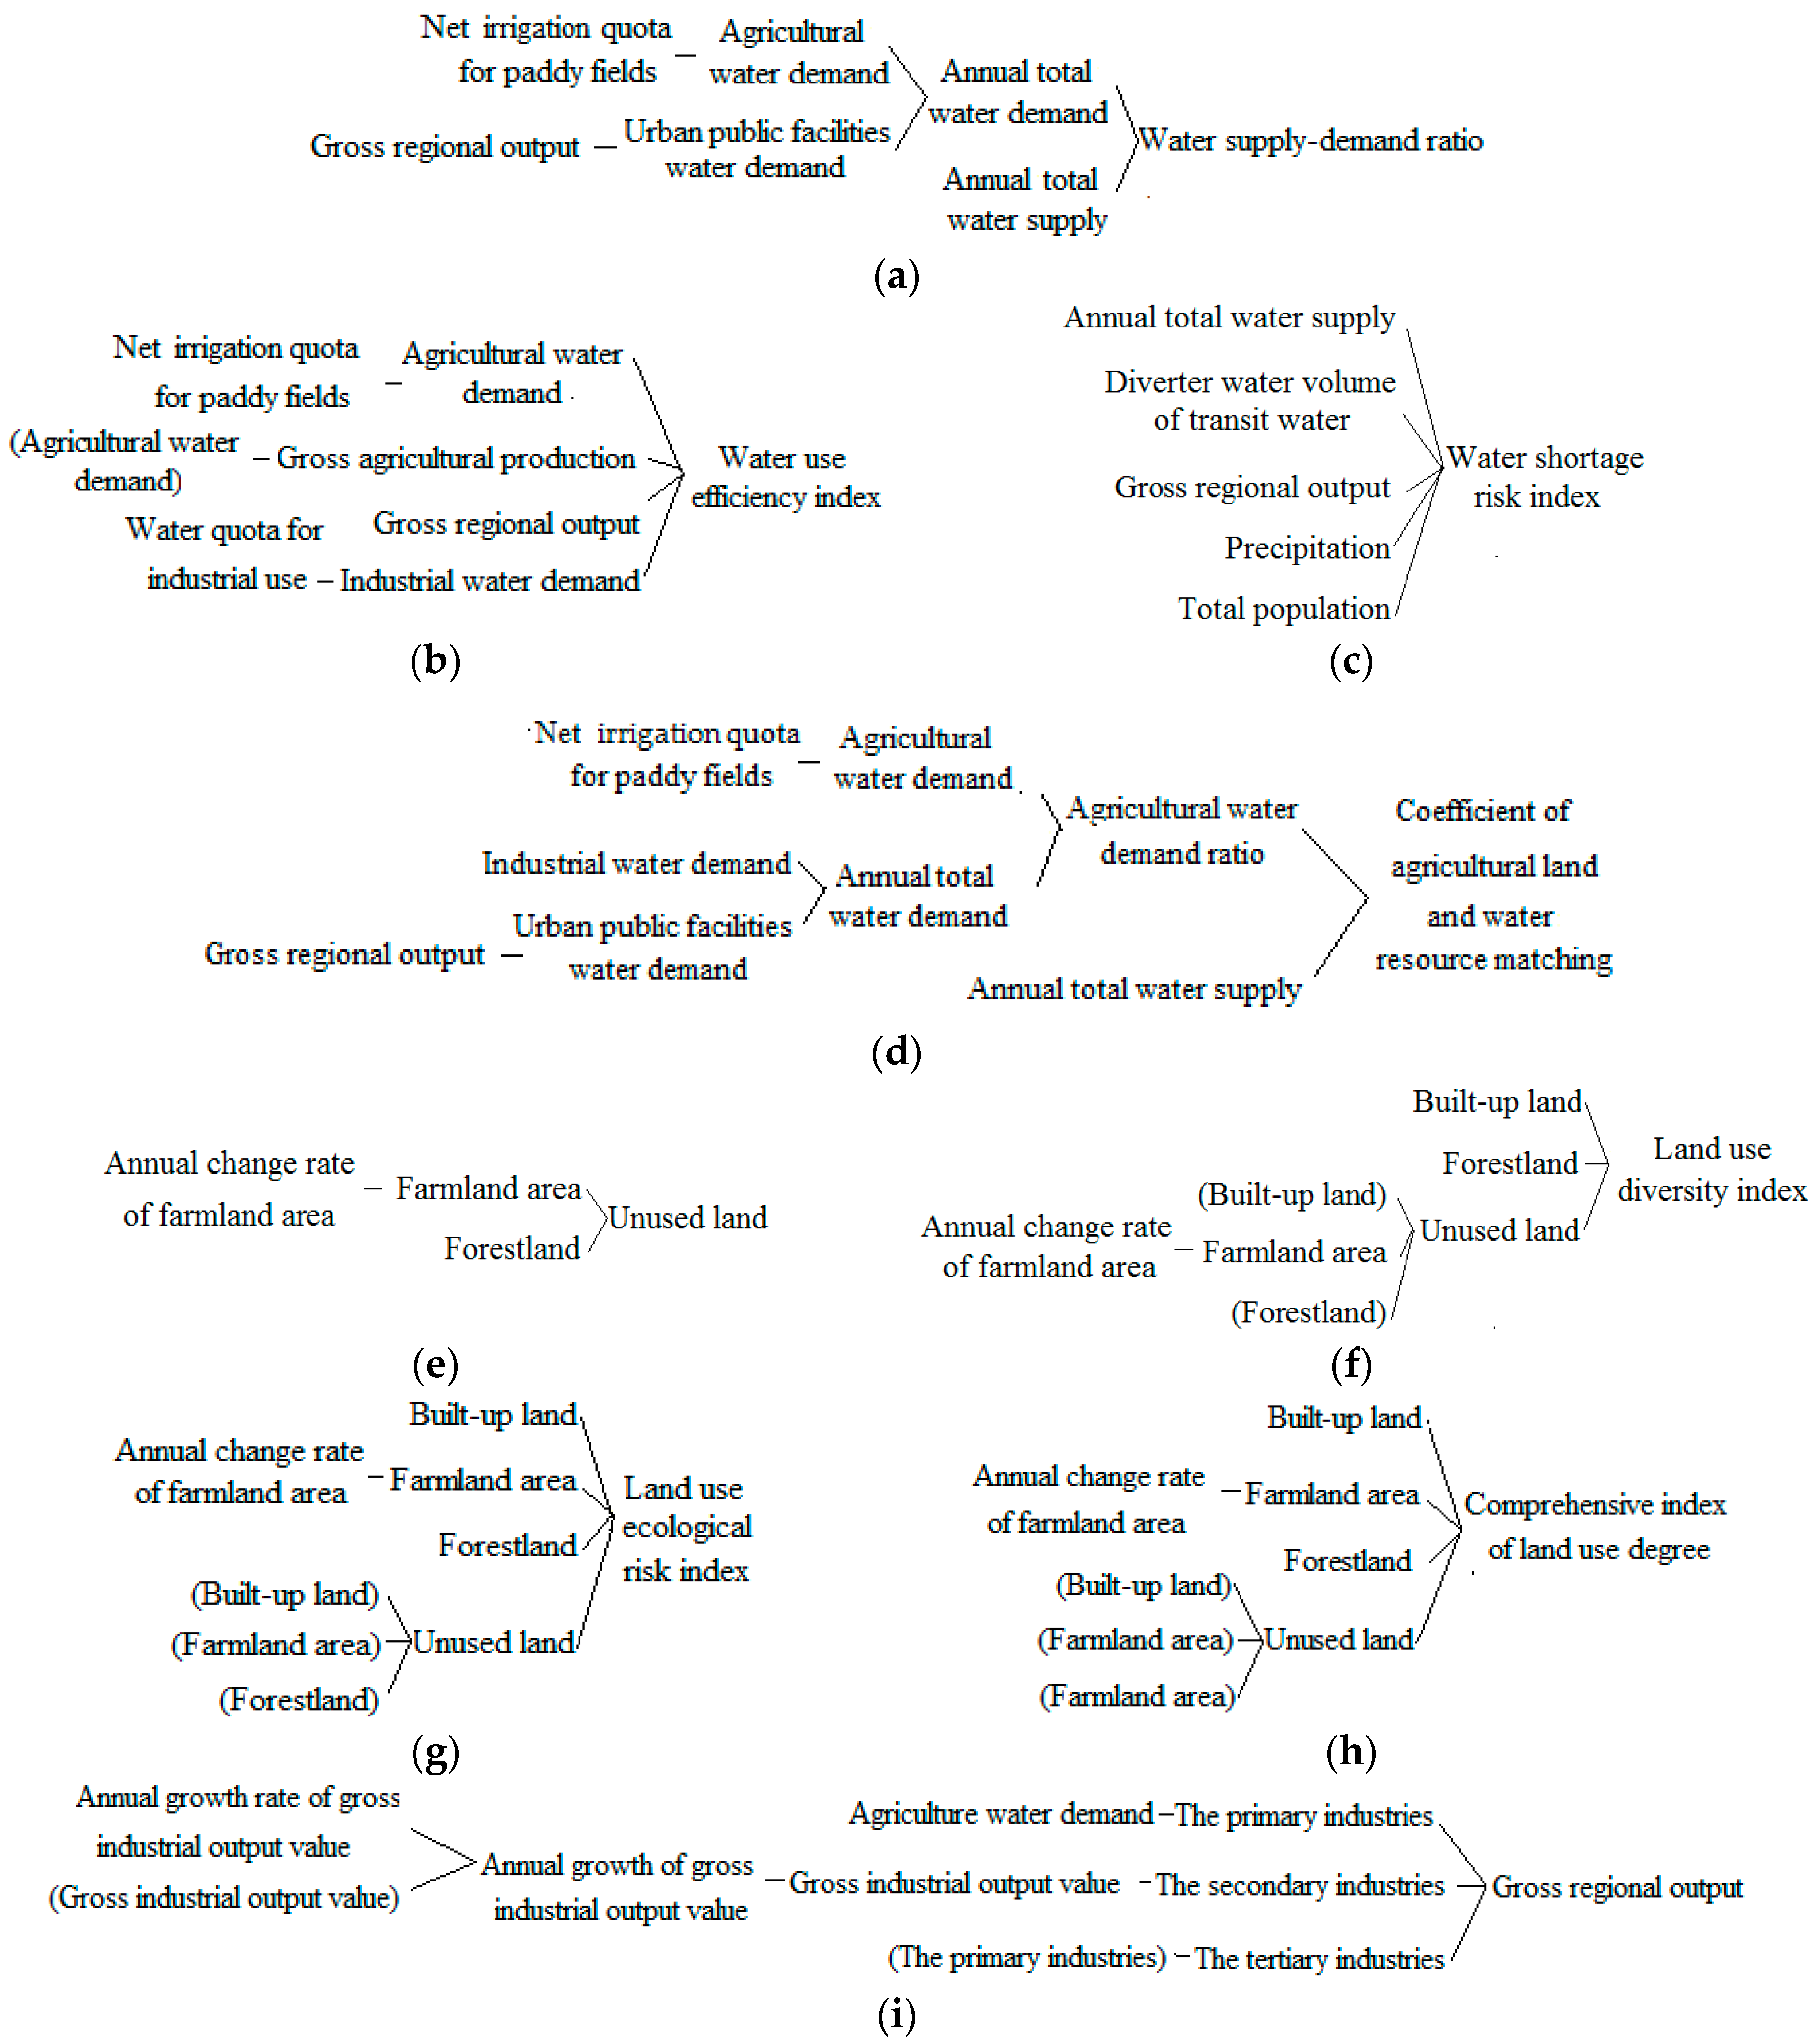
3.2. Constructing the Model

To analyze and predict the evolution of the land and water resources in Heilongjiang Province, this study built an SD model (Figure 2) including four subsystems: a population subsystem, water subsystem, land subsystem, and economic subsystem. The study time ranges from 2000 to 2030 with 1 year as the time step. The historical years range from 2000 to 2015, and the planning years range from 2016 to 2030. Four subsystems were also introduced in the model: the population subsystem, land subsystem, water subsystem, and economic subsystem. The subsystem interconnection overview is shown in Figure 2, and the workflow with more details of the subsystems is given in Figure 3, Figure 4, Figure 5 and Figure 6.
The population size and structure of the population subsystem are the main driving forces for regional water consumption and land use type conversion. For example, facing the expansion of urban population, the government needs to convert farmland and unused land to built-up land or to reduce the water supply for agricultural land to meet the water demand in urban areas (Figure 3). The parameter that determines the population size and structure is total population, which is calculated using Equation (1)
Total populationt+1 = Total populationt + Population increaset − Population decreaset
In the water subsystem (Figure 4), the key variable is the water supply–demand ratio, i.e., the ratio of annual total water supply to annual total water demand; the annual total water supply and annual total water demand are presented as follows:
Annual total water supply = Surface water supply + Groundwater + Recycled water
Annual total water demand = Agricultural water demand + Industrial water demand + Ecological water demand + Domestic water demand + Urban public facilities water demand
To quantitatively evaluate the status quo of the region’s water resources, this paper introduced characteristic variables (such as the water shortage risk index (WSRI), water use efficiency index (WUI), and coefficient of agricultural land and water resource matching (CA)) into the water subsystem.
The water shortage risk index depends on a range of factors, as in Equation (4) [14].
WSRI = Pr ecipitation   coefficient × Total   population × Gross   region   output Annual   total   water   supply + Diverter   water   volume   of   transit   water
The water use efficiency index reflects the region’s water use efficiency and its water-saving potential, which is calculated using Equation (5) [15].
WUI = Gross   agriculture   output Gross   region   output × Agriculture   water   demand   ratio + Gross   industry   output Gross   region   output × Industry   water   demand   ratio Agriculture   water   demand   ratio + Industry   water   demand   ratio
The coefficient of agricultural land and water resource matching represents the matching of the region’s agricultural land and water resources, as in Equation (6) [16].
CA   = Annual   total   water   supply × Agricultural   water   demand   ratio Farmland   area
The land subsystem (Figure 5) divides the region’s land area into seven land use types: farmland, orchards, built-up land, forestland, the remaining agricultural land, pastureland, and unused land. Unused land is determined by the other land use types, as shown in Equation (7)
Unused land = Land area − Orchards − Built-up land − Forestland − Pastureland − Farmland area − The remaining agricultural land
The structure of land use is determined by many factors. Therefore, this paper introduces characteristic variables, such as the comprehensive index of the land use degree (CILU), land use diversity index (LUDI), and land use ecological risk index (LUERI).
The comprehensive index of the land use degree measures the land use degree level and the effects of interactions between humans and nature, which is calculated using Equation (8) [17].
CILU = Unused   land + 2 × ( Forestland + Pastureland + Waters ) + 3 × ( Orchards + Farmland   area ) + 4 × Built - up   land Land   area
The land use diversity index represents the diversity of land use types, as shown in Equation (9) [18].
LUDI   =   i = 1 7 ( Land   use   type   area × log 2 ( Land   use   type   area ) )
There are seven land use types: farmland, orchards, built-up land, forestland, remaining agricultural land, pastureland, and unused land.
The land use ecological risk index represents the size and degree of damage caused to land when ecological disasters occur, which is calculated using Equation (10) [19].
LUERI = i = 1 7 Land   use   type   area × W i Land   area
Wi is the ecological risk intensity parameter for the ith land use type, which can be found in Reference [19].
An economy subsystem is crucial to analyze the regional development. This study used the gross regional output to measure the regional development level (Figure 6). The gross regional output is shown in Equation (11).
Gross regional output = The primary industries + The secondary industries + The tertiary industries
Without water-saving measures, economic growth always leads to an increase in water demand. Considering the province’s agricultural and industrial development status quo, government may manage its water demand by reducing the water use per gross regional output unit.

3.3. Data Sources

The historical data of the variables in the model were obtained from the China Statistical Yearbook [20] and Heilongjiang Statistical Yearbook [21]. The planning year data were obtained from the country and region’s government documents, such as the Thirteenth Five-Year Plan of Heilongjiang Province [22] and the Comprehensive Land Use Planning of Heilongjiang Province [23]. The base year data on the development and use of land and water resources are the same as the status quo.

4. The Simulation Model and Results Analysis

Considering the impact of future climate scenarios on land and water resources [24,25,26], this study introduced three climate types (i.e., arid, humid, and normal) into the SD model (Vensim DSS software, Ventana Systems Inc, Wiltshire, UK). These climate types were based on precipitation data series from 1965 to 2015 to represent different climate types. An arid climate has a minimum precipitation of 382.9 mm (in year 2001); a normal climate has an average precipitation of 518.6 mm; and a humid climate has a maximum precipitation of 691.7 mm (in year 2013).

4.1. Model Testing

This work used historical data to test the precision and accuracy of the simulation (see Table 1). Comparing the predicted with the actual values, it can be seen that the difference is within ±10%; the relative errors are small. The simulation result can represent the actual situation. Therefore, the model can be used to predict the evolution of the land and water resource system in Heilongjiang Province.

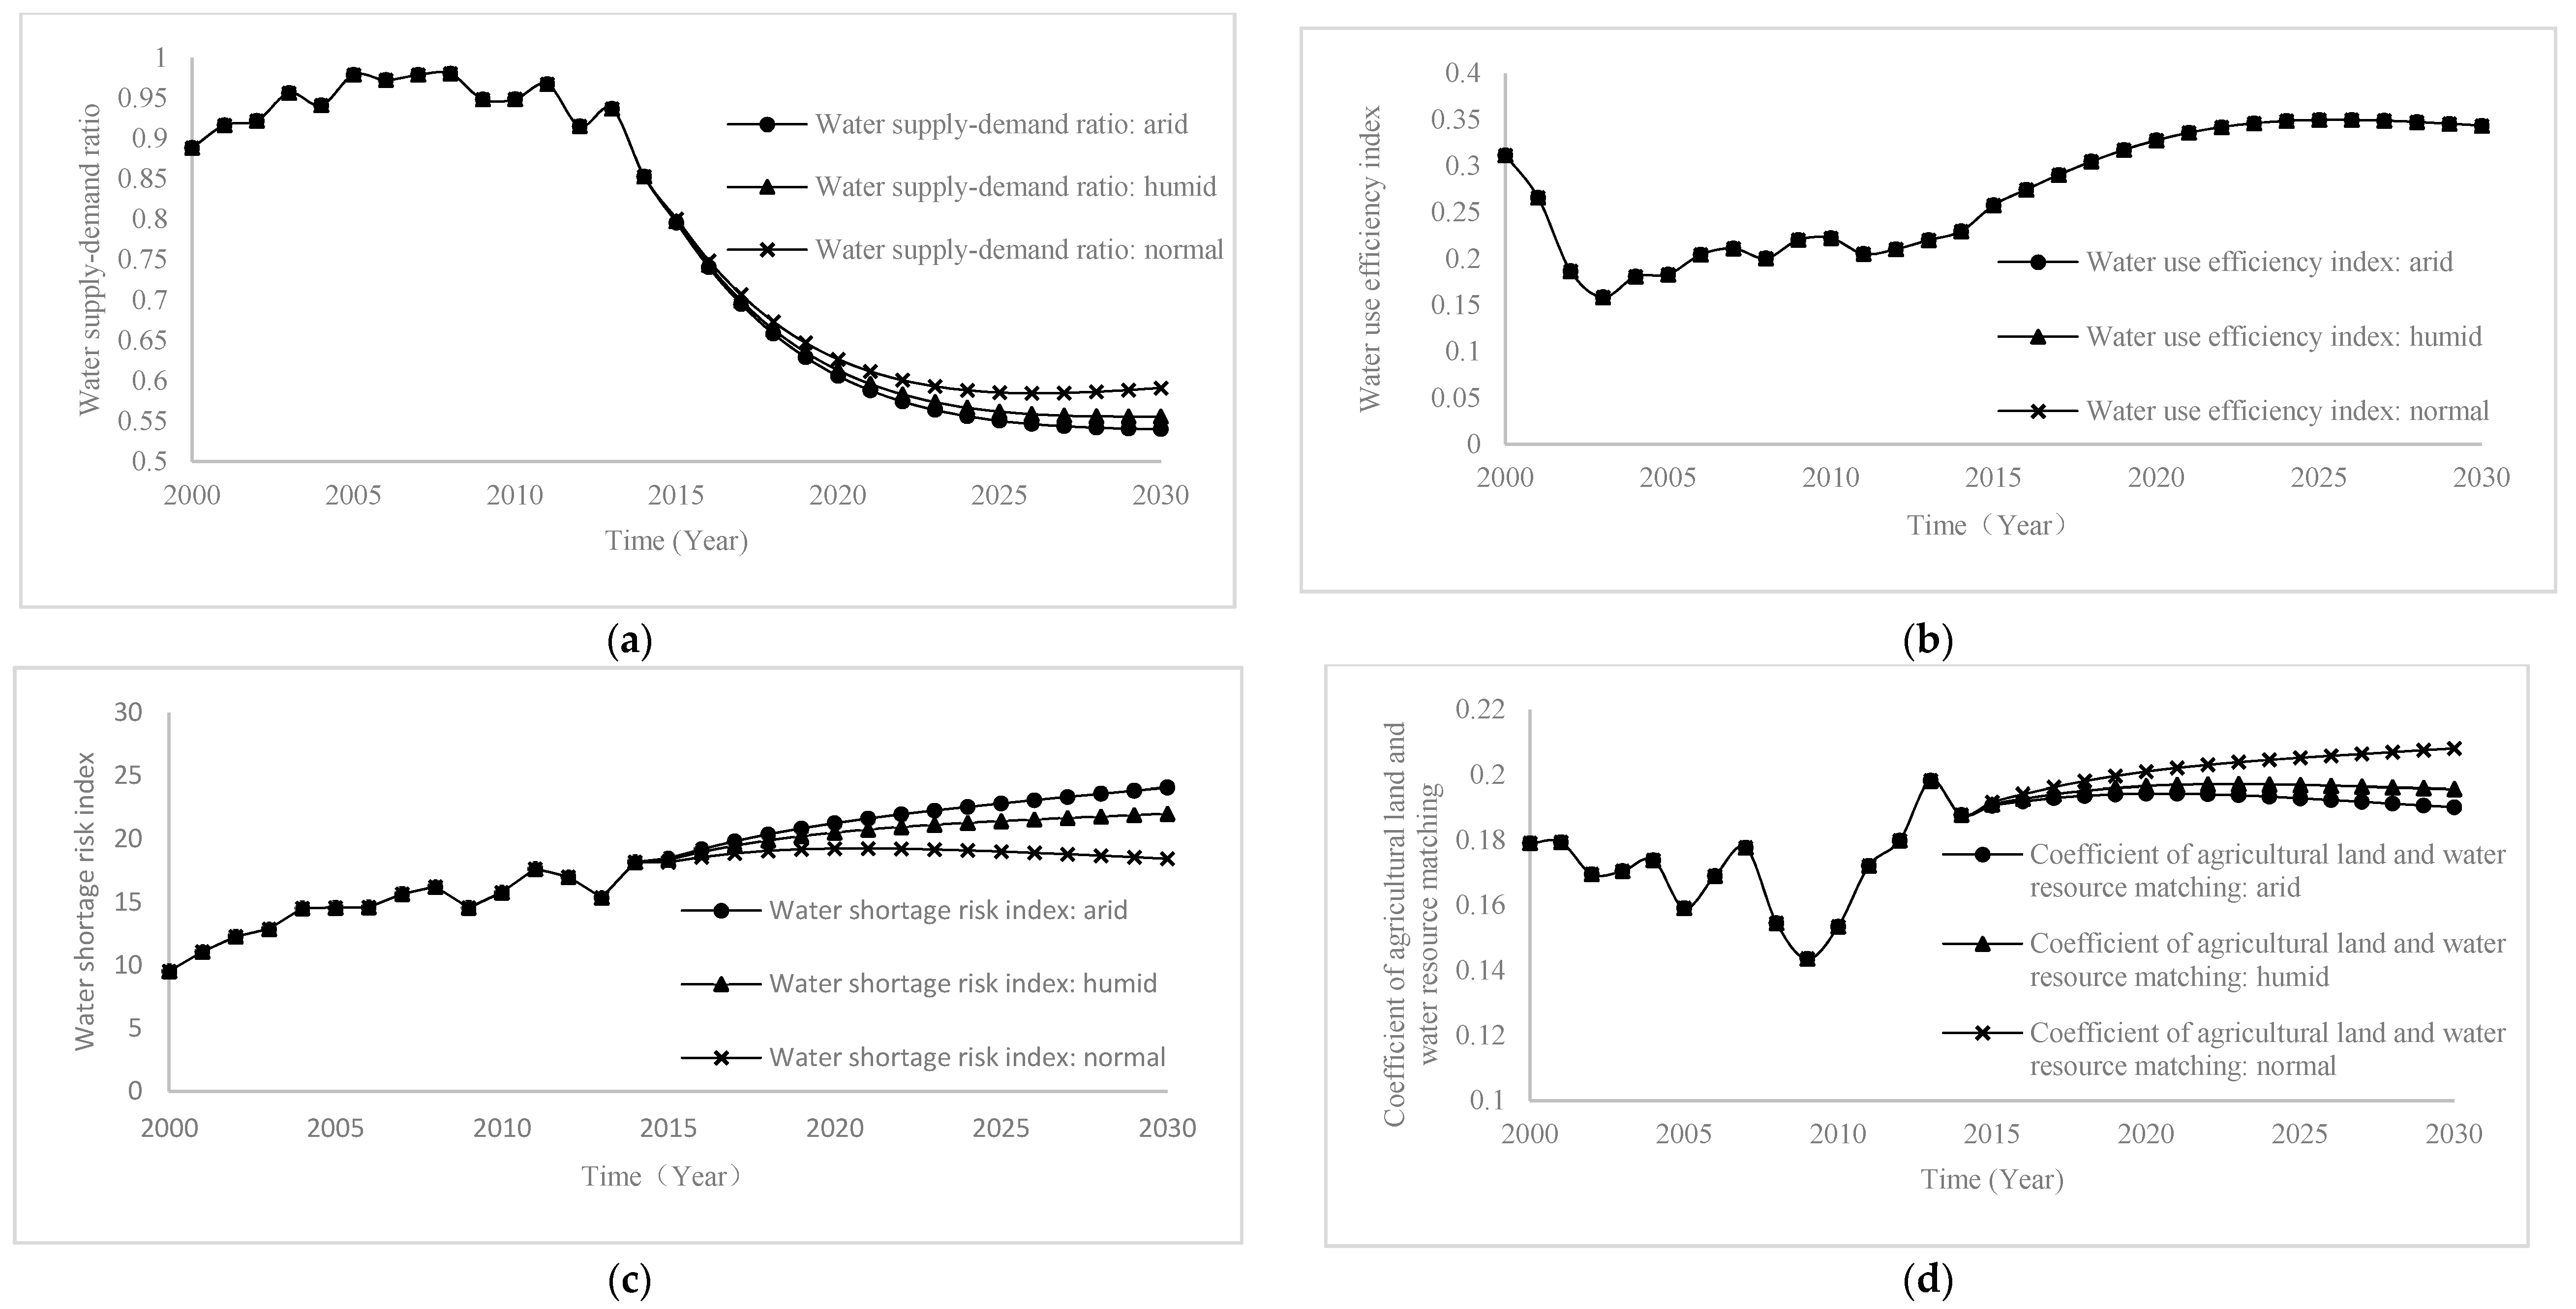
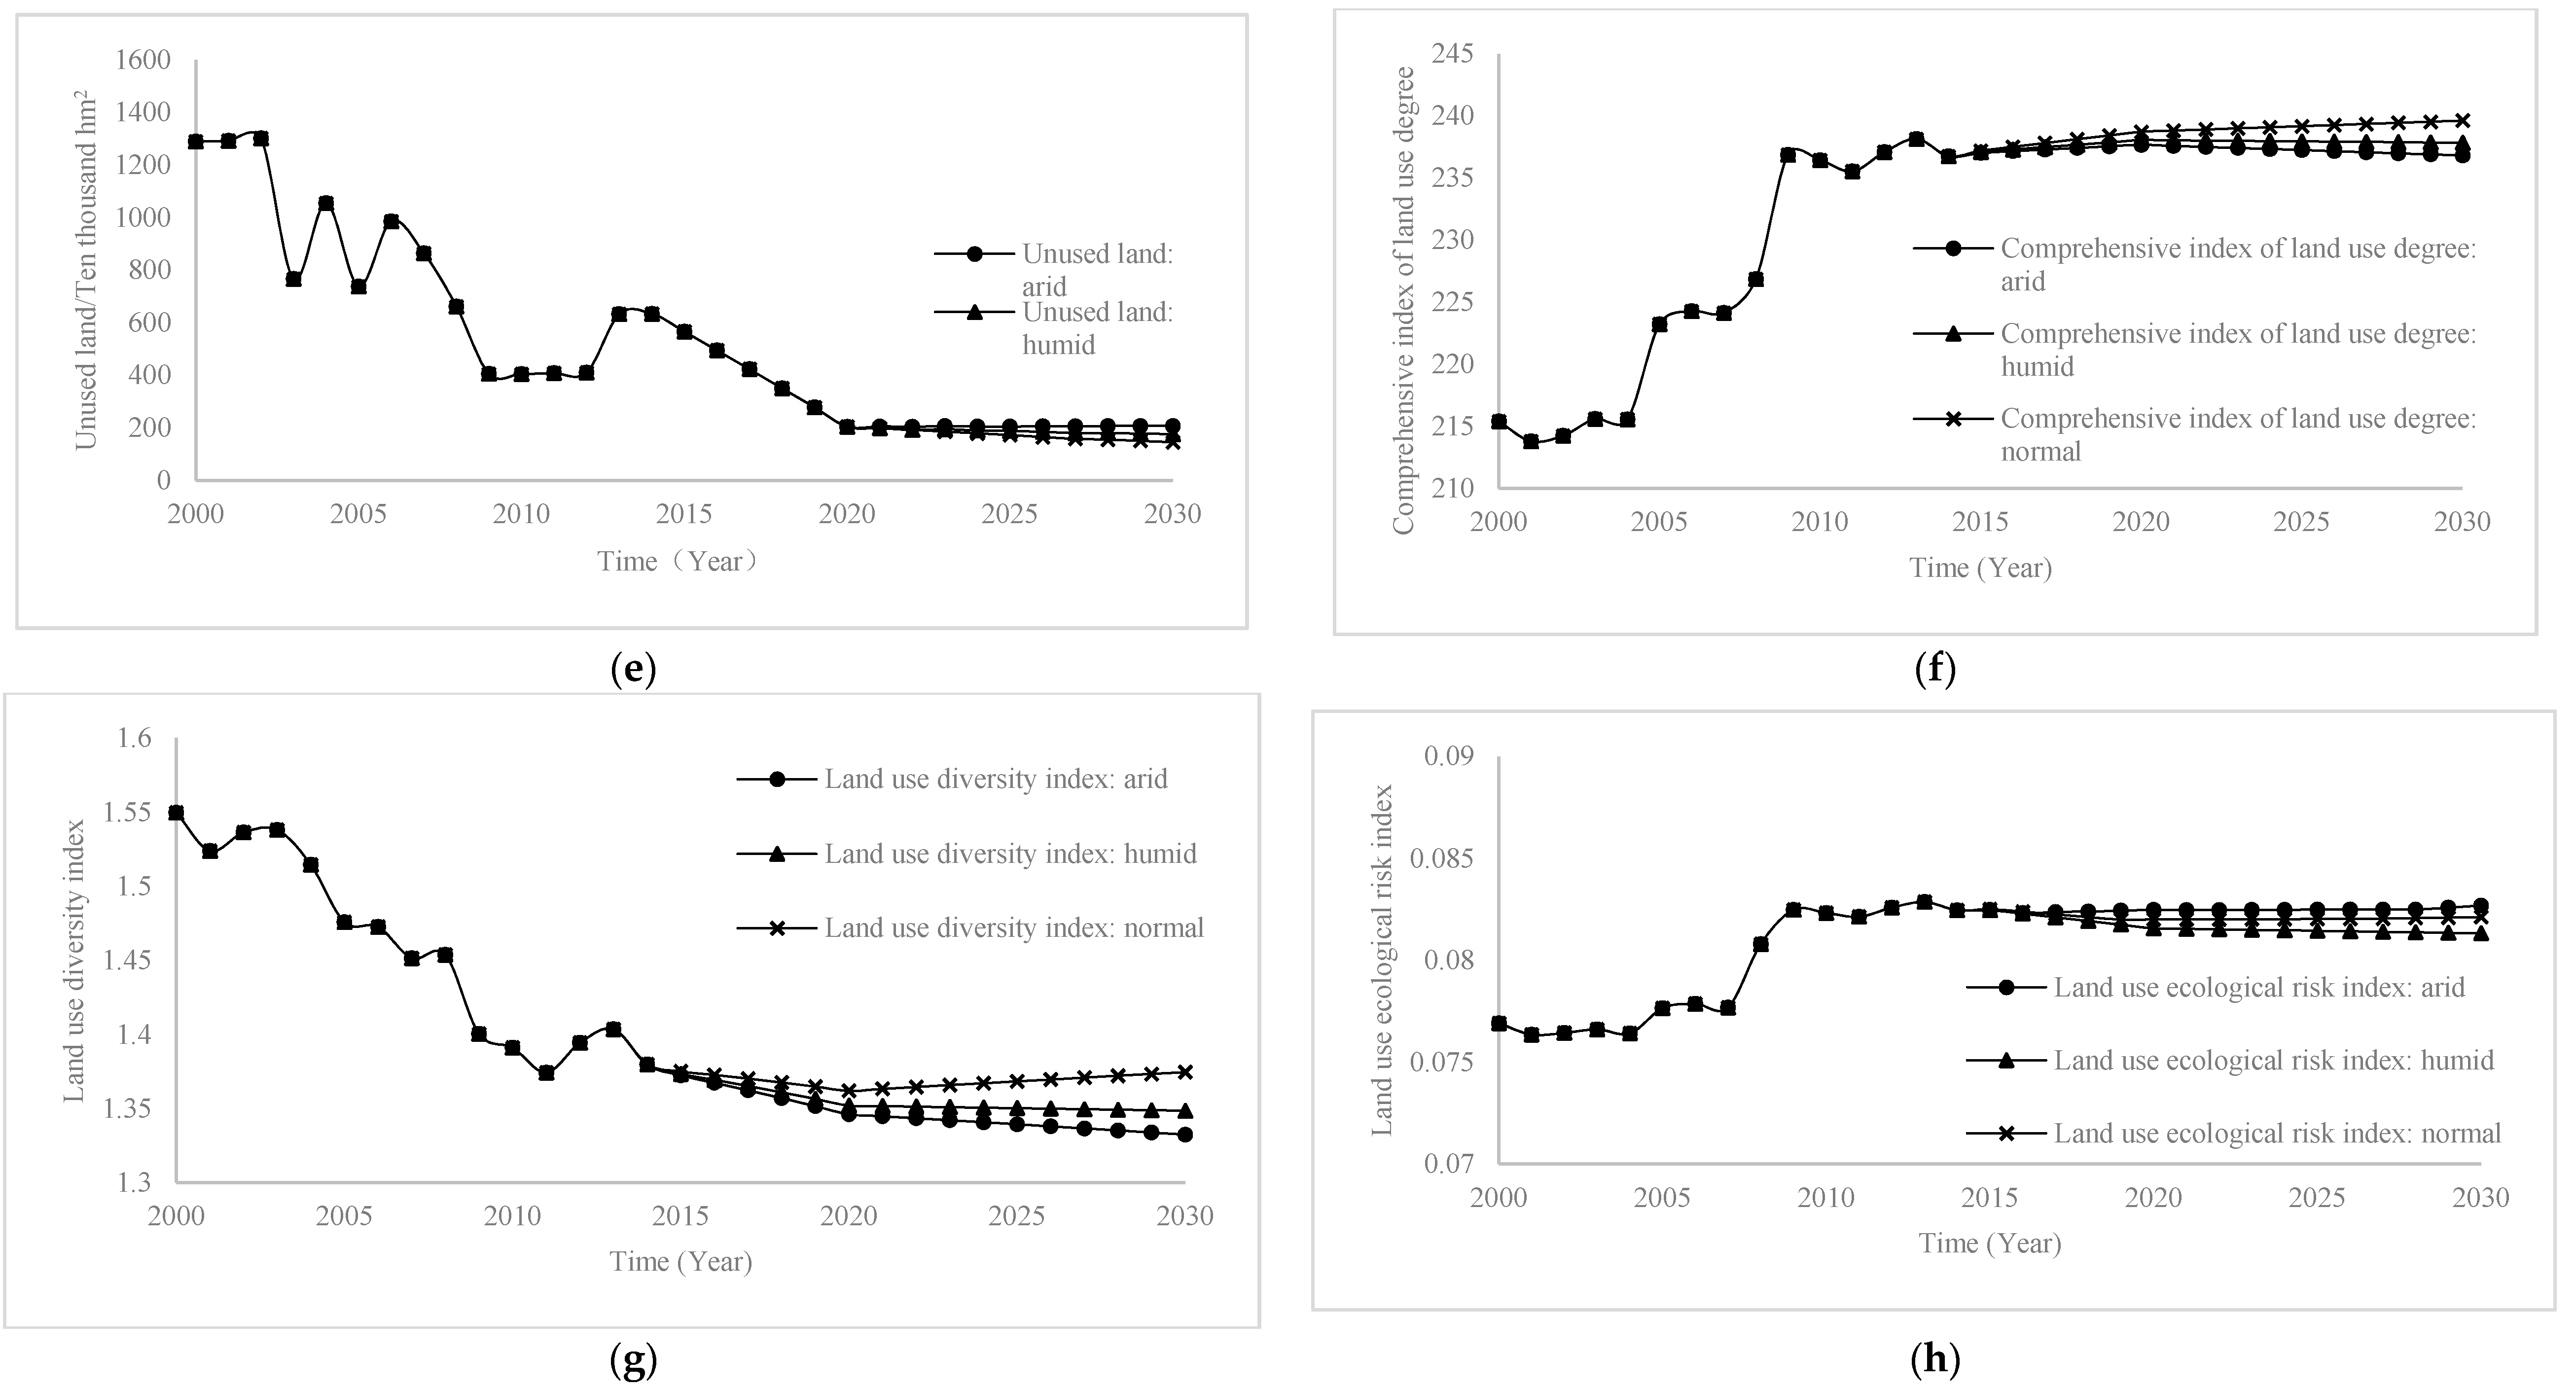
4.2. Simulating the Evolution of the Land and Water Resource System under Different Climates

This study used precipitation to separate different climates (i.e., arid, humid, and normal) (Figure 7). Some variables changed dramatically over time (i.e., water supply–demand ratio, water shortage risk index, coefficient of agricultural land and water resource matching, unused land area, degree index, diversity index, and ecological risk index), while the water use efficiency index did not change much.
From Figure 3, it can be seen that the unused land area and water supply–demand ratio both declined under different climates. Under the humid climate, the ecological risk index and water shortage risk index tend to decrease, while the coefficient of agricultural land and water resource matching, degree index, and diversity index increase slightly. However, under other climates, the ecological risk index and water shortage risk index tend to increase, while the coefficient of agricultural land and water resource matching, degree index, and diversity index tend to decrease.
Therefore, even under the most optimistic condition (i.e., humid climate), the declining trend of the unused land area and water supply–demand ratio will not stop if the current land and water use patterns continue. Moreover, the land and water resources may face various challenges (e.g., ecological risk, shortage risk, mismatching, low efficiency and diversity) unless the humid climate continues in the future. Therefore, the region may face the inevitable crisis of land and water resource shortages unless it improves its current land and water use patterns.

4.3. Simulation of the Land and Water Resource System under Different Scenarios

The combination of different climates and resource use patterns can make the land and water resource system evolve in different directions. Although the future is uncertain, the overall direction will still achieve the desired goals.
The Thirteenth Five-Year Plan of Heilongjiang Province pointed out the following: Heilongjiang Province should have an advantage, focus on industry, optimize and upgrade the industrial structure and ownership structure; accelerate artificial afforestation, build a national reserve forest base; and improve the effective coefficient of irrigative water utilization for farmland. The Comprehensive Land Use Planning of Heilongjiang Province pointed out that Heilongjiang Province should adhere to the most stringent farmland protection system, strictly protect basic farmland; increase the supply of farmland; strictly protect forestland, prohibit deforestation; actively develop water conservancy projects; and promote water-saving and drought-resistance technologies. Considering the possible temperature rise due to global warming, this study used the arid climate as an example to adjust the variables within each subsystem according to the regional development plan to simulate the setting of land and water resource-use strategies under different scenarios.

4.3.1. The Subsystems’ Variable Selection and the Scenarios

In the water subsystem, reducing the water quota for industries can reduce the overall water demand, and the factors influencing the annual total water demand can be examined (Figure 8). As the figure shows, the trend of the annual total water demand matches that of the water demand for paddy fields. Therefore, the net irrigation quota can be used for paddy fields to manage the water quota for agricultural use. Furthermore, the region should also introduce advanced water-saving technologies to properly reduce the water quota for industrial use.
In the land subsystem, inappropriate land development may result in a decrease in the unused land area, the diversity index, and degree index but an increase in the ecological risk. Forestland accounts for the largest area of Heilongjiang Province, followed by farmland. Considering the importance of forestland and farmland, the region may effectively control the region’s land development by controlling the conversion between the two land use types. Through the annual change rate of farmland area in the land subsystem, the government can control the conversion between forestland and farmland.
In the economic subsystem, this paper uses the gross regional output to represent the region’s economic situation. Heilongjiang is largely an agricultural province and part of the industrial base of the country. Since agriculture is the region’s base industry, changing agricultural land use types may lead to social chaos. Therefore, this study adjusted the region’s economic factors without changing anything in the agricultural industry. This model adjusted the annual growth rate of the gross regional output to evaluate its impact on the gross regional output and the land and water resources.
Based on the above analysis, this work selected the net irrigation quota for paddy fields, the water quota for industrial use, forestland area, annual change rate of farmland area, and annual growth rate of gross industrial output value to set different scenarios within a reasonable range, according to government programs at the planning horizon, to simulate the evolution of the land and water resource system in the planning years. This model also considered the province’s existing problems and socioeconomic development status quo with respect to land and water resources to set the planning years’ conditions. In Scenario 1, the model reduced the net irrigation quota for paddy fields and the water quota for industrial use, given the implementation of water-saving techniques. In Scenario 2, the model adopted the policy of returning farmland to forestland. In Scenario 3, the model converted an appropriate amount of forestland to farmland. In Scenario 4, the model adopted development policies to boost economic growth. In Scenario 5, the model slowed the economic development rate. There is more literature on setting different scenarios [27,28,29,30,31,32,33], and Table 2 shows the details used when setting each scenario in this paper.

4.3.2. Simulations under Each Scenario

This model simulated the evolution of the land and water resource system for an arid climate under different scenarios to predict the change range of variables compared with the status quo in 2030 (Table 3).
In Scenario 1, the model decreased the area’s water use for agricultural and industrial use, given advanced water-saving technologies, and thus increased the water supply–demand ratio, reduced the water shortage risk index, and increased the water use efficiency. This scenario has a more effective impact on the water subsystem but a less effective impact on the land subsystem.
In Scenario 2, the model slowed the development rate of unused land by adopting the policy of returning farmland to forestland and thus reduced the ecological risk index and increased the coefficient of agricultural land and water resource matching. However, the land use diversity and comprehensive land use degree indices decreased. This means that the policy of returning farmland to forestland can reduce the adverse effects of ecological disturbance, but this scenario may decrease the land use type and land use degree. Therefore, this scenario has a more effective impact on the land subsystems but a less effective impact on the water subsystem.
In Scenario 3, the model converted forestland to farmland and thus increased the land use diversity and degree indices. However, the ecological risk index increased, and the coefficient of agricultural land and water resource matching decreased. Therefore, this scenario has a more effective impact on the land subsystem but a less effective impact on the water subsystem.
In Scenario 4, the model greatly boosted the regional economy. From Table 3, it can be seen that emphasis on economic development can lead to an increase in water demand for economic use, thus decreasing the water supply–demand ratio, increasing the water shortage risk, and decreasing the coefficient of agricultural land and water resource matching. This scenario has a more effective impact on the water subsystem but a less effective impact on the land subsystem. It emphasizes economic growth but neglects the region’s sustainable development.
In Scenario 5, the model decreased the economic development rate. Table 3 shows that decreasing the economic development rate can increase the water supply–demand ratio, reduce the water shortage risk, and increase the coefficient of agricultural land and water resource matching. This scenario has a more effective impact on the water subsystem but a less effective impact on the land subsystem. Furthermore, this scenario can greatly increase the environmental and ecological benefits while reducing the economic benefits.
From the above analysis, it can be seen that no single scenario can improve regional land and water resources in all aspects. Each scenario has its merits and demerits. The region needs to balance and complement different measures to properly improve regional land and water resources. Comparing the scenario results, it can be seen that combining Scenarios 1, 2, and 5 can minimize the evolution risk of regional land and water resources. Table 4 shows the result of the combined scenario in 2030.
As shown in Table 4, the development of land and water resources is acceptable under the combined scenario. The unused land area and water supply–demand ratio both increased by over 20%; this relieved the declining trend of the land and water resources. In addition, the ecological risk index and water shortage risk index decreased by more than 5%. The water use efficiency index and coefficient of agricultural land and water resource matching also increased by more than 20%. Besides the quantitative improvement, the combined scenario also promoted quality improvement in the system’s sustainable development. However, a decrease in the ecological risk index usually results in a decrease in the diversity and degree indices. Since ecological damage may be irreversible, reducing ecological risk substantially but reducing land use diversity and degree appropriately within a manageable range may be a favorable approach for the system’s evolution. Therefore, the combined scenario can advance water-saving technologies, adopt the policy of returning farmland to forestland, and decrease the economic development rate to ensure the healthy evolution of regional land and water resources. This is the best plan to use the land and water resources in Heilongjiang Province.

5. Discussion

To discuss the reasons why different scenarios produce different simulation results for each variable, the Vensim software was used to analyze the characteristic variable tree (Figure 9) to analyze the details of the effects of each control variable. Because the “Gross regional output” variable has more appearances and it is a key variable of the economic subsystem, and the economic subsystem is closely related to the land and water subsystem, the “Gross regional output” variable tree is drawn separately.
Considering that the “Gross regional output” variable is directly affected by the “Annual growth rate of gross regional output” variable, it is also influenced by the “Agriculture water demand” variable. Because the “Water use efficiency index” and the “Agriculture water demand” variable is affected by the “Net irrigation quota for paddy fields”, the tree containing the “Gross regional output” variable also includes the “Annual growth rate of gross regional output” and “Net irrigation quota for paddy fields.” Because the “Gross regional output“ tree appears in all of the characteristic variable trees in the water subsystem, the characteristic variable tree in the water resource subsystem includes the “Annual growth rate of gross regional output” and “Net irrigation quota for paddy fields” variables.
The “Annual change rate of farmland area” and “Forestland” variables appear in all characteristic variables of the land subsystem tree, so controlling the conversion between farmland and forestland can directly affect the land resource subsystem, but there is little impact on water subsystems. The “Water quota for industrial use” variable appears in the “water use efficiency index” tree, which shows that increasing industrial water-saving technologies can effectively increase the water use efficiency and water-saving potential. The “Net irrigation quota for paddy fields” and “Annual growth rate of gross regional output” variables appear in the characteristic variable tree in the water resource subsystem. These two variables have a direct impact on the water subsystem but do not directly affect the land resources subsystem, so they have little effect on the land resource subsystem. In addition, “Net irrigation quota for paddy fields” has more appearances than the “Annual growth rate of gross regional output”, and it can be seen that the direct impact of the “Net irrigation quota for paddy fields” variable on the water subsystem is greater than that of the “Annual growth rate of gross regional output” variable.
Based on comparative literature, Hamid Balali et al. [23] used SD methods to simulate the groundwater dynamics to depletion under different economic policies and climate change and developed a model that can simulate a farmer’s economic behavior and groundwater aquifer dynamics, as well as studied area climatology factors and government economic policies related to groundwater. These authors concluded that climate change can affect the water system, and this study confirms that under conditions where climate and economic changes are difficult to predict, in addition to adopting comprehensive management policies, planning and the application of certain methods to control climate factors such as precipitation can achieve groundwater sustainable management effectively and can reduce the vulnerability of water resource systems. Janez et al. [34] used SD methods to analyze policy trends, incorporate socioeconomic factors into the integrated water system, and monitor the possible environmental and socioeconomic impacts by controlling key parameters to assess the potential impact of water shortages and socioeconomic policies in complex hydrological systems and to provide information for the formulation of regional water resources policies, further confirming the applicability of the SD approach for assessing the potential impact of various policies and measures on regional water systems. Tong et al. constructed a complicated coupling simulation system of water resources-land resources-social economy-ecology based on the method of system dynamics [26] and analyzed the regional land and water resources joint allocation plan, pointing out that in order to realize sustainable use of land and water resources, we should increase the intensity of agricultural water conservation and implement land consolidation, which coincides with the conclusions of this study. This study also points out that the construction of a comprehensive SD model of regional land and water should be combined with relevant hydrological and water environment models to realize accurate quantification research. The results of various studies confirm the applicability of SD in land and water systems and show that climatic factors also have a certain impact on regional land and water systems. In addition, advanced water-saving technologies, adoption of the policy of returning farmland to forestland, and decreasing the economic development rate can ensure the healthy evolution of regional land and water resources.

6. Conclusions and Future Research

  • Through establishing an SD model of the land and water resource system for Heilongjiang Province, this study analyzed the evolution of the system under different climates and concluded that the region faced a risk of supply and demand of land and water resources. This step clarified the problem and the direction of managing regional land and water resources.
  • This paper shows the evolution of regional land and water resources as a result of many driving forces. This study selected and adjusted the variables (i.e., net irrigation quota for paddy fields, water quota for industrial use, forestland area, annual change rate of farmland area, the annual growth rate of industrial gross) to set different scenarios. The model simulated the evolution and analyzed the results and then combined the favorable scenarios to predict the evolution of regional land and water resources in Heilongjiang Province. Through simulation under different scenarios, it can be seen that water-saving technologies can reduce water use, and the policy of returning farmland to forestland can reduce the ecological risk of land use. Decreasing the economic development rate can alleviate the pressure of water shortage. Combining these strategies can promote the healthy evolution of regional land and water resources in the region.
  • The SD model can simulate the dynamic relationships between the variables, as well as predict the response of the land and water resource system to climate change and relevant policies. However, this model has a limitation. Precipitation has a certain impact on the evolution of the system, but it is not accurate and is difficult to predict. Follow-up studies can introduce hydrological considerations into the SD method to reasonably predict precipitation.
This study provides a new perspective for the analysis of the land and water resource system. However, due to the complexity of the land and water resource system, there are still many issues that require further research.
  • The model is complicated. The land and water resource system is extremely complex and involves many factors. The research process is still uncertain and lacks mature theoretical research. In view of this, the SD model of land and water resources established by previous scholars can be summarized and analyzed, and the insufficiency of the land and water resource system model of this study can be improved to explore a multi-perspective comprehensive SD model of land and water resources that is suitable for regional conditions so that improved analysis and prediction of land and water resource systems can be achieved.
  • The method is simple. The system dynamics analysis method of the land and water resource system in this study is relatively simple, and the analysis result is one-sided. Therefore, in future research, scholars should focus on the complementary expansion of multiple methods and should seek a more reasonable multidisciplinary interactive system to achieve the qualitative and quantitative analysis of land and water resource systems and to obtain more comprehensive research results.

Author Contributions

Y.Z. designed the study, built the model and wrote the paper. Q.J. directed the study. Z.W., Q.F., Z.Z., T.W. and Y.D. provided critical feedback on the manuscript.

Funding

The Natural Science Foundation of Heilongjiang Province of China (General Project, grant No. E2016004) and the National Natural Science Foundation of China (grant No. 51679040).

Acknowledgments

The authors wish to thank the reviewers and the editor for their valuable suggestions.

Conflicts of Interest

The authors declare no conflicts of interest.

References

  1. Abdul, G.; Manzoor, G.; Ghulam, M. Review Agriculture in the Indus Plains: Sustainability of Land and Water Resources. Int. J. Agric. Biol. 2002, 4, 429–437. [Google Scholar]
  2. Cuceloglu, G.; Abbaspour, K.; Ozturk, I. Assessing the Water-Resources Potential of Istanbul by Using a Soil and Water Assessment Tool (SWAT) Hydrological Model. Water 2017, 9, 814. [Google Scholar] [CrossRef]
  3. Wang, Z.L.; Jiang, Q.X.; Fu, Q.; Jiang, X.; Mo, K. Eco-environmental effects of water resources development and utilization in the Sanjiang Plain, Northeast China. Water Sci. Technol. Water Supply 2017. [Google Scholar] [CrossRef]
  4. Forrester, J.W. Industrial Dynamics; Productivity Press: Cambridge MA, USA, 1961. [Google Scholar]
  5. Richardson, G.P. System Dynamics: Simulation for Policy Analysis from a Feedback Perspective. In Qualitative Simulation Modeling and Analysis; Springer: New York, NY, USA, 1991. [Google Scholar]
  6. Senge, P.M. The Fifth Discipline: The Art & Practice of the Learning Organization; Dell Publishing Group Inc.: New York, NY, USA, 1994. [Google Scholar]
  7. Homer J, B. Why we iterate: Scientific modeling in theory and practice. Syst. Dyn. Rev. 1996, 12, 1–19. [Google Scholar] [CrossRef]
  8. Sehlke, G.; Jacobson, J. System dynamics modeling of transboundary systems: The bear river basin model. Ground Water 2005, 43, 722–730. [Google Scholar] [CrossRef] [PubMed]
  9. Ren, Y.; Yao, J.; Xu, D.; Wang, Z. A comprehensive evaluation of regional water safety systems based on a similarity cloud model. Water Sci. Technol. A J. Int. Assoc. Water Pollut. Res. 2017, 76, 594. [Google Scholar] [CrossRef] [PubMed]
  10. Chen, Z.; Wei, S. Application of System Dynamics to Water Security Research. Water Resour. Manag. 2014, 28, 287–300. [Google Scholar] [CrossRef]
  11. Yin, S.; Dong, J.G.; Wei, C.S.; Wei, J.G. Integrated assessment and scenarios simulation of urban water security system in the southwest of China with system dynamics analysis. Water Sci. Technol. 2017, 76, 2255–2267. [Google Scholar] [CrossRef] [PubMed]
  12. Yilinuer, A.; Jilili, A.; Long, M.; Alim, S.; Michael, G. System Dynamics Modeling of Water Level Variations of Lake Issyk-Kul, Kyrgyzstan. Water 2017, 9, 989. [Google Scholar] [Green Version]
  13. Benjamin, L.T.; Hector, M.; Menendez, R.G.; Luis, O.T.; Alberto, S.A. System Dynamics Modeling for Agricultural and Natural Resource Management Issues: Review of Some Past Cases and Forecasting Future Roles. Water 2016, 5, 40. [Google Scholar] [Green Version]
  14. Liu, D.W. Risk assessment of water shortage in metropolitan area of Beijing, Tianjin and Hebei. Water Resour. Dev. Res. 2010, 10, 20–24. (In Chinese) [Google Scholar]
  15. Wei, H.X.; Li, Z.D. Ecological Risk Assessment of Water Resources Utilization in Gansu Province. Water Resour. Plan. Des. 2016, 29, 11–14. (In Chinese) [Google Scholar]
  16. Liu, Y.S.; Gan, H.; Zhang, F.G. Analysis of the Matching Patterns of Land and Water Resources in Northeast China. Acta Geogr. Sin. 2006, 61, 847–854. (In Chinese) [Google Scholar]
  17. Zhuang, D.F.; Liu, J.Y. Study on the model of regional differentiation of land use degree in China. J. Nat. Resour. 1997, 12, 105–111. (In Chinese) [Google Scholar]
  18. Wu, W.J.; Shi, P.J.; Hu, W. Study on land ecological risk in oasis city based on LUCC-a case study in the Ganzhou district. Arid Zone Res. 2012, 29, 122–128. [Google Scholar]
  19. Mo, H.H.; Ren, Z.Y. Study on Changes of Land Ecosystem Value and Ecological Risk: A Case Study in Sand Blowing Region: Over Shenmu County of Shaanxi Province. J. Desert Res. 2010, 30, 357–362. (In Chinese) [Google Scholar]
  20. National Bureau of Statistics of the People’s Republic of China. China Statistical Yearbook; China Statistics Press: Beijing, China, 2015.
  21. Bureau of Statistics of Heilongjiang Province. Heilongjiang Statistical Yearbook; China Statistics Press: Beijing, China, 2015.
  22. The People’s Government of Heilongjiang Province. The Thirteenth Five-Year Plan Outline for the National Economy and Social Development in Heilongjiang Province; The People’s Government of Heilongjiang Province: Heilongjiang, China, 2016.
  23. Land Resource Bureau. Heilongjiang Land Use Master Plan (2005–2020); Land Resource Bureau: Beijing, China, 2013. [Google Scholar]
  24. Erol, A.; Randhir, T.O. Climatic change impacts on the ecohydrology of Mediterranean watersheds. Clim. Chang. 2012, 114, 319–341. [Google Scholar] [CrossRef]
  25. Wang, X.J.; Zhang, J.Y.; Wang, J.H.; He, R.M.; Amgad, E.; Liu, J.H.; Wang, X.G.; King, D.; Shahid, S. Climate change and water resources management in Tuwei river basin of Northwest China. Mitig. Adapt. Strateg. Glob. Chang. 2014, 19, 107–120. [Google Scholar]
  26. Li, X.W.; Gao, X.Z.; Chang, Y.T.; Mu, D.P.; Liu, H.L.; Guo, J.Y. Water storage variations and their relation to climate factors over Central Asia and surrounding areas over 30 years. Water Sci. Technol. Water Supply 2017, ws2017206. [Google Scholar] [CrossRef] [Green Version]
  27. Balali, H.; Viaggi, D. Applying a System Dynamics Approach for Modeling Groundwater Dynamics to Depletion under Different Economical and Climate Change Scenarios. Water 2015, 7, 5258–5271. [Google Scholar] [CrossRef] [Green Version]
  28. Liu, J.Y.; Hu, Y.C.; Jin, X.Z. Sustainable utilization of water resources in Tianjin based on system dynamics. J. Huazhong Normal Univ. (Nat. Sci.) 2014, 48, 106–111. (In Chinese) [Google Scholar]
  29. Sun, X.X.; Shen, B.; Yu, J.L.; Liu, X.J.; Mo, S.H. Carrying capacity of water resources of Baoji city based on the system dynamics model. Xi’an Univ. Arch. Technol. (Nat. Sci. Ed.) 2007, 39, 72–77. (In Chinese) [Google Scholar] [CrossRef]
  30. Tong, F.; Jin, J.L.; Dong, Z.C. Study on regional joint allocation of water and land resources based on improved system dynamics model. Yangtze River 2017, 48, 43–48. (In Chinese) [Google Scholar]
  31. Nguyen, T.P.L.; Mula, L.; Cortignani, R.; Seddaiu, G.; Dono, G.; Virdis, S.G.P.; Pasqui, M.; Roggero, P.P. Perceptions of Present and Future Climate Change Impacts on Water Availability for Agricultural Systems in the Western Mediterranean Region. Water 2016, 8, 523. [Google Scholar] [CrossRef]
  32. Huang, R.; Liu, J.M.; Li, L.K. Water resources carrying capacity of Xianyang City based on system dynamics. J. Drain. Irrig. Mach. Eng. 2012, 30, 57–63. (In Chinese) [Google Scholar]
  33. Jiang, Q.; Fu, Q.; Wang, Z. Dynamic Simulation of Water Resources Sustainable Utilization of Kiamusze Based on System Dynamics. In Proceedings of the Sixth International Conference on Computer and Computing Technologies in Agriculture, Zhangjiajie, China, 19–21 October 2013; pp. 367–375. [Google Scholar]
  34. Sušnik, J.; Vamvakeridou-Lyroudia, L.S.; Savić, D.A.; Kapelan, Z. Integrated System Dynamics Modelling for water scarcity assessment: Case study of the Kairouan region. Sci. Total Environ. 2012, 440, 290–306. [Google Scholar] [CrossRef] [PubMed]
Figure 1. Heilongjiang Province location map.
Water 10 00868 g001
Figure 2. Subsystem interconnection overview.
Water 10 00868 g002
Figure 3. Workflow for the population subsystem.
Water 10 00868 g003
Figure 4. Workflow for the water subsystem.
Water 10 00868 g004
Figure 5. Workflow for the land subsystem.
Water 10 00868 g005
Figure 6. Workflow for the economic subsystem.
Water 10 00868 g006
Figure 7. Simulation of land and water resource system dynamics model of Heilongjiang Province under different climate conditions. (a) Water supply-demand ratio; (b) Water use efficiency index; (c) Water shortage risk index; (d) Coefficient of agricultural land and water resource matching; (e) Unused land/Ten thousand hm2; (f) Comprehensive index of land use degree; (g) Land use diversity index; (h) Land use ecological risk index.
Water 10 00868 g007aWater 10 00868 g007b
Figure 8. Influential factors of the annual total water demand. (a) Annual total water demand; (b) Paddy field irrigation water.
Water 10 00868 g008
Figure 9. The characteristic variable tree. (a) Water supply-demand ratio variable tree; (b) Water use efficiency index variable tree; (c) Water shortage risk index variable tree; (d) Coefficient of agricultural land and water resource matching variable tree; (e) Unused land variable tree; (f) Land use diversity variable tree; (g) Land use ecological risk index variable tree; (h) Comprehensive index of land use degree variable tree; (i) Gross regional output variable tree.
Water 10 00868 g009
Table 1. The model verification results using historical data.
IndexVariableUnit200020022004200620082010201220142015
Annual total water supplyPredicted value108 m3287249251282300324350348348
Actual value108 m3297252259286297325359364355
Error%−3.48−1.20−3.19−1.421.00−0.31−2.57−4.60−2.01
Groundwater resourcesPredicted value108 m3275247262268236285285282282
Actual value108 m3268270274279248278290295283
Error%2.55−9.31−4.58−4.10−5.082.46−1.75−4.61−0.35
Gross regional outputPredicted value108 Yuan29633375455162338161997614,39815,24715,440
Actual value108 Yuan3151363747516212831410,36913,69215,03915,490
Error%−6.34−7.76−4.390.34−1.87−3.944.901.36−0.32
Urbanizat-ion ratePredicted value%525252535556575858
Actual value%525353535556575859
Error%0.00−1.92−1.920.000.000.000.000.00−1.72
Table 2. Different scenarios.
VariableScenario 1Scenario 2Scenario 3Scenario 4Scenario 5
Net irrigation quota for paddy fields (m3/hm2)Decrease by 20%No changeNo changeNo changeNo change
Water quota for industrial use (m3/hm2)Decrease by 20%No changeNo changeNo changeNo change
Forestland (10,000 hm2)No changeIncrease by 20%Decrease by 20%No changeNo change
Annual change rate of farmland areaNo changeDecrease by 20%Increase by 20%No changeNo change
Annual growth rate of gross industrial output valueNo changeNo changeNo changeMaximum over the years0
Table 3. Comparing the simulation results with the status quo under an arid climate.
VariableScenario 1Scenario 2Scenario 3Scenario 4Scenario 5
Unused land-2.85%---
Land use diversity index-−2.60%1.66%--
Land use ecological risk index-−9.97%8.92%--
Comprehensive index of land use degree-−3.09%2.67%--
Water supply–demand ratio20.10%--−0.10%0.5%
Water use efficiency index17.81%--−7.81%3.59%
Water shortage risk index−4.44%--33.22%−3.22%
Coefficient of agricultural land and water resource matching−2.35%26.62%−6.62%c−6.62%0.86%
Note: the symbol of “-”means keep invariant.
Table 4. Comparing the status quo with the system dynamics (SD) model results under the combined scenario in 2030 under an arid climate.
VariableUnitStatus QuoCombined ScenarioChange Range
Unused land10,000 hm2207.4251.921.46%
Land use diversity index-1.271.24−2.05%
Land use ecological risk index-0.080.07−9.78%
Comprehensive index of land use degree-235.9228.1−3.31%
Water supply–demand ratio-0.560.6517.45%
Water use efficiency index-0.340.4529.45%
Water shortage risk index-24.0822.49−6.60%
Coefficient of agricultural land and water resource matching-0.190.2322.18%

