The Influences of a Clay Lens on the Hyporheic Exchange in a Sand Dune


Abstract
1. Introduction
2. Materials and Methods
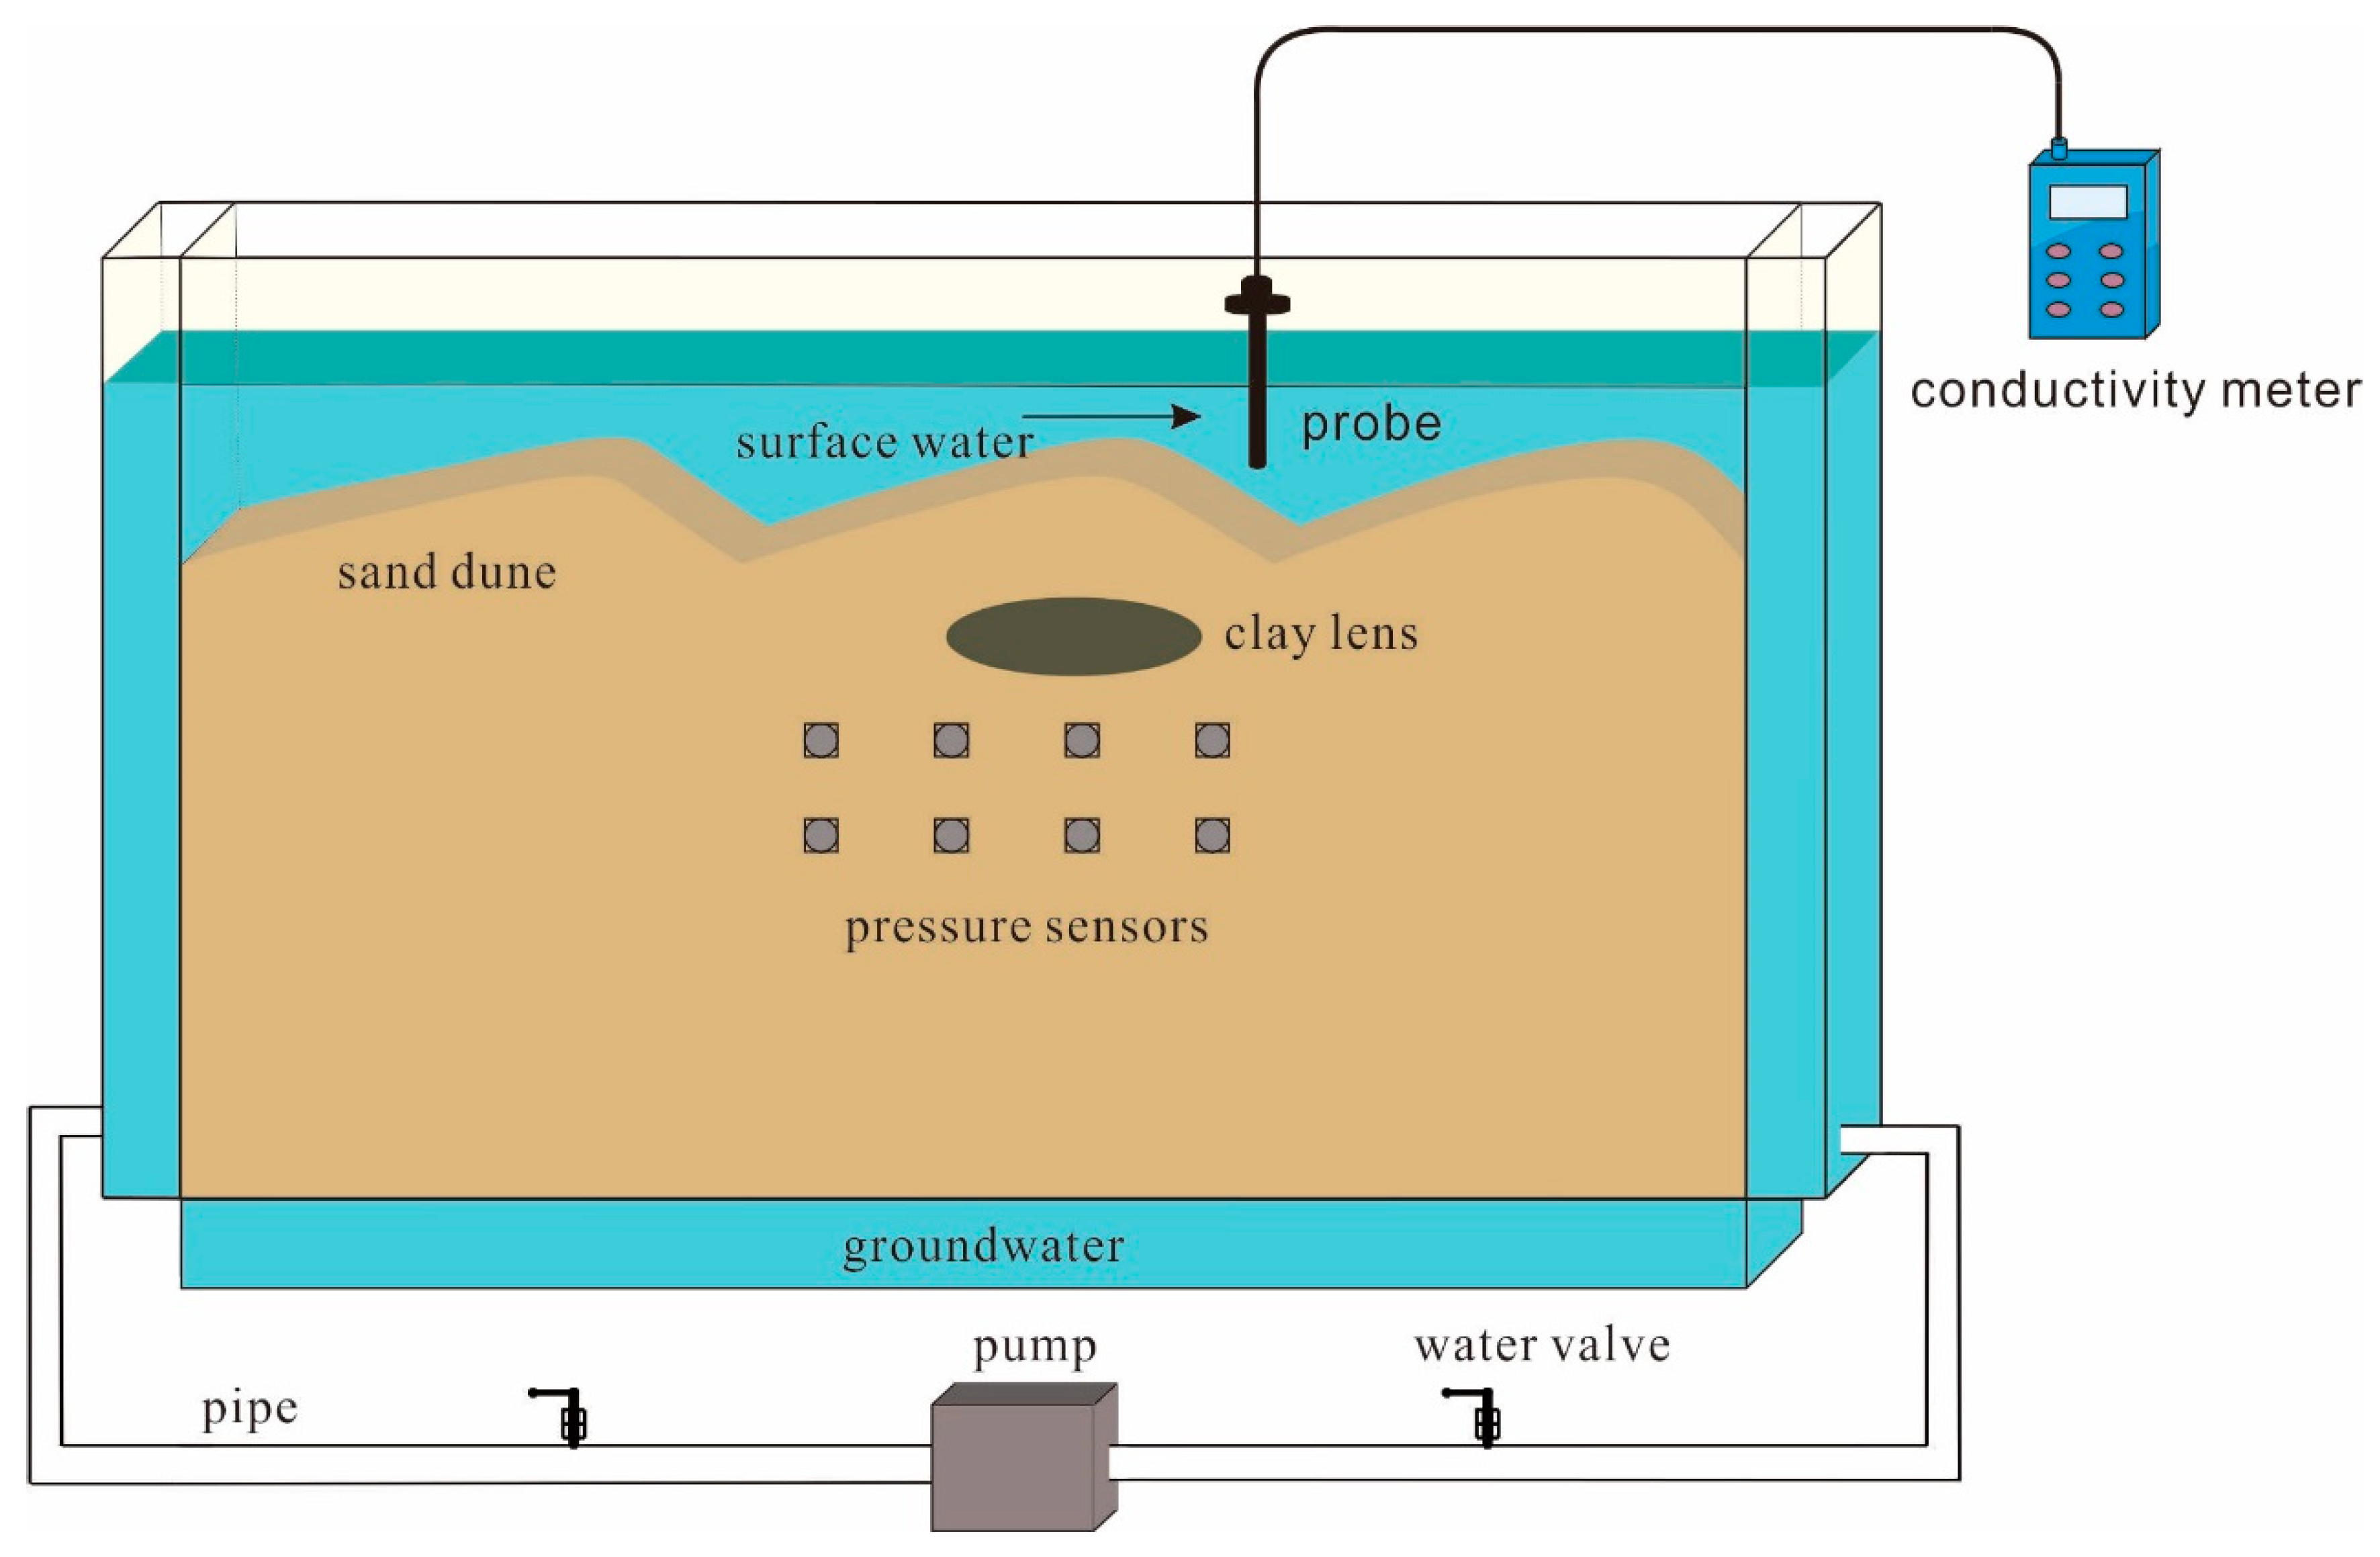
2.1. Experimental Setup
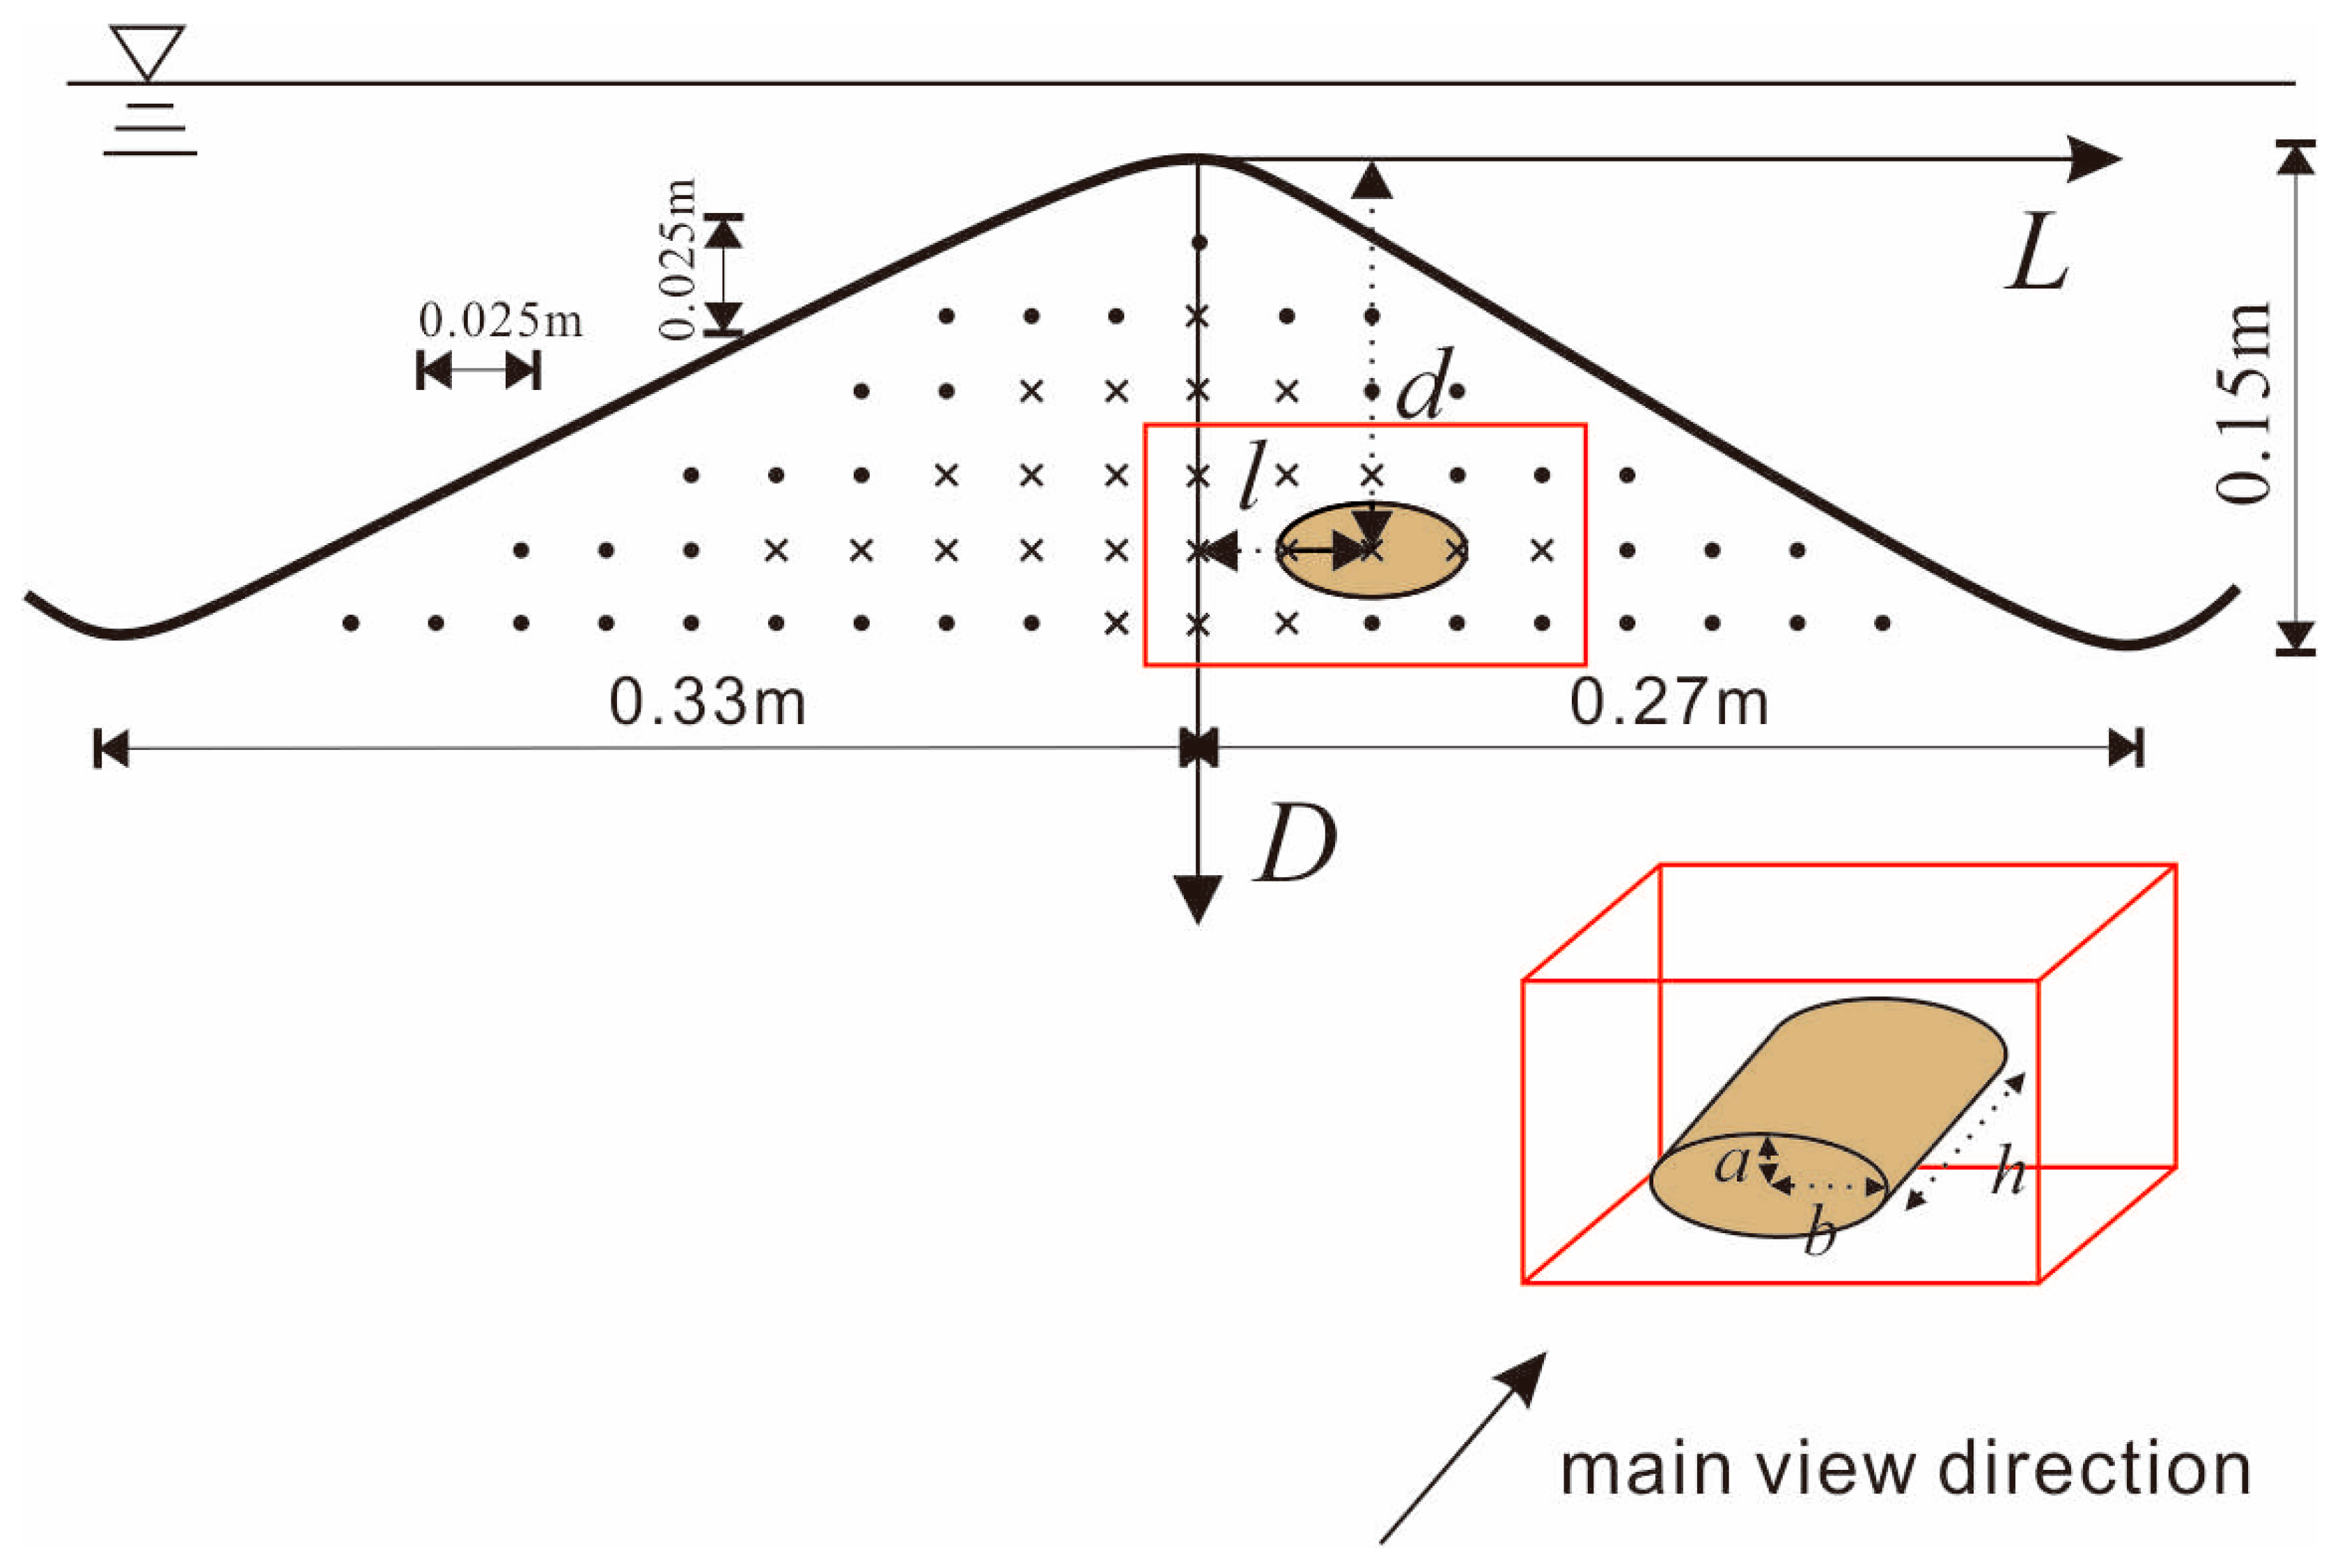
2.2. Clay Lens
3. Methods of Test and Calculation
3.1. Scenario Design
3.2. Determining the Extent of the Hyporheic Zone
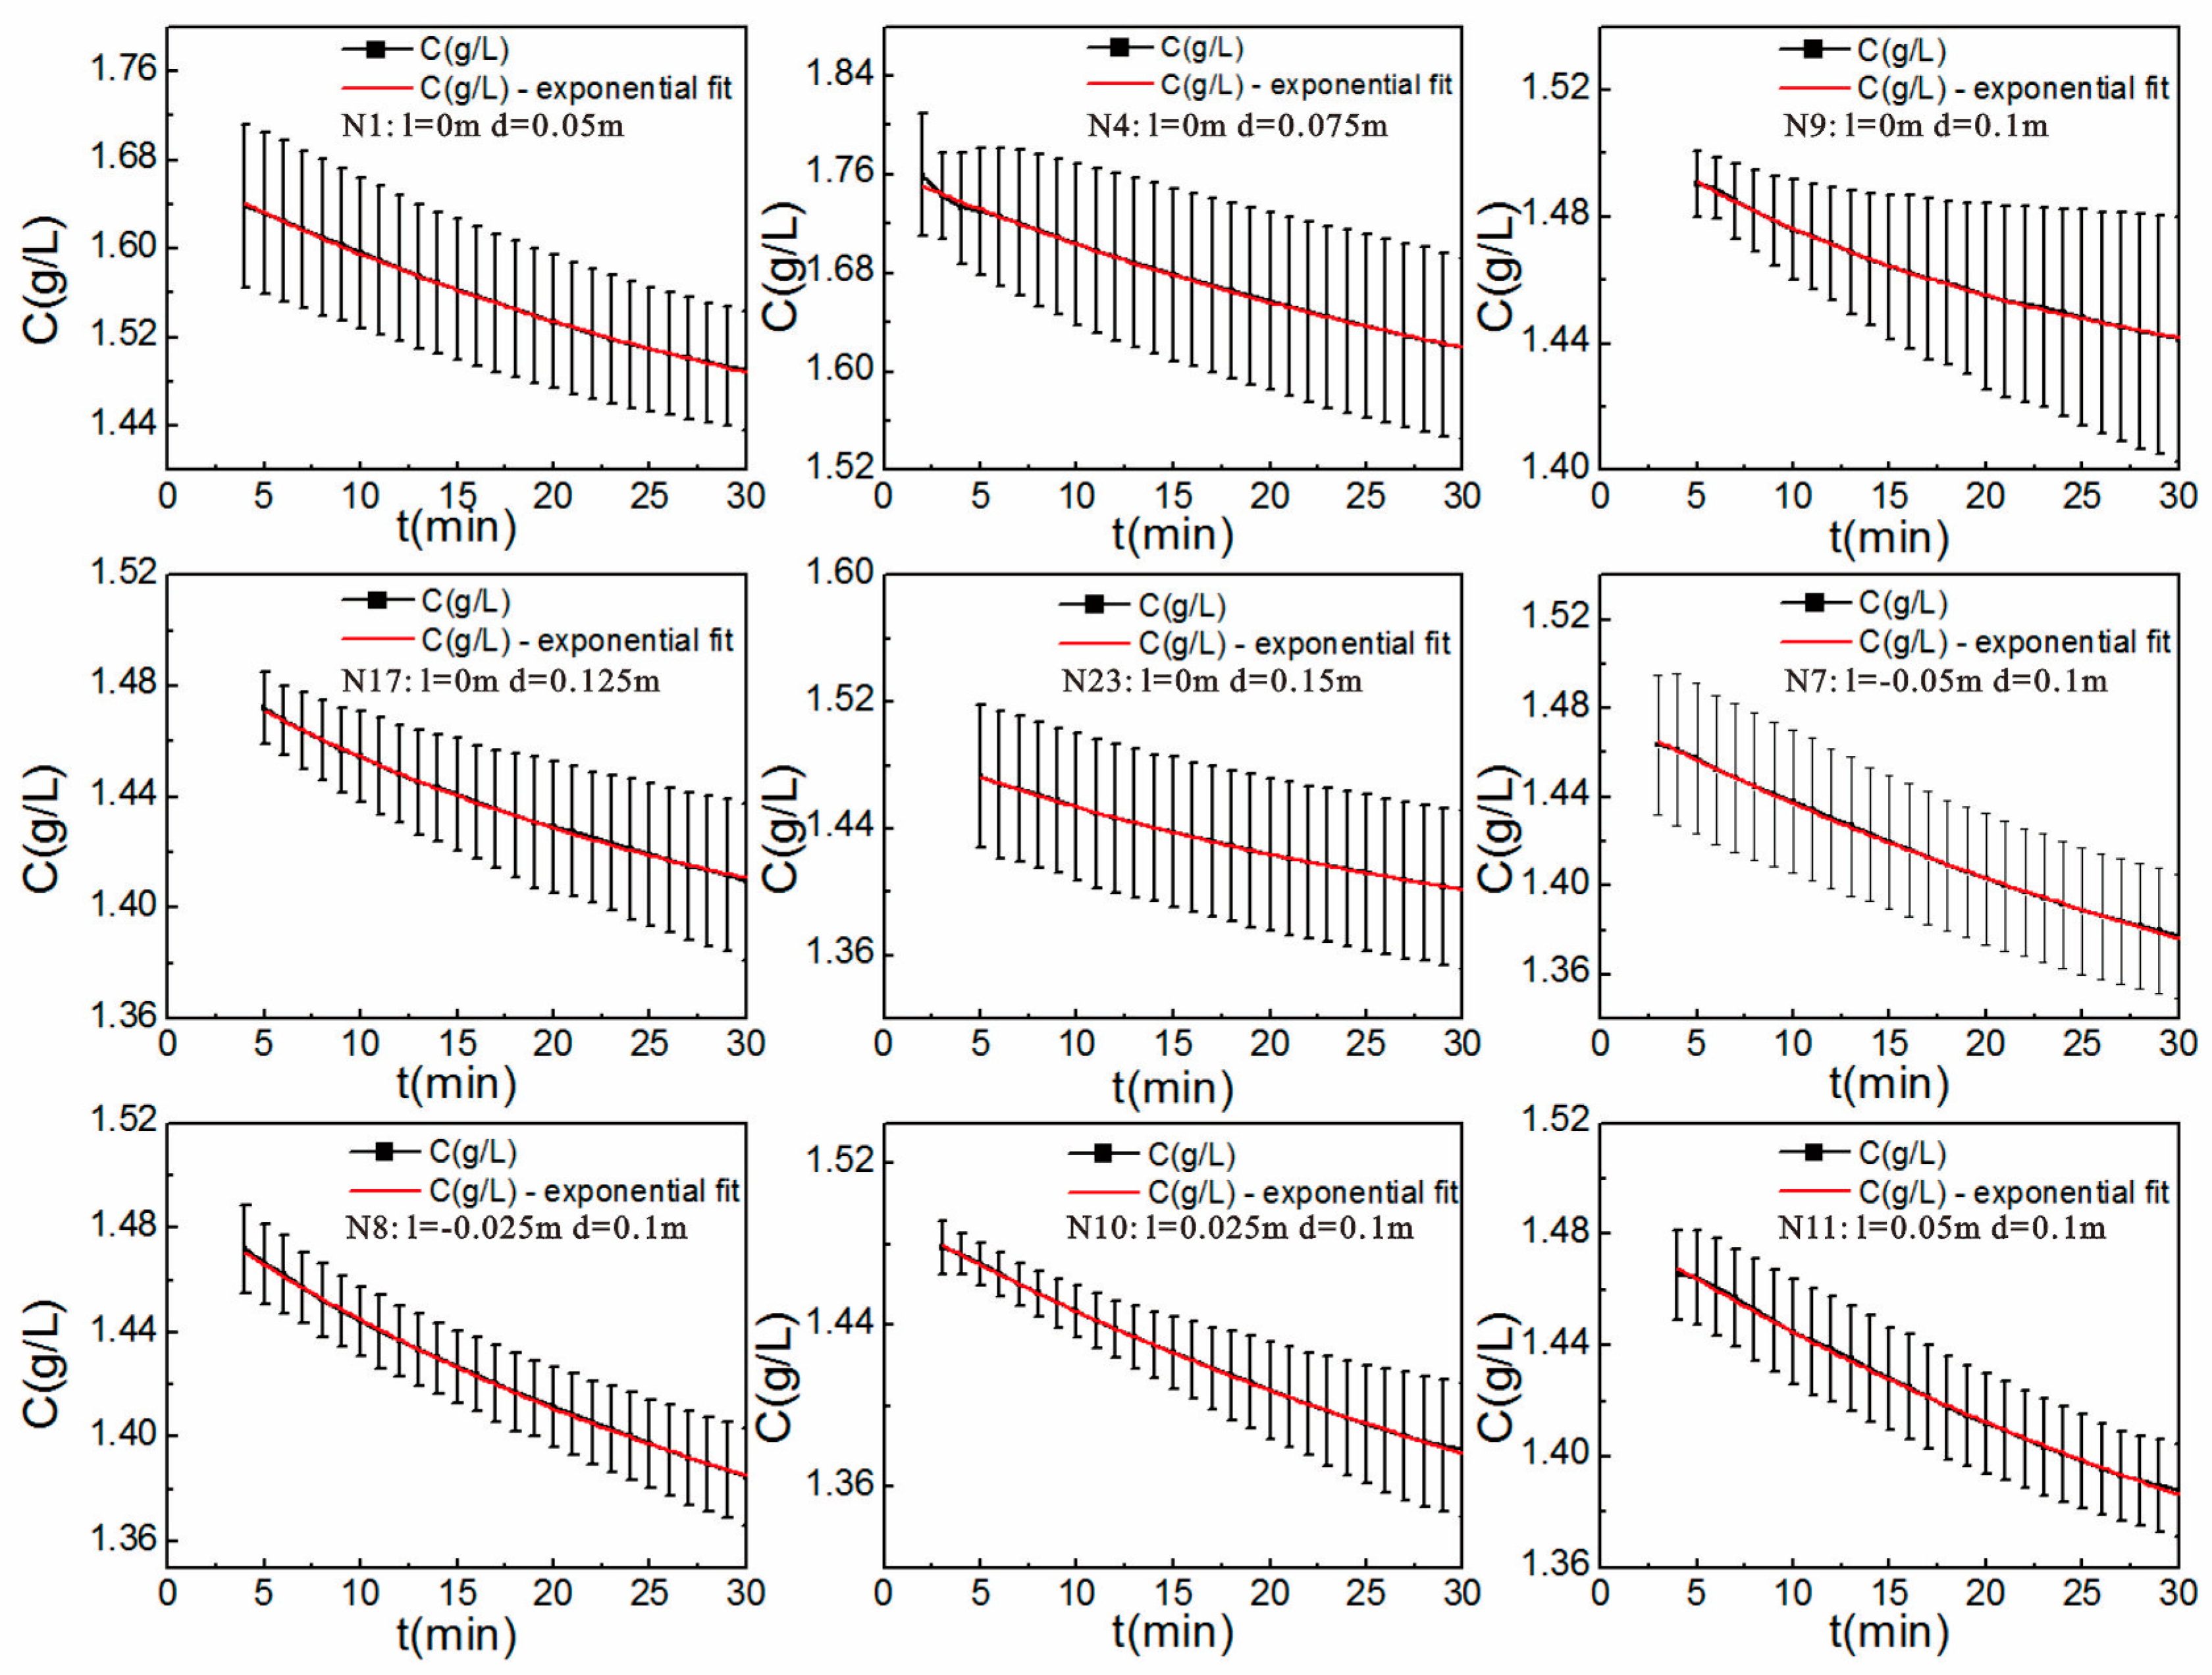
3.3. Hyporheic Flux Calculation
4. Results and Discussion
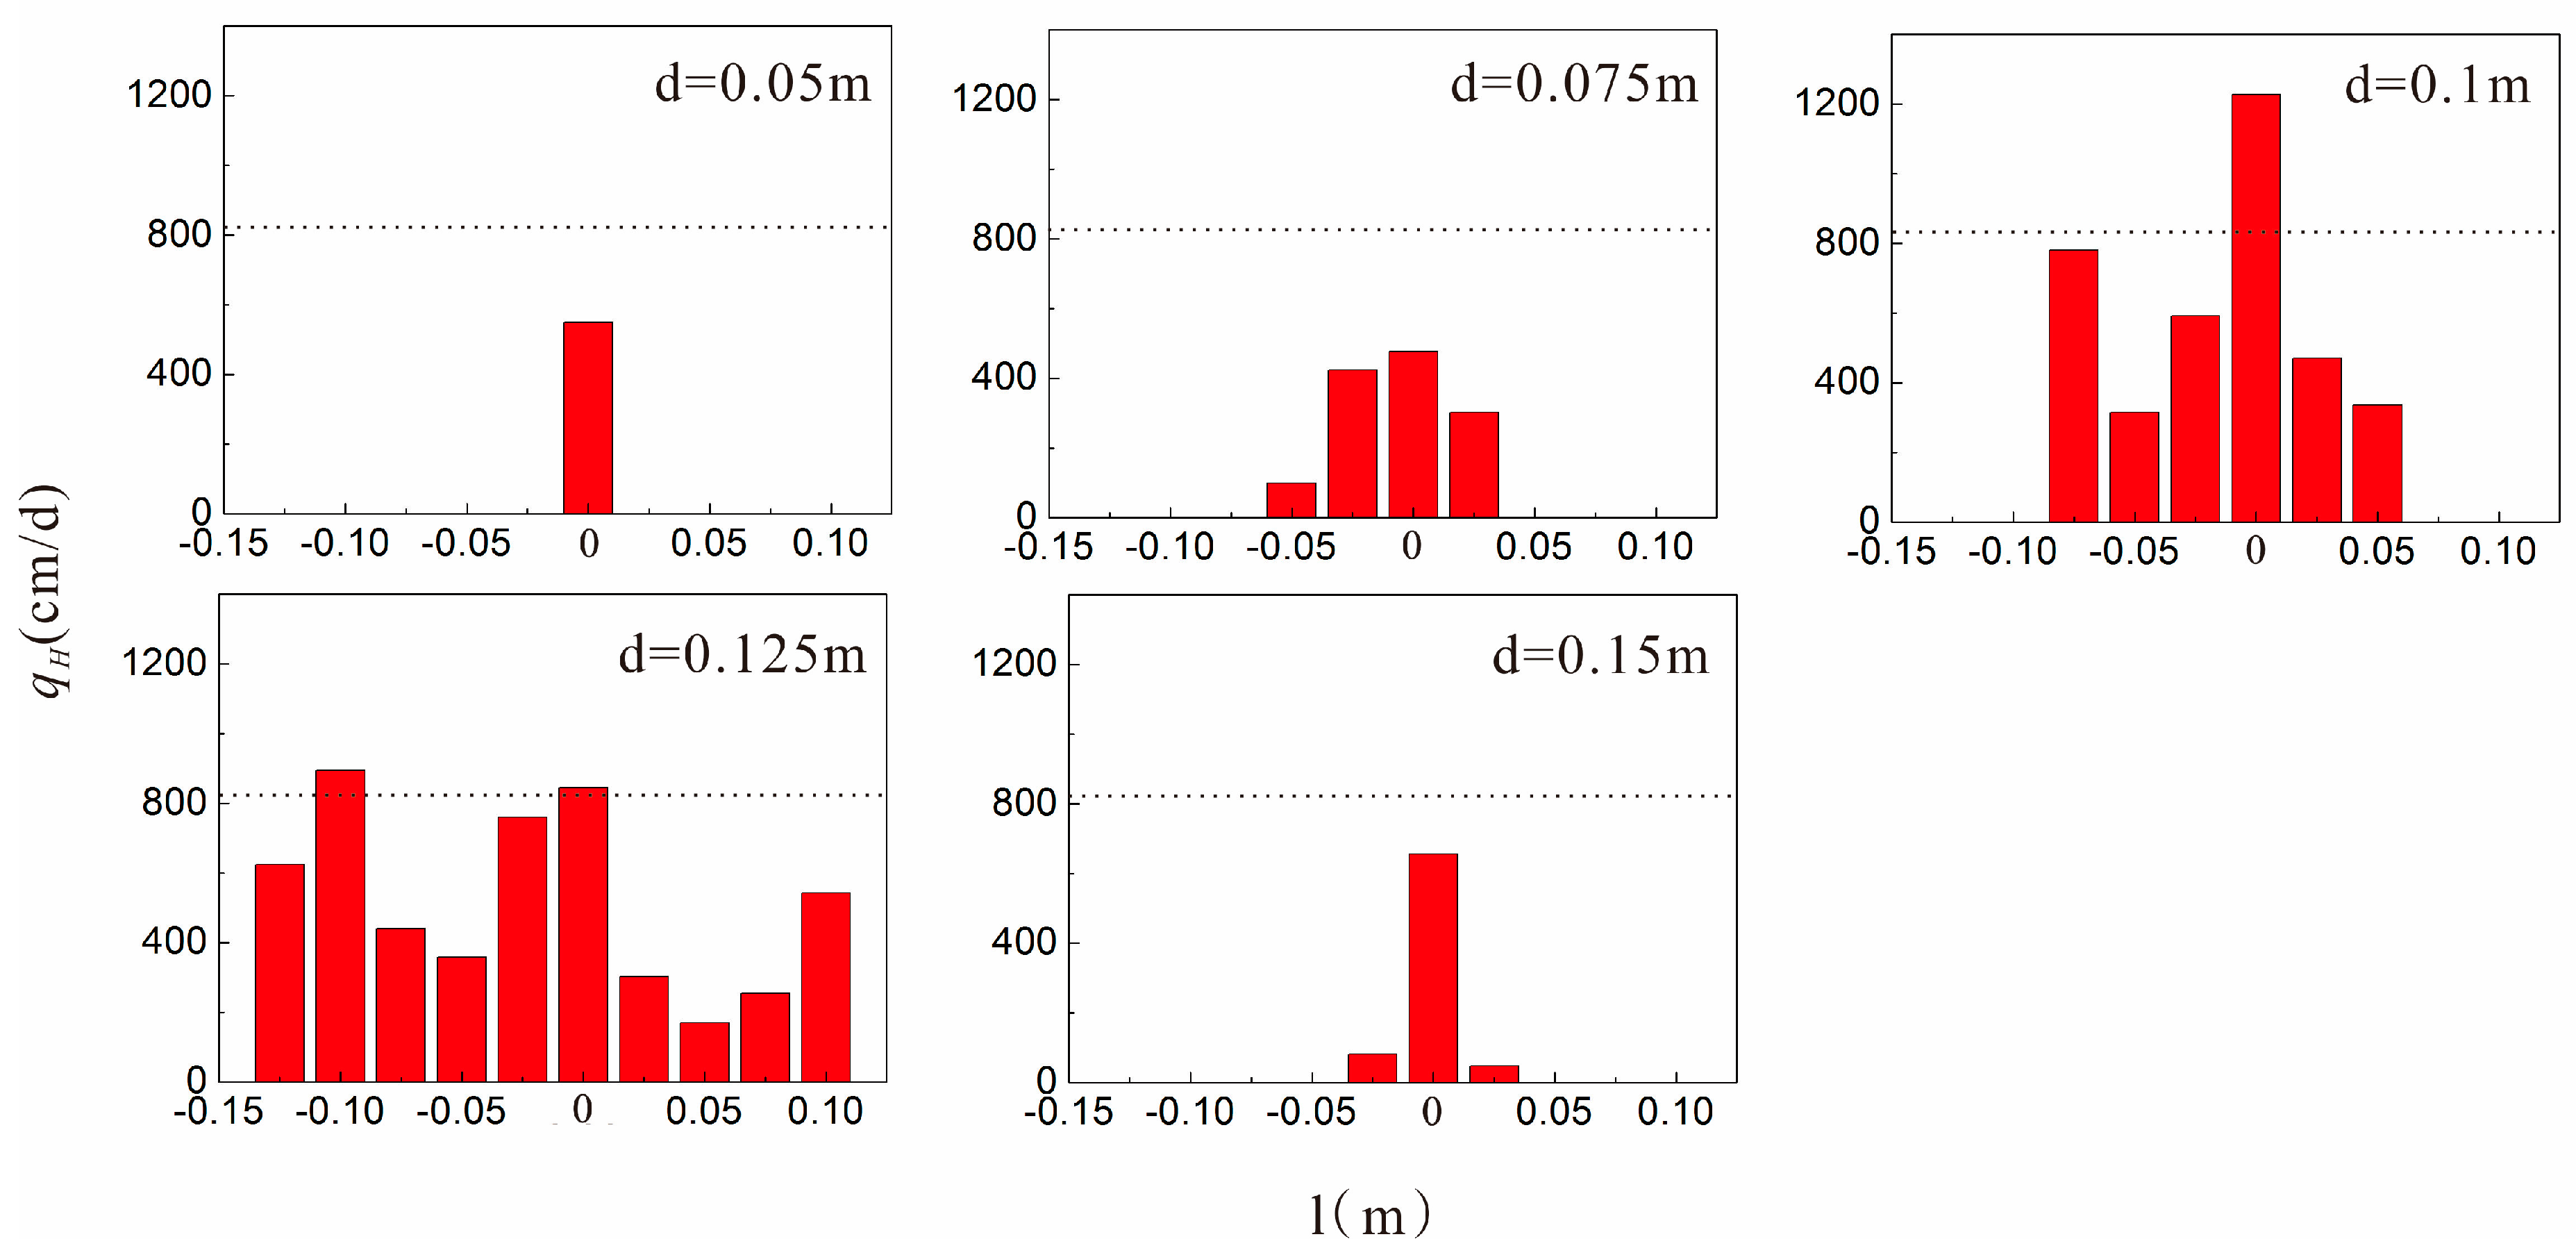
4.1. Hyporheic Flux
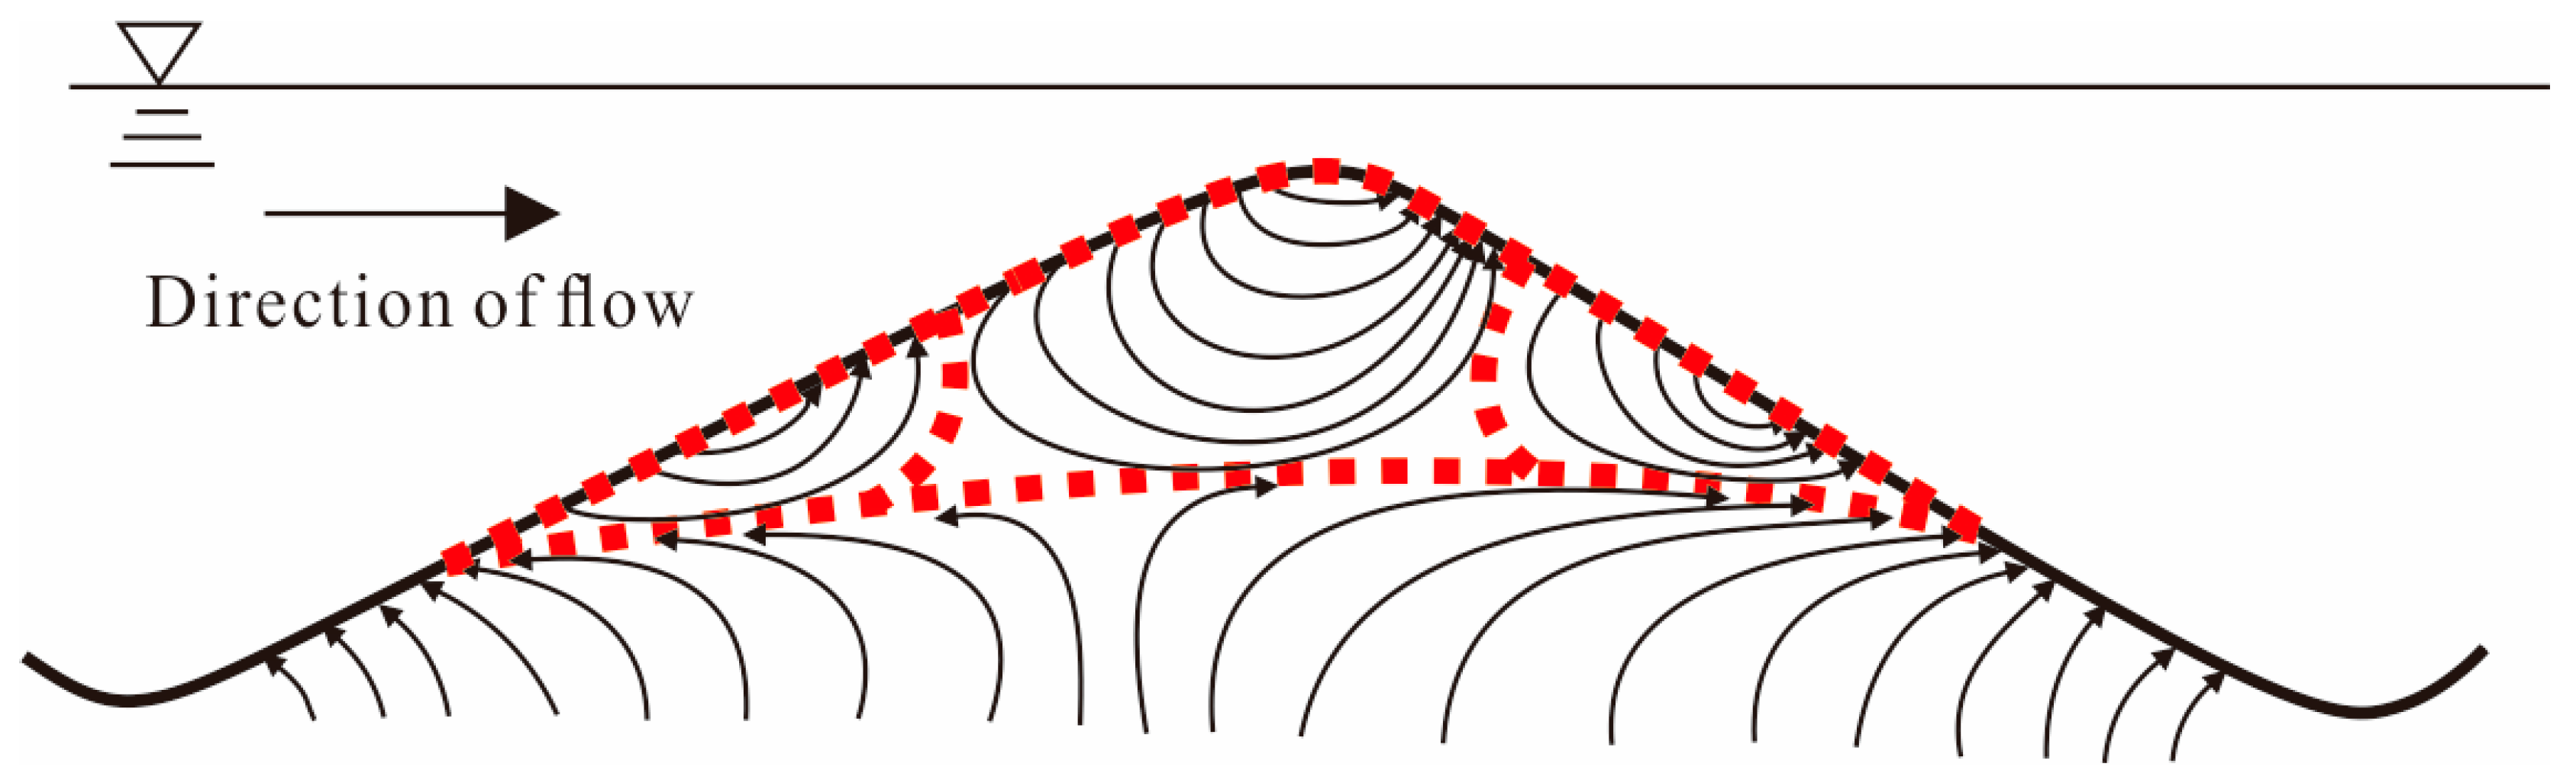
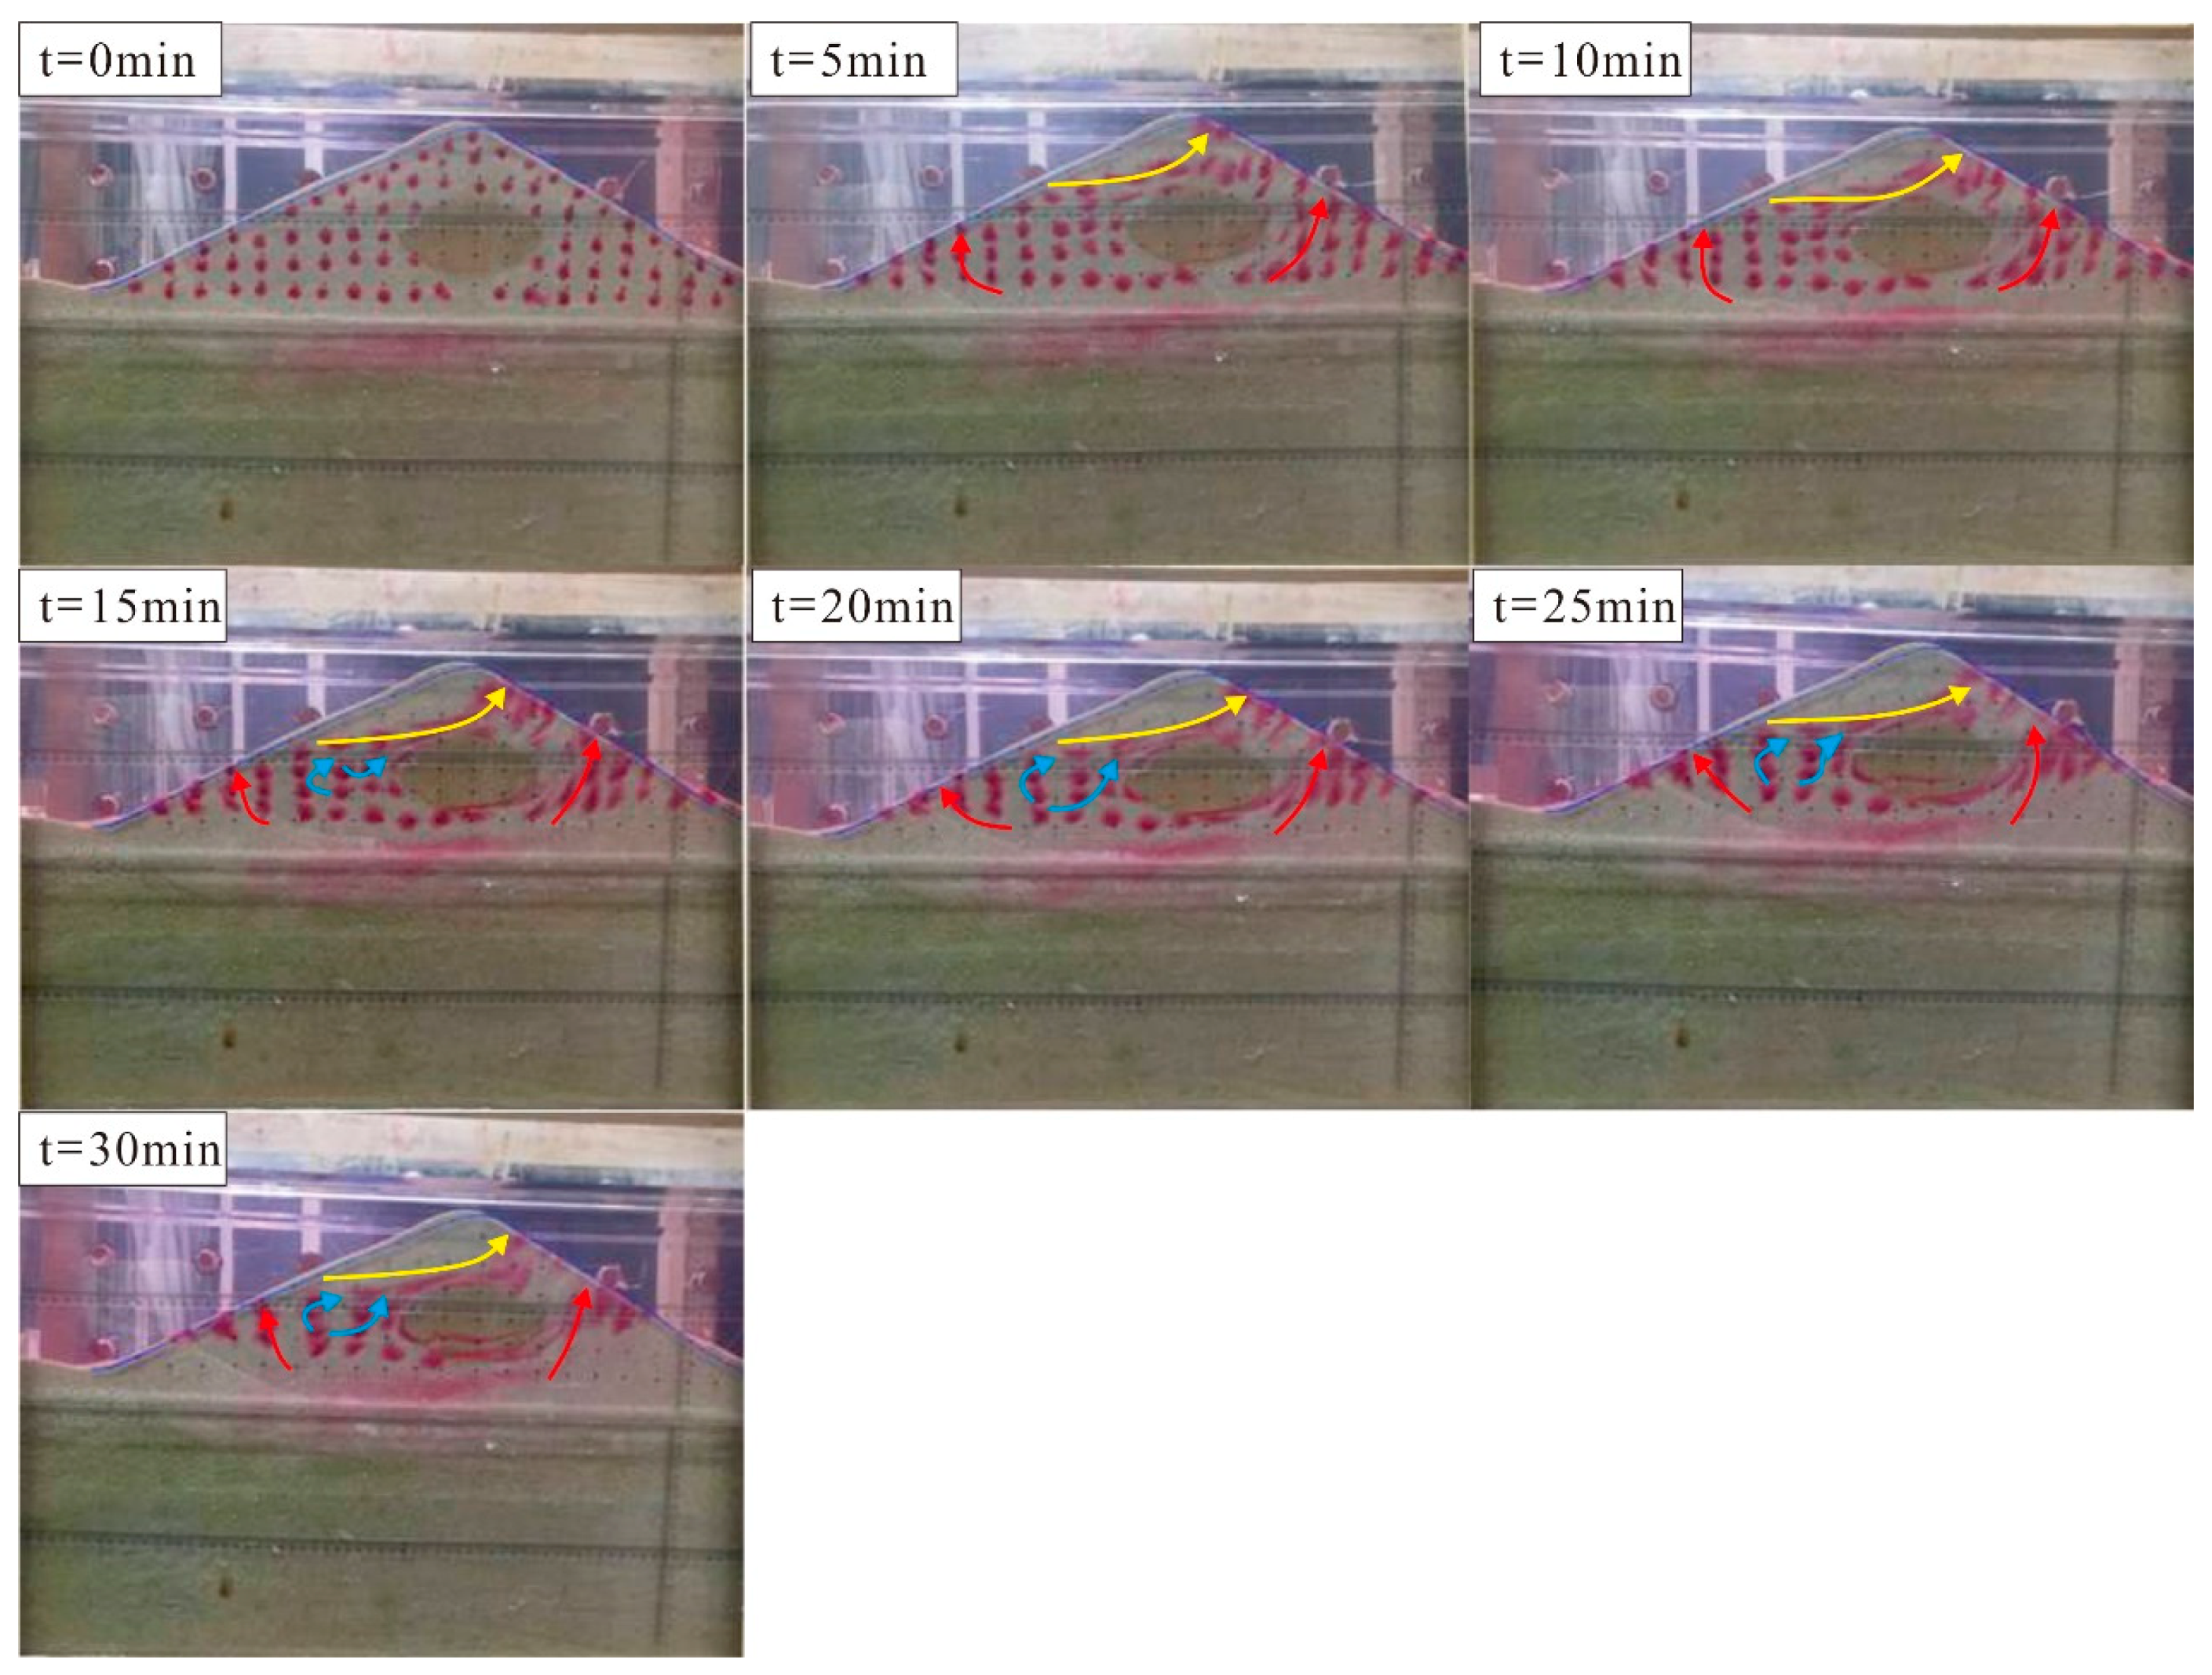
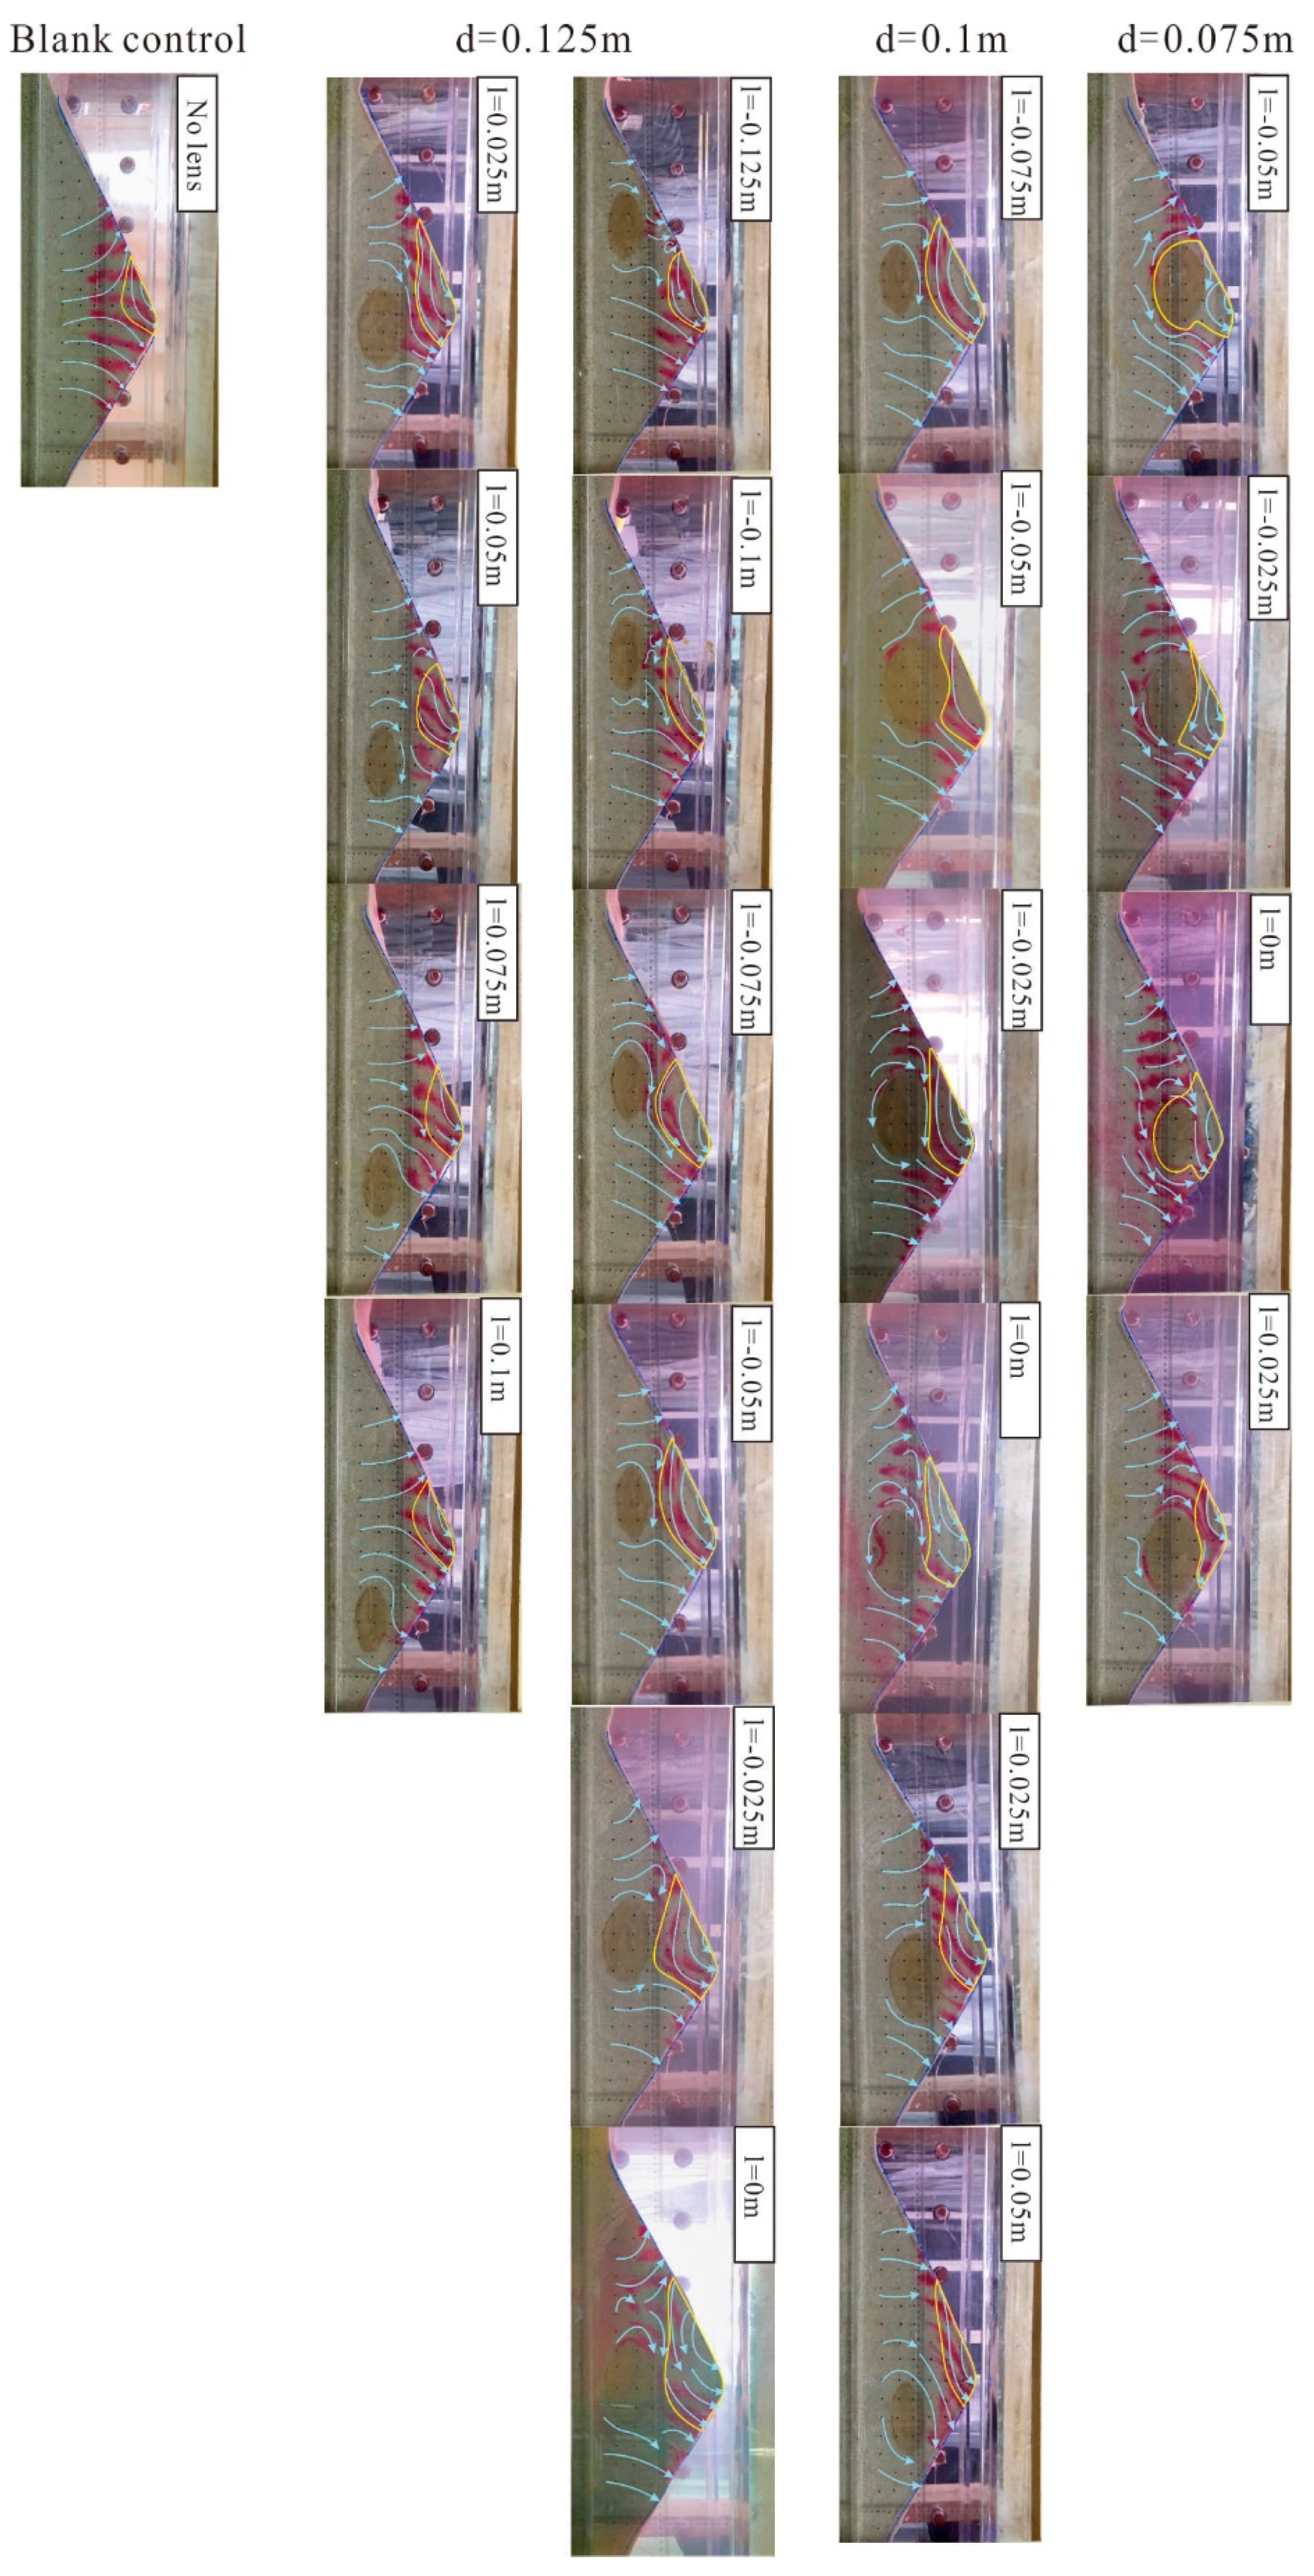
4.2. Change of Hyporheic Zone Flow Field: Three Different Kinds of Water Flow
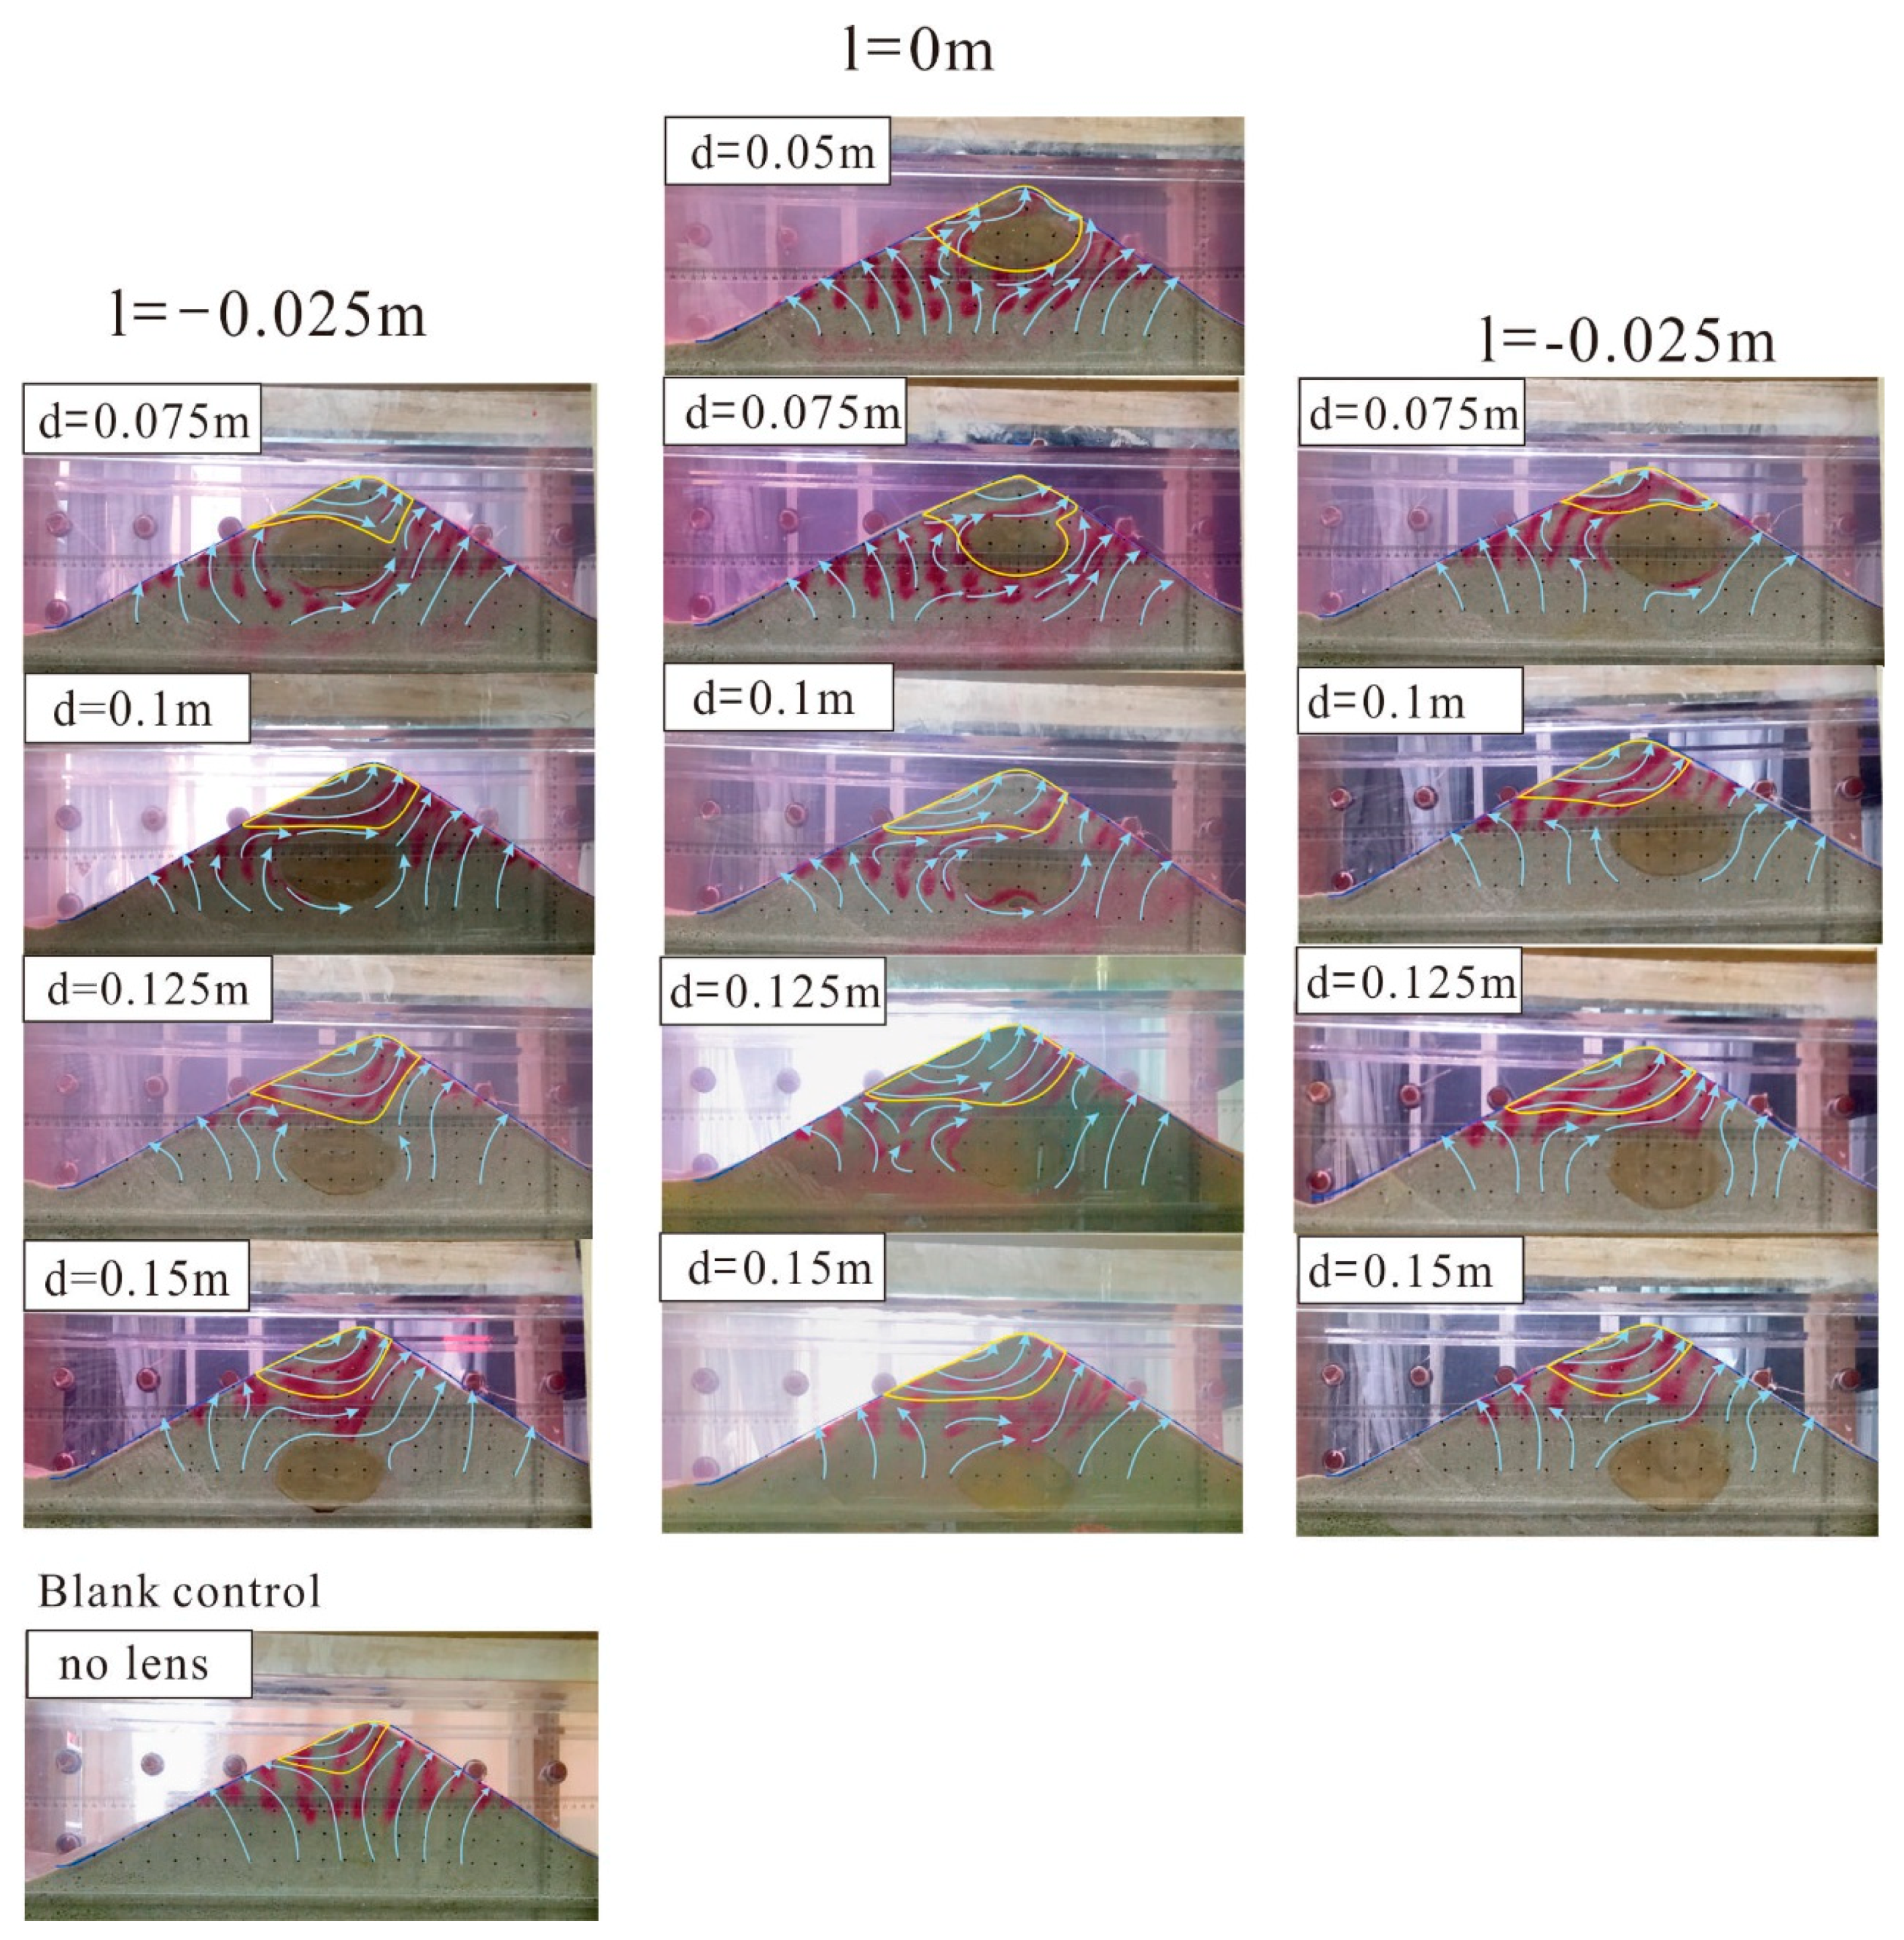
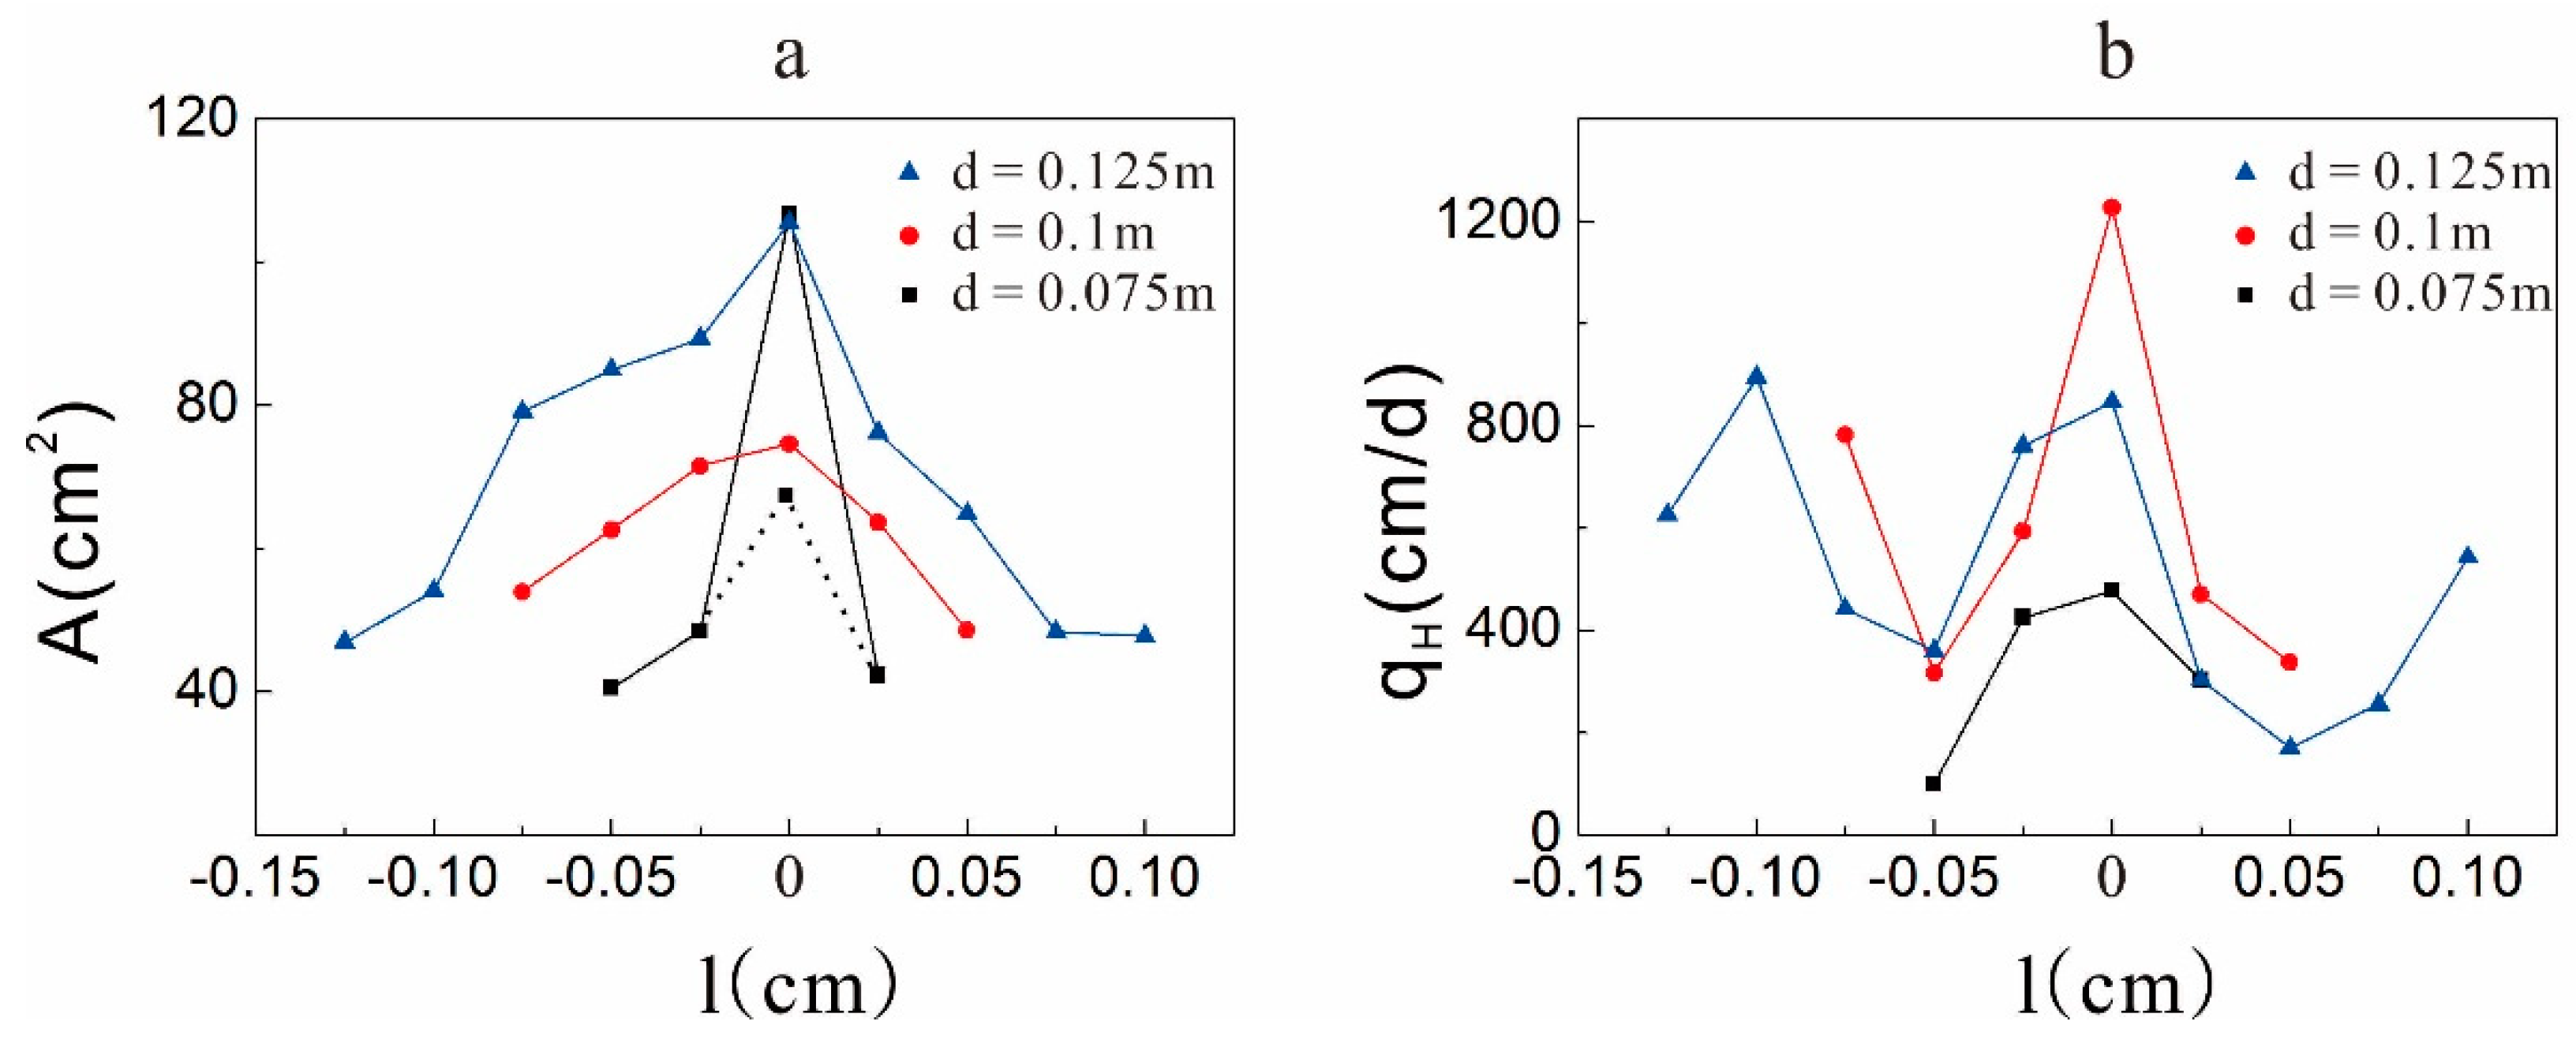
4.3. Influence of the Spatial Distribution to the Extent of Hyporheic Zone
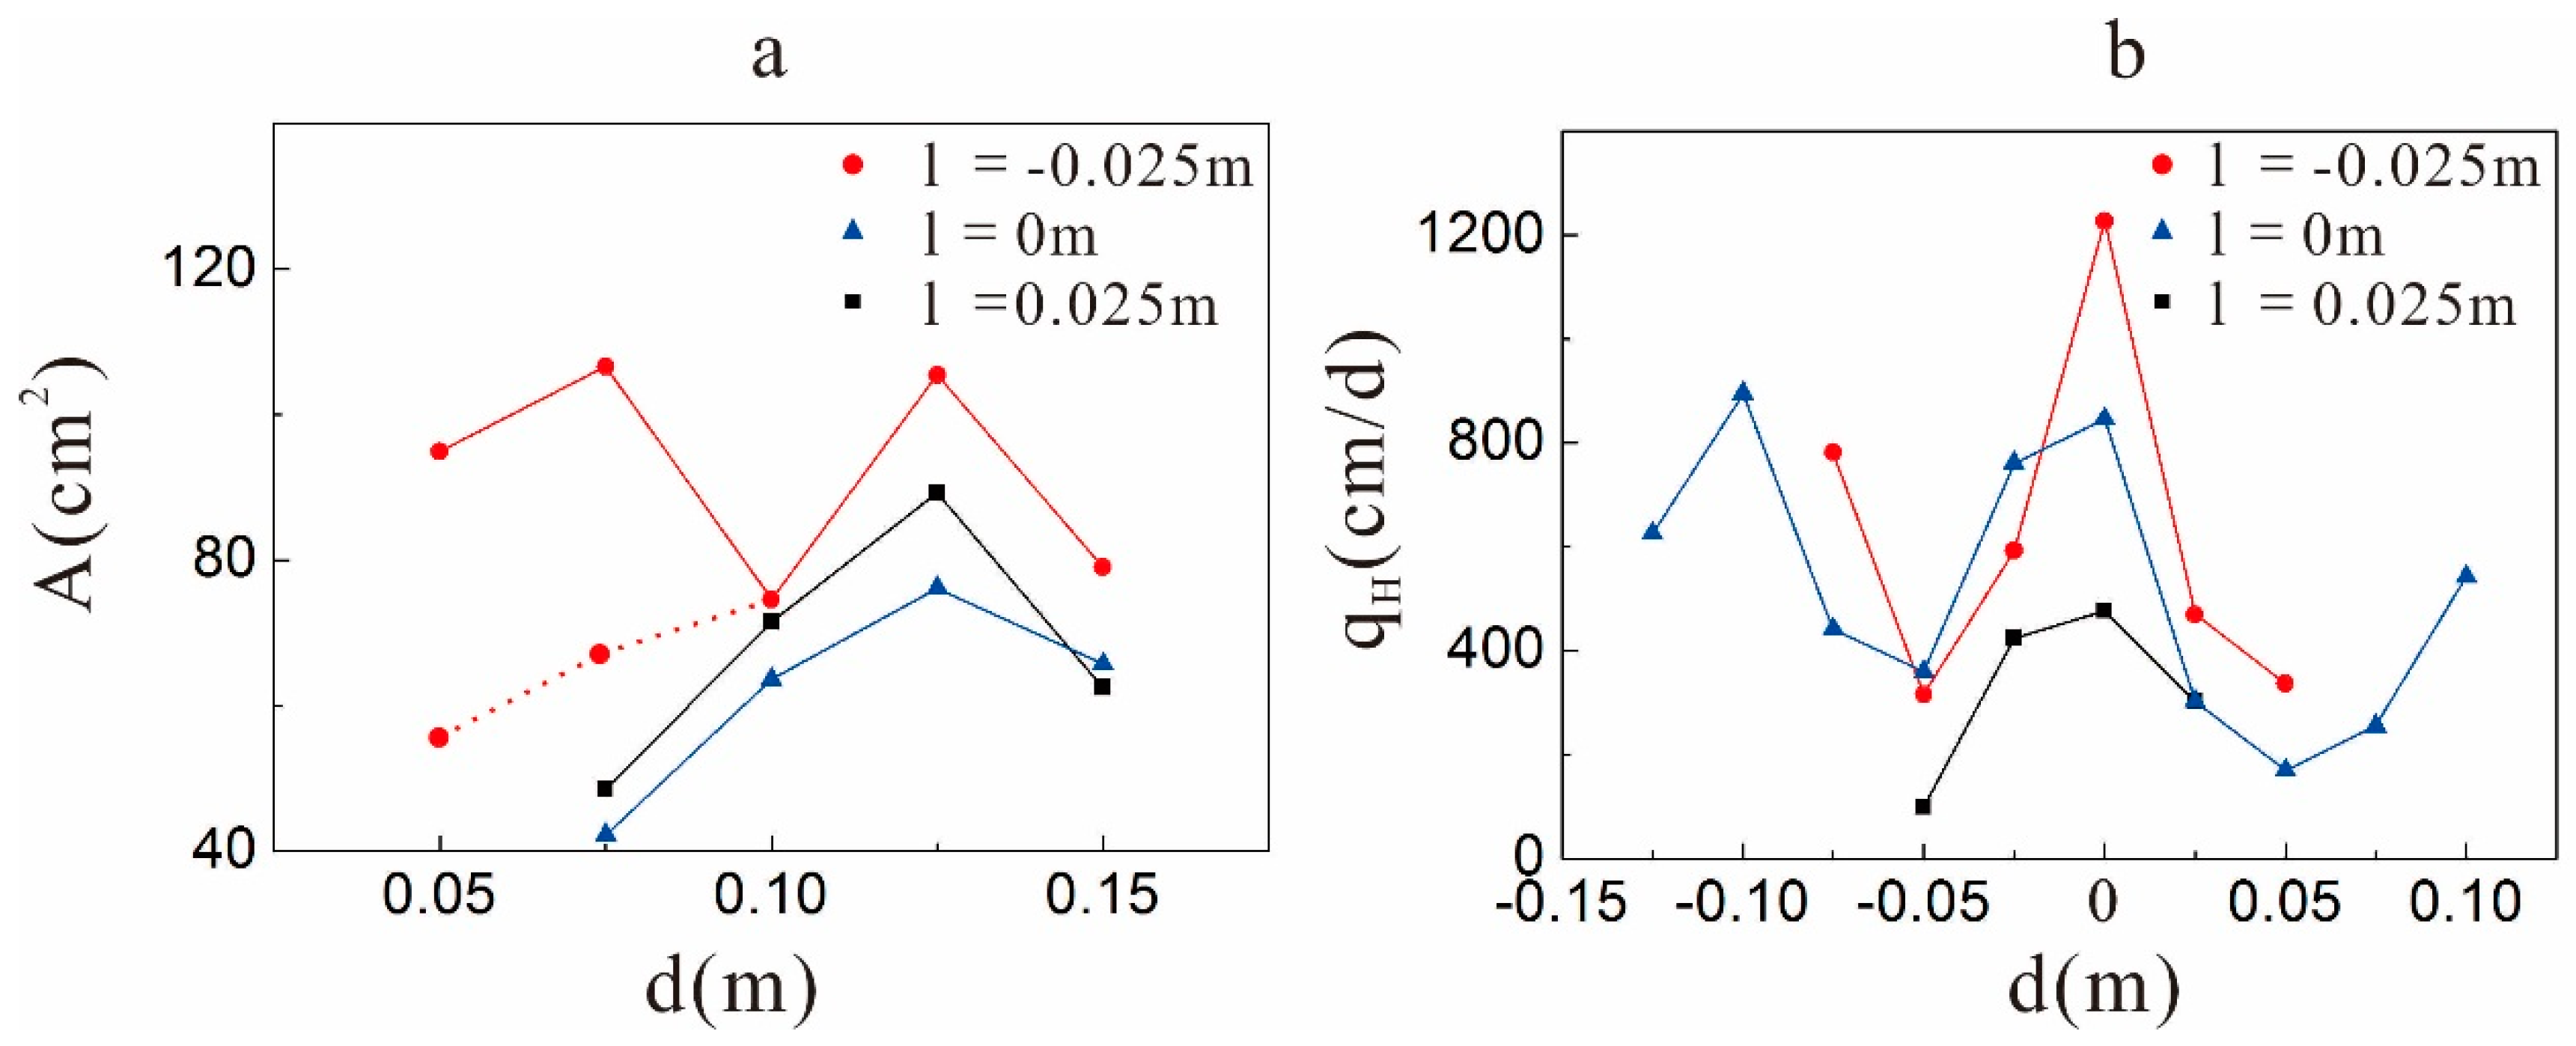
4.3.1. Influence of the Depth on the Extent of the Hyporheic Zone
4.3.2. Influence of the Horizontal Locations on the Extent of the Hyporheic Zone
5. Conclusions
- (i)
- In the test, under the gaining streamflow condition, there was a ubiquitous inhibitory effect of the clay lens on the hyporheic flux in the sand dune, and this effect was related to the spatial positions of the lens. When the lens was in the middle region of the sand dune, the effect was weakest. It enhanced when the lens moved to the surface of the sand dune. Based on the scale itself, the effect had a range in the sand dune. When the lens was out of the range, the inhibitory effect was significantly reduced or disappeared altogether.
- (ii)
- Influenced by surface water flow and groundwater flow, there are three different kinds of hyporheic flow in sand dunes. When the surface water dominates, water flows horizontally. When the pumping exchange dominates, water flows perpendicularly to the surface of a sand dune. When the influences are combined, water flows irregularly and variably at any moment.
- (iii)
- Unlike the hyporheic flux, the area of the hyporheic zone is larger when there is a lens in the sand dune because the lens can reduce the restriction of the upwelling flow on the hyporheic zone. Different spatial positions of the clay lens will affect the extent of the hyporheic zone by changing the direction of the hyporheic flow. In addition, the lens is contained in the hyporheic zone when it is located near the top of the sand dune.
Author Contributions
Acknowledgments
Conflicts of Interest
References
- Cardenas, M.B.; Wilson, J.L. Dunes, turbulent eddies, and interfacial exchange with permeable sediments. Water Resour. Res. 2007, 43, 199–212. [Google Scholar] [CrossRef]
- Salehin, M.; Packman, A.I.; Paradis, M. Hyporheic Exchange with Heterogeneous Streambeds: Laboratory Experiments and Modeling. Water Resour. Res. 2004, 40, 309–316. [Google Scholar] [CrossRef]
- Boano, F.; Harvey, J.W.; Marion, A.; Packman, A.I.; Revelli, R.; Ridolfi, L.; Wörman, A. Hyporheic flow and transport processes: Mechanisms, models, and biogeochemical implications. Rev. Geophys. 2015, 52, 603–679. [Google Scholar] [CrossRef]
- Bencala, K.E.; Walters, R.A. Simulation of solute transport in a mountain pool-and-riffle stream: A transient storage model. Water Resour. Res. 1983, 19, 718–724. [Google Scholar] [CrossRef]
- Tang, Q.; Kurtz, W.; Schilling, O.S.; Brunner, P.; Vereecken, H.; Franssen, H.J.H.; Tang, Q.; Kurtz, W.; Schilling, O.S.; Brunner, P. The influence of riverbed heterogeneity patterns on river-aquifer exchange fluxes under different connection regimes. J. Hydrol. 2017, 554, 383–396. [Google Scholar] [CrossRef]
- Boulton, A.J.; Datry, T.; Kasahara, T.; Mutz, M.; Stanford, J.A.; Silver, P.; Steinman, A.D.; Polls, I. Ecology and management of the hyporheic zone: Stream-groundwater interactions of running waters and their floodplains. J. N. Am. Benthol. Soc. 2010, 29, 26–40. [Google Scholar] [CrossRef]
- Findlay, S. Importance of surface-subsurface exchange in stream ecosystems: The hyporheic zone. Limnol. Oceanogr. 1995, 40, 159–164. [Google Scholar] [CrossRef]
- Huo, S.; Jin, M.; Liang, X. Impacts of low-permeability clay lens in vadose zone onto rainfall infiltration and groundwater recharge using numerical simulation of variably saturated flow. J. Jilin Univ. 2013, 43, 1579–1587. [Google Scholar]
- Fischer, H.; Kloep, F.; Wilzcek, S.; Pusch, M.T. A River’s Liver—Microbial Processes within the Hyporheic Zone of a Large Lowland River. Biogeochemistry 2005, 76, 349–371. [Google Scholar] [CrossRef]
- Angermann, L.; Krause, S.; Lewandowski, J. Application of heat pulse injections for investigating shallow hyporheic flow in a lowland river. Water Resour. Res. 2012, 48. [Google Scholar] [CrossRef]
- Fernald, A.G.; Landers, D.H.; Wigington, P.J. Water quality changes in hyporheic flow paths between a large gravel bed river and off-channel alcoves in Oregon, USA. River Res. Appl. 2006, 22, 1111–1124. [Google Scholar] [CrossRef]
- Gandy, C.J.; Smith, J.W.; Jarvis, A.P. Attenuation of mining-derived pollutants in the hyporheic zone: A review. Sci. Total Environ. 2007, 373, 435–446. [Google Scholar] [CrossRef] [PubMed]
- Baker, M.A.; Valett, H.M.; Dahm, C.N. Organic Carbon Supply and Metabolism in a Shallow Groundwater Ecosystem. Ecology 2000, 81, 3133–3148. [Google Scholar] [CrossRef]
- Battin, T.J.; Kaplan, L.A.; Denis, N.J.; Hansen, C.M. Contributions of microbial biofilms to ecosystem processes in stream mesocosms. Nature 2003, 426, 439–442. [Google Scholar] [CrossRef] [PubMed]
- Boulton, A.J.; Findlay, S.; Marmonier, P.; Stanley, E.H.; Valett, H.M. The Functional Significance of the Hyporheic Zone in Streams and Rivers. Annu. Rev. Ecol. Syst. 2003, 29, 59–81. [Google Scholar] [CrossRef]
- Brunke, M.; Gonser, T. The ecological significance of exchange processes between rivers and groundwater. Freshw. Biol. 1997, 37, 1–33. [Google Scholar] [CrossRef]
- Boano, F.; Revelli, R.; Ridolfi, L. Effect of streamflow stochasticity on bedform-driven hyporheic exchange. Adv. Water Resour. 2010, 33, 1367–1374. [Google Scholar] [CrossRef]
- Elliott, A.H.; Brooks, N.H. Transfer of nonsorbing solutes to a streambed with bed forms: Laboratory experiments, Allyn and Bacon. Water Resour. Res. 1997, 33, 137–151. [Google Scholar] [CrossRef]
- Fox, A.; Boano, F.; Arnon, S. Impact of losing and gaining streamflow conditions on hyporheic exchange fluxes induced by dune-shaped bed forms. Water Resour. Res. 2014, 50, 1895–1907. [Google Scholar] [CrossRef]
- Hester, E.T.; Young, K.I.; Widdowson, M.A. Mixing of surface and groundwater induced by riverbed dunes: Implications for hyporheic zone definitions and pollutant reactions. Water Resour. Res. 2013, 49, 5221–5237. [Google Scholar] [CrossRef]
- Marzadri, A.; Tonina, D.; Bellin, A.; Valli, A. Mixing interfaces, fluxes, residence times and redox conditions of the hyporheic zones induced by dune-like bedforms and ambient groundwater flow. Adv. Water Resour. 2015, 88, 139–151. [Google Scholar] [CrossRef]
- Schornberg, C.; Schmidt, C.; Kalbus, E.; Fleckenstein, J.H. Simulating the effects of geologic heterogeneity and transient boundary conditions on streambed temperatures—Implications for temperature-based water flux calculations. Adv. Water Resour. 2010, 33, 1309–1319. [Google Scholar] [CrossRef]
- Zhou, Y.; Ritzi, R.W., Jr.; Soltanian, M.R.; Dominic, D.F. The Influence of Streambed Heterogeneity on Hyporheic Flow in Gravelly Rivers. Ground Water 2014, 52, 206–216. [Google Scholar] [CrossRef] [PubMed]
- Ghysels, G.; Benoit, S.; Awol, H.; Jensen, E.P.; Tolche, A.D.; Anibas, C.; Huysmans, M. Characterization of meter-scale spatial variability of riverbed hydraulic conductivity in a lowland river (Aa River, Belgium). J. Hydrol. 2018, 559, 1013–1027. [Google Scholar] [CrossRef]
- Irvine, D.J.; Cranswick, R.H.; Simmons, C.T.; Shanafield, M.A.; Lautz, L.K. The effect of streambed heterogeneity on groundwater-surface water exchange fluxes inferred from temperature time series. Water Resour. Res. 2015, 51, 198–212. [Google Scholar] [CrossRef]
- Liu, S.; Chui, T. Impacts of Streambed Heterogeneity and Anisotropy on Residence Time of Hyporheic Zone. Ground Water 2018, 56, 425–436. [Google Scholar] [CrossRef] [PubMed]
- Sawyer, A.H.; Cardenas, M.B. Hyporheic flow and residence time distributions in heterogeneous cross-bedded sediment. Water Resour. Res. 2009, 45. [Google Scholar] [CrossRef]
- Tonina, D.; Barros, F.P.J.D.; Marzadri, A.; Bellin, A. Does streambed heterogeneity matter for hyporheic residence time distribution in sand-bedded streams? Adv. Water Resour. 2016, 96, 120–126. [Google Scholar] [CrossRef]
- Bosch, D.D.; Truman, C.C.; Davis, F.M. Vadose zone clay lens impacts on groundwater loading rates. In Proceedings of the International Symposium, Preferential Flow: Water Movement and Chemical Transport in the Environment, Honolulu, HI, USA, 3–5 January 2001. [Google Scholar]
- Packman, A.I.; Mackay, J.S. Interplay of stream-subsurface exchange, clay particle deposition, and streambed evolution. Water Resour. Res. 2003, 39, 122–137. [Google Scholar] [CrossRef]
- Reynolds, D.A.; Kueper, B.H. Multiphase flow and transport in fractured clay/sand sequences. J. Contam. Hydrol. 2001, 51, 41–62. [Google Scholar] [CrossRef]
- San, K.W.E.; Rowe, R.K. Effect of sand lenses on groundwater flow and contaminant migration. Int. J. Numer. Anal. Methods Geomech. 2010, 17, 217–241. [Google Scholar] [CrossRef]
- Fox, A.; Laube, G.; Schmidt, C.; Fleckenstein, J.H.; Arnon, S. The effect of losing and gaining flow conditions on hyporheic exchange in heterogeneous streambeds. Water Resour. Res. 2016, 52, 7460–7477. [Google Scholar] [CrossRef]
- Su, X.; Shu, L.; Lu, C. Impact of a low-permeability lens on dune-induced hyporheic exchange. Hydrol. Sci. J. 2018, 63, 818–835. [Google Scholar] [CrossRef]
- Cardenas, M.B.; Zlotnik, V.A. A Simple Constant-Head Injection Test for Streambed Hydraulic Conductivity Estimation. Ground Water 2003, 41, 867–871. [Google Scholar] [CrossRef] [PubMed]
- Landon, M.K.; Rus, D.L.; Harvey, F.E. Comparison of instream methods for measuring hydraulic conductivity in sandy streambeds. Ground Water 2001, 39, 870–885. [Google Scholar] [CrossRef] [PubMed]
- Ren, J.; Packman, A.I. Coupled stream-subsurface exchange of colloidal hematite and dissolved zinc, copper, and phosphate. Environ. Sci. Technol. 2005, 39, 6387–6394. [Google Scholar] [CrossRef] [PubMed]
- Elliott, A.H.; Brooks, N.H. Transfer of nonsorbing solutes to a streambed with bed forms: Theory. Water Resour. Res. 1997, 33, 123–136. [Google Scholar] [CrossRef]
- Cardenas, M.B.; Wilson, J.L. Exchange across a sediment–water interface with ambient groundwater discharge. J. Hydrol. 2007, 346, 69–80. [Google Scholar] [CrossRef]
- Zaramella, M.; Packman, A.I.; Marion, A. Application of the transient storage model to analyze advective hyporheic exchange with deep and shallow sediment beds. Water Resour. Res. 2003, 39, 3538–3540. [Google Scholar] [CrossRef]
- Boano, F.; Revelli, R.; Ridolfi, L.; Krause, S.; Hannah, D.M.; Fleckenstein, J.H. Quantifying the impact of groundwater discharge on the surface-subsurface exchange. Hydrol. Process. 2009, 23, 2108–2116. [Google Scholar] [CrossRef]
- Cranswick, R.H.; Cook, P.G.; Lamontagne, S. Hyporheic zone exchange fluxes and residence times inferred from riverbed temperature and radon data. J. Hydrol. 2014, 519, 1870–1881. [Google Scholar] [CrossRef]
- Bardini, L.; Boano, F.; Cardenas, M.B.; Sawyer, A.H.; Revelli, R.; Ridolfi, L. Small-scale permeability heterogeneity has negligible effects on nutrient cycling in streambeds. Geophys. Res. Lett. 2013, 40, 1118–1122. [Google Scholar] [CrossRef]
- Bhaskar, A.S.; Harvey, J.W.; Henry, E.J. Resolving hyporheic and groundwater components of streambed water flux using heat as a tracer. Water Resour. Res. 2012, 48, 1076. [Google Scholar] [CrossRef]
- Cardenas, M.B. Stream-aquifer interactions and hyporheic exchange in gaining and losing sinuous streams. Water Resour. Res. 2009, 45, 267–272. [Google Scholar] [CrossRef]
- Jin, G.Q.; Li, L. Advancement in the hyporheic exchange in rivers. Adv. Water Sci. 2008, 19, 285–293. [Google Scholar]
- Gomez-Velez, J.D.; Krause, S.; Wilson, J.L. Effect of low-permeability layers on spatial patterns of hyporheic exchange and groundwater upwelling. Water Resour. Res. 2014, 50, 5196–5215. [Google Scholar] [CrossRef]
- Wagner, F.H.; Bretschko, G. Interstitial flow through preferential flow paths in the hyporheic zone of the Oberer Seebach, Austria. Aquat. Sci. 2002, 64, 307–316. [Google Scholar] [CrossRef]


| L (m) | |||||||||||
|---|---|---|---|---|---|---|---|---|---|---|---|
| −0.125 | −0.1 | −0.075 | −0.05 | −0.025 | 0 | 0.025 | 0.05 | 0.075 | 0.1 | ||
| d (m) | 0.05 | N1 | |||||||||
| 0.075 | N2 | N3 | N4 | N5 | |||||||
| 0.1 | N6 | N7 | N8 | N9 | N10 | N11 | |||||
| 0.125 | N12 | N13 | N14 | N15 | N16 | N17 | N18 | N19 | N20 | N21 | |
| 0.15 | N22 | N23 | N24 | ||||||||
| Blank Control (no clay lens) | N25 | ||||||||||
| L (m) | |||||||||||
|---|---|---|---|---|---|---|---|---|---|---|---|
| −0.125 | −0.1 | −0.075 | −0.05 | −0.025 | 0 | 0.025 | 0.05 | 0.075 | 0.01 | ||
| d (m) | 0.05 | 550 | |||||||||
| 0.075 | 99 | 424 | 477 | 302 | |||||||
| 0.1 | 781 | 316 | 592 | 1227 | 470 | 336 | |||||
| 0.125 | 625 | 895 | 441 | 359 | 760 | 846 | 302 | 169 | 255 | 542 | |
| 0.15 | 81 | 656 | 48 | ||||||||
| Blank Control (no clay lens) | 822 | ||||||||||
© 2018 by the authors. Licensee MDPI, Basel, Switzerland. This article is an open access article distributed under the terms and conditions of the Creative Commons Attribution (CC BY) license (http://creativecommons.org/licenses/by/4.0/).
Share and Cite
Lu, C.; Yao, C.; Su, X.; Jiang, Y.; Yuan, F.; Wang, M. The Influences of a Clay Lens on the Hyporheic Exchange in a Sand Dune. Water 2018, 10, 826. https://doi.org/10.3390/w10070826
Lu C, Yao C, Su X, Jiang Y, Yuan F, Wang M. The Influences of a Clay Lens on the Hyporheic Exchange in a Sand Dune. Water. 2018; 10(7):826. https://doi.org/10.3390/w10070826
Chicago/Turabian StyleLu, Chengpeng, Congcong Yao, Xiaoru Su, Yong Jiang, Feifei Yuan, and Maomei Wang. 2018. "The Influences of a Clay Lens on the Hyporheic Exchange in a Sand Dune" Water 10, no. 7: 826. https://doi.org/10.3390/w10070826
APA StyleLu, C., Yao, C., Su, X., Jiang, Y., Yuan, F., & Wang, M. (2018). The Influences of a Clay Lens on the Hyporheic Exchange in a Sand Dune. Water, 10(7), 826. https://doi.org/10.3390/w10070826