1. Introduction
In Southern China, the municipal wastewater is low in carbon, which limits nitrogen removal efficiency during biotreatment due to a lack of carbon source. Several methods have been used for treating low-carbon urban sewage, including external carbon source addition [
1,
2,
3] and some new biological nitrogen removal technologies such as Anammox and SND via nitrite [
4,
5,
6,
7,
8]. However, an additional carbon source could increase the operational costs and the carbon footprint. Anammox technology has a slow start-up and poor stability of partial nitrification. Simultaneous nitrification and denitrification (SND) is an attractive pathway for nitrogen reduction in comparison with the traditional method because of saving carbon source and reducing aeration consumption [
9,
10,
11]. Zhao et al. [
12] found that the nitrogen loss due to SND in the aeration tank contributed 10% to 50% of the total Kjeldahl nitrogen to the overall nitrogen removal. Furthermore, it has been reported that DO, pH, C/N ratio, reaction time, and microbial floc structure greatly influence the performance of SND process [
13,
14,
15,
16]. Additionally, the solid carbon source has many advantages compared with the traditional liquid carbon source [
17,
18]. In recent years, some scholars have used the insoluble carbon source (also known as the solid carbon source) as an additional carbon source for removing nitrogen from municipal wastewater [
19,
20]. Effects of solid carbon on denitrification process were studied and the removal efficiency of total nitrogen was below 83% [
21]. As shown in our previous research [
22], a loofah sponge was a good solid carbon source in the SND process and could also be used as a biofilm carrier. The results showed that the TN removal efficiency in startup of the reactor was 70%. It is necessary to improve the nitrogen efficiency of solid carbon source SND.
The response surface methodology (RSM) is the product of a combination of mathematics and statistics, and was proposed by Box and Wilson in 1951. The methodology is especially useful when the response value is affected by a number of variables. The purpose is to investigate the relationship between various variables and the response value, and to finally optimize the response value [
23]. The RSM has been widely used in modeling, analysis, and optimization of scientific fields [
24,
25]. It has been successfully applied to optimize the solutions of a variety of biological processes in the design of statistical experiments [
26,
27]. Currently, RSM is widely used in bio-chemical, meteorological, and other industries [
28,
29,
30]. The use of RSM method is scarce in the field of water treatment, and is mainly concentrated in studies involving coagulation and sludge-mixed urban wastewater treatment [
31,
32,
33,
34,
35]. However, to the best of our knowledge, the optimization of the efficiency of nitrogen removal in SND involving solid carbon source has not been reported in the literature.
In the present study, an SBBR containing a loofah sponge was used to enhance the efficiency of nitrogen removal in low-carbon municipal wastewater. The effects of five different factors, DO, water pH, filling ratio, reaction time, and C/N ratio, on the efficiency of nitrogen removal were studied. Finally, RSM was used to optimize the values of the three most influencing factors for the wastewater treatment system.
2. Materials and Methods
2.1. Experimental Materials and Devices
Loofah sponges were purchased from a farmers’ market in Guangzhou, China. The impurities were removed, and the sponge was cut into square blocks with a length of 2 cm (
Figure 1). The sponge was dried at 105 °C and then preserved in the refrigerator after cooling down. The inoculated sludge was obtained from the concentration tank of Lijiao Wastewater Treatment Plant in Guangzhou City, China. The concentrated sludge was filtered to remove the impurities, and added to the reactor after settling for 1 h.
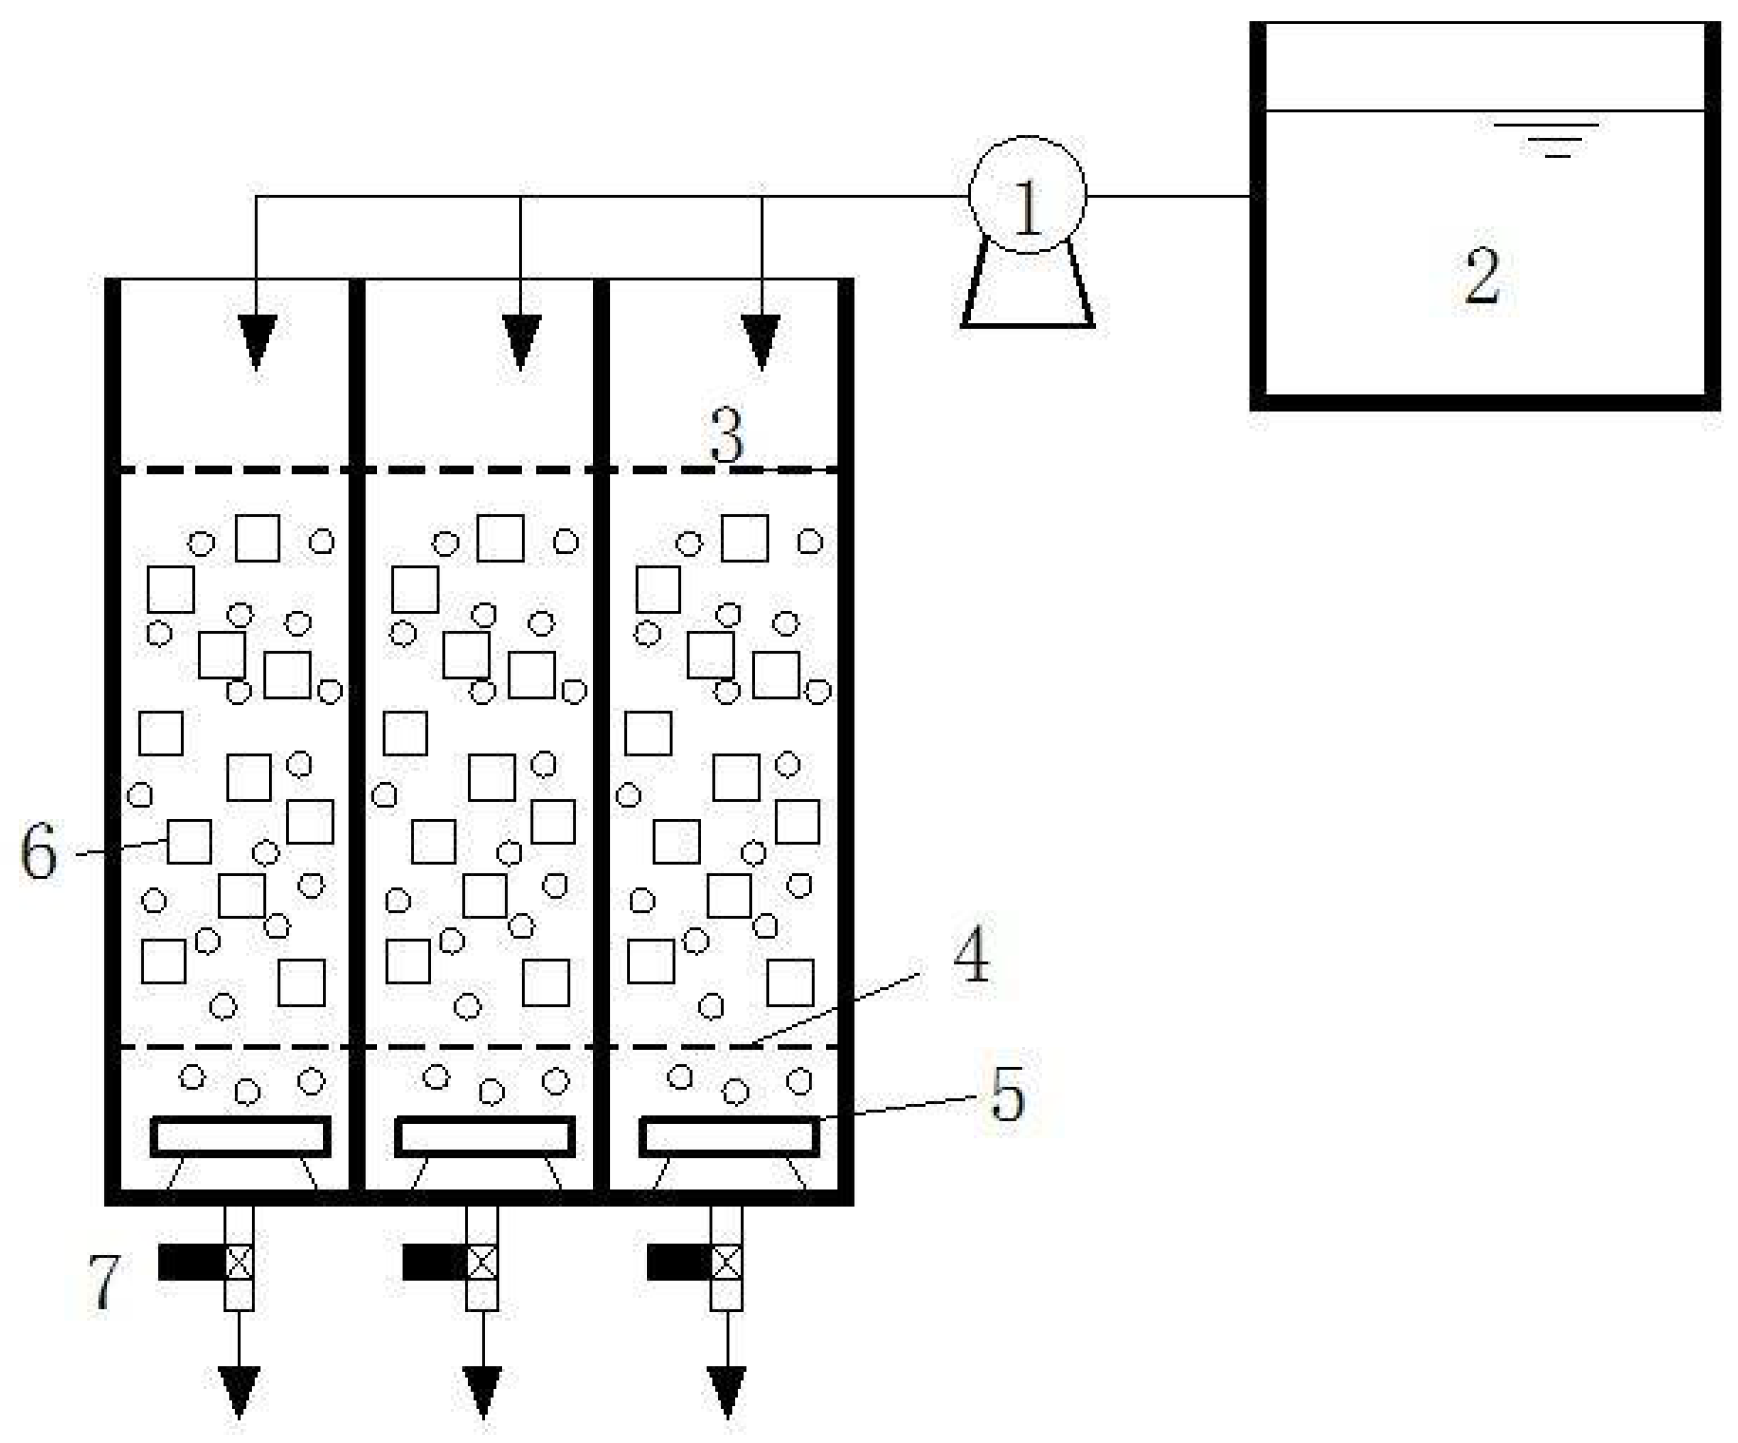
SBBR was made of organic glass and had three compartments. The effective volume was 6 L. The schematic of SBBR is shown in
Figure 2.
The experiments were carried out in a laboratory in Guangzhou University and lasted for eight months (April to December 2016).
2.2. Sample Analysis
The synthetic water was used as an influent for SBBR, which was prepared in the laboratory and had the same characteristics as those of the municipal sewage in Guangzhou, China [
36]. The characteristics of the synthetic sample are given in
Table 1. Trace elements (magnesium sulfate, calcium chloride, ferrous sulfate, and sodium bicarbonate, etc.) were used as nutrients. Glucose was used as the carbon source, whereas ammonium chloride and potassium hydrogen phosphate were used as the nitrogen and phosphorus sources, respectively.
The wastewater sample was analyzed based upon the methods detailed in Water and Wastewater Monitoring and Analysis Method (4th edition), which was published by China Environmental Science press [
37].
2.3. Experimental Design
While studying the effects of various factors, it was observed that some factors significantly affected the efficiency of nitrogen removal, while others had a relatively weak effect. The former were defined as significantly influencing factors, while the latter were defined as insignificantly influencing factors. The factors were screened before applying RSM, so that only the significantly influencing factors were considered in RSM. In the current work, the effects of DO, pH, filling ratio, reaction time, and C/N ratio were studied individually before being screened for further optimization using RSM. The ranges of each factor were as follows: filling ratio from 20% to 40%, DO from 1 to 6 mg/L, pH from 6.0 to 8.0, C/N ratio from 0 to 10, and aeration time from 0 to 10 h. It should be noted that the pH value of the influent was adjusted by hydrochloric acid and sodium bicarbonate, and the C/N ratio was the ratio between CODCr and TN. That the C/N ratio was 0 meant no carbon source was added to the influent, i.e., CODCr was 0 in synthetic water.
2.3.1. Experimental Design for Studying Individual Factors
The effect of each factor on the nitrogen removal process was analyzed under room temperature (the average temperature was about 25 °C). The operating cycle of SBBR for each factor was same, which consisted of four steps, instantaneous filling, 10 h of aerobic aeration, 1 h of sedimentation process, and decanting (100% replacement of drainage). After the reactor startup (about 21 cycles) [
22], the effect of each factor was studied individually while keeping all other parameters constant. To study the effect of each factor, the reactor was run under stable conditions for at least five days. More than 15 effluent samples were conducted for studying the effect of each factor, and average values were used for further analysis. The experimental conditions used for studying the effect of each factor are shown in
Table 2.
2.3.2. Modeling Established by RSM
The model of RSM was established and the experimental data were analyzed using Minitab R16 software. The model was set according to the Box–Behnken design. The significantly influencing factors were selected through the results of single-factor experiments, and used as independent variables in the modeling. In order to conveniently analyze the model, the low, medium, and high experimental levels for each factor were encoded as −1, 0, and 1, respectively. The total nitrogen (TN) removal efficiency was used as the response value R.
According to the design method of RSM, different series of independent variable combinations were obtained. Under the conditions of each combination, experiments were carried out to achieve TN removal efficiency. Moreover, five tests were performed as replicates to decrease the practical error; the average values were used as R values for each series.
2.3.3. Analysis Method of RSM
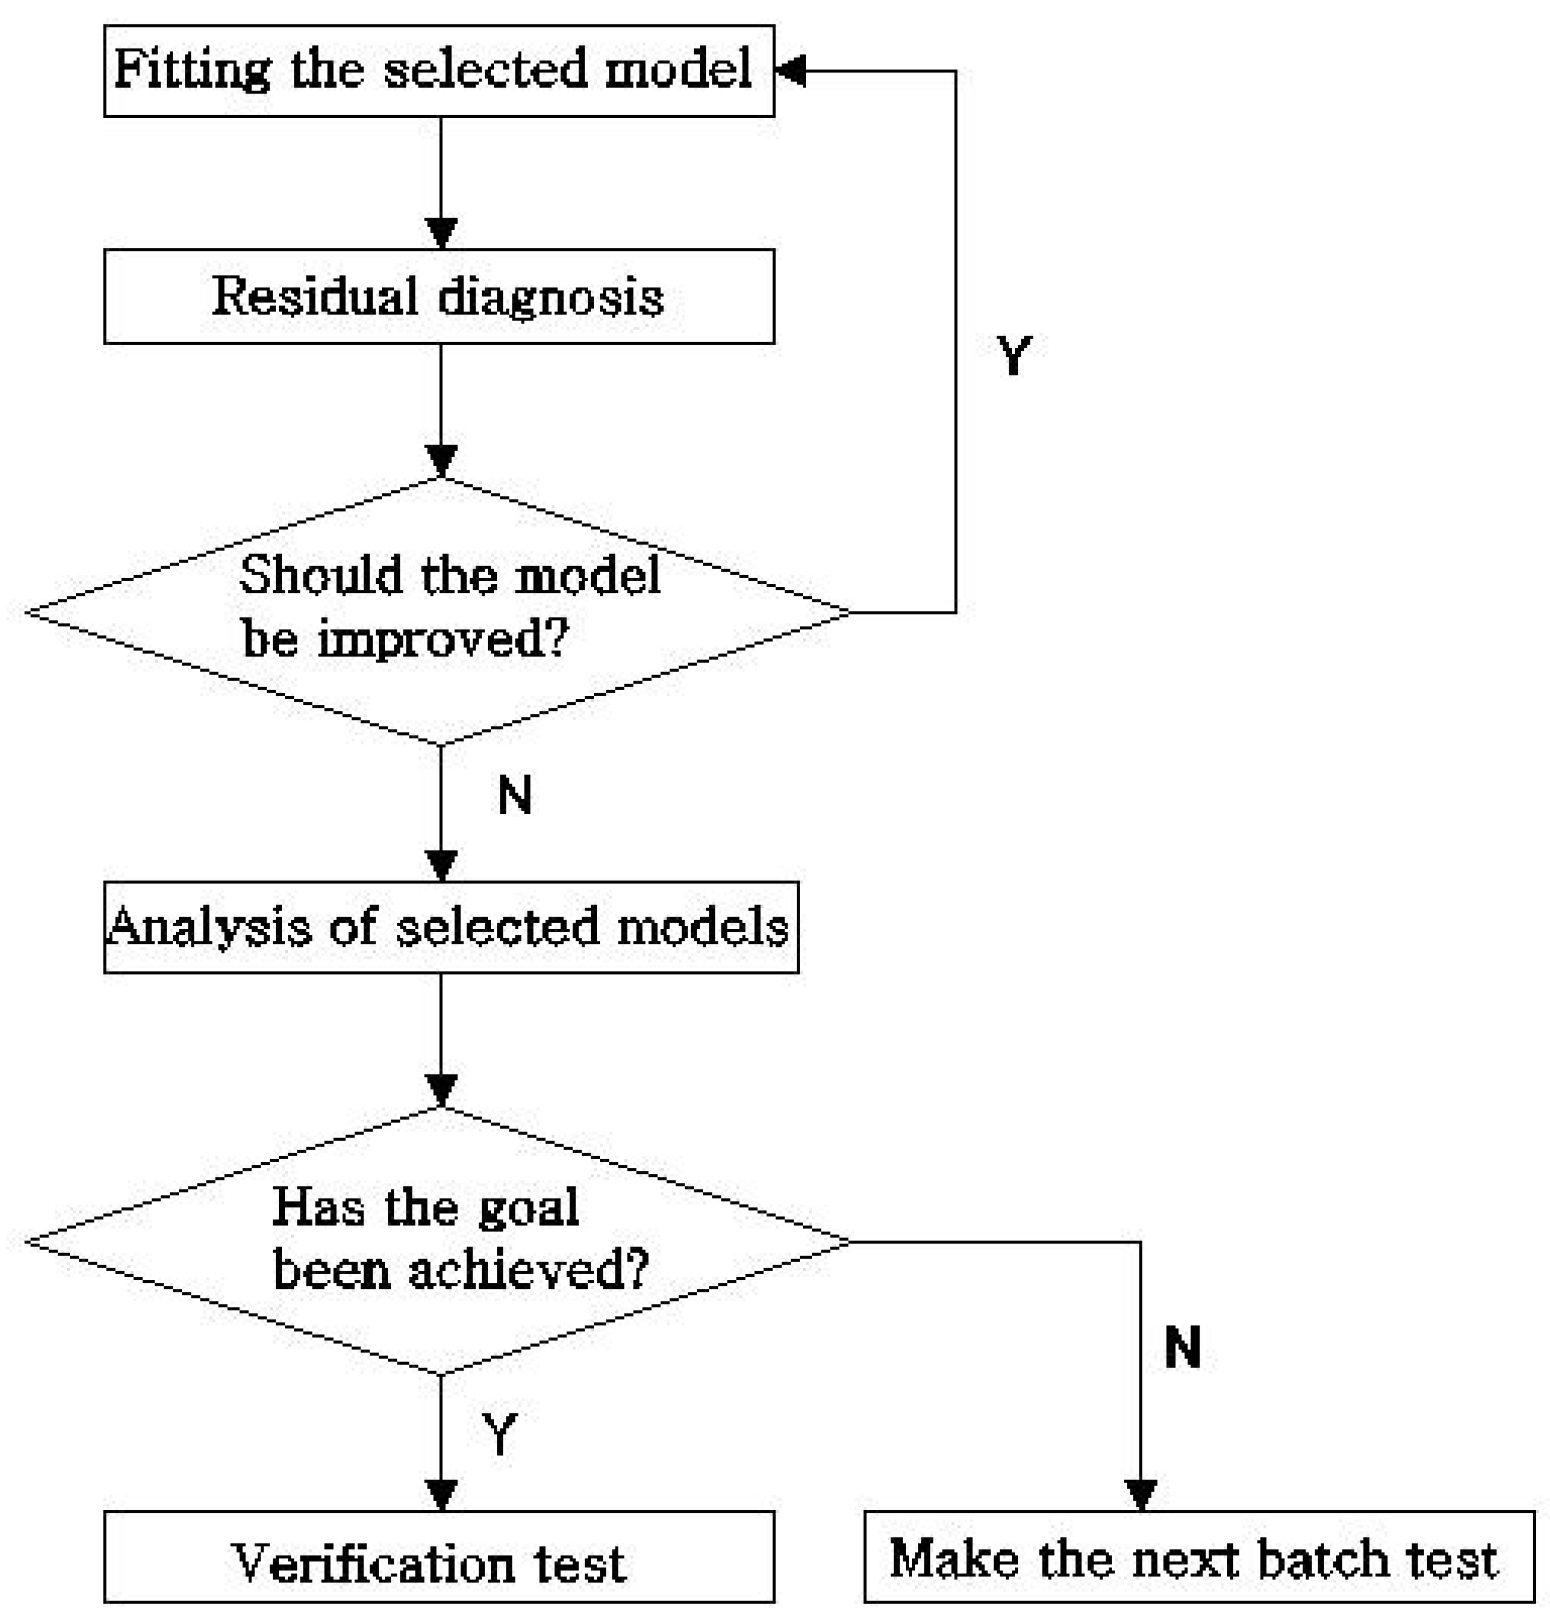
The analysis process was divided into five parts, namely the fitting of the selected model, performing the residual diagnosis, improving the model, explaining the selected model, and conducting a verification test to confirm the target was achieved. The analysis process was presented in
Figure 3.
Finally, a stable and reliable model can be obtained. The model was used to optimize the nitrogen removal efficiency in solid carbon source SND process, and the combination of factors to achieve the optimized nitrogen removal was obtained by RSM.
3. Results and Discussion
3.1. Single Factor Test Analysis
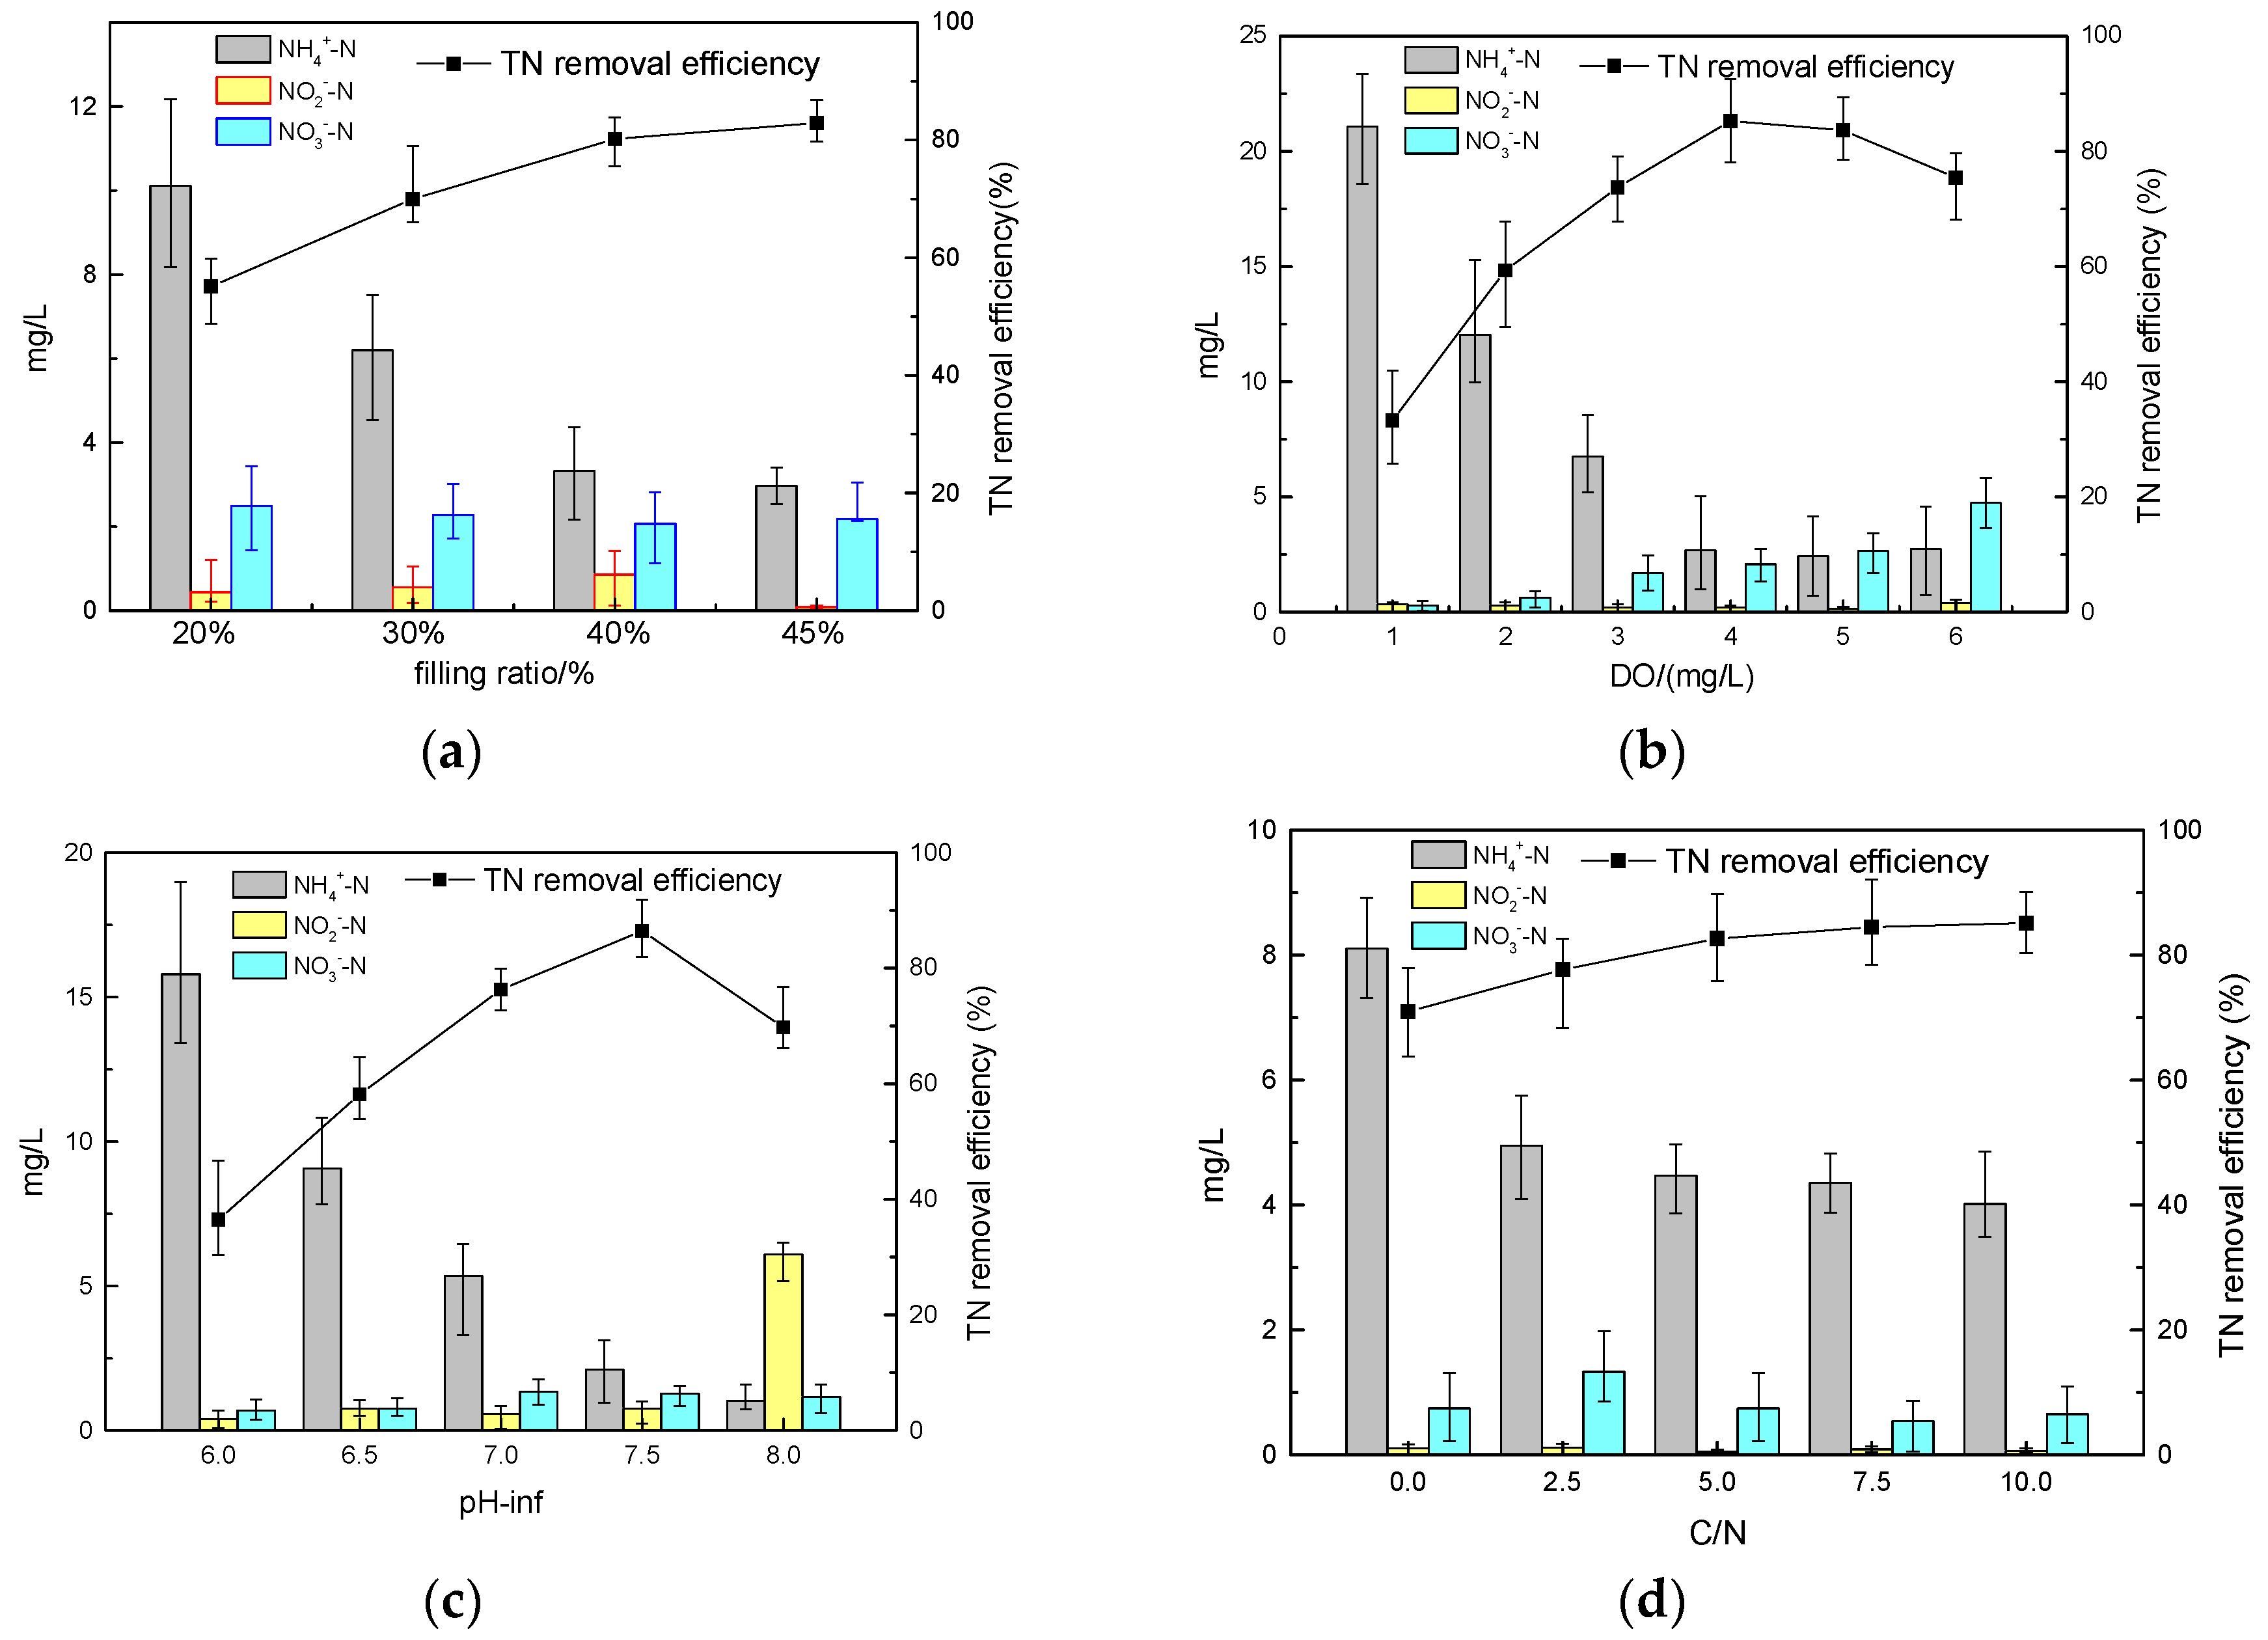
As shown in
Figure 4a, the average TN removal rate increased with the increase of filling ratio. The highest average TN removal efficiency was obtained when the filling rate was 40%. With the increase of filling ratio to 45%, the TN removal efficiency tended to stabilize. That is, after 40%, the filling ratio affected TN removal efficiency insignificantly.
Figure 4b,c showed that, when DO and pH value were about 4.0 mg/L and 7.5, respectively, the highest nitrogen removal efficiency was achieved. Both DO and pH variance affected the nitrogen removal efficiency significantly. Therefore, both DO and pH were categorized as significantly influencing factors.
It could be seen from
Figure 4d that the C/N ratio had little effect on the TN removal efficiency. The average TN removal was around 69.8% when the C/N ratio was 0, while under other C/N ratios no significant difference was observed in TN removal efficiency (80–85%). Thus, C/N was not considered a significantly influencing factor. This also demonstrated that a loofah sponge could supply enough carbon for a biofilm; even with no carbon source in the influent (C/N was 0), TN removal efficiency could reach nearly 70%.
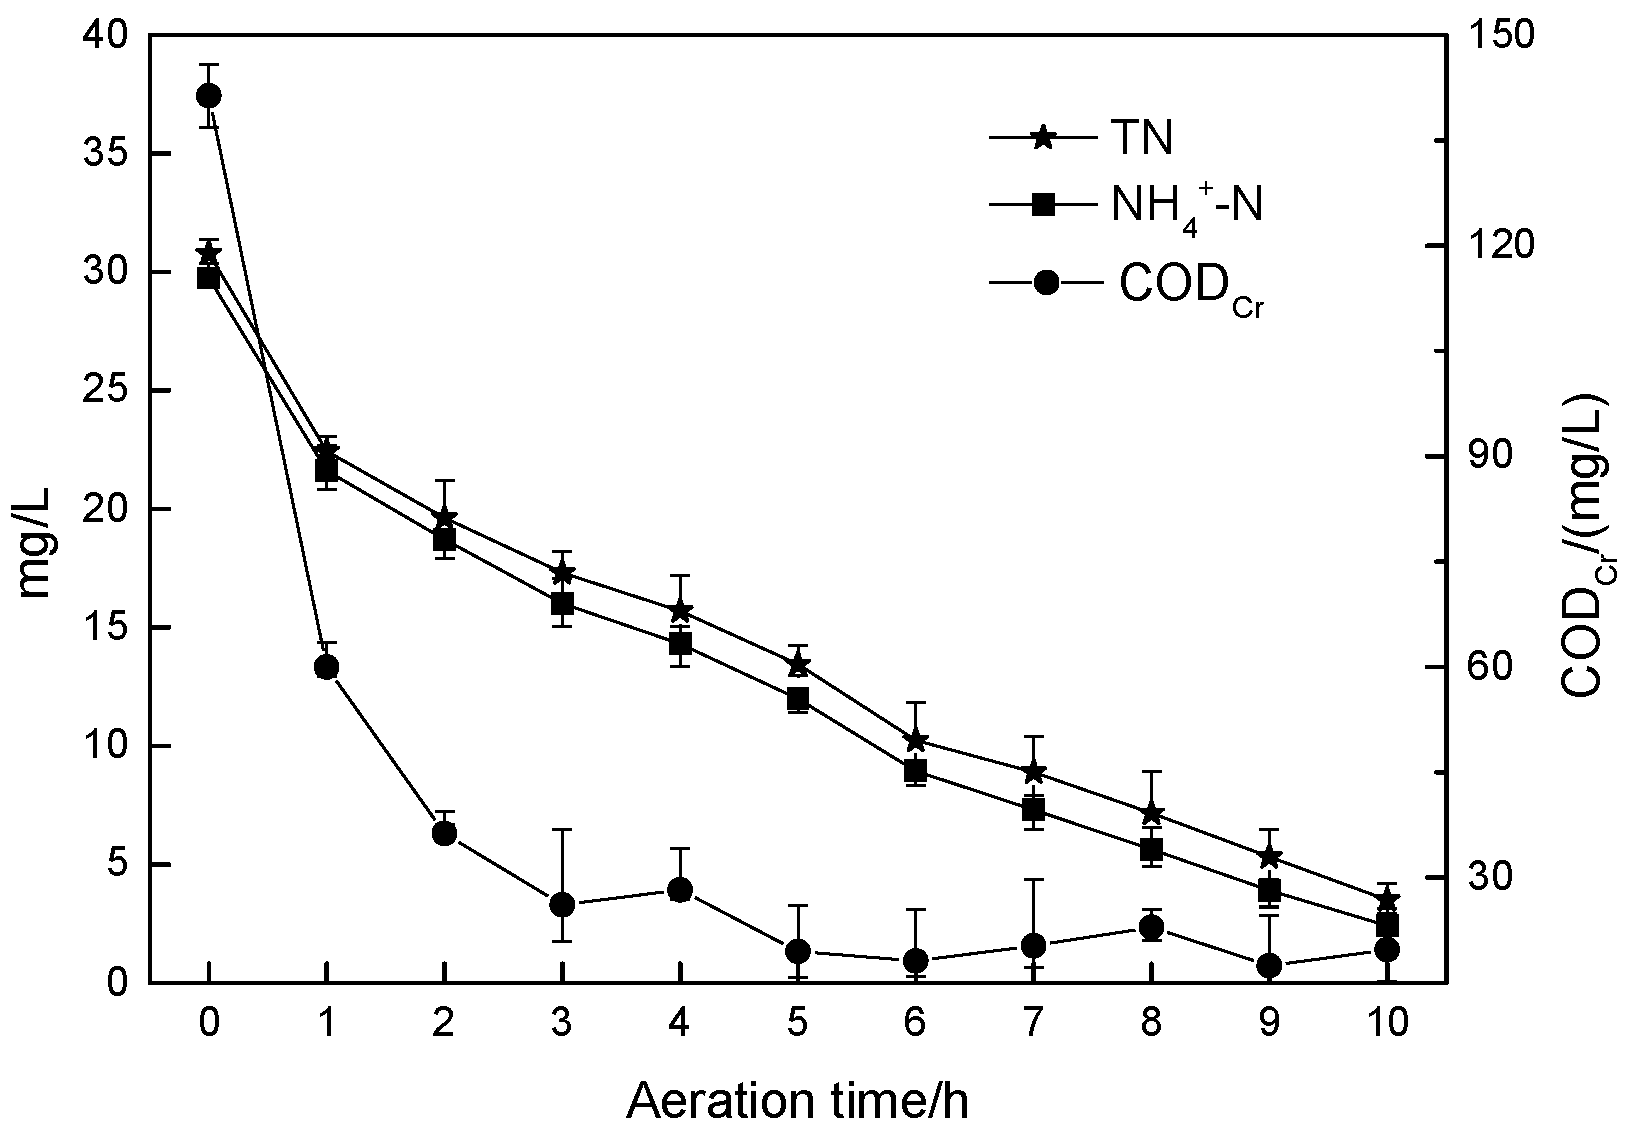
As shown in
Figure 5, the aeration time was a significant influencing factor for the removal efficiency of TN. At the 9th hour, the average concentrations of NH
4+–N and TN were less than 5 mg/L and 7.17 mg/L, respectively, which met with class IA of the Chinese discharge regulations [
38].
It should be noted that the content of CODCr was lower than 30 mg/L at the 3rd hour, after which the content of CODCr was found to be in dynamic balance and remained stable at around 20 mg/L. These phenomena indicated that the treatment of low-carbon municipal sewage by solid carbon source does not involve a high concentration of effluent CODCr.
All these results have shown that DO, pH, and aeration time are significantly influential factors on TN removal and are also considered independent variables in the RSM model.
3.2. RSM Analysis
What distinguishes RSM from the general test design method is the option of a regression equation. The quadratic surface was fitted using the RSM model. The basic principle of the RSM model is that the quadratic polynomial equation was fitted using the least squares method. The regression equation of RSM model is represented by Equation (1):
where “
R” is the response value,
xi, and
xj (
i ≠
j) are the independent variables, and
a0,
ai,
aj, and
aij (
i ≠
j) are the constants.
3.2.1. Selection and Determination of the Analysis
Based upon the analysis of individual factors, DO, influent pH, and reaction time were taken as the independent variables in the RSM model. On the basis of Box–Behnken test design principle, the independent variables were encoded as low (−1), medium (0), and high (1) experimental levels. The TN removal rate was taken as the response value
R.
Table 3 lists the design factors and their levels in RSM model.
3.2.2. RSM Model Establishment and Improvement
The RSM model was based on the Box–Behnken design, and was established using Minitab R16.
Table 4 lists the results from the RSM model.
Using the Minitab R16 software analysis (Version 16.1.0, Minitab Inc., State College, PA, USA), the model was improved twice, and the insignificant items of regression equations were deleted. Consequently, a reliable model was obtained, the analysis of which is listed in
Table 5.
As shown in
Table 5,
PR = 0, which shows that the model was effective in general. The
PLack of fit = 0.344 is much higher than 0.05, indicating that the model did not cause any mismatch. The coefficient of significance of regression model was R-Sq = 0.9834, which indicates that the fitting results were satisfactory. The difference between the modified model’s R-Sq and the R-Sq (adjusted) was reduced, which shows that the model became more accurate and the level of fitting was superior after the modification. The values of
S and PRESS decreased, while R-Sq (predicted) increased. These changes indicate that the overall regression process improved significantly.
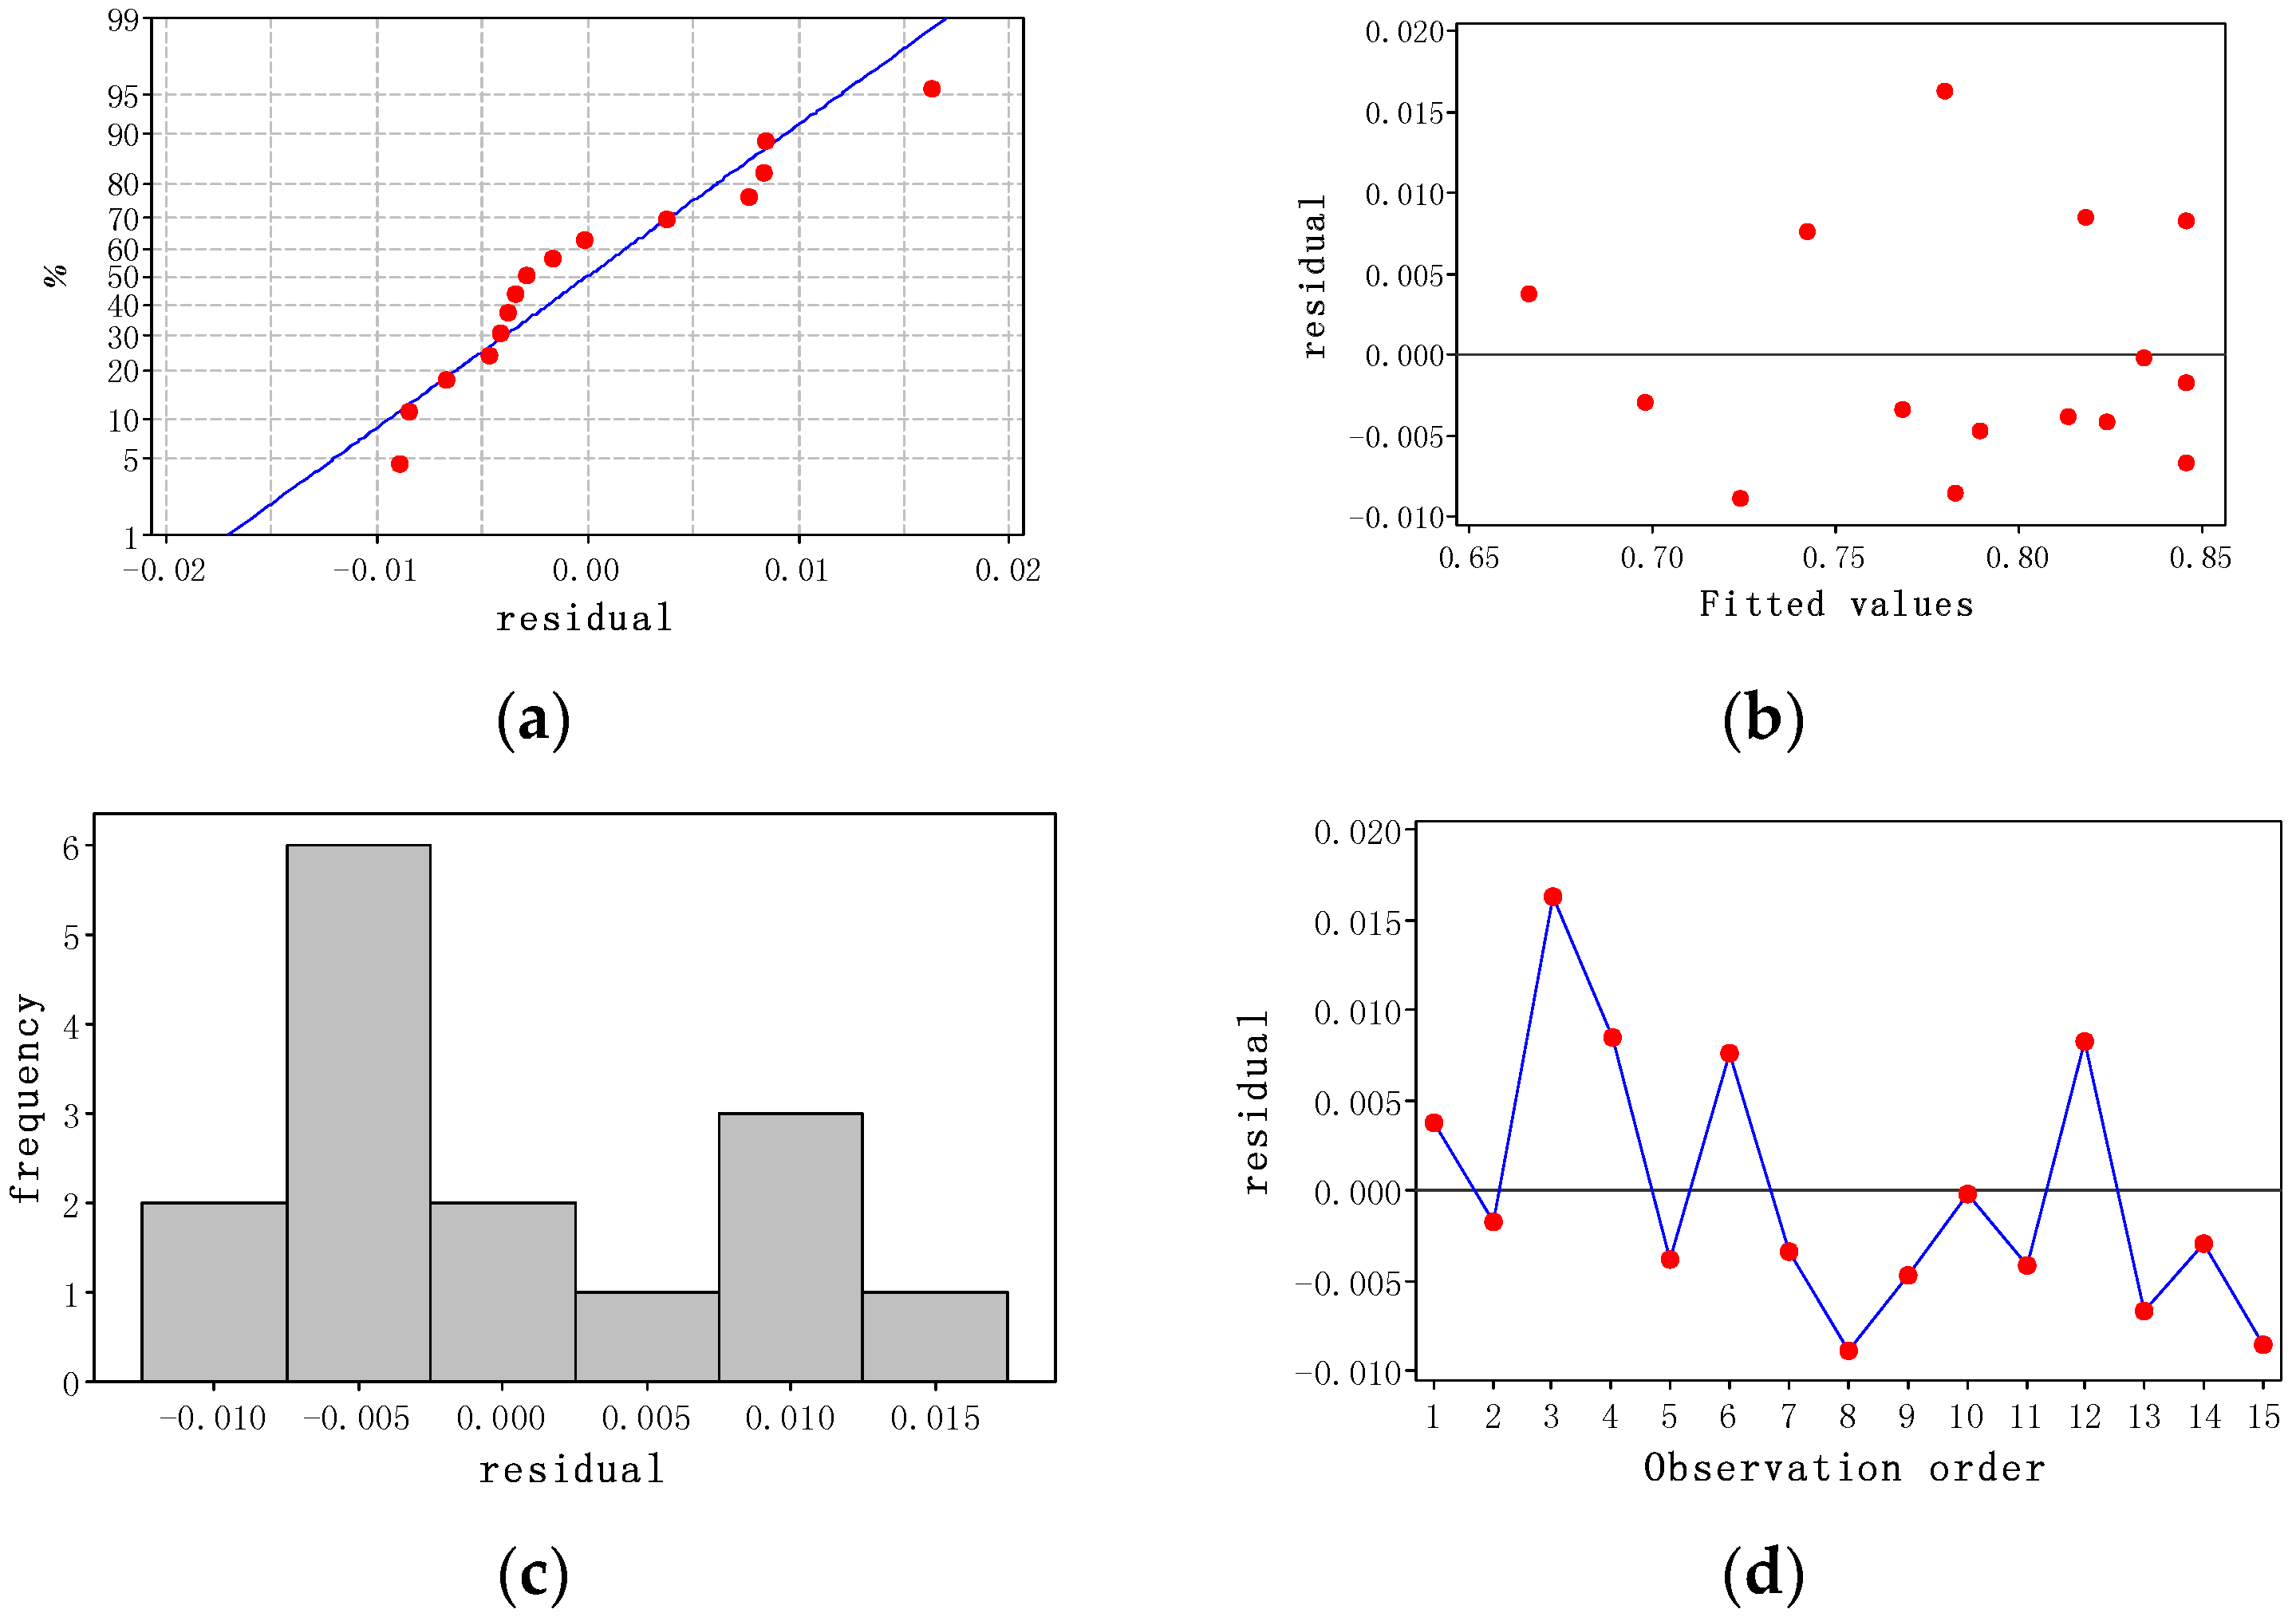
Figure 6 showed the residual diagnostic results for the improved model of TN removal. The results show that the residuals do not have any anomalies. As seen in
Figure 6a,c, the residual distribution conformed to the normal distribution.
Figure 6b showed that the residual distribution did not appear obvious “funnel-shaped” or “trumpet-shaped.”
Figure 6d is a scatter diagram of the residuals with the observation sequence as horizontal axis, and it could be seen that the residuals fluctuated irregularly along the horizontal axis and there was no obvious “U” shape or “inverted U” shape. It is concluded that the error in the model mainly consisted of systematic error, and was within the acceptable range. Therefore, the model can be used to analyze and predict the TN removal efficiency of low-carbon municipal wastewater treated with a solid carbon source through SND technology.
Table 6 lists the regression coefficients of the quadratic polynomial regression equations of the model and the
p values corresponding to the regression coefficients.
The results presented in
Table 6 show that the
p value of each coefficient was less than 0.05, which indicated that, in the quadratic polynomial regression equation of the model, each had a significant impact on the response value
R. The quadratic polynomial regression equation of the model is represented by Equation (2):
where “
A” stands for DO, “
B” stands for pH, and “
C” stands for the aeration time.
3.2.3. Response Surface Analysis of Nitrogen Removal Efficiency
A contour map of TN removal efficiency and the response surface graph for the regression model (
Figure 7) could be obtained using Minitab R16 software, which presented the relationship between the response variable (TN removal efficiency) and the selected main factors (DO, pH, and aeration time).
As shown in
Figure 7, the TN removal efficiency increased with the increase in aeration time, while it first increased with the increase in DO and pH, and then decreased. The results showed that the aeration time had the greatest influence on the removal efficiency of TN, followed by DO and pH. Therefore, the effects of various factors on the TN removal efficiency of SND process using a solid carbon source were found to be in the following descending order: aeration time > DO > pH. Meanwhile, within the range of the selected RSM design (DO ranging between 3.5 and 4.5 mg/L, pH ranging in 7.2–7.8, aeration time ranging between 9 and 11 h), the removal efficiency of TN had a maximum value for optimum values of DO, pH, and aeration time. The optimized TN efficiency was achieved up to 86.27%, when DO, pH, and aeration time were 4.096 mg/L, 7.5879, and 10.47 h, respectively, by Minitab R16 optimizer in RSM software.
3.2.4. Verification and Analysis
According to the best response value calculated in the RSM model, the possible variation range of this value was calculated. Then the reliability of the model was verified through several verification tests under the optimum conditions.
The Interval Estimate
There are two kinds of interval estimates. One is the confidence interval (CI), which is the prediction of the theoretical average when the number of verification tests is unlimited. The other is the prediction interval (PI), which is the prediction of a single test result. Minitab R16 automatically gives the predictive values, which are presented in
Table 7.
Table 7 shows (95% CI) is (0.849668, 0.875642), which indicates that 95% of the results fall into this interval when the test was conducted for infinite time, or the average value has a 95% probability within this interval. A single test prediction interval (95% PI) is (0.834912, 0.890398), which indicates that, when a test is carried out, the probability that the result will fall within the interval is 95%, and therefore, can be used as a short-term verification test.
Test Verification
Taking into account the errors caused by limited number of tests and uncontrollable factors, the test will be conducted several times in parallel, and the average value is taken as the experimental result for verification.
Validation tests were conducted using the Test Group 2, as listed in
Table 4. The tests were carried out according to the optimization results obtained by the model (DO = 4.09 mg/L, pH = 7.58 and aeration time = 10.47 h), the results of which are shown in
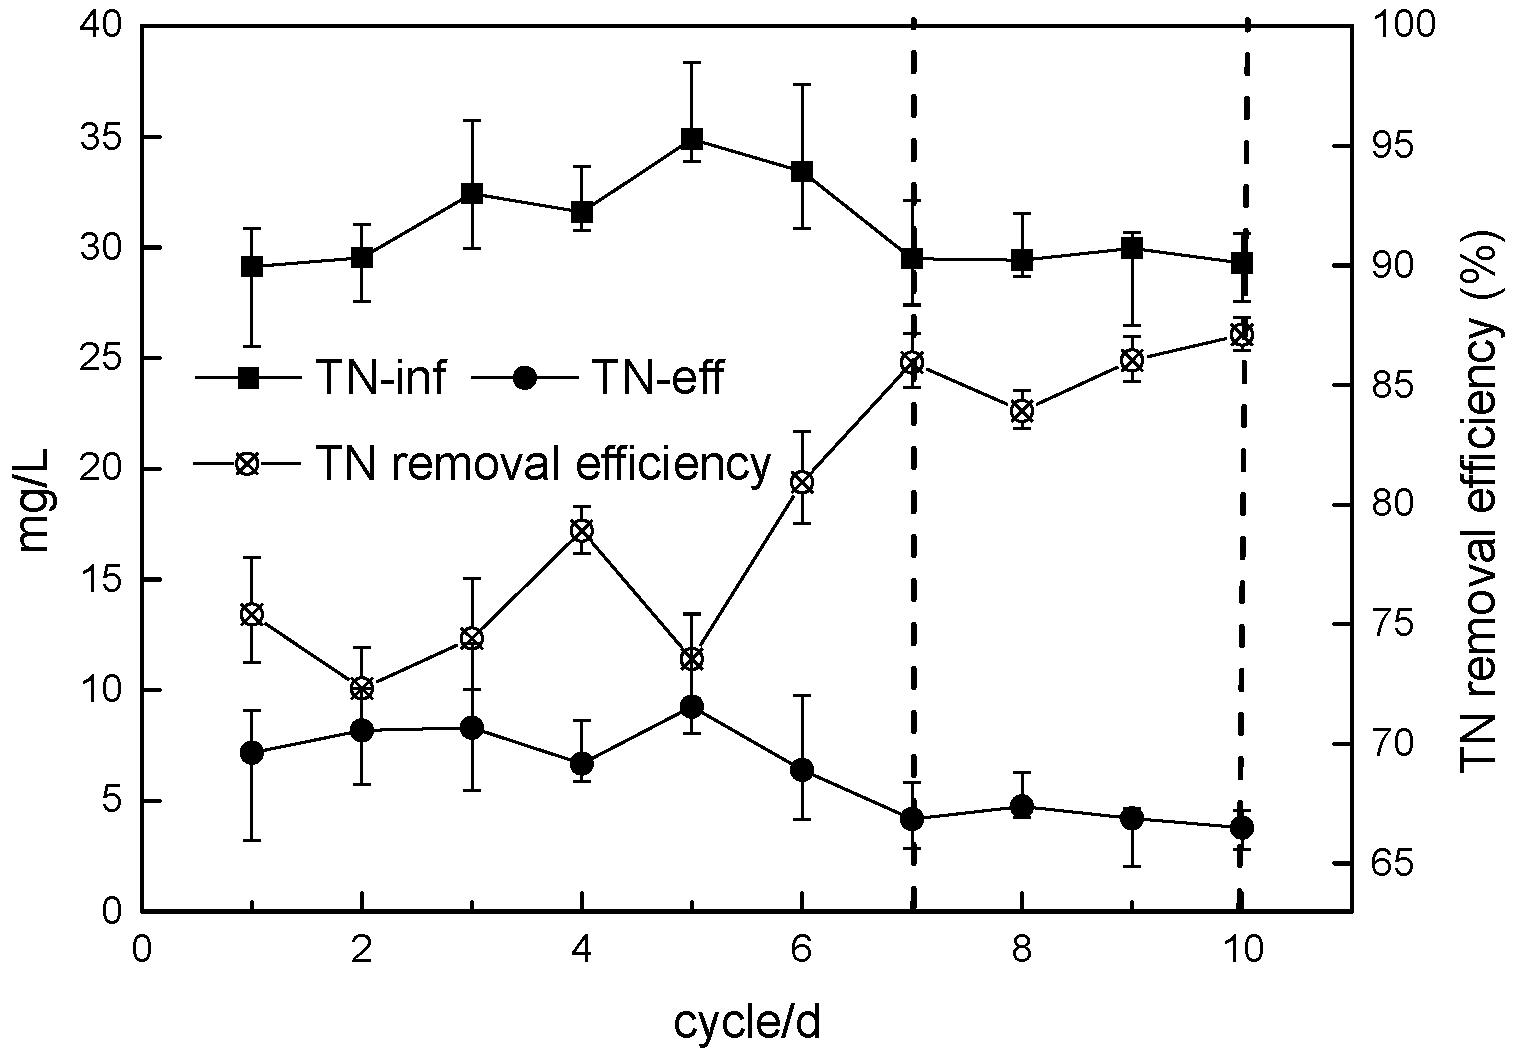
Figure 8. In the first seven cycles, microorganisms are in the adaptive stage, and the removal efficiency of TN was not up to the theoretical value. However, the removal efficiency of TN was observed to be increasing. After seven cycles, the TN removal efficiency tended to stabilize. Therefore, the removal efficiency of TN during the 7–10 cycles was used as the validation result of the test. The removal efficiencies of TN were 0.859 (7th cycle), 0.839 (8th cycle), 0.86 (9th cycle), and 0.871 (10th cycle), with an average of 0.857, which was within 95% CI. The results also showed that the deviation between the experimental and predicted TN removal efficiency (0.862) was only 0.58%.
4. Conclusions
In an individual factors study, when the filling ratio and C/N reached 40% and 2.5, respectively, the effects of filling ratio and C/N on nitrogen removal were insignificant. The effects of DO, pH, and aeration time on the removal efficiency of nitrogen were significant. Therefore, DO, pH, and aeration time were selected for the RSM model.
The model determined the coefficient R-Sq = 0.9834, which indicated a reliable model. The two regression equations of the TN removal rate for various values of DO, influent pH, and aeration time were obtained using the model.
Under the selected parameters of the model, the effects of DO, pH value, and aeration time on TN removal efficiency in the SND process were in the order: aeration time > DO > pH.
The theoretical optimum based on the model obtained was: DO = 4.09 mg/L, pH = 7.58 and aeration time = 10.47 h, which led to a TN removal efficiency of 86.2%. The difference in the TN removal rate obtained between experiments and the model was only 0.58%.
Author Contributions
L.Z. and Y.H. conceived and designed the experiments; Y.H. and D.W. performed the experiments; P.H. and Y.H. analyzed the data; L.Z. and S.L. contributed reagents/materials/analysis tools; L.Z. and S.L. wrote the paper.
Funding
This research was funded by [National Natural Science Foundation of China] grant number [51478127, 51708140] and [Science and Technology Program of Guangzhou, China] grant number [201510010051].
Acknowledgments
We are grateful to the anonymous reviewers for their useful comments and suggestions.
Conflicts of Interest
The authors declare no conflict of interest.
References
- Gong, L.; Huo, M.; Yang, Q.; Li, J.; Ma, B.; Zhu, R. Performance of heterotrophic partial denitrification under feast-famine condition of electron donor: A case study using acetate as external carbon source. Bioresour. Technol. 2013, 133, 263–269. [Google Scholar] [CrossRef] [PubMed]
- Modin, O.; Fukushi, K.; Yamamoto, K. Denitrification with methane as external carbon source. Water Res. 2007, 41, 2726–2738. [Google Scholar] [CrossRef] [PubMed]
- Quan, Z.; Jin, Y.; Yin, C.; Lee, J.; Lee, S. Hydrolyzed molasses as an external carbon source in biological nitrogen removal. Bioresour. Technol. 2005, 96, 1690–1695. [Google Scholar] [CrossRef] [PubMed]
- Lin, X.; Wang, Y. Microstructure of anammox granules and mechanisms endowing their intensity revealed by microscopic inspection and rheometry. Water Res. 2017, 120, 22–31. [Google Scholar] [CrossRef] [PubMed]
- Liang, Y.; Li, D.; Zeng, H. Rapid start-up and microbial characteristics of partial nitrification granular sludge treating domestic sewage at room temperature. Bioresour. Technol. 2015, 196, 741–745. [Google Scholar] [CrossRef] [PubMed]
- Liang, H.; Li, X.; Wang, S.; Gao, D. Effects of carbon source on N2O production in the process of simultaneous nitrification and denitrification via nitrite by aerobic granular sludge. Appl. Environ. Biotechnol. 2016, 1, 10–17. [Google Scholar] [CrossRef]
- Zhang, L.; Huang, Y.; Li, S.; Huang, Y.; Wang, D.; He, P. Influences of C/N and aeration time on solid carbon source SND treatment of low carbon wastewater. Ind. Water Treat. 2018, 38, 67–70, 74. (In Chinese) [Google Scholar]
- Huang, Y.; Zhang, L.; Li, S.; Huang, Y.; Wang, D.; He, P. Performance of nitrogen removal from municipal wastewater by solid carbon source biofilm. Technol. Water Treat. 2017, 43, 98–102. (In Chinese) [Google Scholar]
- Wang, Q.; Chen, Q. Simultaneous denitrification and denitrifying phosphorus removal in a full-scale anoxic-oxic process without internal recycle treating low strength wastewater. J. Environ. Sci. 2016, 39, 175–183. [Google Scholar] [CrossRef] [PubMed]
- Li, Y.; He, Y.; Ohandja, D.; Ji, J.; Li, J.; Zhou, T. Simultaneous nitrification denitrification achieved by an innovative internal-loop airlift MBR: Comparative study. Bioresour. Technol. 2008, 99, 5867–5872. [Google Scholar] [CrossRef] [PubMed]
- Third, K.; Gibbs, B.; Newland, M.; Cord-Ruwisch, R. Long-term aeration management for improved N-removal via SND in a sequencing batch reactor. Water Res. 2005, 39, 3523–3530. [Google Scholar] [CrossRef] [PubMed]
- Zhao, H.; Mavinic, D.; Oldham, W.; Koch, F. Controlling factors for simultaneous nitrification and denitrification in a two-stage intermittent aeration process treating domestic sewage. Water Res. 1999, 33, 961–970. [Google Scholar] [CrossRef]
- Ge, S.; Peng, Y.; Lu, C.; Wang, S. Practical consideration for design and optimization of the step feed process. Front. Environ. Sci. Eng. 2013, 7, 135–142. [Google Scholar] [CrossRef]
- Gong, Y.; Peng, Y.; Wang, S.; Wang, S. Production of N2O in two biologic nitrogen removal processes: A comparison between conventional and short-cut Nitrogen removal processes. Front. Environ. Sci. Eng. 2014, 8, 589–597. [Google Scholar] [CrossRef]
- González, O.; Esplugas, M.; Sans, C.; Torres, A.; Esplugas, S. Performance of a sequencing batch biofilm reactor for the treatment of preoxidized sulfamethoxazole solutions. Water Res. 2009, 43, 2149–2158. [Google Scholar] [CrossRef] [PubMed]
- Zhang, L.; Wei, C.; Zhang, K.; Zhang, C.; Fang, Q.; Li, S. Effects of temperature on simultaneous nitrification and denitrification via nitrite in a sequencing batch biofilm reactor. Bioprocess Biosyst. Eng. 2009, 32, 175–182. [Google Scholar] [CrossRef] [PubMed]
- Jae, Y.; Young, J. Biological nitrate removal in industrial wastewater treatment: Which electron donor we can choose. Appl. Microbiol. Biotechnol. 2009, 82, 415–429. [Google Scholar]
- Pekdemir, T.; Keskinler, B.; Yildiz, E.; Akay, G. Process intensification in wastewater treatment: Ferrous iron removal by a sustainable membrane bioreactor system. J. Chem. Technol. Biotechnol. 2003, 78, 773–780. [Google Scholar] [CrossRef]
- Hiraishi, A.; Khan, S. Application of polyhydroxy alkanoates for denitrification in water and wastewater treatment. Appl. Microbiol. Biotechnol. 2003, 61, 103–109. [Google Scholar] [CrossRef] [PubMed]
- Shao, L.; Xu, Z.; Jin, W.; Yin, H.; Zhu, B. Nitrate removal from wastewater using rice straw as carbon source and biofilm carrier. J. Environ. Sci. 2009, 30, 1414–1419. (In Chinese) [Google Scholar]
- Yang, X.; Jiang, Q.; Song, H.; Gu, T.; Xia, M. Selection and application of agricultural wastes as solid carbon sources and biofilm carriers in MBR. J. Hazard. Mater. 2015, 283, 186–192. [Google Scholar] [CrossRef] [PubMed]
- Zhang, L.; Huang, Y.; Li, S.; Huang, Y.; Wang, D.; He, P. Performance of SND membrane reactor with luffah sponge as solid carbon source biofilm. J. Guangzhou Univ. (Nat. Sci. Ed.) 2017, 16, 76–81. (In Chinese) [Google Scholar]
- Tony, M.; Zhao, Y.; Fu, J.; Tayeb, A. Conditioning of aluminium based water treatment sludge with Fenton’s reagent: Effectiveness and optimising study to improve dewaterability. Chemosphere 2008, 72, 673–677. [Google Scholar] [CrossRef] [PubMed]
- Soloman, P.; Ahmed, C.; Velan, M.; Balasubramanian, N.; Marimuthu, P. Augmentation ofbiodegradability of pulp and paper industry wastewater byelectrochemical pre-treatment and optimization by RSM. Sep. Purif. Technol. 2009, 69, 109–117. [Google Scholar] [CrossRef]
- Benatti, C.; Tavares, C.; Guedes, T. Optimization of Fenton’s oxidation of chemical laboratory wastewaters using there sponge surface methodology. J. Environ. Manag. 2006, 80, 66–74. [Google Scholar] [CrossRef] [PubMed]
- Xu, Y.; Qiu, T.; Han, M.; Li, J.; Wang, X. Optimization of solid-phase denitrification process using response surface methodology. Chin. J. Environ. Eng. 2013, 7, 489–493. (In Chinese) [Google Scholar]
- Tong, J.; Chen, Y. Recovery of nitrogen and phosphorus from alkaline fermentation liquid of waste activated sludge and application of the fermentation liquid to promote biological municipal wastewater treatment. Water Res. 2009, 43, 2969–2976. [Google Scholar] [CrossRef] [PubMed]
- Dai, Z.; Hu, S.; Luo, K.; Gao, X.; Fan, J.; Chen, K. Application of air quality response surface model (RSM) in Hangzhou. J. Univ. Chin. Acad. Sci. 2017, 34, 179–185. (In Chinese) [Google Scholar]
- Zafar, M.; Vinh, N.; Behera, S.; Park, H. Ethanol mediated As(III) adsorption onto Zn-loaded pinecone biochar: Experimental investigation, modeling, and optimization using hybrid artificial neural network-genetic algorithm approach. J. Environ. Sci. 2017, 54, 114–125. [Google Scholar] [CrossRef] [PubMed]
- Wei, T.; Mohammed, A.; Mohamed, K.; Magorzata, S. The application of iron mesh double layer as anode for the electrochemical treatment of Reactive Black 5 dye. J. Environ. Sci. 2017, 54, 184–195. [Google Scholar]
- Di, J.; Zhao, W.; Zhu, Z.; An, W.; Ren, Y. Treatment of response surface methodology to optimize enhanced coagulation process for micro-polluted water. Chin. J. Environ. Eng. 2017, 11, 27–32. (In Chinese) [Google Scholar]
- Duan, L.; Wang, L.; Zhao, Y.; Xu, H.; Han, Z. Optimization of key operating parameters of coagulation for treating turtle aquaculture sewage. J. Saf. Environ. 2017, 17, 671–676. [Google Scholar]
- Fan, S.; Li, H.; Zhang, H.; Lu, X.; Yang, Z. Application of response surface methodology for the optimization of biochar preparation derived from sludge and tea residue. Chin. J. Environ. Eng. 2017, 13, 1778–1786. (In Chinese) [Google Scholar]
- Saeed, A.; Iqbal, M. Loofa (Luffa cylindrica) sponge: Review of development of the biomatrix as a tool for biotechnological applications. Biotechnol. Prog. 2013, 29, 573–600. [Google Scholar] [CrossRef] [PubMed]
- Zhong, P.; Zhou, J. Simulation on summer monsoon precipitation over eastern China by using regional spectral model. J. Meteorol. Sci. 2017, 37, 101–109. [Google Scholar]
- Chen, D. Study on Characterization of Sewage in Guangzhou and A2/O Process Practice in Different Situations; South China University of Technology: Guangzhou, China, 2012. (In Chinese) [Google Scholar]
- Ministry of Ecology and Environment of the People’s Republic of China. Water and Wastewater Monitoring Methods, 4th ed.; China Environmental Science Press: Beijing, China, 2002. (In Chinese)
- Ministry of Ecology and Environment of the People’s Republic of China. Discharge Standard of Pollutants for Municipal Wastewater Treatment Plant; GB18918–2002; Ministry of Ecology and Environment: Beijing, China, 2002. (In Chinese)
Figure 1.
Square cut pieces of loofah sponge.
Figure 1.
Square cut pieces of loofah sponge.
Figure 2.
Schematic of SBBR. (1) Peristaltic pump; (2) Wastewater tank; (3) Stationary grid; (4) Supporting grid; (5) Aeration tray; (6) Loofah sponge; (7) Electromagnetic valve.
Figure 2.
Schematic of SBBR. (1) Peristaltic pump; (2) Wastewater tank; (3) Stationary grid; (4) Supporting grid; (5) Aeration tray; (6) Loofah sponge; (7) Electromagnetic valve.
Figure 3.
RSM analysis procedure.
Figure 3.
RSM analysis procedure.
Figure 4.
Effect of different factors on the efficiency of nitrogen removal. (a) Effect of filling ratio; (b) effect of DO; (c) effect of pH; (d) effect of C/N ratio.
Figure 4.
Effect of different factors on the efficiency of nitrogen removal. (a) Effect of filling ratio; (b) effect of DO; (c) effect of pH; (d) effect of C/N ratio.
Figure 5.
Effect of aeration time on the efficiency of nitrogen removal.
Figure 5.
Effect of aeration time on the efficiency of nitrogen removal.
Figure 6.
Residual plots of the nitrogen removal efficiency. (a) Normal distribution of the residuals; (b) fitted values of the residuals; (c) histogram correlating the frequency and residuals; (d) observation order.
Figure 6.
Residual plots of the nitrogen removal efficiency. (a) Normal distribution of the residuals; (b) fitted values of the residuals; (c) histogram correlating the frequency and residuals; (d) observation order.
Figure 7.
Relationship between the TN removal efficiency and different selected main factors. (a) Relationship between the TN removal efficiency, the aeration time and the DO; (b) contour map of TN removal efficiency with the aeration time and DO; (c) relationship between the TN removal efficiency, the aeration time, and the pH; (d) contour map of TN removal efficiency with the aeration time and pH; (e) relationship between the TN removal efficiency, the DO, and the pH; (f) contour map of TN removal efficiency with DO and pH.
Figure 8.
Changes in denitrification in validation test.
Figure 8.
Changes in denitrification in validation test.
Table 1.
Characteristics of the synthetic water sample.
Table 1.
Characteristics of the synthetic water sample.
| Index | CODCr (mg/L) | TN (mg/L) | (mg/L) | (mg/L) | (mg/L) | pH-inf |
|---|
| Range | 90.5–150 | 24.2–31.2 | 22.9–30.2 | 0.1–0.2 | 0.1–0.8 | 7.0–7.5 |
Table 2.
Experimental conditions to study the effect of individual factor.
Table 2.
Experimental conditions to study the effect of individual factor.
| Test Name | Filling Ratio | DO | pH | C/N | Aeration Time |
|---|
| Filling ratio | 20–45% | 4.0 ± 0.2 mg/L | 7.0 ± 0.2 | 5 ± 1 | 10 h |
| DO | optimized value by filling ratio test | 1.0–6.0 mg/L | 7.0 ± 0.2 | 5 ± 1 | 10 h |
| pH | optimized value by filling ratio test | optimized value by DO test | 6.0–8.0 | 5 ± 1 | 10 h |
| C/N | optimized value by filling ratio test | optimized value by DO test | optimized value by pH test | 0–10 | 10 h |
| Aeration time | optimized value by filling ratio test | optimized value by DO test | optimized value by pH test | optimized value by C/N test | 0–10 h |
Table 3.
Factors and their levels in the response surface design of nitrogen removal rate.
Table 3.
Factors and their levels in the response surface design of nitrogen removal rate.
| Factor | Code |
|---|
| −1 | 0 | 1 |
|---|
| DO (mg/L) | 3.5 | 4.0 | 4.5 |
| pH | 7.2 | 7.5 | 7.8 |
| Aeration time (h) | 9 | 10 | 11 |
Table 4.
Response surface design arrangement and modeling results.
Table 4.
Response surface design arrangement and modeling results.
| Series Number | DO | pH | Aeration Time | TN Removal Rate (R) |
|---|
| 1 | 3.5 | 7.5 | 9 | 67.0% |
| 2 | 4 | 7.5 | 10 | 84.4% |
| 3 | 4.5 | 7.2 | 10 | 79.6% |
| 4 | 3.5 | 7.5 | 11 | 82.7% |
| 5 | 4.5 | 7.5 | 11 | 81.0% |
| 6 | 4 | 7.8 | 9 | 75.0% |
| 7 | 3.5 | 7.8 | 10 | 76.5% |
| 8 | 3.5 | 7.2 | 10 | 71.5% |
| 9 | 4 | 7.2 | 11 | 78.5% |
| 10 | 4 | 7.8 | 11 | 83.4% |
| 11 | 4.5 | 7.8 | 10 | 82.0% |
| 12 | 4 | 7.5 | 10 | 85.4% |
| 13 | 4 | 7.5 | 10 | 83.9% |
| 14 | 4 | 7.2 | 9 | 69.5% |
| 15 | 4.5 | 7.5 | 9 | 77.4% |
Table 5.
Comparison of the results before and after the modification of RSM model.
Table 5.
Comparison of the results before and after the modification of RSM model.
| Analysis | Original Model
Final Model | Change |
|---|
| R-Sq | 98.73%
98.34% | Decreased |
| R-Sq (adjusted) | 96.45%
96.68% | Increased |
| R-Sq (predicted) | 83.24%
89.23% | Increased |
| S | 0.0107184
0.0103679 | Decreased |
| PRESS | 0.0075865
0.0048770 | Decreased |
Table 6.
Analysis of variance (ANOVA) for the fitted quadratic polynomial model.
Table 6.
Analysis of variance (ANOVA) for the fitted quadratic polynomial model.
| Project | Coefficient | p |
|---|
| Constant | −32.86 | 0.000 |
| A | 1.73 | 0.001 |
| B | 6.4 | 0.000 |
| C | 1.12 | 0.000 |
| A2 | −0.42 | 0.000 |
| B2 | −0.04 | 0.000 |
| C2 | −0.06 | 0.000 |
| AC | −0.13 | 0.001 |
Table 7.
Interval estimate for the optimal TN removal efficiency.
Table 7.
Interval estimate for the optimal TN removal efficiency.
| (95% CI) | (95% PI) |
|---|
| (0.849668, 0.875642) | (0.834912, 0.890398) |
© 2018 by the authors. Licensee MDPI, Basel, Switzerland. This article is an open access article distributed under the terms and conditions of the Creative Commons Attribution (CC BY) license (http://creativecommons.org/licenses/by/4.0/).

