Monitoring of a Full-Scale Embankment Experiment Regarding Soil–Vegetation–Atmosphere Interactions

 ,
,  , , and
Abstract
1. Introduction
2. Methods
2.1. Construction of Embankment
2.2. Soil Sampling and Laboratory Tests
2.3. Monitoring Set-Up
2.3.1. Vertical Sensor Profiles
2.3.2. Meteorological Station
3. Results
3.1. Laboratory Results
3.1.1. Basic Soil Characterization
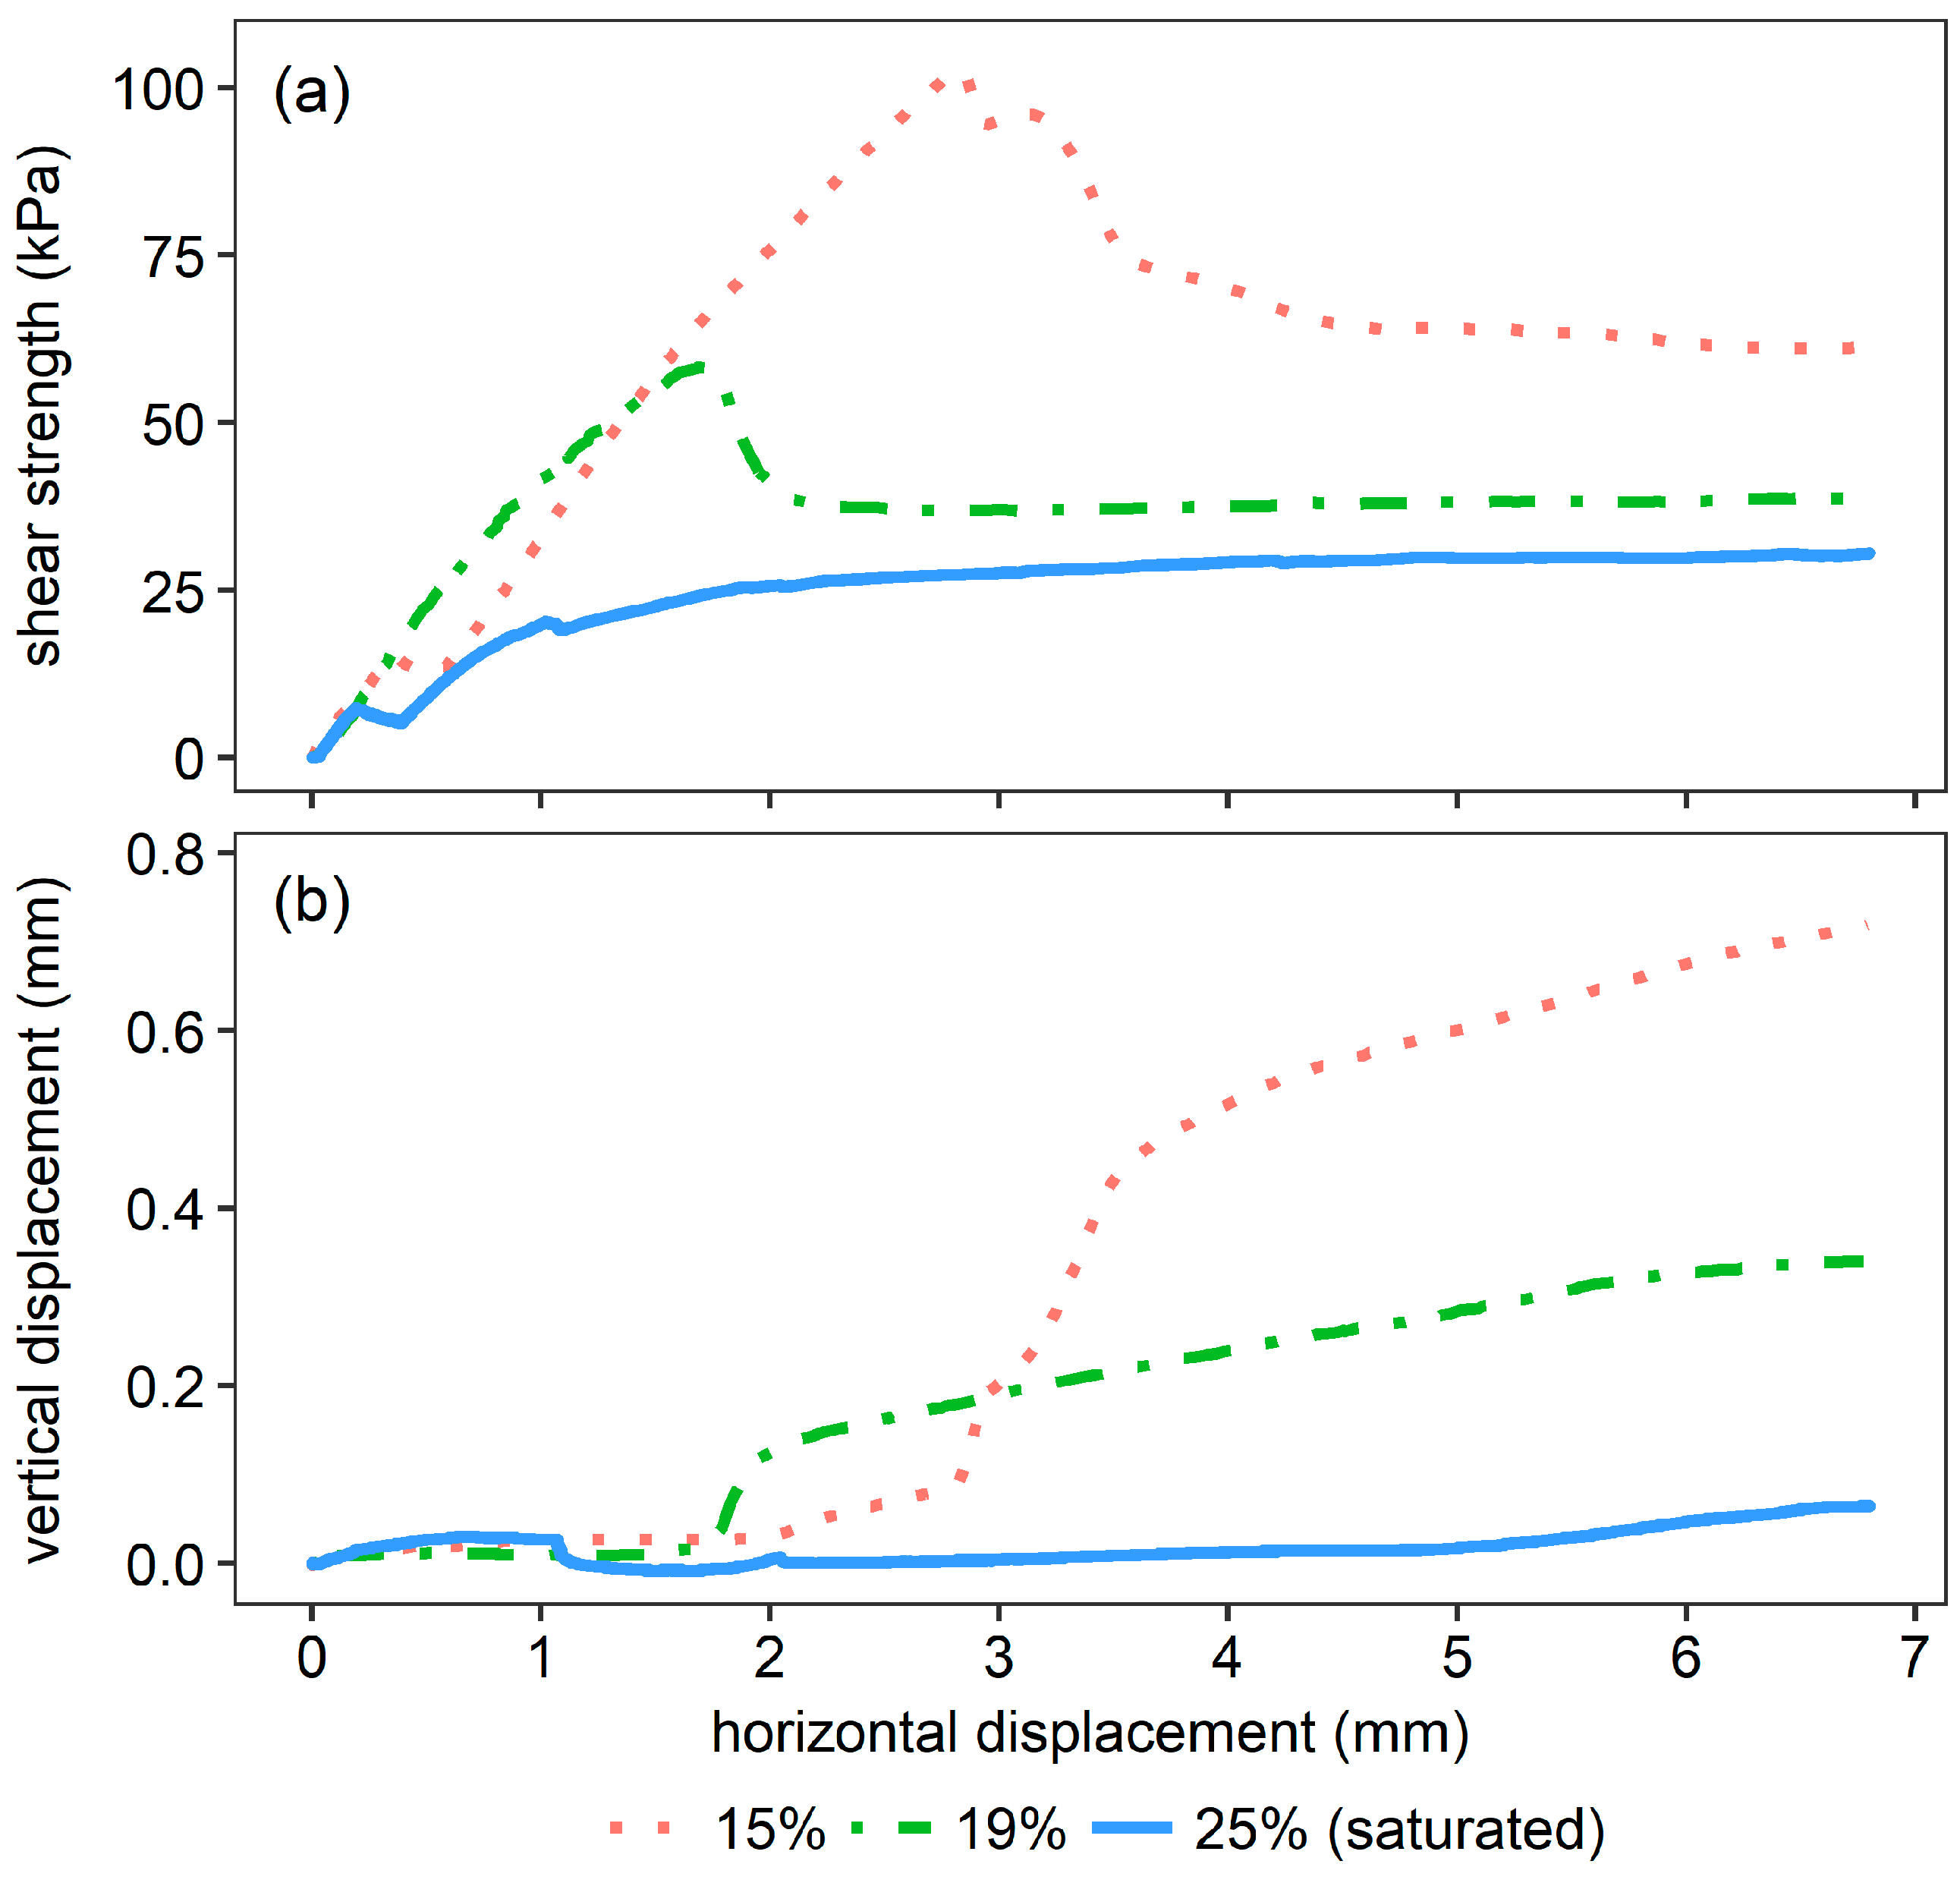
3.1.2. Strength Parameters
3.1.3. Hydraulic Behavior
3.2. Monitoring Results
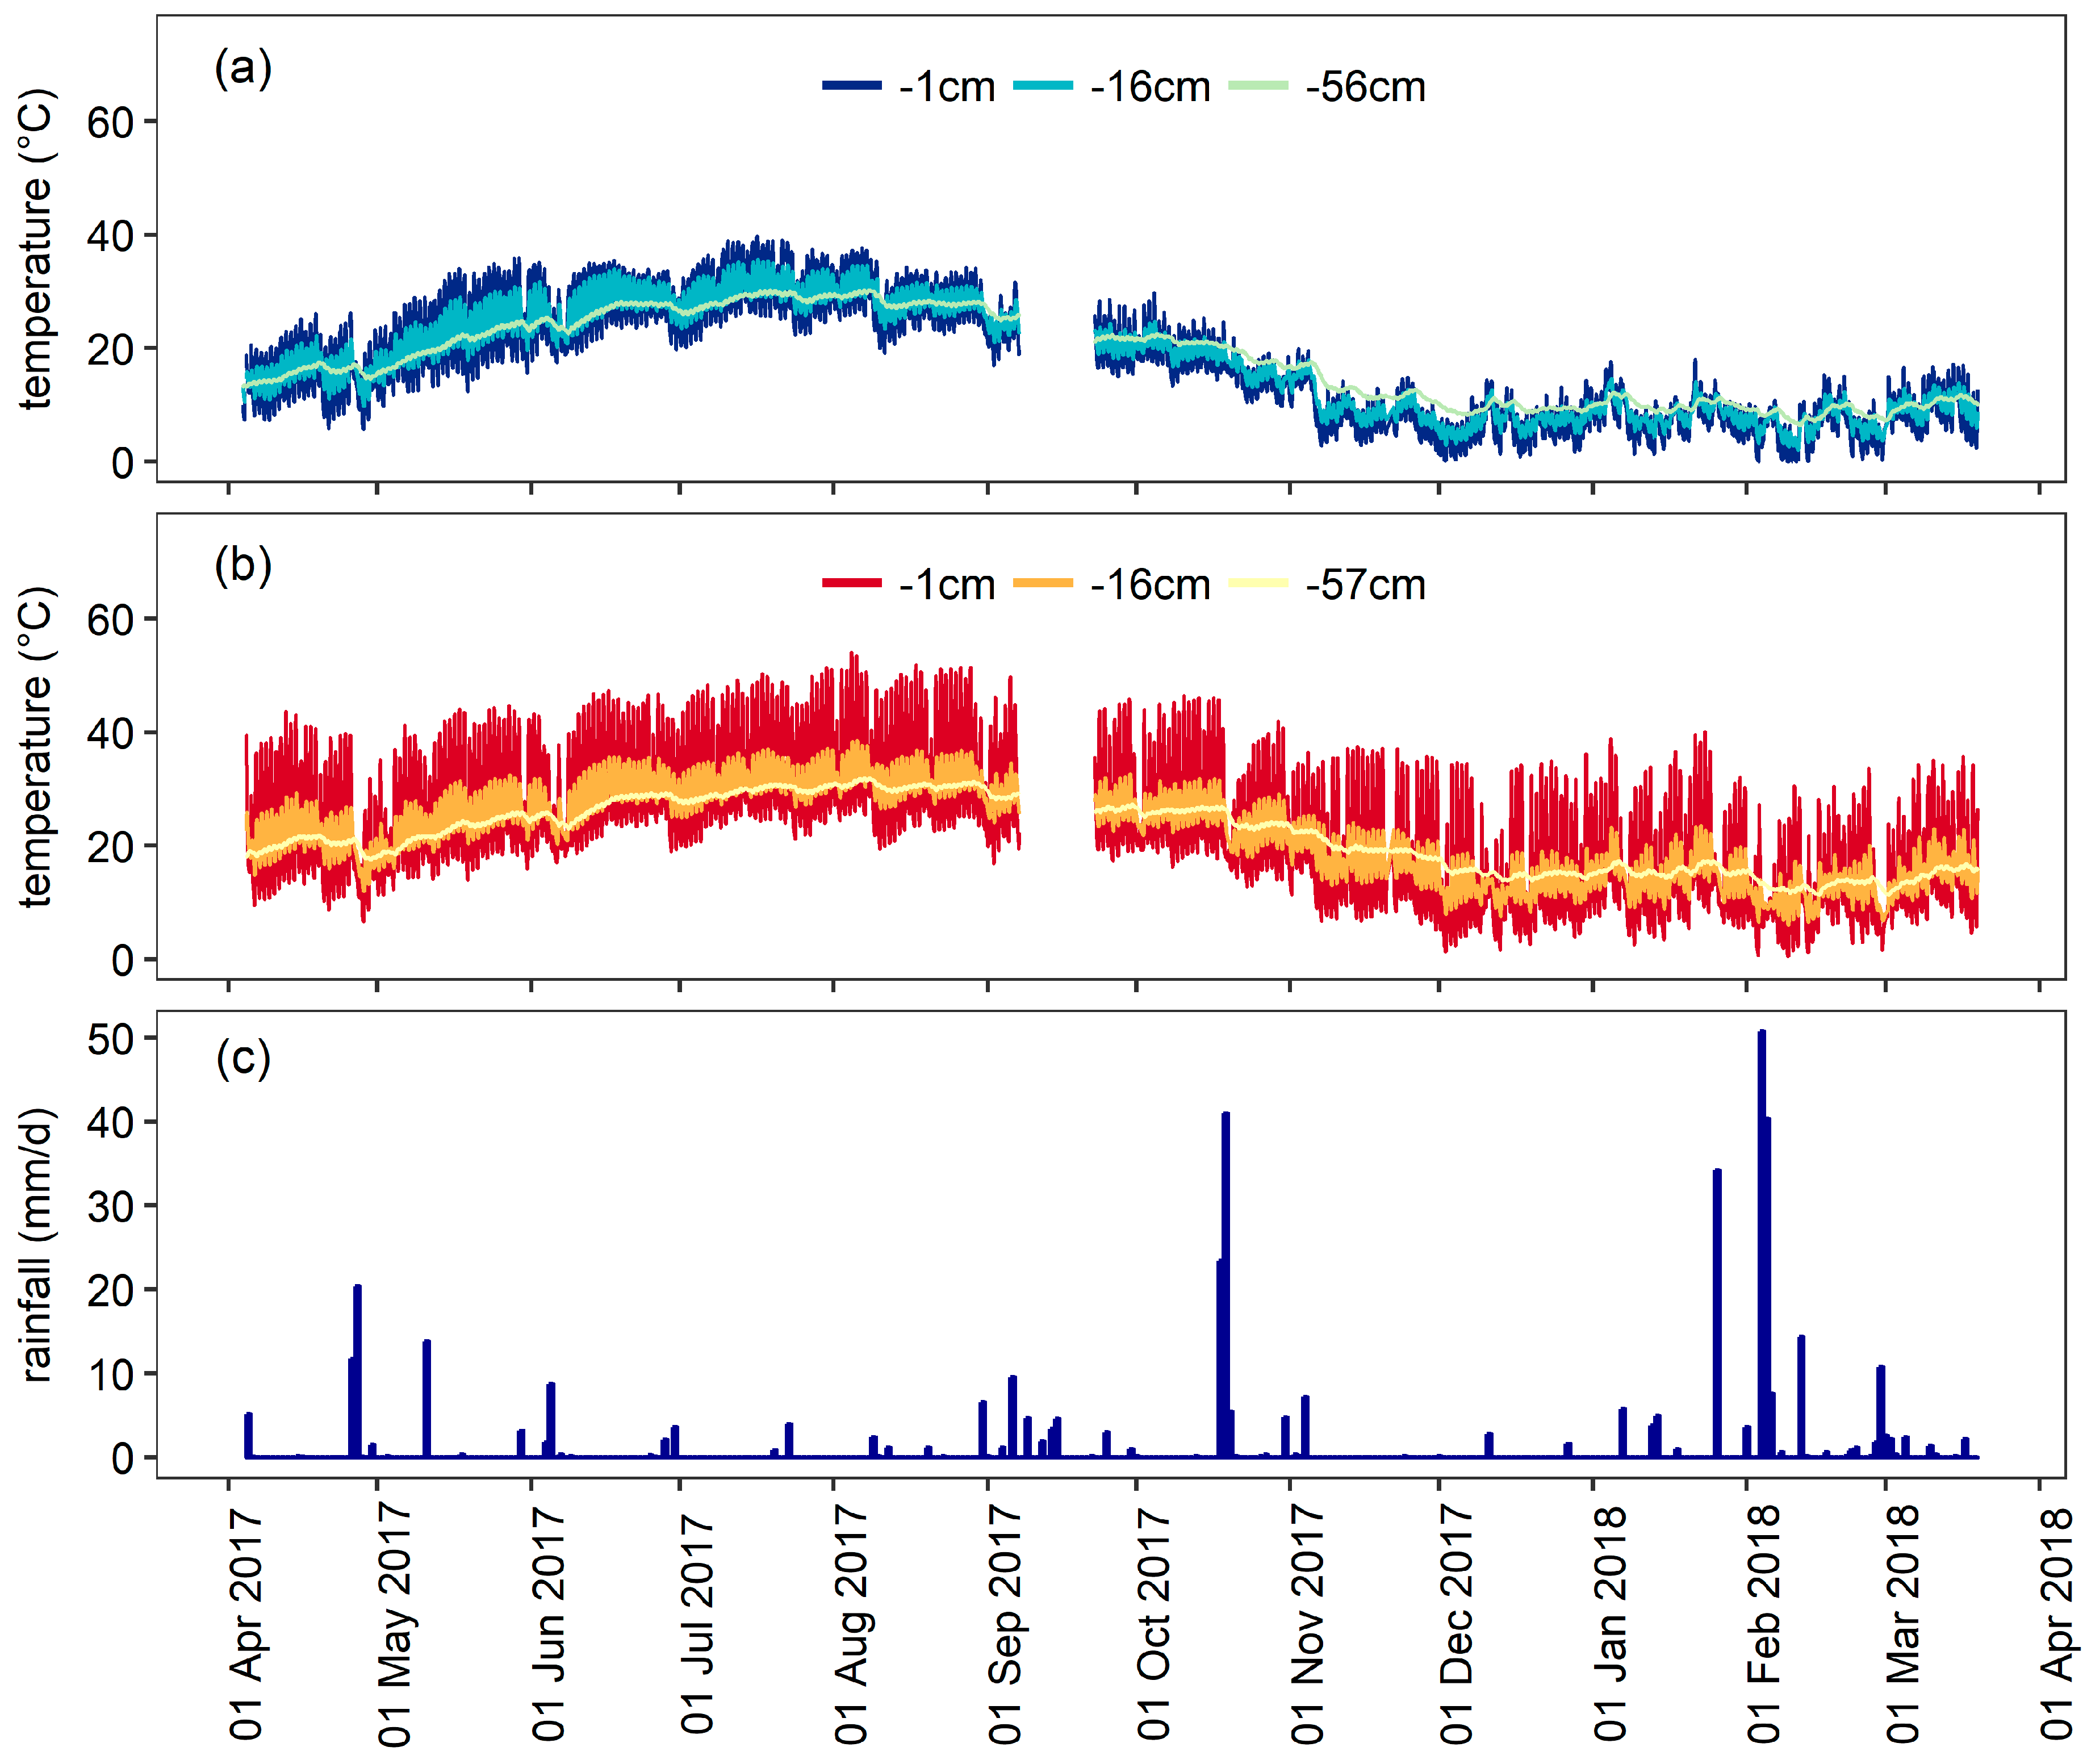
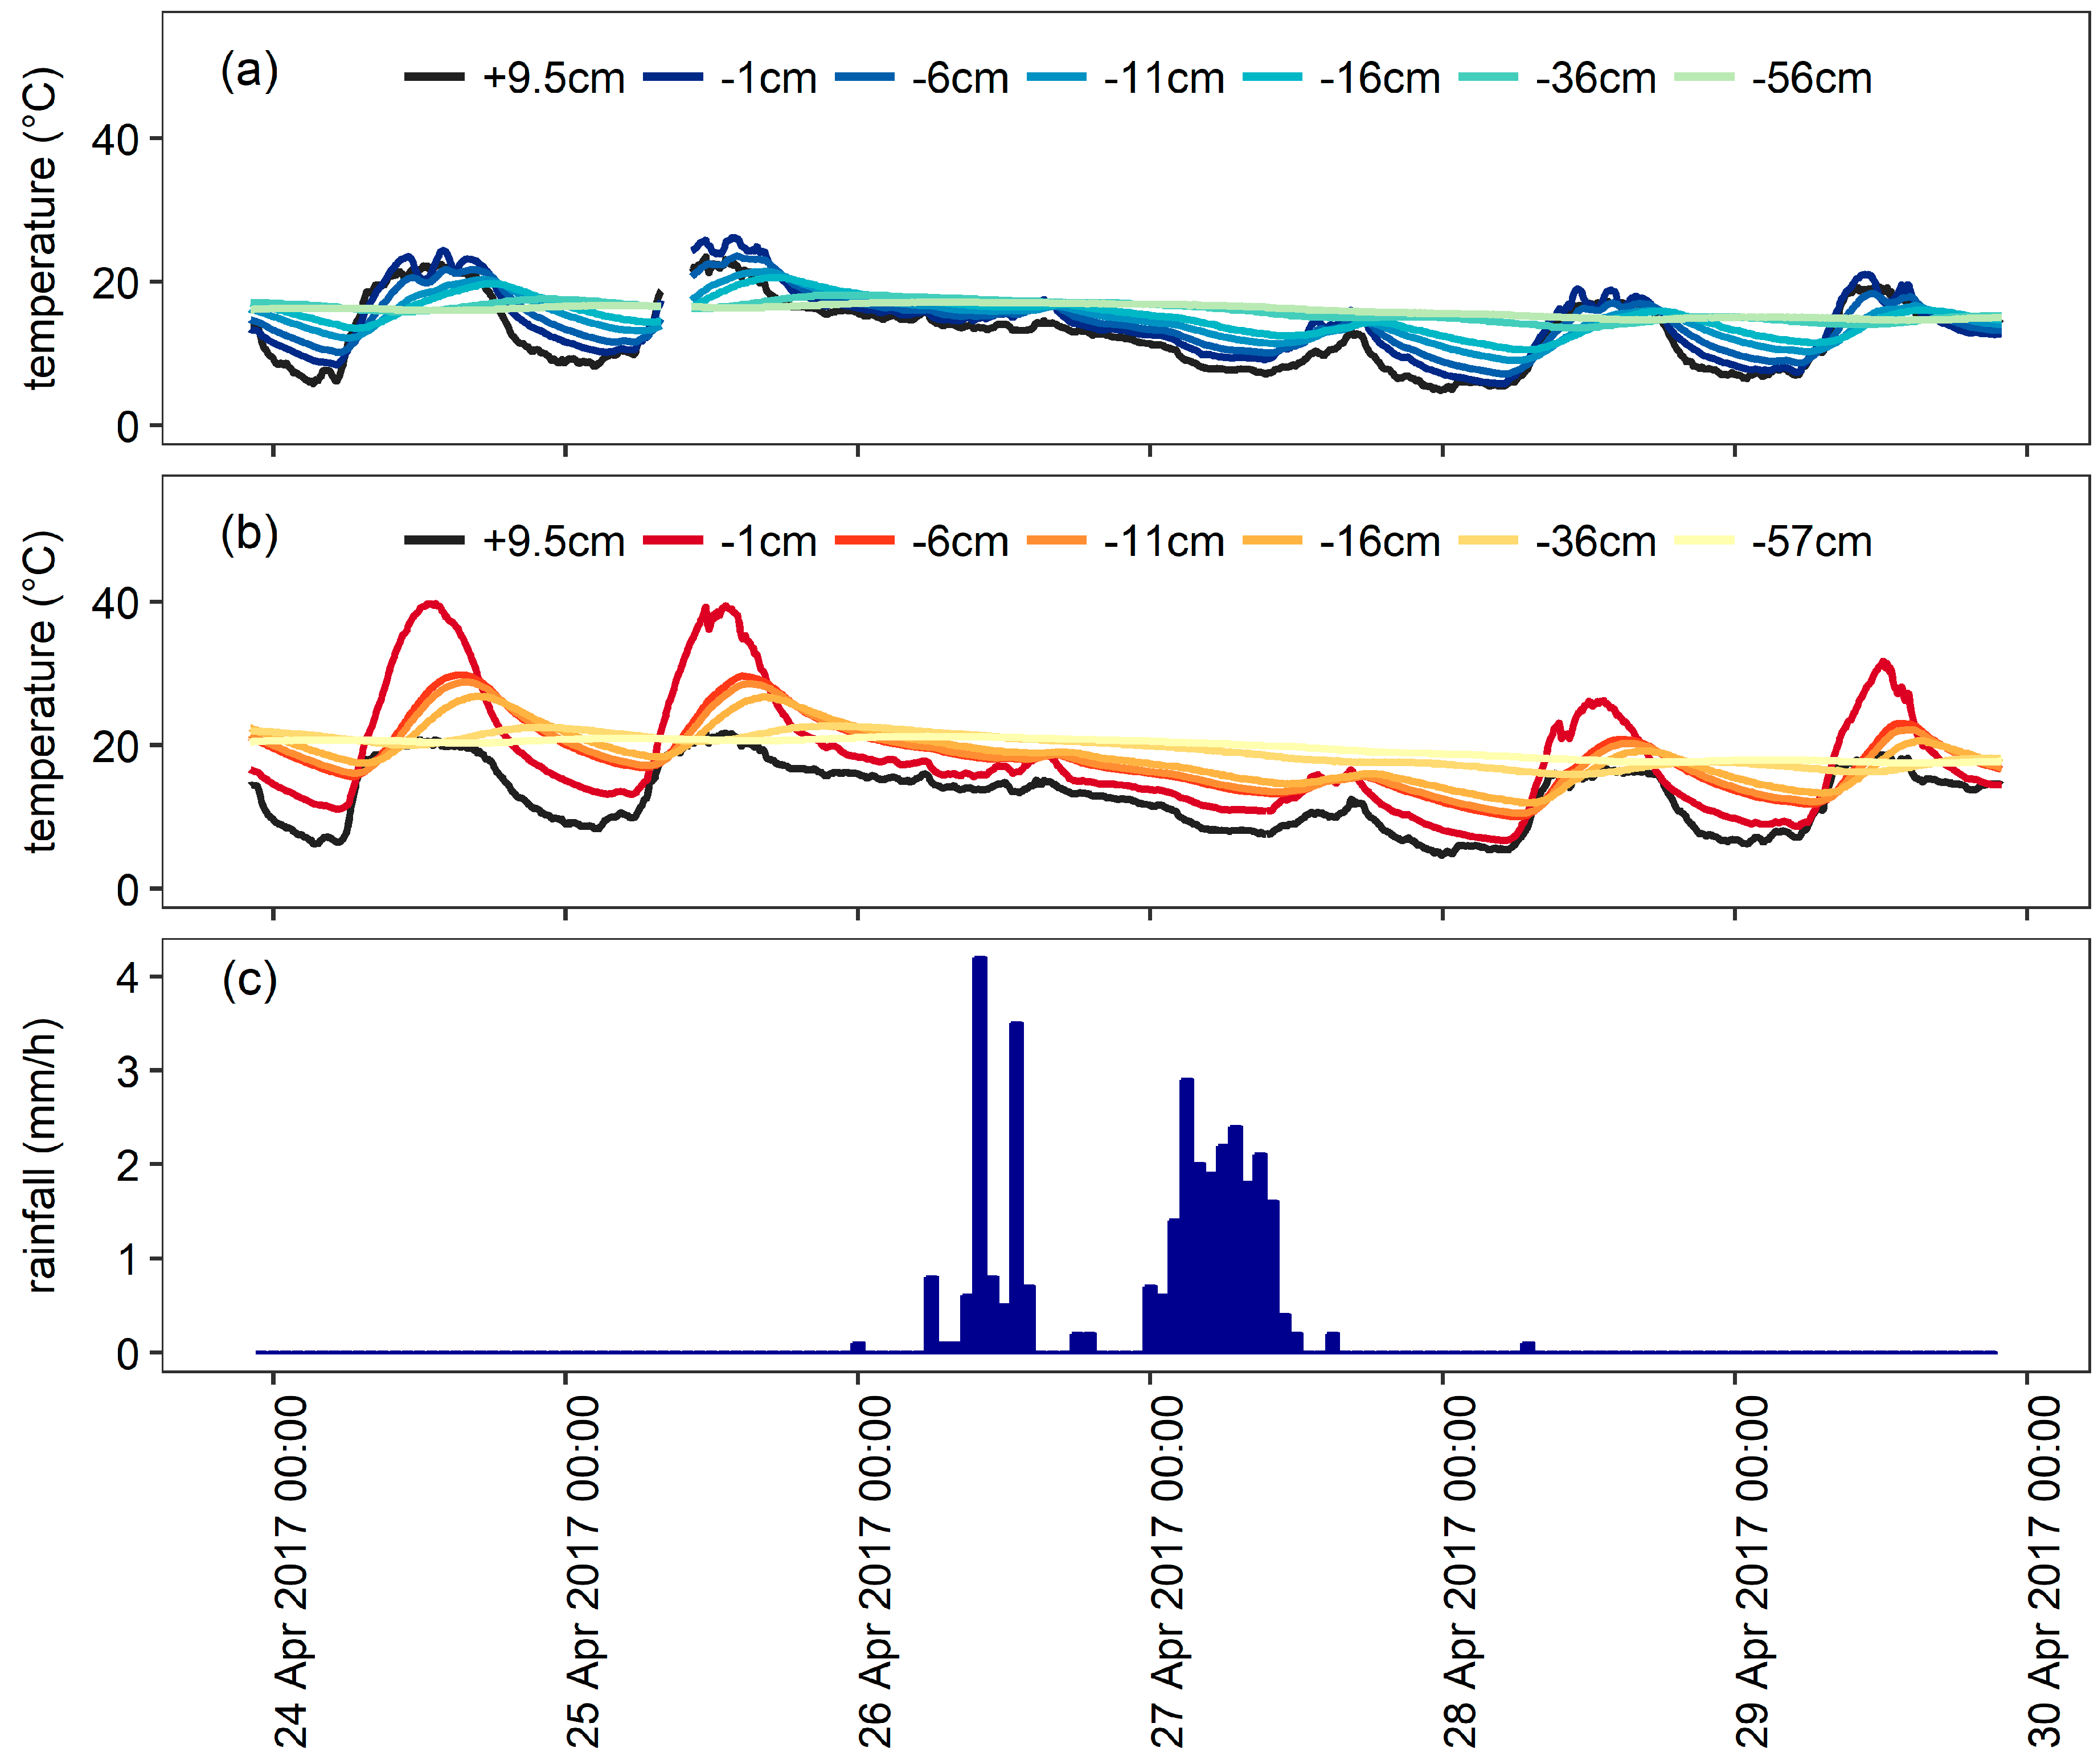
3.2.1. Temperature Data
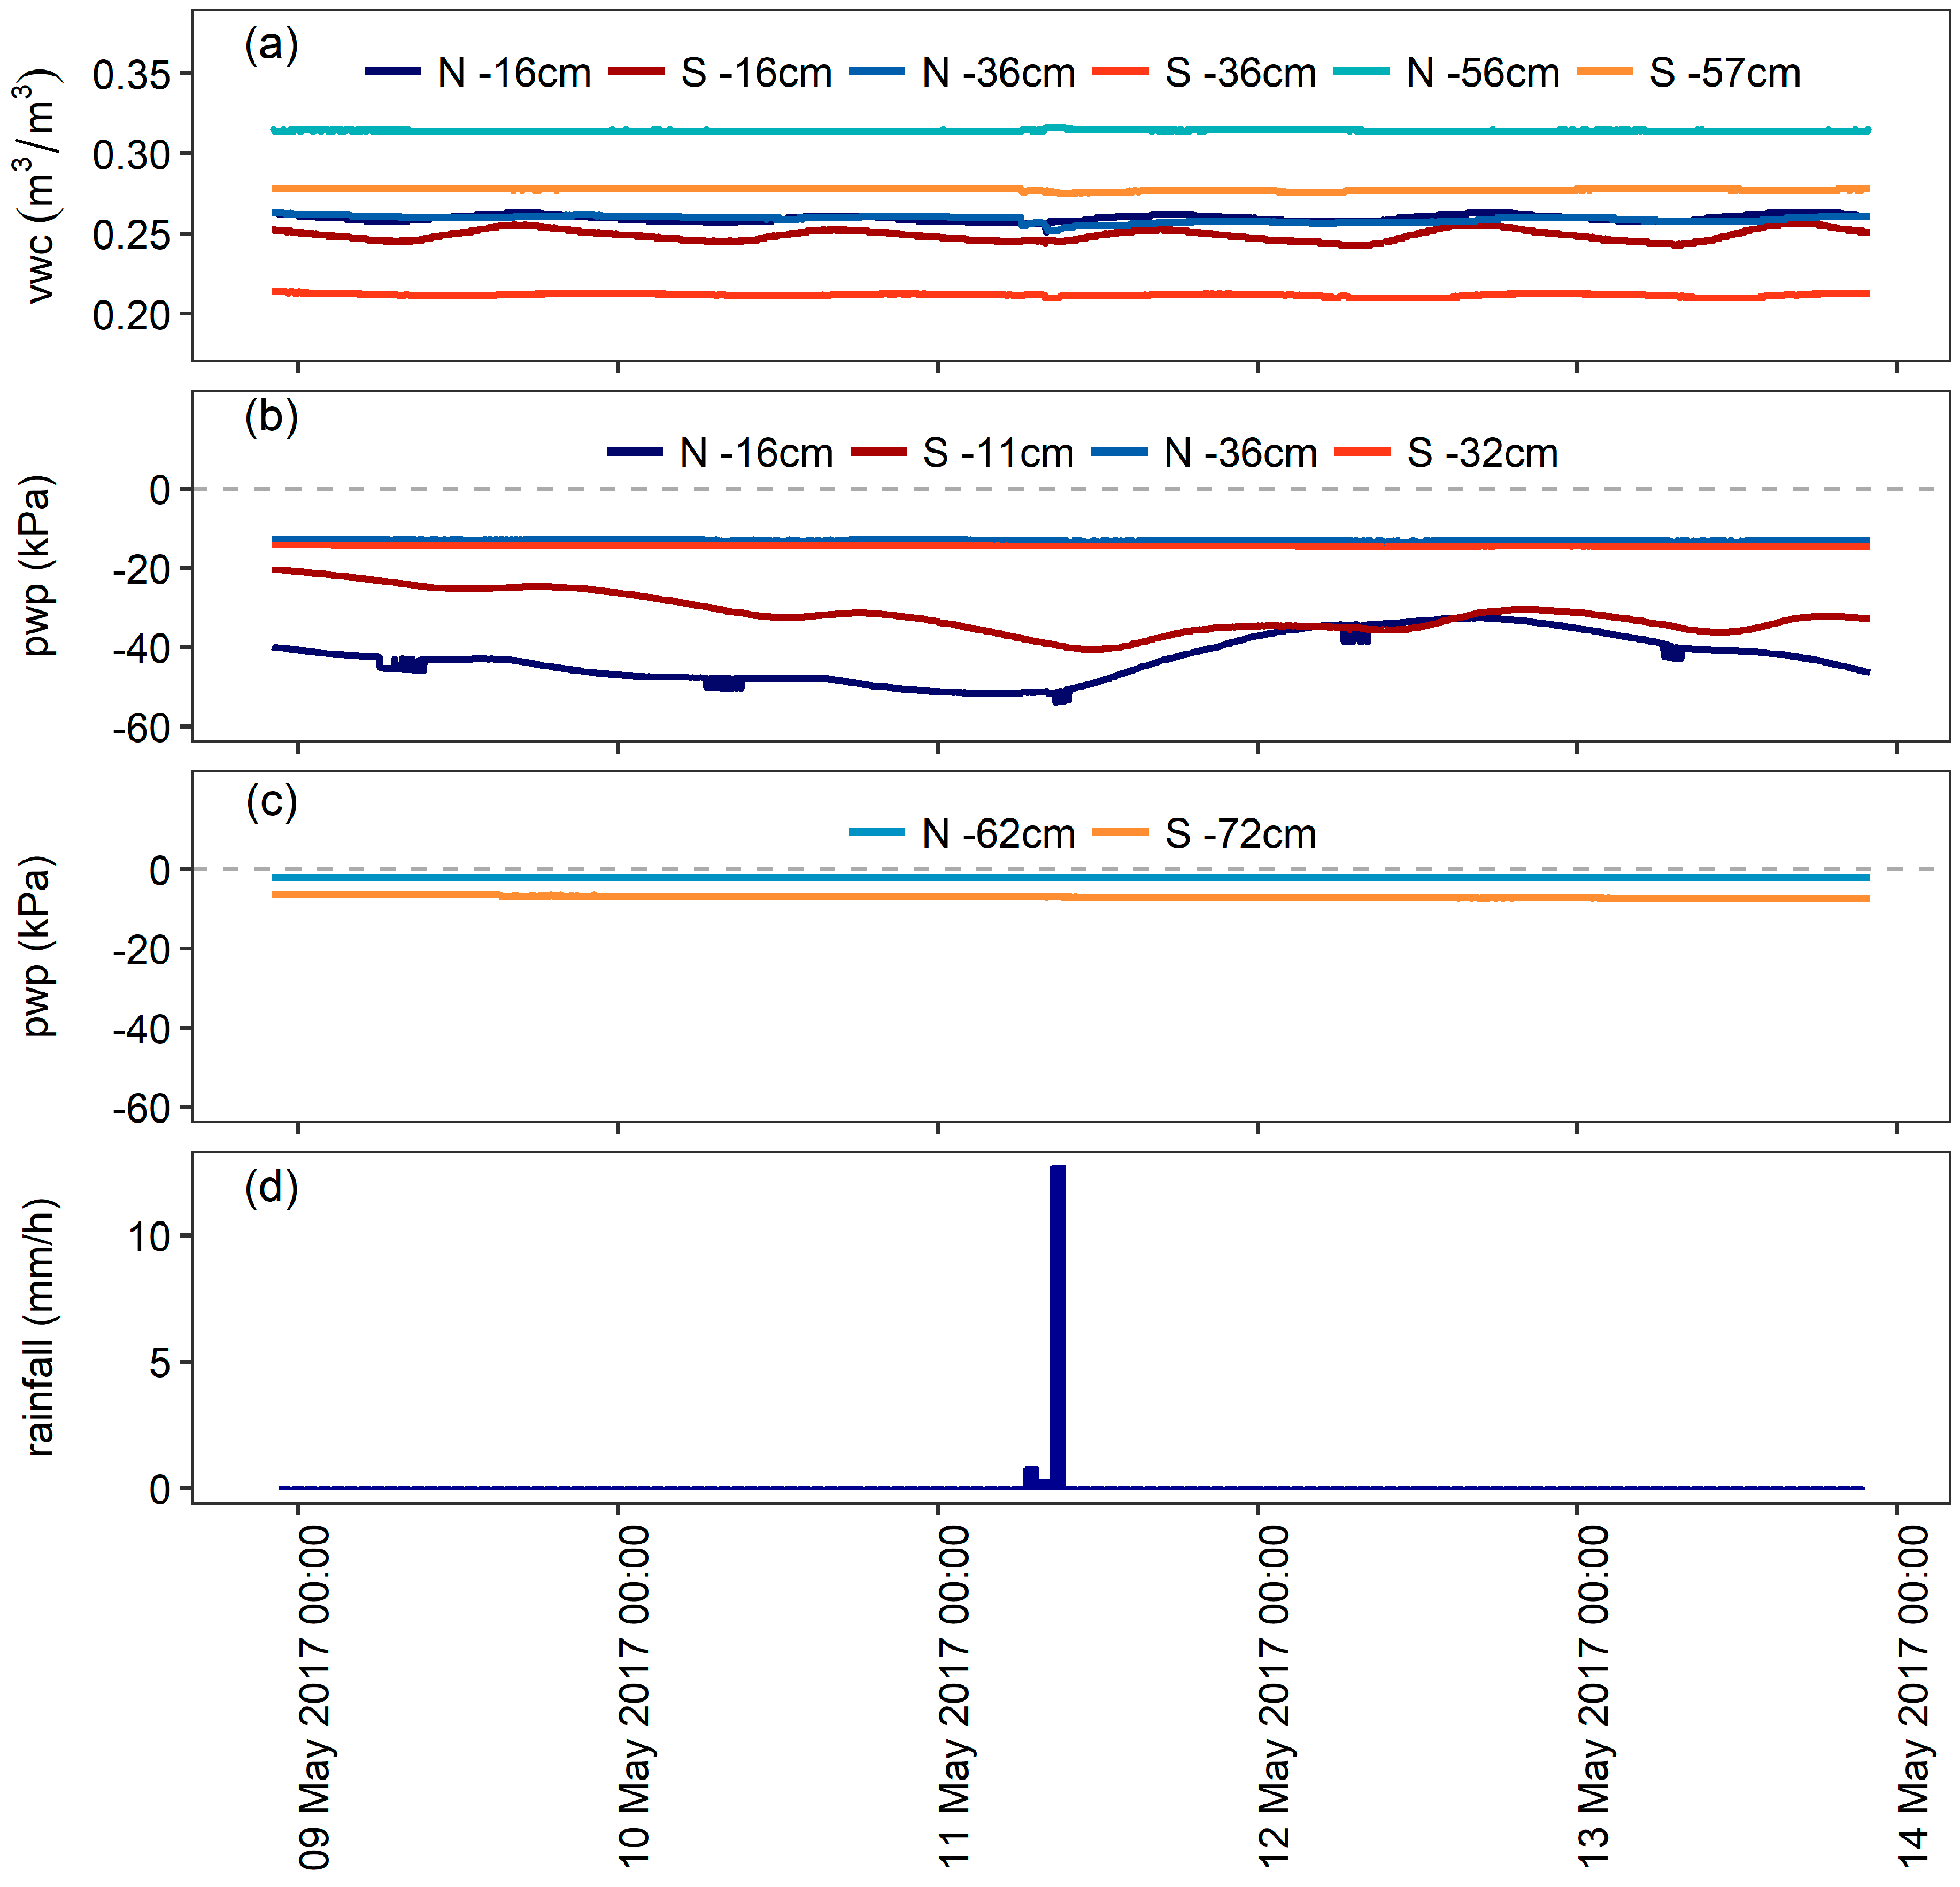
3.2.2. Hydrologic Slope Response
4. Conclusions
Author Contributions
Funding
Acknowledgments
Conflicts of Interest
References
- Gabarrón-Galeote, M.A.; Ruiz-Sinoga, J.D.; Quesada, M.A. Influence of aspect in soil and vegetation water dynamics in dry Mediterranean conditions: Functional adjustment of evergreen and semi-deciduous growth forms. Ecohydrology 2013, 6, 241–255. [Google Scholar] [CrossRef]
- Coyle, D.R.; Nagendra, U.J.; Taylor, M.K.; Campbell, J.H.; Cunard, C.E.; Joslin, A.H.; Mundepi, A.; Phillips, C.A.; Callaham, M.A. Soil fauna responses to natural disturbances, invasive species, and global climate change: Current state of the science and a call to action. Soil Biol. Biochem. 2017, 110, 116–133. [Google Scholar] [CrossRef]
- Drabo, A. Climate change mitigation and agricultural development models: Primary commodity exports or local consumption production? Ecol. Econ. 2017, 137, 110–125. [Google Scholar] [CrossRef]
- Imeson, A.C.; Lavee, H. Soil erosion and climate change: The transect approach and the influence of scale. Geomorphology 1998, 23, 219–227. [Google Scholar] [CrossRef]
- Corominas, J. Landslides and climate. In Proceedings of the VIII International Symposium on Landslides, Cardiff, UK, 26–30 June 2000; Bromhead, E.N., Dixon, N., Ibsen, M.L., Eds.; Volume 4, pp. 1–33. [Google Scholar]
- Intergovernmental Panel on Climate Change Climate Change 2013—The Physical Science Basis: Working Group I Contribution to the Fifth Assessment Report of the Intergovernmental Panel on Climate Change; Cambridge University Press: Cambridge, UK, 2014; ISBN 9781107057999.
- Nearing, M.A.; Polyakov, V.O.; Nichols, M.H.; Hernandez, M.; Li, L.; Zhao, Y.; Armendariz, G. Slope–velocity equilibrium and evolution of surface roughness on a stony hillslope. Hydrol. Earth Syst. Sci. 2017, 21, 3221–3229. [Google Scholar] [CrossRef]
- Panagos, P.; Meusburger, K.; Ballabio, C.; Borrelli, P.; Alewell, C. Soil erodibility in Europe: A high-resolution dataset based on LUCAS. Sci. Total Environ. 2014, 479–480, 189–200. [Google Scholar] [CrossRef] [PubMed]
- Hovius, N.; Stark, C.P.; Allen, P.A. Sediment flux from a mountain belt derived by landslide mapping. Geology 1997, 25, 231–234. [Google Scholar] [CrossRef]
- Alonso, E.; Lloret, A.; Romero, E. Rainfall induced deformations of road embackments. Riv. Ital. di Geotec. 1999, 33, 8–15. [Google Scholar]
- Sajjan, A.K.; Gyasi-Agyei, Y.; Sharma, R.H. Rainfall–runoff modelling of railway embankment steep slopes. Hydrol. Sci. J. 2013, 58, 1162–1176. [Google Scholar] [CrossRef]
- Briggs, K.M.; Loveridge, F.A.; Glendinning, S. Failures in transport infrastructure embankments. Eng. Geol. 2017, 219, 107–117. [Google Scholar] [CrossRef]
- Blight, G.E. Interactions between the atmosphere and the earth. Geotechnique 1997, 47, 715–767. [Google Scholar]
- Elia, G.; Cotecchia, F.; Pedone, G.; Vaunat, J.; Vardon, P.J.; Pereira, C.; Springman, S.M.; Rouainia, M.; Van Esch, J.; Koda, E.; et al. Numerical modelling of slope–vegetation–atmosphere interaction: An overview. Q. J. Eng. Geol. Hydrogeol. 2017, 50, 249–270. [Google Scholar] [CrossRef]
- Tsiampousi, A.; Zdravkovic, L.; Potts, D.M. Soil-atmosphere interaction in unsaturated cut slopes. E3S Web Conf. 2016, 9, 8004. [Google Scholar] [CrossRef]
- Tang, A.M.; Hughes, P.N.; Dijkstra, T.A.; Askarinejad, A.; Brenčič, M.; Cui, Y.J.; Diez, J.J.; Firgi, T.; Gajewska, B.; Gentile, F.; et al. Atmosphere–vegetation–soil interactions in a climate change context; impact of changing conditions on engineered transport infrastructure slopes in Europe. Q. J. Eng. Geol. Hydrogeol. 2018, 51, 156–168. [Google Scholar] [CrossRef]
- Huang, C.-C.; Yuin, S.-C. Experimental investigation of rainfall criteria for shallow slope failures. Geomorphology 2010, 120, 326–338. [Google Scholar] [CrossRef]
- Orense, R.P.; Shimoma, S.; Maeda, K.; Towhata, I. Instrumented Model Slope Failure due to Water Seepage. J. Nat. Disaster Sci. 2004, 26, 15–26. [Google Scholar] [CrossRef]
- Tohari, A.; Nishigaki, M.; Komatsu, M. Laboratory Rainfall-Induced Slope Failure with Moisture Content Measurement. J. Geotech. Geoenviron. Eng. 2007, 133, 575–587. [Google Scholar] [CrossRef]
- Moriwaki, H.; Inokuchi, T.; Hattanji, T.; Sassa, K.; Ochiai, H.; Wang, G. Failure processes in a full-scale landslide experiment using a rainfall simulator. Landslides 2004, 1, 277–288. [Google Scholar] [CrossRef]
- Cooper, M.R.; Bromhead, E.N.; Petley, D.J.; Grants, D.I. The Selborne cutting stability experiment. Géotechnique 1998, 48, 83–101. [Google Scholar] [CrossRef]
- Cui, Y.J.; Gao, Y.B.; Ferber, V. Simulating the water content and temperature changes in an experimental embankment using meteorological data. Eng. Geol. 2010, 114, 456–471. [Google Scholar] [CrossRef]
- Glendinning, S.; Hughes, P.; Helm, P.; Chambers, J.; Mendes, J.; Gunn, D.; Wilkinson, P.; Uhlemann, S. Construction, management and maintenance of embankments used for road and rail infrastructure: Implications of weather induced pore water pressures. Acta Geotech. 2014, 9, 799–816. [Google Scholar] [CrossRef]
- Ng, C.W.W.; Springman, S.M.; Alonso, E.E. Monitoring the Performance of Unsaturated Soil Slopes. Geotech. Geol. Eng. 2008, 26, 799–816. [Google Scholar] [CrossRef]
- Bogaard, T.A.; van Asch, T.W.J. The role of the soil moisture balance in the unsaturated zone on movement and stability of the Beline landslide, France. Earth Surf. Process. Landforms 2002, 27, 1177–1188. [Google Scholar] [CrossRef]
- Springman, S.M.; Jommi, C.; Teysseire, P. Instabilities on moraine slopes induced by loss of suction: A case history. Géotechnique 2003, 53, 3–10. [Google Scholar] [CrossRef]
- Rahardjo, H.; Rezaur, R.B.; Leong, E.C.; Alonso, E.E.; Lloret, A.; Gens, A. Monitoring and modeling of slope response to climate changes. In Proceedings of the 10th International Symposium on Landslides, Xi’an, China, 30 June–4 July 2008; pp. 67–84. [Google Scholar]
- Cassiani, G.; Boaga, J.; Rossi, M.; Putti, M.; Fadda, G.; Majone, B.; Bellin, A. Soil–plant interaction monitoring: Small scale example of an apple orchard in Trentino, North-Eastern Italy. Sci. Total Environ. 2016, 543, 851–861. [Google Scholar] [CrossRef] [PubMed]
- Schmidt, K.M.; Roering, J.J.; Stock, J.D.; Dietrich, W.E.; Montgomery, D.R.; Schaub, T. The variability of root cohesion as an influence on shallow landslide susceptibility in the Oregon Coast Range. Can. Geotech. J. 2001, 38, 995–1024. [Google Scholar] [CrossRef]
- Portilla, M.; Chevalier, G.; Hürlimann, M. Description and analysis of the debris flows occurred during 2008 in the Eastern Pyrenees. Nat. Hazards Earth Syst. Sci. 2010, 10, 1635–1645. [Google Scholar] [CrossRef]
- Corominas, J.; Moya, J. Reconstructing recent landslide activity in relation to rainfall in the Llobregat River basin, Eastern Pyrenees, Spain. Geomorphology 1999, 30, 79–93. [Google Scholar] [CrossRef]
- Gallart, F.; Clotet-Perarnau, N. Some aspects of the geomorphic processes triggered by an extreme rainfall event: The November 1982 flood in the Eastern Pyrenees. Catena Suppl. 1988, 13, 79–95. [Google Scholar]
- Zhang, M.; Chen, F.Q.; Zhang, J.X. The Temporal Dynamics of Cynodon Dactylon Soil—Root System in Soil Conservation and Slope Reinforcement. Adv. Mater. Res. 2013, 838–841, 675–679. [Google Scholar] [CrossRef]
- Chen, F.; Zhang, J.; Zhang, M.; Wang, J. Effect of Cynodon dactylon community on the conservation and reinforcement of riparian shallow soil in the Three Gorges Reservoir area. Ecol. Process. 2015, 4, 1–8. [Google Scholar] [CrossRef]
- Garg, A.; Coo, J.L.; Ng, C.W.W. Field study on influence of root characteristics on soil suction distribution in slopes vegetated with Cynodon dactylon and Schefflera heptaphylla. Earth Surf. Process. Landforms 2015, 40, 1631–1643. [Google Scholar] [CrossRef]
- Katritzidakis, M.; Liapis, A.; Stathakopoulos, I.; Pipinis, E.; Kekis, G.; Ververidou, E.; Sevastou, E. Erosion control by application of hydroseeding methods along the Egnatia Motorway (Greece). Eco-and Gr. Bio-Engineering Use Veg. Improv. Slope Stab. 2007, 103, 393–400. [Google Scholar] [CrossRef]
- ASTM D6913/D6913M-17: Standard Test Methods for Particle-Size Distribution (Gradation) of Soils Using Sieve Analysis; ASTM International: West Conshohocken, PA, USA, 2017.
- ASTM D7928-17: Standard Test Method for Particle-Size Distribution (Gradation) of Fine-Grained Soils Using the Sedimentation (Hydrometer) Analysis; ASTM International: West Conshohocken, PA, USA, 2017.
- ASTM D4318-17e1: Standard Test Methods for Liquid Limit, Plastic Limit, and Plasticity Index of Soils; ASTM International: West Conshohocken, PA, USA, 2017.
- ASTM D854-14: Standard Test Methods for Specific Gravity of Soil Solids by Water Pycnometer; ASTM International: West Conshohocken, PA, USA, 2014.
- ASTM D3080/D3080M-11: Standard Test Method for Direct Shear Test of Soils Under Consolidated Drained Conditions; ASTM International: West Conshohocken, PA, USA, 2011.
- Day, S.R.; Daniel, D.E. Hydraulic Conductivity of Two Prototype Clay Liners. J. Geotech. Eng. 1985, 111, 957–970. [Google Scholar] [CrossRef]
- Fredlund, D.G.; Xing, A.; Fredlund, M.D.; Barbour, S.L. The relationship of the unsaturated soil shear to the soil-water characteristic curve. Can. Geotech. J. 1996, 33, 440–448. [Google Scholar] [CrossRef]
- ASTM D7263-09(2018)e1: Standard Test Methods for Laboratory Determination of Density (Unit Weight) of Soil Specimens; ASTM International: West Conshohocken, PA, USA, 2018.
- Skempton, A.W. Long-Term Stability of Clay Slopes. Géotechnique 1964, 14, 77–102. [Google Scholar] [CrossRef]
- Alonso, E.E.; Gens, A.; Josa, A. A constitutive model for partially saturated soils. Géotechnique 1990, 40, 405–430. [Google Scholar] [CrossRef]
- Bishop, A.W. The principle of effective stress. Tek. Ukebl. 1959, 106, 859–863. [Google Scholar]
- Schrefler, B.A. The Finite Element Method in Soil Consolidation (with Applications to Surface Subsidence). Ph.D. Thesis, University College of Swansea, Swansea, UK, 1984. [Google Scholar]
- Fredlund, D.G.; Morgenstern, N.R.; Widger, R.A. The shear strength of unsaturated soils. Can. Geotech. J. 1978, 15, 313–321. [Google Scholar] [CrossRef]
- Maksimovic, M. Nonlinear Failure Envelope for Soils. J. Geotech. Eng. 1989, 115, 581–586. [Google Scholar] [CrossRef]
- Sánchez Castilla, M. Thermo-Hydro-Mechanical Coupled Analysis in Low Permeability Media. Ph.D. Thesis, Universitat Politècnica de Catalunya, Barcelona, Spain, 2004. [Google Scholar]
- Florides, G.; Kalogirou, S. Measurements of Ground Temperature at Various Depths. In Proceedings of the SET 2004, 3rd International Conference on Sustainable Energy Technologies, Nottingham, UK, 28–30 June 2004; pp. 1–6. [Google Scholar]
- Horton, R.E. An Approach Toward a Physical Interpretation of Infiltration-Capacity. Soil Sci. Soc. Am. J. 1940, 5, 399–417. [Google Scholar] [CrossRef]


| Parameter Measured | Model | Measuring Range |
|---|---|---|
| Soil temperature | Campbell 107 | 35 to +50 °C |
| Volumetric water content | Decagon 5TE | 0 to 1 m3/m3 |
| Soil temperature | −40 to +50 °C | |
| Electric conductivity | 0 to 23 dS/m | |
| Pore water pressure | Decagon MPS-6 | −9 to −100,000 kPa |
| Soil temperature | −40 to +60 °C | |
| Pore water pressure | UMS T4 | −85 to +100 kPa |
| Air temperature | Decagon VP-4 | −40 to +80 °C |
| Relative air humidity | 0 to 100% | |
| Atmospheric pressure | 49 to 109 kPa | |
| Wind speed | Davis Cup Anemometer | 0.9 to 78 m/s |
| Wind direction | 0 to 360° | |
| Heat flux | Hukseflux HFP01 | ±2000 W/m2 |
| Net solar radiation | Kipp & Zonnen NR Lite2 | ±2000 W/m2 |
| Sensor | Depth of Installation (cm) | |||
|---|---|---|---|---|
| SV | SnV | NV | NnV | |
| Air/soil temperature | +9.5, −1, −6, −11, −16, −36, −43 | +9.5, −1, −6, −11, −16, −32, −36, −57 | +9.5, −1, −6, −11, −16, −36, −56 | +9.5, −1, −6, −11, −16, −36, −56 |
| Volumetric water content | −6, −16, −36, −43 | −6,−16, −36, −57 | −6, −16, −36, −56 | −6, −16, −36, −56 |
| Pore water pressure | −16, −36, −40, −43 | −11, −32, −72 | −16, −36, −56, −59 | −16, −36, −56 |
| Parameter Measured | Model | Measurement Range |
|---|---|---|
| Rainfall | Decagon ECRN-100 | 0.2 mm * |
| Air temperature | Decagon VP-4 | −40 to +80 °C |
| Relative air humidity | 0 to 100% | |
| Atmospheric pressure | 49 to 109 kPa | |
| Solar radiation | Davis Vantage Pro2 | 0 to 1800 W/m2 |
| Wind speed | Davis Cup Anemometer | 0.9 to 78 m/s |
| Wind direction | 0 to 360° |
| Soil Property | Value |
|---|---|
| Gravel content (%) | 34–42 |
| Sand content (%) | 30–43 |
| Silt content (%) | 20–25 |
| Clay content (%) | 4–6 |
| Fines (%) | 25–31 |
| Liquid limit (%) | 29.5–34.4 |
| Plastic limit (%) | 19.9–21.2 |
| Plasticity index (%) | 9.7–13.5 |
| Specific gravity (Mg/m3) | 2.65–2.70 |
| Cohesion (kPa) | 0 |
| Friction angle (°) | 58 |
| Hydraulic conductivity (m/s) | 7.7 × 10⁻⁸–1.8 × 10⁻⁷ |
| Soil Property | South Slope | North Slope |
|---|---|---|
| Bulk density (Mg/m3) | 1.72–1.78 | 1.85–1.93 |
| Dry density (Mg/m3) | 1.52–1.57 | 1.55–1.61 |
| Water content (%) | 13.23–15.11 | 19.08–19.84 |
| Void ratio (-) | 0.70–0.76 | 0.66–0.72 |
| Porosity (-) | 0.41–0.43 | 0.40–0.42 |
| Fitted Parameters | Drying | Wetting |
|---|---|---|
| (kPa) | 66.7 | 9.5 |
| (-) | 0.28 | 0.20 |
| (kPa) | 2.5 × 10⁵ | 2.5 × 10⁵ |
| (-) | 1.30 | 2.80 |
| 1 | 1 | |
| 0 | 0 |
© 2018 by the authors. Licensee MDPI, Basel, Switzerland. This article is an open access article distributed under the terms and conditions of the Creative Commons Attribution (CC BY) license (http://creativecommons.org/licenses/by/4.0/).
Share and Cite
Oorthuis, R.; Hürlimann, M.; Fraccica, A.; Lloret, A.; Moya, J.; Puig-Polo, C.; Vaunat, J. Monitoring of a Full-Scale Embankment Experiment Regarding Soil–Vegetation–Atmosphere Interactions. Water 2018, 10, 688. https://doi.org/10.3390/w10060688
Oorthuis R, Hürlimann M, Fraccica A, Lloret A, Moya J, Puig-Polo C, Vaunat J. Monitoring of a Full-Scale Embankment Experiment Regarding Soil–Vegetation–Atmosphere Interactions. Water. 2018; 10(6):688. https://doi.org/10.3390/w10060688
Chicago/Turabian StyleOorthuis, Raül, Marcel Hürlimann, Alessandro Fraccica, Antonio Lloret, José Moya, Càrol Puig-Polo, and Jean Vaunat. 2018. "Monitoring of a Full-Scale Embankment Experiment Regarding Soil–Vegetation–Atmosphere Interactions" Water 10, no. 6: 688. https://doi.org/10.3390/w10060688
APA StyleOorthuis, R., Hürlimann, M., Fraccica, A., Lloret, A., Moya, J., Puig-Polo, C., & Vaunat, J. (2018). Monitoring of a Full-Scale Embankment Experiment Regarding Soil–Vegetation–Atmosphere Interactions. Water, 10(6), 688. https://doi.org/10.3390/w10060688