Abstract
An operational two-dimensional real-time flood forecasting system has been developed to prevent urban inundation in Taiwan, and it uses the Delft-FEWS (Flood Early Warning System) platform to integrate the SOBEK models to forecast flooding. A new generation of smart water level gauges, integrating power charging, recording, transmission, and sensing into one, can monitor the inundation on roads in real-time. This study took Annan District in Tainan City, Taiwan, as the study object and presented the application of the flood forecasting system and smart water level gauges in the urban environment. The collected data from Storm 0611 and Typhoon Megi in 2016 were used to assess the accuracy of the flood forecasting system. The analysis of three water level stations in the drainage showed that the one-dimensional simulation results were fairly accurate. According to the 18 observed and simulated inundation depths on the roads, the true positive, false positive, false negative, and true negative values were 8, 0, 2, and 8, respectively. The accuracy, sensitivity, and precision of the flood forecasting system were 0.889, 0.800, and 1.000, respectively, indicating that the two-dimensional simulation results were highly accurate.
1. Introduction
To prevent flood disasters by increasing the response time, many countries have developed their own flood forecasting systems, such as the Watershed Simulation and Forecasting System (WSFS) of Finland [1], the Melbourne Water’s Flood Integrated Decision Support System (FIDSS) of Melbourne, Australia [2], the Ensemble Streamflow Prediction (ESP) of Sweden [3], the Mekong Flood Forecasting System of the Mekong River Commission [4], the National Flood Forecasting System (NFFS) of UK [5], and the Iowa Flood Information System (IFIS) of Iowa State, USA [6]. In Taiwan, the Water Resources Agency has developed the FEWS_Taiwan platform based on the structure of the Delft-FEWS platform. Currently, not only meteorology, radar, rainfall, water level, and other hydrological information, but also numerous hydrological and hydrodynamic models have been integrated into the platform. The flood forecasting system uses real-time monitoring data on rainfalls, discharges, water levels, and tide levels for flood forecasting. The river stages for 26 main rivers in Taiwan in the next three to 24 h are issued during the flooding period to reduce flood disasters [7,8]. Presently, most flood forecasting systems use a one-dimensional model for the computation. Nonetheless, one-dimensional models alone cannot accurately simulate flows in complex terrains, such as urban environments [9].
In recent years, because more river embankments have been built in Taiwan, the major cause of flooding has switched from river overflows to urban inundation. To prevent urban inundation, the Water Resources Agency has developed a two-dimensional real-time flood forecasting system, which adopts the Delft-FEWS platform to integrate the SOBEK models and the quantitative precipitation forecasts from the Central Weather Bureau. The system uses parallel computation for flood simulation, and it takes only an hour to come up with forecasts for the next three hours [10].
In Taiwan, the river terrains are quite steep, so the concentration time in rivers usually lasts only several hours. In urban areas, the concentration time of storm sewer systems usually lasts less than one hour. The authorities and people get ready for flood preparations as the Central Weather Bureau issues a typhoon sea or land warning. As a flood forecast is issued, the flood gates for the buildings in the flood-prone area are set up and the important items in the house are moved to higher places. Because most of the buildings in Taiwan are made of concrete and over two stories high, people can quickly evacuate to the second floor of the building or the neighboring shelter. Mobile pumps are dispatched to the flood-prone areas by authorities.
Traditionally, water levels or discharges from the streams are used to assess the accuracy of hydrological and hydraulic models; however, such data cannot test distributed model performance in the urban area. Most methods used to test distributed hydraulic model predictions are inundation extent and maximum water elevation. Several methods, such as aerial photos, airborne and satellite synthetic aperture radar (SAR) data, post-event trash line surveys, and post-event Light Detection and Ranging (LiDAR) survey of flood deposits, have been adopted to survey inundation extent [11].
In recent years, crowd-sourced methods are used due to the popularity of smart phones and community softwares. Blumberg et al. [12] simulated the inundation in Hoboken and Jersey City, USA, during Hurricane Sandy on 29 October 2012, by the Stevens Institute Estuarine and Coastal Ocean Hydrodynamic Model (sECOM). Thousands of emails were sent out to ask for photographs and videos, and hundreds of photographs were received. However, most of these survey results could not be used due to the lack of both accurate time registration and precise location. Many witnesses were interviewed and most of them had great stories about the flooding, but few of them could provide specific information for model validation. At last, besides the 19 U.S. Geological Survey verified high watermarks, only 26 watermarks from verbal stories and 11 watermarks from photographs or videos were adopted for model validation. Yin and Wilby [13] adopted the FloodMap-HydroInundation2D model to evaluate the impact of land subsidence on flood risks in Shanghai, China, and used crowd-sourced data for model validation. The crowd-sourced data can provide information about inundation, including the rough location, upload time, empirical estimate of inundation depth, and pictures. However, only a few entries of the recorded time in crowd-sourced data were the exact time when the actual inundation happened. Compared with the recorded time, the location of crowd-sourced data is relatively more reliable as it usually comes with the associated addresses. However, such addresses do not reflect the precise inundation location, making it difficult to mark them on the map. Most reported incidents usually have inherent uncertainties in terms of location and timing, and only a few reported incidents are reliable for model validation. Liu et al. [14] developed a cellular automaton (CA) model to simulate stormwater runoff and the flood inundation process in Guangzhou, China. There were 35-min and 13-min street-monitoring closed-circuit television (CCTV) videos used to verify the model. Chang et al. [15] simulated dynamic flow interactions between storm sewers and overland surface with a novel approach, coupling the 1D sewer flow model and the 2D overland flow model in New Taipei, Taiwan. Four flooding events were selected for model validation, and the New Taipei City Government recorded the flooded areas immediately after their occurrences.
From the above research, we can find that the inundation extent and water depth measured at different times in the urban area cannot describe the complete hydrograph of inundation depth. In the past, only some fragmented observed data were used for comparison with the simulated inundation depth. The comparison between the continuously observed and simulated inundation depth has not been mentioned before, especially in real and complex urban environments. In recent years, due to the development of “Internet of Things” technology, a new generation of smart water level gauges (Anasystem SenSmart WLS, Anasystem, Hsinchu City, Taiwan) has been developed. The gauges, integrating power charging, recording, transmission, and sensing into one, can be quickly installed onto utility poles and lighting poles. Real-time water levels are transmitted to the cloud system by a low-power wide-area network (LPWAN).
The operational two-dimensional real-time flood forecasting system and the smart water level gauges are first introduced in this paper. This study took Annan District in Tainan City, Taiwan, as the study object and presented the application of the flood forecasting system and the smart water level gauges on roads in the urban environment. The paper is organized as follows: Section 2 gives details of the selected case study. Section 3 summarizes the main characteristics of the two-dimensional real-time flood forecasting system and defines the performance evaluation measures used for evaluating the results. Section 4 presents and discusses the results obtained using the proposed forecasting system. Section 5 outlines a summary of the previous sections.
2. Study Area
This study examines Annan District in Tainan City, Taiwan. Annan District is roughly 107 km2, with about 62,000 households and about 191,000 people. The precipitation of the dry season, from November to April, is only 10% of the total annual rainfall of 2000 mm. The land uses in Annan District are agriculture (21.5%), aquaculture (29.7%), forest (2.0%), traffic (6.2%), water (9.4%), build-up (12.5%), public (1.9%), recreation (1.3%), vacant (8.7%), and other (6.8%) (Figure 1).
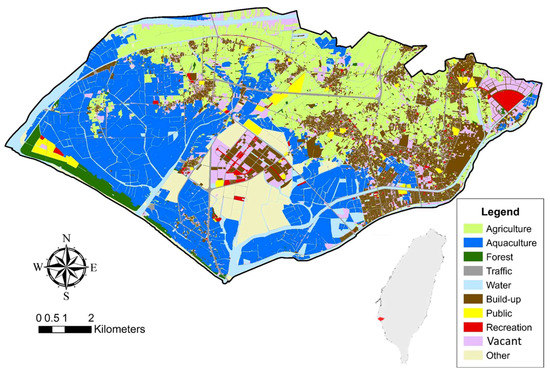
Figure 1.
The land use in Annan District, Tainan City, Taiwan.
Zengwun River is in the north of the district, Yanshuei River in the south, and Taiwan Strait in the west (Figure 2). The terrain is relatively flat, and within the area, there are no mountains or hills. The terrain is more elevated (9 m) in the northeast and lower in the southwest (1 m), resulting in a descending slope of 1/1600 on average. Flooding is likely to occur whenever a typhoon invades Annan District. It is because the area is rather flat or even low-lying, so gravity drainage is hindered. In addition, the drainage exits are often affected by backwater because of tides, which makes water drainage difficult.
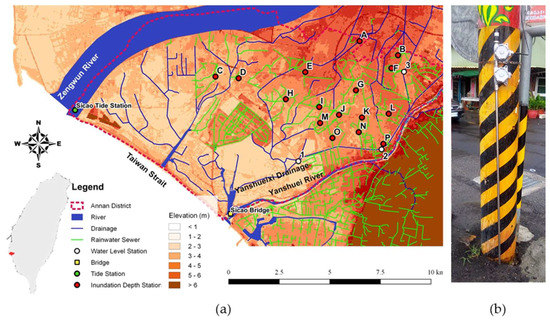
Figure 2.
(a) Location of the study area; (b) smart water level gauges.
In this study, observation records for two rainfall events were used: one is the Storm 0611 on 11 June 2016, and the other is Typhoon Megi on 27 September 2016. The rainfall intensity, tide hydrograph, and the maximum simulated inundation range are shown in Figure 3 and Figure 4.
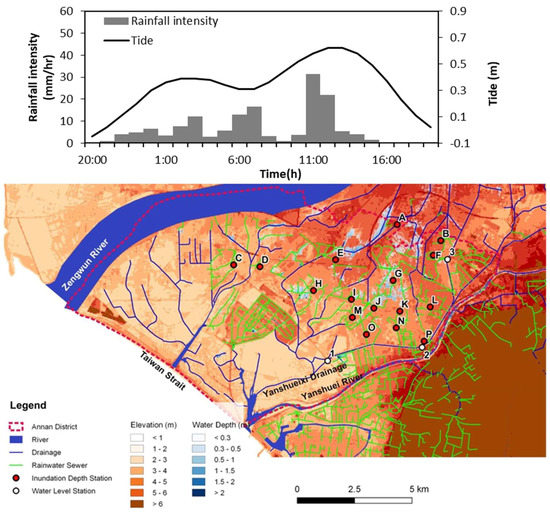
Figure 3.
Rainfall and tide hydrograph and chart of inundation simulation range for Storm 0611.
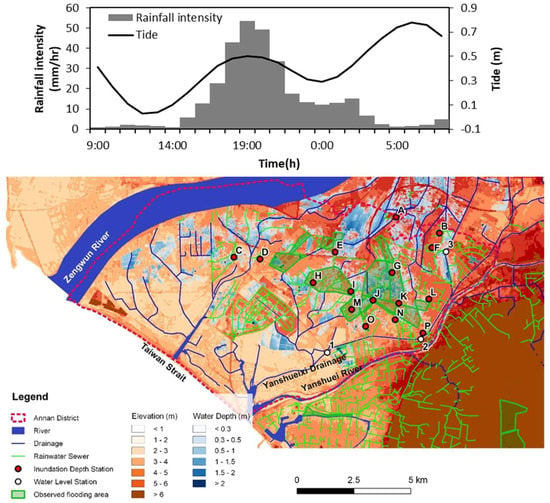
Figure 4.
Rainfall and tide hydrograph and chart of inundation simulation range for Typhoon Megi. The investigation of the observed flooding area came from the field survey done by the engineers from the Water Resources Agency. The field survey focused on the communities, but for agricultural land and fish farms, this survey has its limitation and uncertainty.
Storm 0611 was caused by the southwest monsoon, and it led to floods in part of Annan District. Fortunately, there was no significant damage. The total 24-h precipitation of the Storm 0611 was 151.3 mm, the simulated inundation area was 1264 ha, and the average inundation depth was 0.17 m.
Typhoon Megi made initial landfall in Huilian County, Taiwan, on 27 September at 14:00 and left the island from Yunlin County at 21:10. The entire island was invaded by the storm, and the typhoon caused significant damage to Taiwan. The maximum 12-h accumulated rainfall from Typhoon Megi was 292.8 mm, and the rainfall was not only heavy but also intense. What was worse is that the event coincided with the time of high tide, causing difficulty in draining water from low-lying areas. Moreover, the capacity of the water pumps was insufficient to cope with such a heavy rainfall. Consequently, flooding occurred at many places. After the water pumps were used continuously, the floodwater finally receded. Ultimately, this typhoon caused floods in many places in Tainan City. The total rainfall from Typhoon Megi over 24 h was 320.6 mm, the simulated inundation area was 4658 ha, and the average inundation depth was 0.33 m.
3. Materials and Methods
3.1. Two-Dimensional Real-Time Flood Forecasting System
The Delft-FEWS framework is developed to provide a platform on which operational forecasting systems can be constructed [16,17]. The Delft-FEWS system allows flexibility in the integration of many hydrological and hydraulic models and real-time data, and produces forecasts on a daily basis. Since its introduction in 2002/2003, the Delft-FEWS operational forecasting platform has been applied in over forty operational centres [18]. The two-dimensional real-time flood forecasting system is designed according to the Delft-FEWS platform, which integrates the quantitative rainfall forecast from the Central Weather Bureau and SOBEK models that perform parallel computation (Figure 5). The parallel computation is handled by the forecasting shell servers. Data transmission is controlled and done uniformly by the master control (MC) server. The flooding simulation of the entire urban area is divided into various projects, and each project is assigned to be calculated in a specific forecast shell server (FSS) computation unit. The computation of each project has to be completed within a specific amount of time. Lastly, the flooding simulation results of each project are integrated to generate the potential flooding range for the entire urban area. The workflow of the two-dimensional real-time flooding forecasting system is as follows:
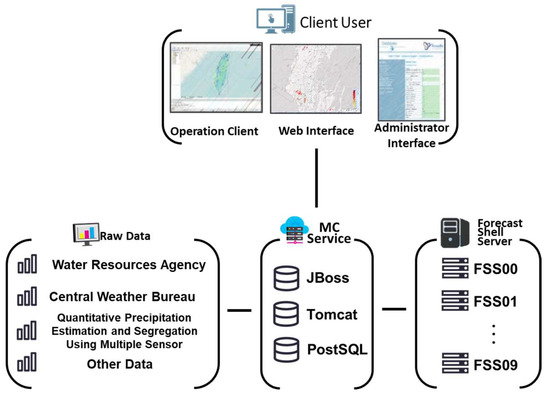
Figure 5.
Two-dimensional real-time flood forecasting system framework. MC: master control; FSS: forecast shell server.
1. The data collection of the meteorological and hydrological observations and forecasts
The meteorological and hydrological data from the Central Weather Bureau and Water Resources Agency include observation and forecast data, which are saved in different data formats, such as in databases, files, FTPs (File Transfer Protocols), or web services, and so forth. An automated data collection program must be established to ensure that the data is available at a predetermined time.
2. The space conversion of the meteorological and hydrological observations and forecasting data
When integrating different hydrological and meteorological observations and forecasts, there is a need to consider how to deal with data heterogeneity. The data supplement, format conversion, data interpolation, and data check are carried out by Delft-FEWS, which can solve the problem of inconsistent timeline or null values. In addition, different weather forecast data can be converted into the same spatial resolution.
3. 2D flood simulation of the SOBEK model
The model simulation includes two phases: state run and forecast run. The state and forecast runs adopt the observed and forecasted rainfall as the input of the model, respectively. The entire Tainan City is divided into seven units for parallel model simulation.
4. Integration and output of simulation results
The simulation results of the seven units are integrated and presented. Then, the data format of the integrated simulation result is converted from ASC file into netcdf file format.
The SOBEK model has several modes, such as Rainfall-Runoff, 1D FLOW-Urban, 1D FLOW-Rural, and Overland Flow-2D, and so forth [19]. The version of SOBEK used in this study is 2.13. In this study, rivers, regional drainages, rainwater sewers, and various hydraulic structures, such as bridges, pumping stations, gates, and detention basins, were set up in SOBEK. The digital elevation model (DEM) was produced by the Ministry of Interior in Taiwan with Airborne LiDAR point cloud with an elevation accuracy of 10–20 cm. The resolution in time and space were 1 min and 20 m, respectively. For abstractions, it is calculated based on the U.S. Soil Conservation Service Curve Number (SCS CN) method, in which the DEM and land-use were required to set up the flow path, as well as the slope in the watershed and curve number. As for rainfall-runoff modeling, it was calculated based on the U.S. Soil Conservation Service’s dimensionless unit hydrograph. Additionally, the rainfall series and tide elevation at the river outlet were treated as the boundary conditions given in advance. Four and two historical flood events were used for model calibration and validation, respectively [20]. The SCS CN method is as follows:
where:
Pe: rainfall excess (mm)
P: depth of precipitation (mm)
S: potential maximum retention (mm)
CN: curve number.
Lag time is computed according to the SCS lag equation, shown as follows:
where:
T1ag: lag time (h)
L: length of the longest drainage path (m)
H: average watershed slope (%)
S: potential maximum retention (mm)
CN: curve number.
The SCS dimensionless unit hydrograph model as the rainfall-runoff model was adapted to compute the discharge:
where:
Tlag: lag time of peak flow (h)
Tc: time of concentration (h)
Tp: time to peak flow (h)
Tr: recession limb time
Tb: runoff time base (h)
Qp: quantity of peak flow (m3/s)
A: area of catchment (km2)
R: quantity of effective rainfall (mm).
3.2. Field Observation
In terms of rainfall data, they were obtained from the quantitative precipitation estimation and segregation using multiple sensors (QPESUMS) of the Central Weather Bureau. The QPESUMS was based on six Doppler radars in Taiwan to estimate the precipitation and other hydrologic parameters, and it has been used to monitor severe weather since 2003. The weather information is updated every 10 min including 1.3-km resolution rainfall intensities covering all Taiwan land area [21,22]. The grid resolution of rainfall data was 1.3 km × 1.3 km, while the interval was 10 min. The water levels in the Yanshueixi Drainage were measured by the three water level stations of the Tainan City Government. The water levels are measured by the ultrasonic sensors with the accuracy of 0.25%. Sixteen smart water level gauges (Anasystem SenSmart WLS) were installed onto telephone poles on the roads to observe the inundation process in flood-prone areas (Figure 2). The gauges measure the water level by Radio Frequency (RF) admittance, with accuracy of 0.5% of the probe (usually 1.5–2.0 m long). Real-time water levels are transmitted to the cloud system by long range (LoRa) every 30 s. For tidal data, they were obtained from Sicao Tide Station.
3.3. Statistical Error Indices of 1D Water Depth
This study uses four error analysis indices to quantify errors between the observed and the simulated water depth of the three water level stations. The four indices are the coefficient of efficiency (CE) [23], the root mean square error (RMSEh), the error of peak water depth (EHp), and the difference of time as peak water depth happened (ETh,p). CE shows the relationship between the simulated and observed values; the closer the CE is to 1, the better the model simulation. RMSEh represents the error between the simulated and observed values. EHp indicates the differences between the maximum simulated and observed water depths. ETh,p denotes the differences between the time when maximum simulated and observed water depth happened. The equations of these indices are presented below:
where:
Hsim(ti): the simulated water depth (m) at t time
Hobs(ti): the observed water depth (m) at t time
: the average observed water depth (m)
T: the computation time (10 min)
Hp,sim: the maximum simulated water depth (m)
Hp,obs: the maximum observed water depth (m)
Th,p,sim: the time as the maximum simulated water depth happened
Th,p,obs: the time as the maximum observed water depth happened.
3.4. Statistical Error Indices of 2D Inundation Depth
This study uses four error analysis indices to quantify errors between the observed and the simulated inundation depth. The four indices are the correlation coefficient (R), the root mean square error (RMSEd), the error of peak inundation depth (EDp), and the difference of time as peak inundation depth happened (ETd,p). R shows the relationship between the simulated and observed values; the closer the R is to 1, the better the model simulation. RMSEd represents the error between the simulated and observed values. EDp indicates the differences between the maximum simulated and observed inundation depths. ETd,p denotes the differences between the time when maximum simulated and observed inundation depth happened. The equations of these indices are presented below:
where:
Dsim(ti): the simulated inundation depth (m) at t time
Dobs(ti): the observed inundation depth (m) at t time
: the average simulated inundation depth (m)
: the average observed inundation depth (m)
T: the computation time (10 min)
Dp,sim: the maximum simulated inundation depth (m)
Dp,obs: the maximum observed inundation depth (m)
Td,p,sim: the time as the maximum simulated inundation depth happened
Td,p,obs: the time as the maximum observed inundation depth happened.
3.5. Performance Indicators
In this study, the confusion matrix [15,24,25,26] was adopted to calculate the indicators and evaluate the performance of the flood forecasting system. There are four categories of possible agreement between the simulation and observation results (Table 1). True positive (TP) shows the number that the model predicts flooding correctly. False positive (FP) represents the number of times that the model predicts incorrectly. False negative (FN) indicates the number that the model fails to predict flooding. True negative (TN) denotes the number that the model rightly predicts no flooding. Three indicators, including accuracy (ACC), sensitivity (true positive rate, TPR) and precision (positive predictive value, PPV), were used to evaluate the goodness of modelling results as follows:

Table 1.
Confusion matrix.
4. Results and Discussion
4.1. Water Level Stations
The simulated and observed water depth hydrographs of the three water level stations for Yanshueixi Drainage are shown in Figure 6. Statistical error analysis results are shown in Table 2.
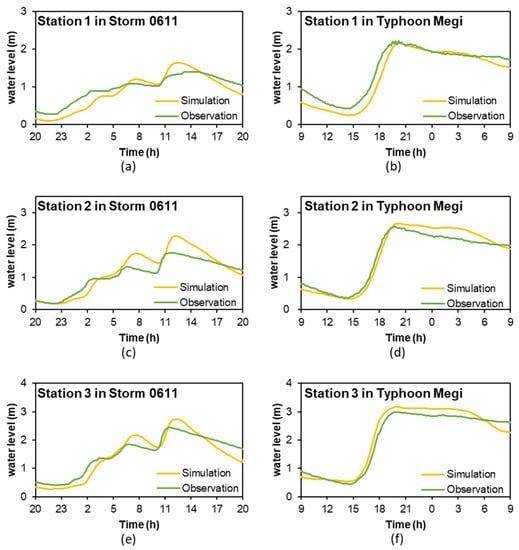
Figure 6.
Water level hydrograph of water level stations. (a) Station 1 in Storm 0611; (b) Station 1 in Typhoon Megi; (c) Station 2 in Storm 0611; (d) Station 2 in Typhoon Megi; (e) Station 3 in Storm 0611; (f) Station 3 in Typhoon Megi.

Table 2.
Water level stations’ statistical error indices.
The CE values of the Storm 0611 from the three water level stations were 0.686, 0.716, and 0.861, and the more downstream the station was located, the smaller the CE value was. The RMSEh values were 0.19, 0.27, and 0.25 m. The EHp of the Storm 0611 were 8.9%, 20.7%, and 11.6%. All three water level stations overestimated the maximum simulated water level. When the time the maximum water level happened at Station 1, it was 60 min earlier than the time when the maximum simulated water level happened. This error was bigger than the errors from the other two stations, which showed a delay of only 30 and 20 min, respectively. For Storm 0611, the simulated and observed water level in Station 2 and 3 were close to each other before 3:00; however, the water level bias changed with the precipitation intensity during 3:00–14:00, and the uncertainty might come from QPESUMS.
For Typhoon Megi, the CE values were 0.890, 0.944, and 0.957. The results showed that the computation accuracy by the one-dimensional channel hydrodynamic model of SOBEK was highly accurate. The RMSEh values were 0.21, 0.19, and 0.21 m, which were similar. The EHp from the three stations were −2.0%, 2.8%, and 5.9%, and the simulated maximum water level and the observed maximum water level were similar. Three stations had a delay of 30, 30, and 10 min, respectively, and the time from simulated maximum water level and the time from observed maximum water level were very close. However, it was indicated that the more downstream the water level station was located, the less accurate the overall simulation result was. This was because the more downstream the water level station was located, the greater impact from the downstream boundary conditions was. Since there was no water level station at the estuary (Sicao Bridge), the Sicao Tide Station, located 4 km to the northeast of the estuary, was used instead (Figure 2). This choice might be responsible for errors in the downstream boundary conditions. In the future, it is important to set up a water level station at the estuary (Sicao Bridge) and use it as a boundary condition in the modeling to improve modeling simulation.
4.2. Inundation Depth Stations
For Storm 0611, stations A, C, F, and L were excluded for the reasons of instrument calibration. For stations B, D, G, H, I, K, N, and O, both the observed and simulated inundation depths showed no flooding. Figure 7 shows the observed and simulated inundation depth hydrographs of stations E, J, M, and P, and Table 3 indicates their statistical error indices. For stations E and J, the values of R, RMSEd, EDp, and ETd,p indicated that the model predicted flooding highly accurately. For station M, the maximum observed inundation depth was higher than the maximum simulated inundation depth of 0.06 m, and it denoted that the model predicted flooding fairly accurately. However, station P’s simulation result showed no flooding, but the observation result showed flooding. When examining the SOBEK model, it was found that the rainwater sewer near station P was not full, and no water came out of the manhole. Nonetheless, the observation data showed that there was inundation at the station. When checking the on-site condition, it was found that station P was at a partially low-lying area. Therefore, before rainwater went into the rainwater sewer, the low-lying terrain had already caused flooding on the surface.
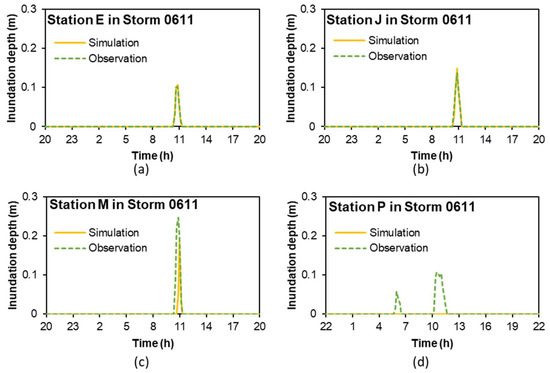
Figure 7.
Inundation depth hydrographs of stations E, J, M, and P during Storm 0611. (a) Station E in Storm 0611; (b) Station J in Storm 0611; (c) Station M in Storm 0611; (d) Station P in Storm 0611.

Table 3.
Inundation depth stations’ statistical error indices.
For Typhoon Megi, stations A, B, C, E, H, L, M, N, O, and P were excluded for the reasons of instrument unavailability due to lease expiration. Figure 8 shows the observed and simulated inundation depth hydrographs of stations D, F, G, I, J, and K, and Table 3 indicates their statistical error indices. For stations D, I, and J, the values of R, RMSEd, EDP, and ETd,p indicated that the model predicted flooding highly accurately. For stations F and K, the maximum observed inundation depths were higher than the maximum simulated inundation depths of 0.06 and 0.03 m, which showed that the model predicted flooding accurately. However, the model failed to predict flooding at station G. Because station G was located near a temple in a low-lying area, this type of inundation has not been able to be simulated by the SOBEK model.
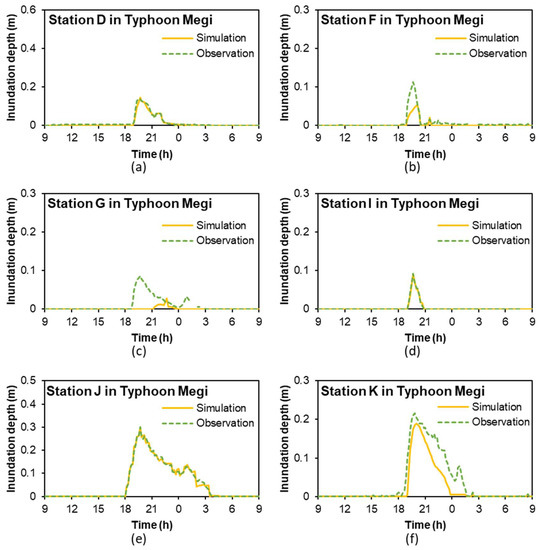
Figure 8.
Inundation depth hydrographs of stations D, F, G, I, J, and K during Typhoon Megi. (a) Station D in Typhoon Megi; (b) Station F in Typhoon Megi; (c) Station G in Typhoon Megi; (d) Station I in Typhoon Megi; (e) Station J in Typhoon Megi; (f) Station K in Typhoon Megi.
4.3. Performance Indicators
In this study, there was a total 18 field inundation depth observations. According to the simulated and the observed results, the TP, FP, FN, and TN values were 8, 0, 2, and 8, respectively (Table 4). The accuracy (ACC), sensitivity (TPR), and precision (PPV) were 0.889, 0.800, and 1.000, respectively, and indicated that the computation accuracy of the two-dimensional real-time flood forecasting system was accurate.

Table 4.
Confusion matrix of simulated and observed maximum inundation depths.
4.4. The Causes of Uncertainties of the Two-Dimensional Real-Time Flood Forecasting System
Because SOBEK combines one-dimensional channel hydrodynamic modeling and two-dimensional flood modeling, the model cannot simulate small-scale low-lying areas with poor drainage systems on the road. The small-scale inundation condition can only be detected by smart water level gauges. In addition, there were several sources of uncertainties in date, model, and field situation. The QPESUMS (quantitative precipitation estimation and segregation using multiple sensors), based on six Doppler radars in Taiwan, was adopted as the input item of the SOBEK model, and had its uncertainty. The discharge of the watershed was estimated by using the SCS unit hydrograph method. The abstraction of rainfall in this study was calculated using the U.S. Soil Conservation Service Curve Number Method, which involves mainly the surface runoff and is easy to use, but cannot describe the complex hydrological process. The state of the model prior to the flood events was a source of uncertainty. To reduce this uncertainty, we presimulated the model with three-hour observed prospection before the forecast. In addition, blocks in road drainage ditches, storm sewers, and regional drainage in the field were unpredictable for inundation forecast during storm events.
4.5. The Application of Smart Water Level Gauges
Besides traditional water levels or discharges from the stream used to validate hydrological and hydraulic models, several other methods have been used to capture the information of inundation time and depth in the urban area in recent years. However, these methods have their limitations. The maximum inundation depths measured by post-event surveys cannot capture the time series of flooding. The crowd-sourced method seems to be able to get more information about inundation time and location. However, several research works indicated that most survey results could not be used due to the lack of both accurate time registration and precise location for model validation. The researchers had to spend a lot of time to deal with the post-event survey information, and only a few of them could be used [12,13]. In addition, the information investigated from the crowd-sourced method was fragmented and could not capture the time series of flooding. The CCTV videos could be used to verify the model [14]; however, the image quality of CCTV was affected by the weather condition and the inundation depth could not be read from the image immediately. The smart water level gauge is a good solution for the validation of hydrological and hydraulic models. It features high accuracy, all-weather operation, and can monitor the entire flooding process, including flooding and floodwater recession. The gauge readings can be transmitted in real-time to the cloud system by LPWAN. This information not only can be used to modify the forecasting results, but issue the flooding warning. Because flooding usually occurs repeatedly at the same locations in the urban area, the suitable set of smart water level gauges can effectively capture the flooding situation during flooding events.
In Taiwan, flood forecasting systems are gradually being developed for other cities and countries, and the smart water level gauges are being set up in the urban area. The models of flood forecasting systems can be improved through field observations in the future. A real-time error-correction method for the forecasted river stage of Delft-FEWS used a combination of forecast errors estimated by the time series models and the average deviation model [27]. The method can effectively reduce the errors of forecasted water stages, and therefore enhance the reliability of forecast information. The method, further improved by the Kalman filter (KF) model, can effectively reduce the uncertainties of the river stage forecasts, and present consistent high-correction performance under various rainstorm events [28]. In the future, the method will be applied to the real-time corrections of inundation depth. In addition, field observations from the smart water level gauges can make up for the shortcomings of the models. The integration of field observations and model calculations will increase the overall accuracy of forecast results.
5. Conclusions
The operational two-dimensional real-time flood forecasting system was developed by using the Delft-FEWS platform, which integrated the quantitative rainfall forecast and SOBEK models that performs parallel computation. Three water level stations in the Yanshueixi Drainage measured the water levels, and sixteen smart water level gauges on the roads measured the inundation depths. The collected data from Storm 0611 and Typhoon Megi in 2016 were used to assess the accuracy of the flood forecasting system. The analysis of water depths in the drainage showed that the 1D simulation results were fairly accurate. According to the 18 observed and simulated inundation depths on the roads, the true positive, false positive, false negative, and true negative values were 8, 0, 2, and 8, respectively. The accuracy, sensitivity, and precision were 0.889, 0.800, and 1.000, respectively, and indicated that the 2D simulation results were highly accurate. The reason for the model failing to predict flooding was that SOBEK model, coupling Rainfall-Runoff, 1D FLOW, and Overland Flow-2D modules, could not simulate small-scale low-lying areas with poor drainage systems on the road. The small-scale inundation condition can only be detected by smart water level gauges.
Author Contributions
Che-Hao Chang and Ming-Ko Chung performed the experiments; Song-Yue Yang wrote the paper; Chih-Tsung Hsu and Shiang-Jen Wu built the model.
Funding
This research was funded by the Water Resources Agency, Ministry of Economic Affairs, Taiwan grant number MOEAWRA1050132.
Acknowledgments
The authors thank the editors and anonymous referees for their thoughtful comments and suggestions. This research project is funded by the Water Resources Agency, Ministry of Economic Affairs, Taiwan (grant numbers MOEAWRA1050132). The authors thank George Chih-Yu Chen for his assistance in the English editing.
Conflicts of Interest
The authors declare no conflict of interest.
References
- Vehviläinen, B.; Huttunen, M. Hydrological forecasting and real time monitoring in Finland: The watershed simulation and forecasting system (WSFS). Water Qual. Meas. 2001. [Google Scholar] [CrossRef]
- Kirby, D. Flood integrated decision support system for Melbourne (FIDSS). In Proceedings of the 2015 Floodplain Management Association National Conference, Brisbane, Australian, 19–22 May 2015. [Google Scholar]
- Johnell, A.; Lindström, G.; Olsson, J. Deterministic evaluation of ensemble streamflow predictions in Sweden. Hydrol. Res. 2007, 38, 441–450. [Google Scholar] [CrossRef][Green Version]
- Tospornsampan, M.J.; Malone, T.; Katry, P.; Pengel, B.; An, H.P. FMMP component 1 short and medium-term flood forecasting at the regional flood management and mitigation centre. Mekong River Comm. 2009, 7, 155–164. [Google Scholar]
- Werner, M.; Cranston, M.; Harrison, T.; Whitfield, D.; Schellekens, J. Recent developments in operational flood forecasting in England, Wales and Scotland. Meteorol. Appl. 2009, 16, 13–22. [Google Scholar] [CrossRef]
- Krajewski, W.F.; Ceynar, D.; Demir, I.; Goska, R.; Kruger, A.; Langel, C.; Mantilla, R.; Niemeier, J.; Quintero, F.; Seo, B.-C. Real-time flood forecasting and information system for the state of Iowa. Bull. Am. Meteorol. Soc. 2017, 98, 539–554. [Google Scholar] [CrossRef]
- Chang, C.-H. Establishment and Application of Radar Data and Hydrologic Models in an Integrated Platform of Hydrometeorology Observation; Water Resources Agency: Taichung, Taiwan, 2013.
- Chang, C.-H. The Development of Value-Add Application for Rainfall Rader Data and Multiple Hydrology Models Based on Fews_Taiwan; Water Resources Agency: Taichung, Taiwan, 2014.
- Syme, W.; Pinnell, M.; Wicks, J. Modelling flood inundation of urban areas in the UK using 2D/1D hydraulic models. In Proceedings of the 8th National Conference on Hydraulics in Water Engineering, Surfers Paradise, Australia, 13–16 July 2004. [Google Scholar]
- Chang, C.-H. Integrated Platform for Application of High-Performance 2D Inundation Simulation; Water Resources Planning Institute: Taichung, Taiwan, 2016.
- Hunter, N.M.; Bates, P.D.; Horritt, M.S.; Wilson, M.D. Simple spatially-distributed models for predicting flood inundation: A review. Geomorphology 2007, 90, 208–225. [Google Scholar] [CrossRef]
- Blumberg, A.F.; Georgas, N.; Yin, L.; Herrington, T.O.; Orton, P.M. Street-scale modeling of storm surge inundation along the New Jersey Hudson river waterfront. J. Atmos. Ocean. Technol. 2015, 32, 1486–1497. [Google Scholar] [CrossRef]
- Yin, J.; Yu, D.; Wilby, R. Modelling the impact of land subsidence on urban pluvial flooding: A case study of downtown Shanghai, China. Sci. Total Environ. 2016, 544, 744–753. [Google Scholar] [CrossRef] [PubMed]
- Liu, L.; Liu, Y.; Wang, X.; Yu, D.; Liu, K.; Huang, H.; Hu, G. Developing an Effective 2-D Urban Flood Inundation Model for City Emergency Management Based on Cellular Automata; Loughborough University: Loughborough, UK, 2015. [Google Scholar]
- Chang, T.-J.; Wang, C.-H.; Chen, A.S. A novel approach to model dynamic flow interactions between storm sewer system and overland surface for different land covers in urban areas. J. Hydrol. 2015, 524, 662–679. [Google Scholar] [CrossRef]
- Werner, M.; van Dijk, M.; Schellekens, J. Delft-fews: An open shell flood forecasting system. In Hydroinformatics; In 2 Volumes, with CD-ROM; World Scientific: Singapore, 2004; pp. 1205–1212. [Google Scholar]
- Werner, M.; Heynert, K. Open model integration—A review of practical examples in operational flood forecasting. In Proceedings of the Seventh International Conference on Hydroinformatics, Nice, France, 4–8 September 2006; pp. 155–162. [Google Scholar]
- Werner, M.; Schellekens, J.; Gijsbers, P.; van Dijk, M.; van den Akker, O.; Heynert, K. The Delft-FEWS flow forecasting system. Environ. Model. Softw. 2013, 40, 65–77. [Google Scholar] [CrossRef]
- Deltares. SOBEK User Manual; Deltares: Delft, The Netherlands, 2017. [Google Scholar]
- Doong, D.-J.; Lo, W.; Vojinovic, Z.; Lee, W.-L.; Lee, S.-P. Development of a new generation of flood inundation maps—A case study of the coastal city of Tainan, Taiwan. Water 2016, 8, 521. [Google Scholar] [CrossRef]
- Chiou, P.T.-K.; Chen, C.-R.; Chang, P.-L.; Jian, G.-J. Status and outlook of very short range forecasting system in Central Weather Bureau, Taiwan. In Applications with Weather Satellites II; International Society for Optics and Photonics: Bellingham, WA, USA, 2005; pp. 185–197. [Google Scholar]
- Wang, Y.; Zhang, J.; Chang, P.-L.; Langston, C.; Kaney, B.; Tang, L. Operational C-band dual-polarization radar QPE for the subtropical complex terrain of Taiwan. Adv. Meteorol. 2016, 2016. [Google Scholar] [CrossRef][Green Version]
- Nash, J.E.; Sutcliffe, J.V. River flow forecasting through conceptual models part I—A discussion of principles. J. Hydrol. 1970, 10, 282–290. [Google Scholar] [CrossRef]
- Aronoff, S. Classification accuracy: A user approach. Photogramm. Eng. Remote Sens. 1982, 48, 1299–1307. [Google Scholar]
- Congalton, R.G. A review of assessing the accuracy of classifications of remotely sensed data. Remote Sens. Environ. 1991, 37, 35–46. [Google Scholar] [CrossRef]
- Purnami, S.W.; Zain, J.M.; Embong, A. A new expert system for diabetes disease diagnosis using modified spline smooth support vector machine. In Proceedings of the International Conference on Computational Science and Its Applications, Fukuoka, Japan, 23–26 March 2010; Springer: Berlin/Heidelberg, Germany, 2010; pp. 83–92. [Google Scholar]
- Wu, S.-J.; Lien, H.-C.; Chang, C.-H.; Shen, J.-C. Real-time correction of water stage forecast during rainstorm events using combination of forecast errors. Stoch. Environ. Res. Risk Assess. 2012, 26, 519–531. [Google Scholar] [CrossRef]
- Shen, D.; Wang, J.; Cheng, X.; Rui, Y.; Ye, S. Integration of 2-D hydraulic model and high-resolution lidar-derived DEM for floodplain flow modeling. Hydrol. Earth Syst. Sci. 2015, 19, 3605–3616. [Google Scholar] [CrossRef]
© 2018 by the authors. Licensee MDPI, Basel, Switzerland. This article is an open access article distributed under the terms and conditions of the Creative Commons Attribution (CC BY) license (http://creativecommons.org/licenses/by/4.0/).