Influence of Gravel-Bed Porosity and Grain Orientation on Bulk Flow Resistance


Abstract
1. Introduction
2. Background
3. Experimental Setup and Procedure
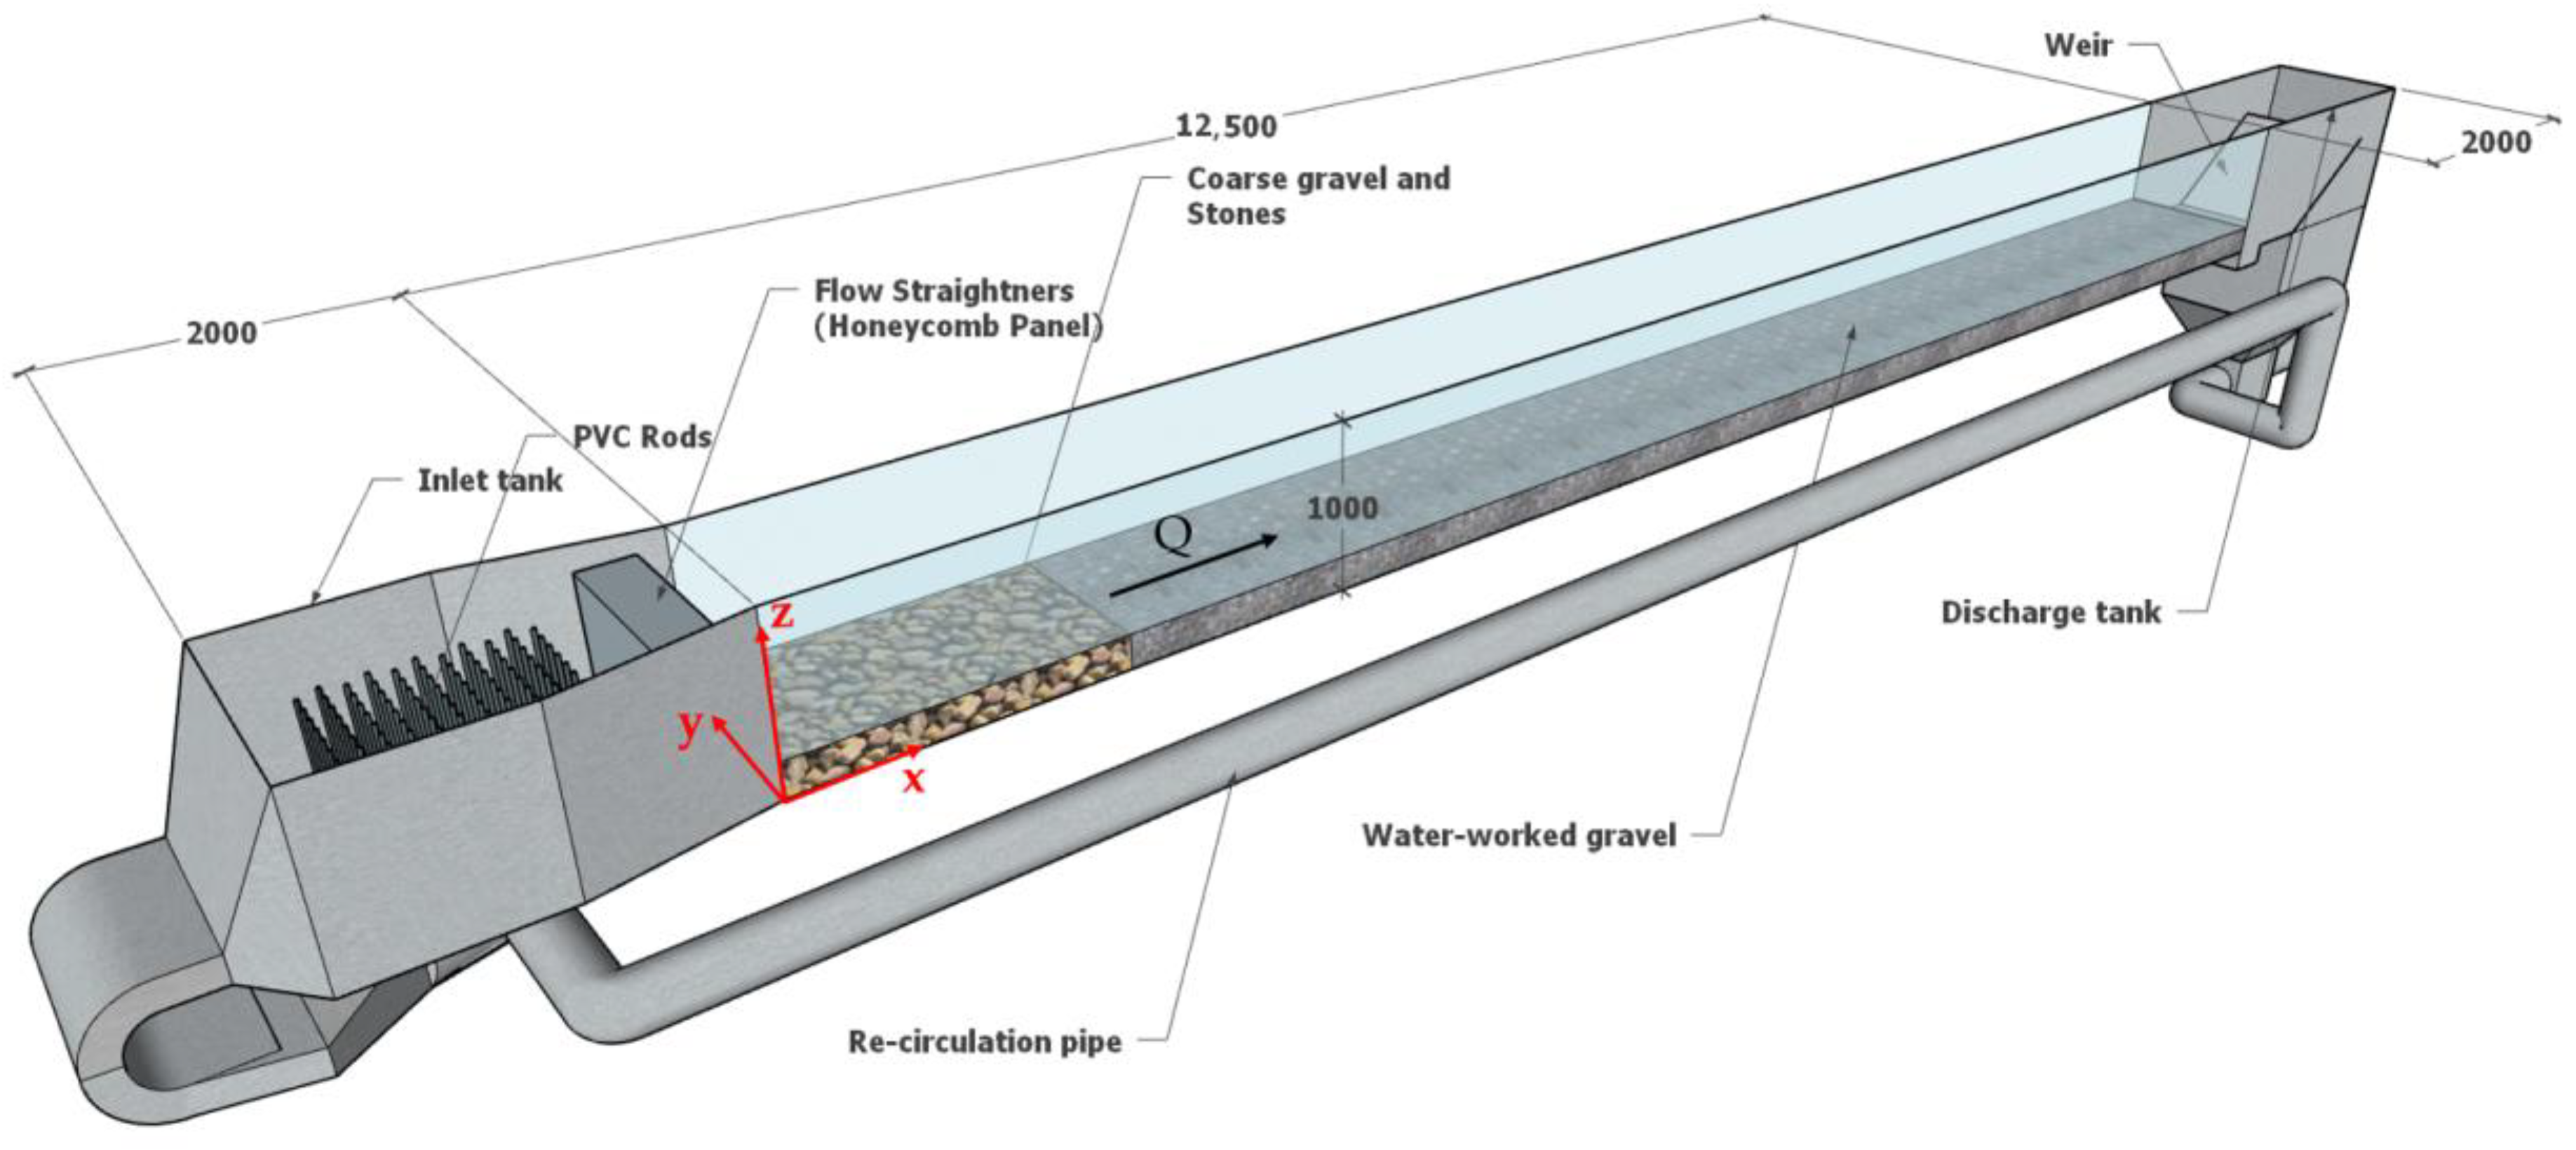
3.1. Experimental Facility
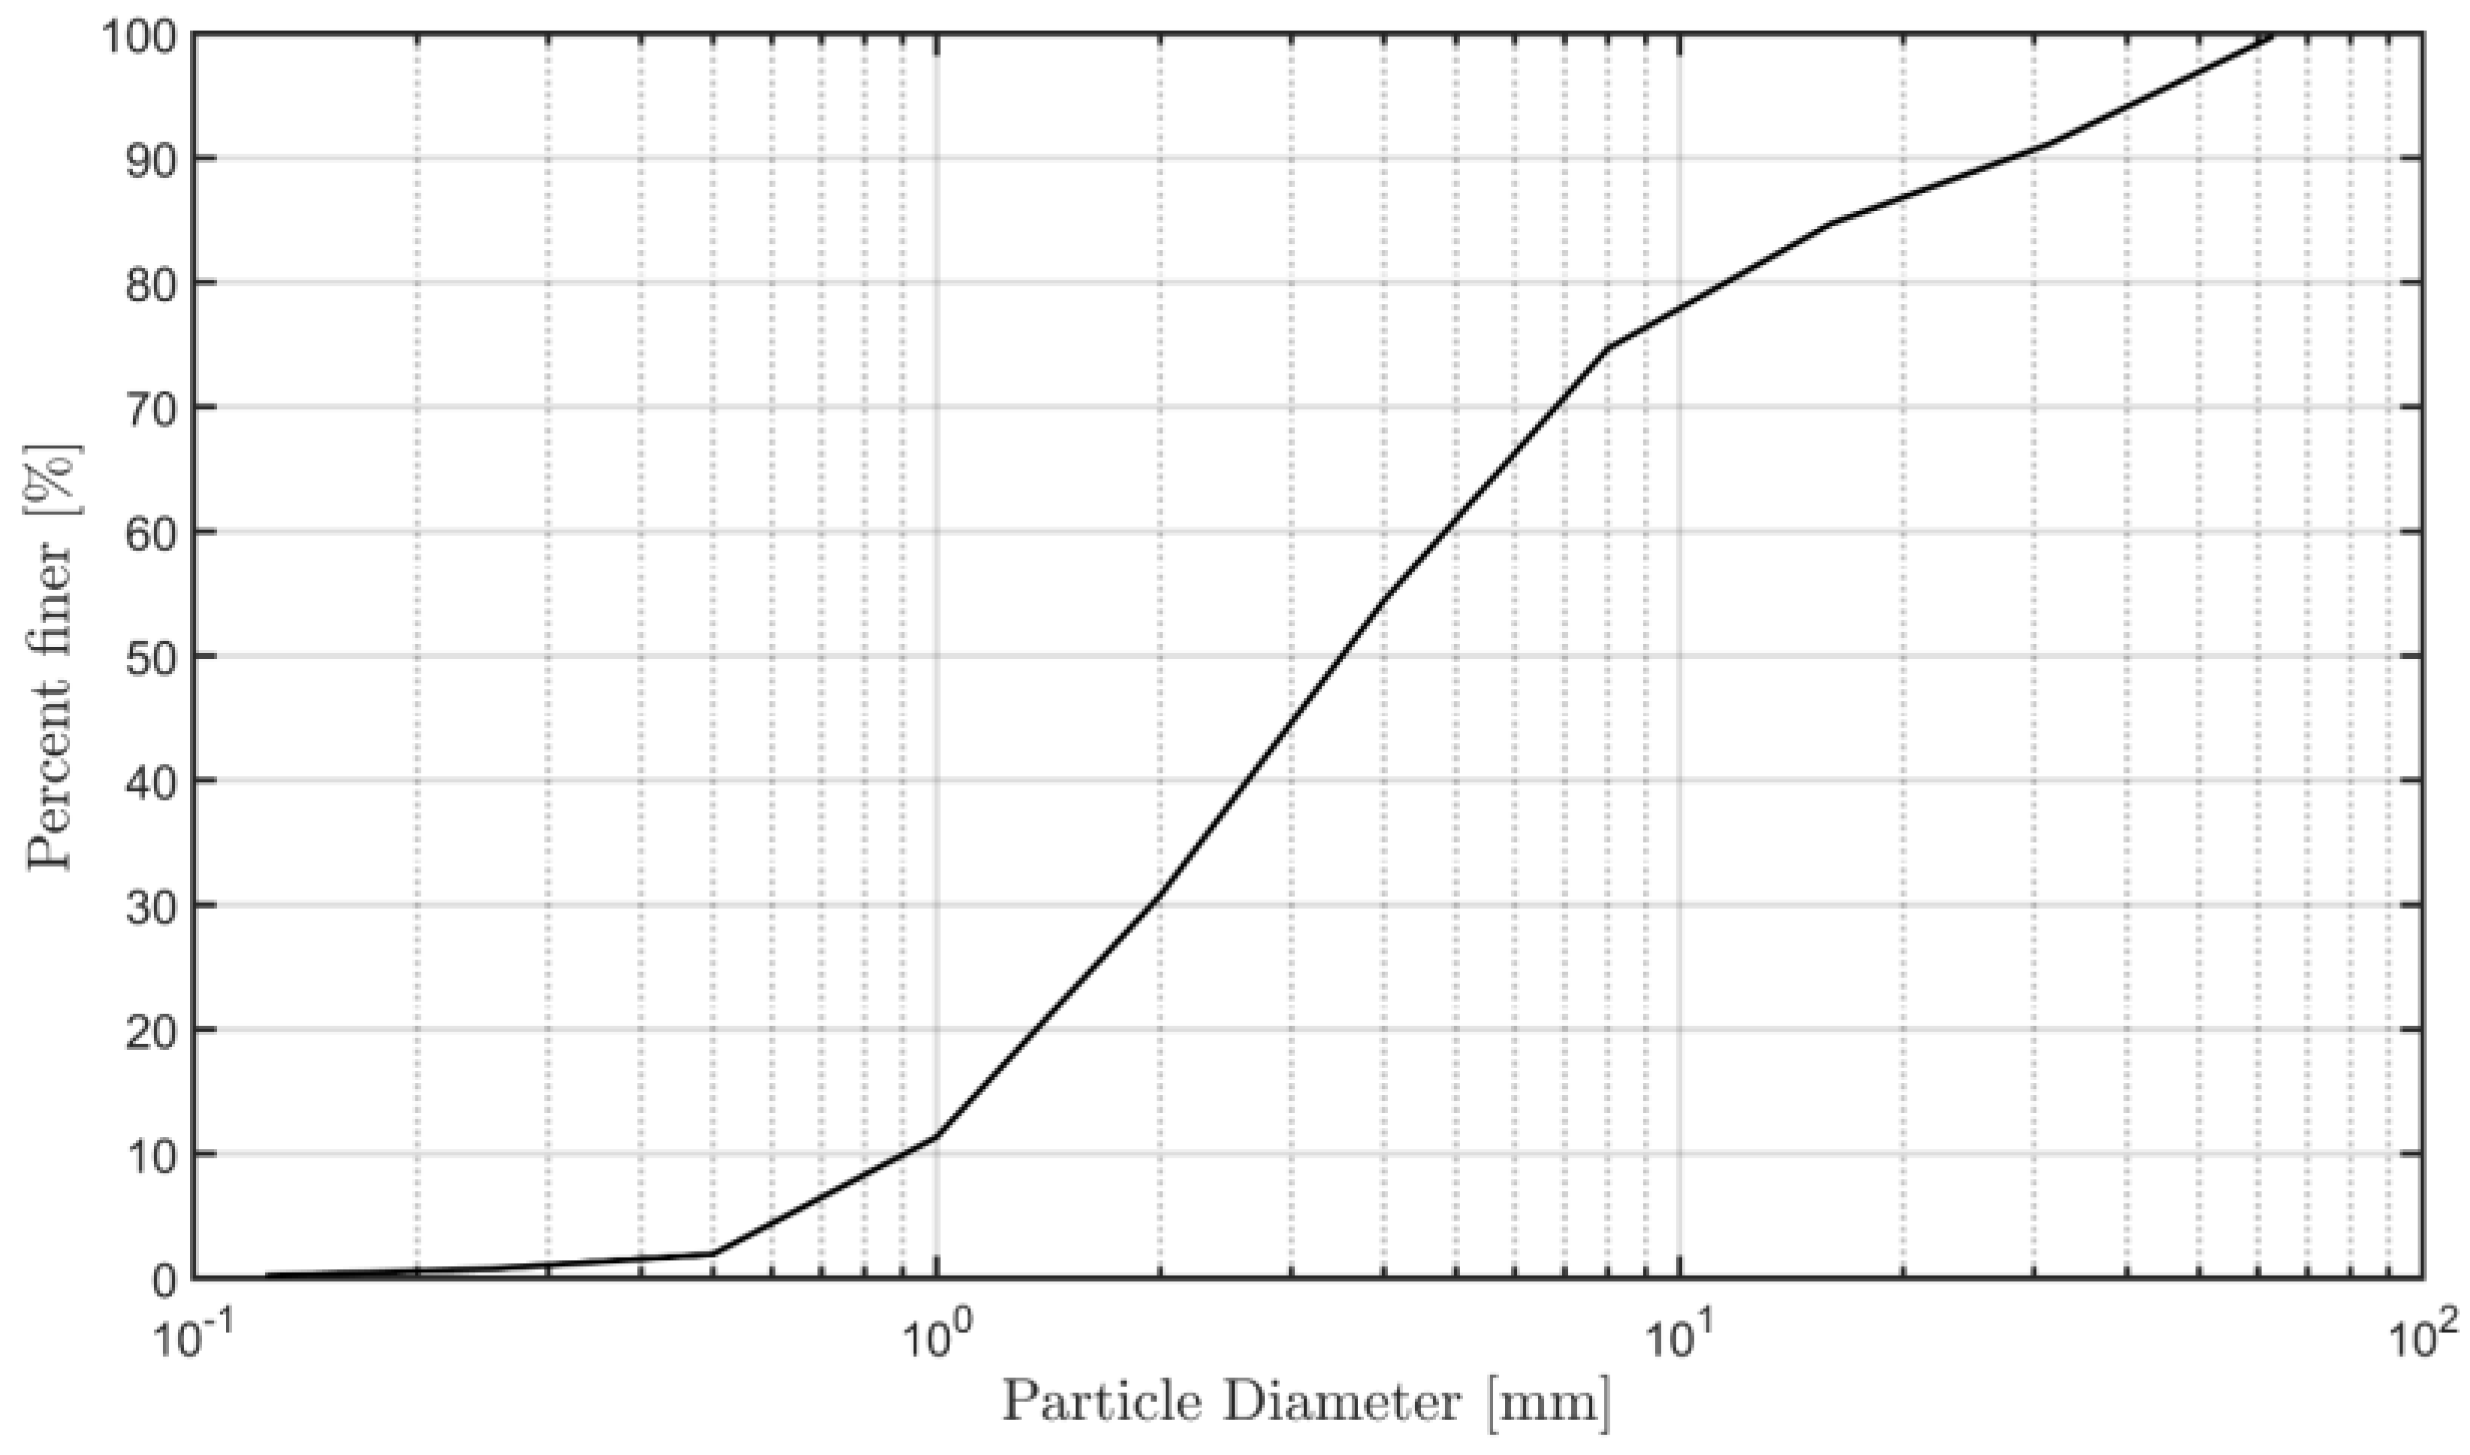
3.2. Bed Types
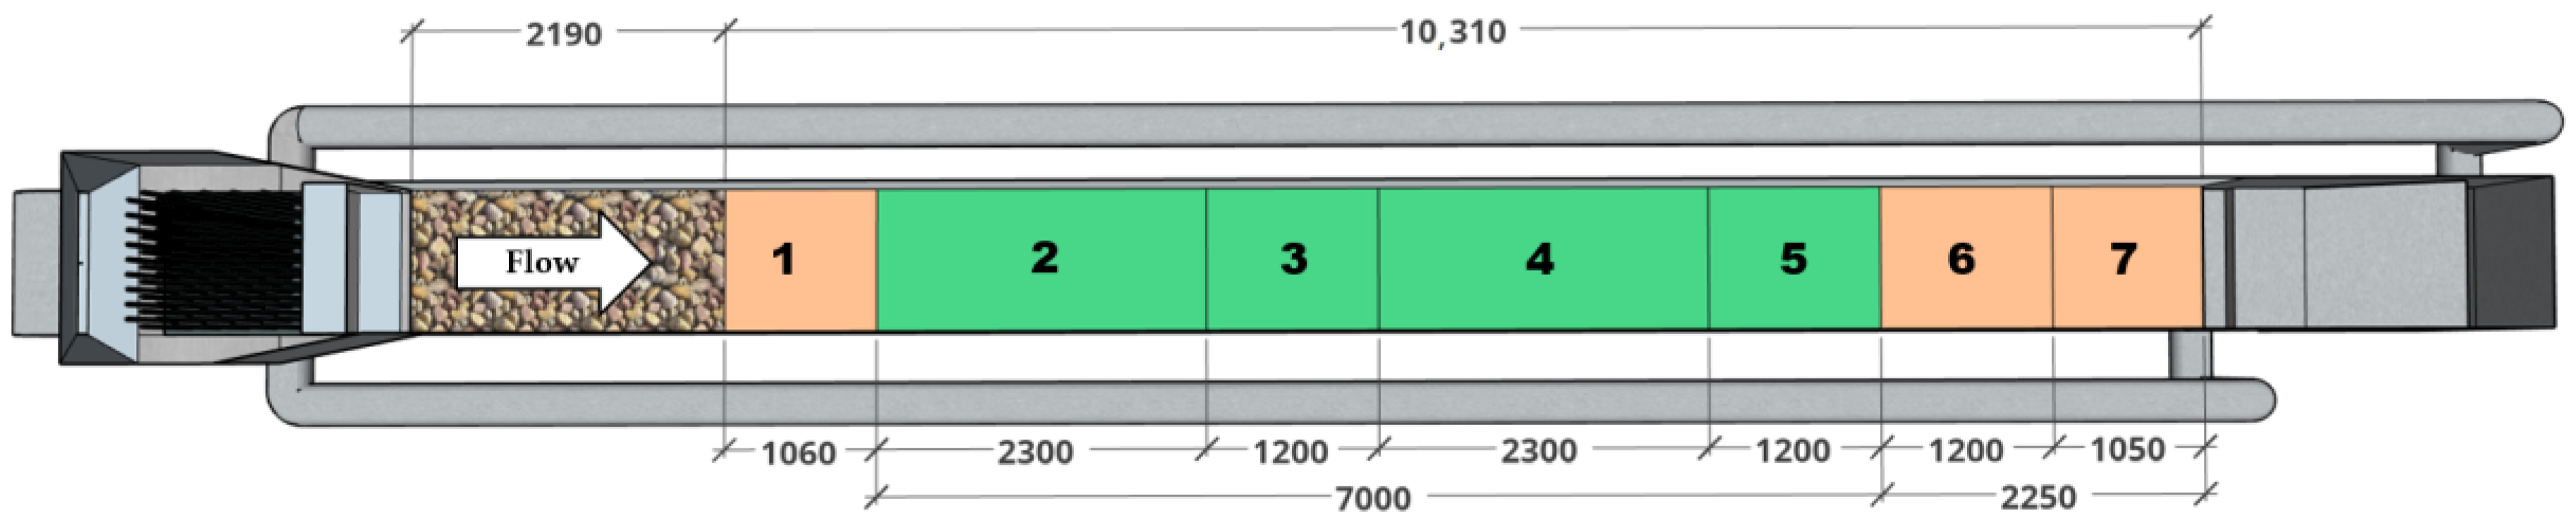
3.3. Hydraulic Measurements
4. Results and Discussions
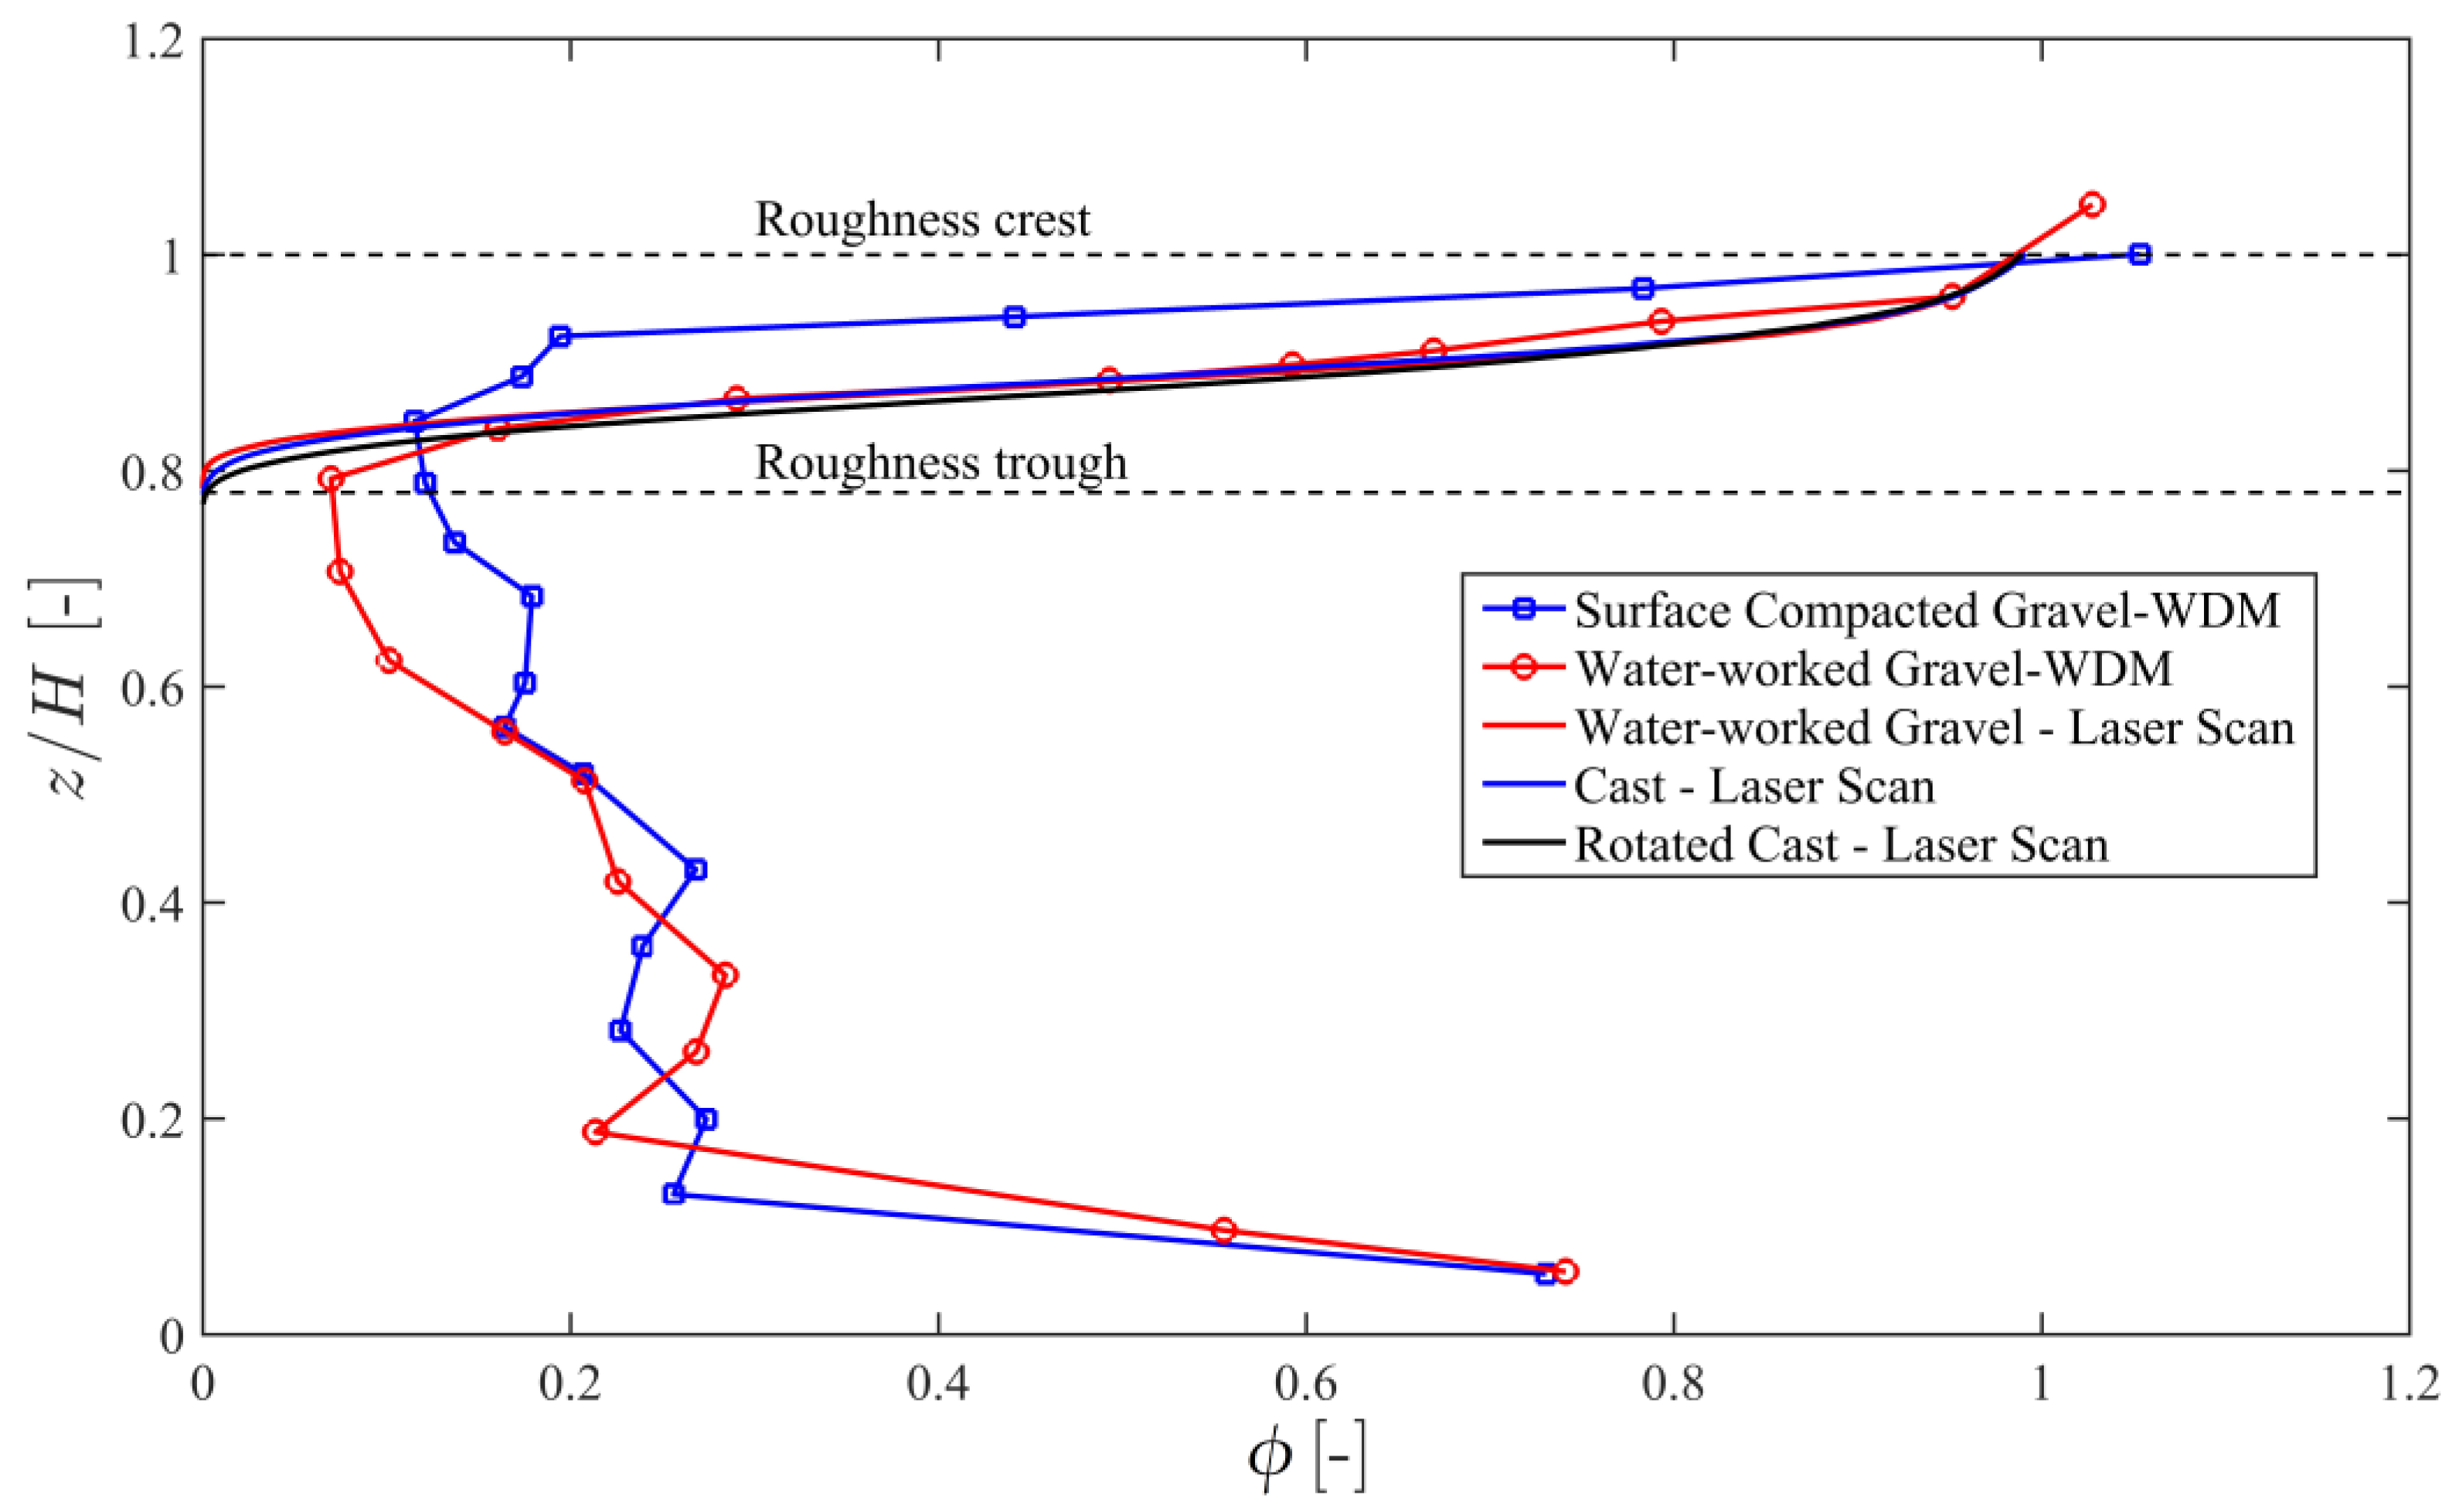
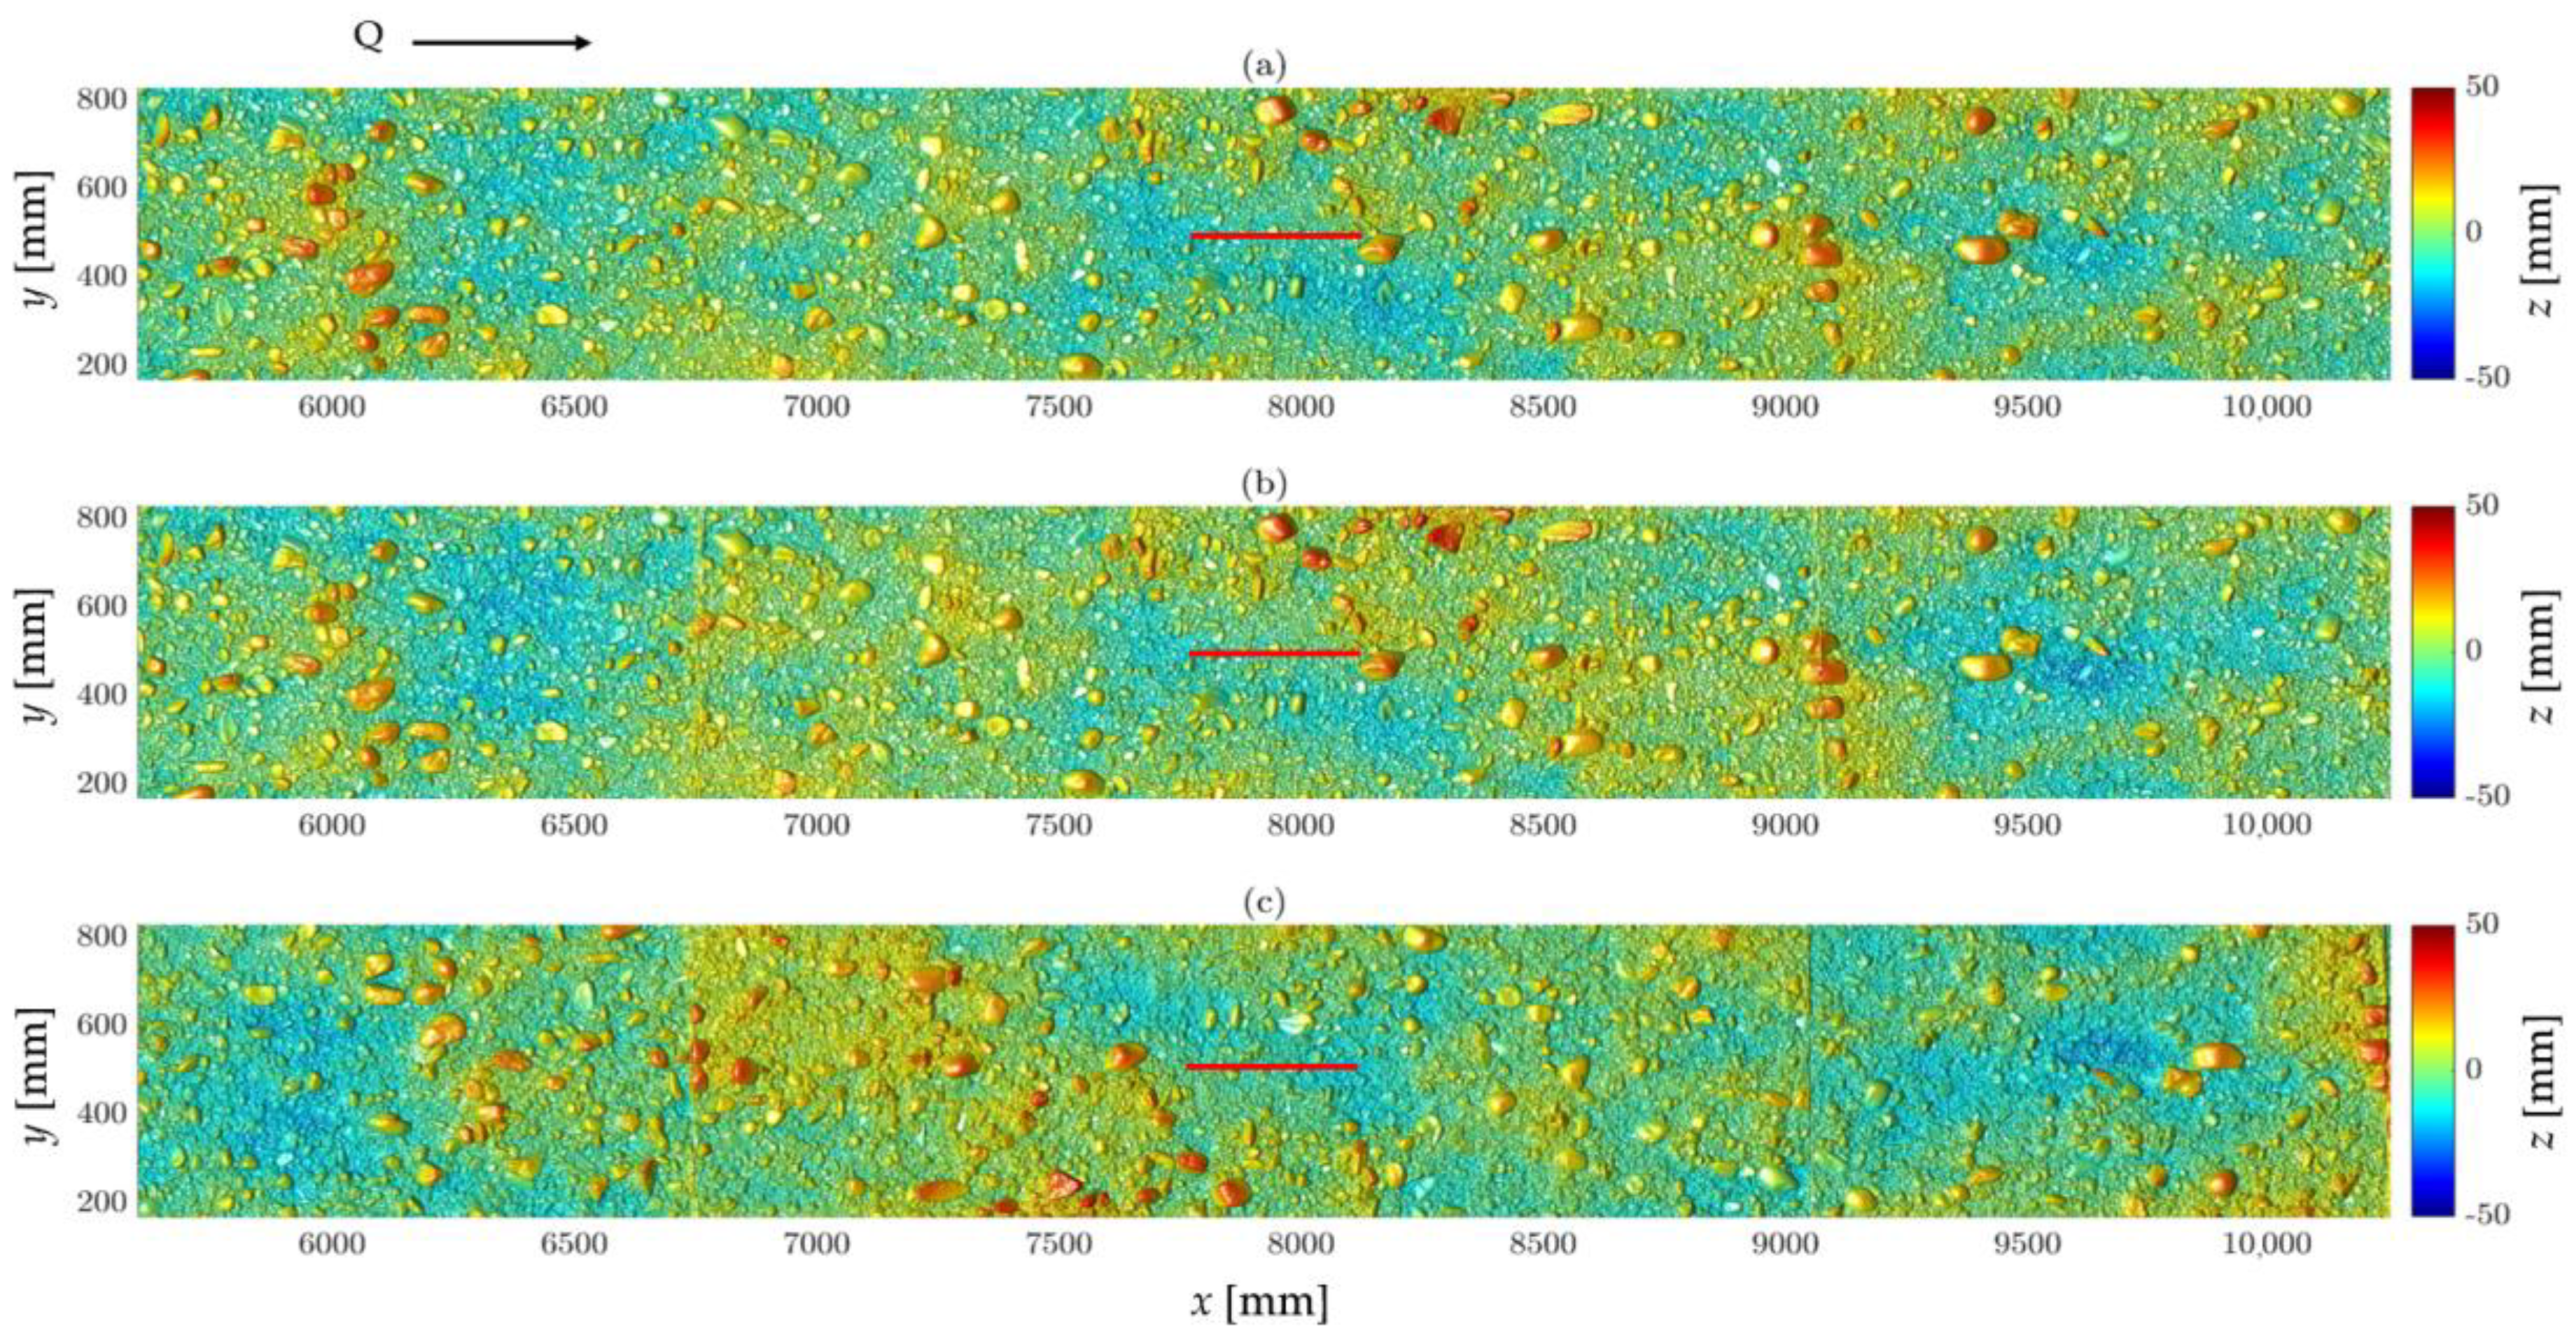
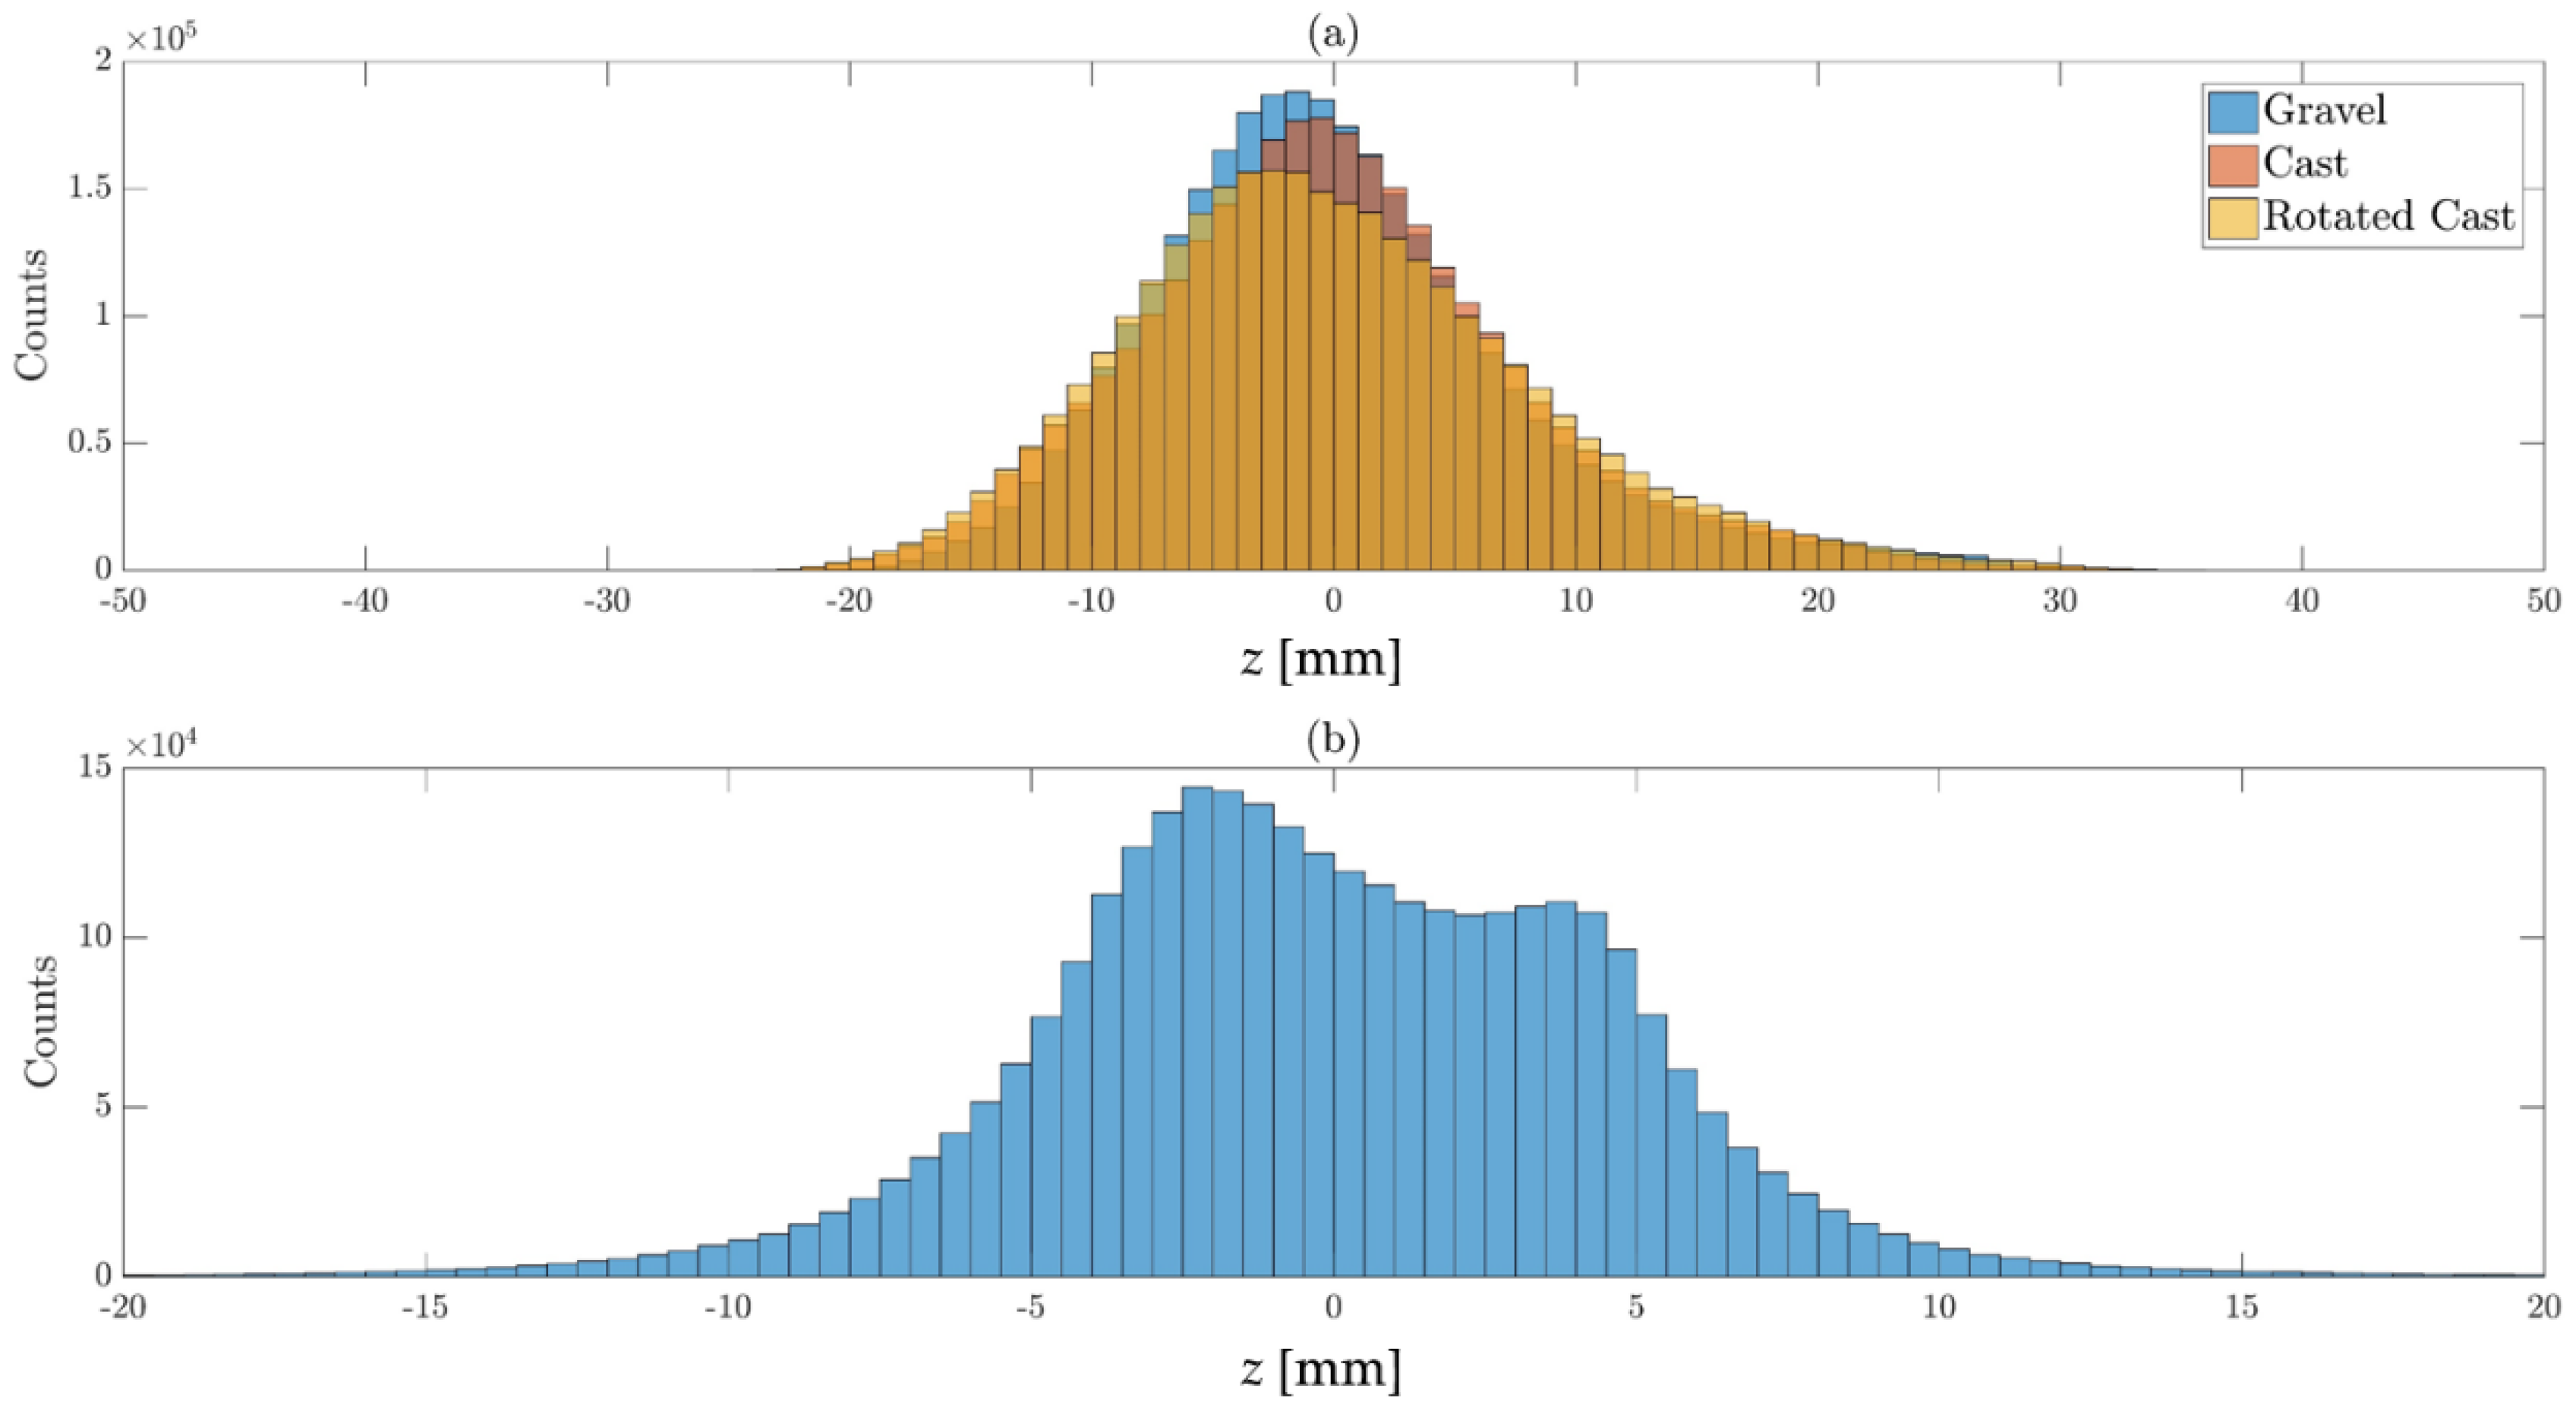
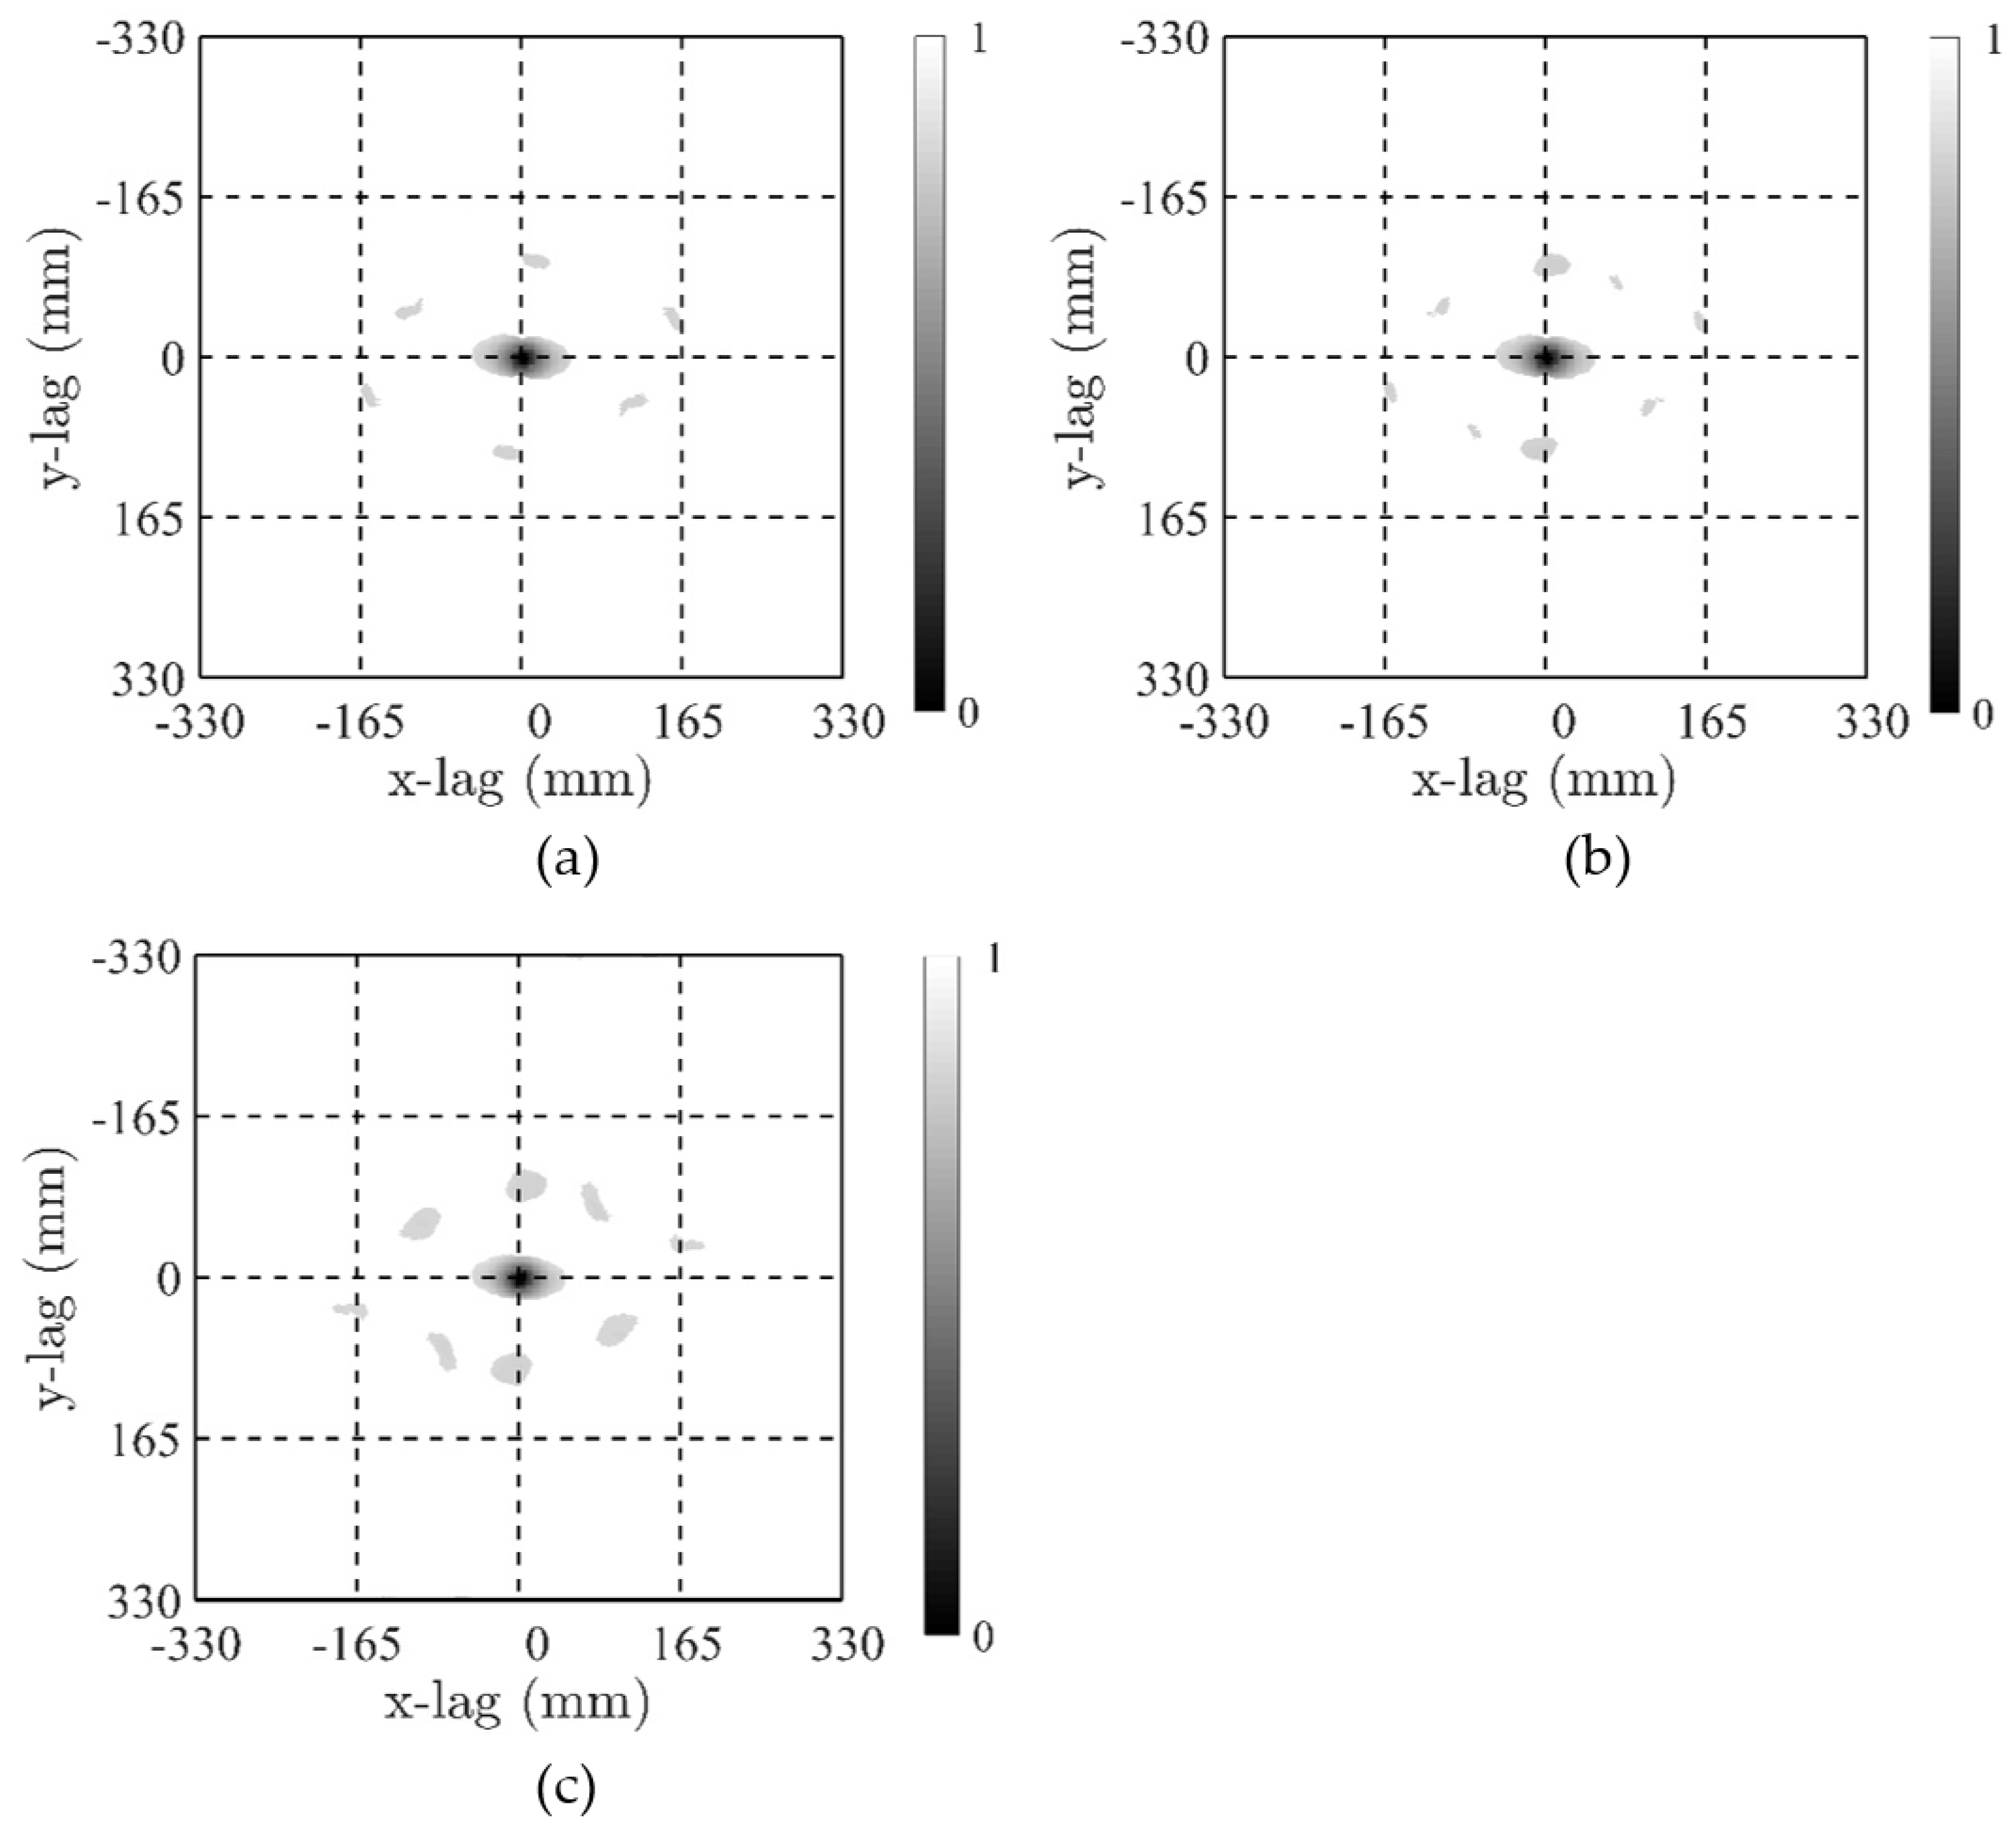
4.1. Comparability of the Surfaces
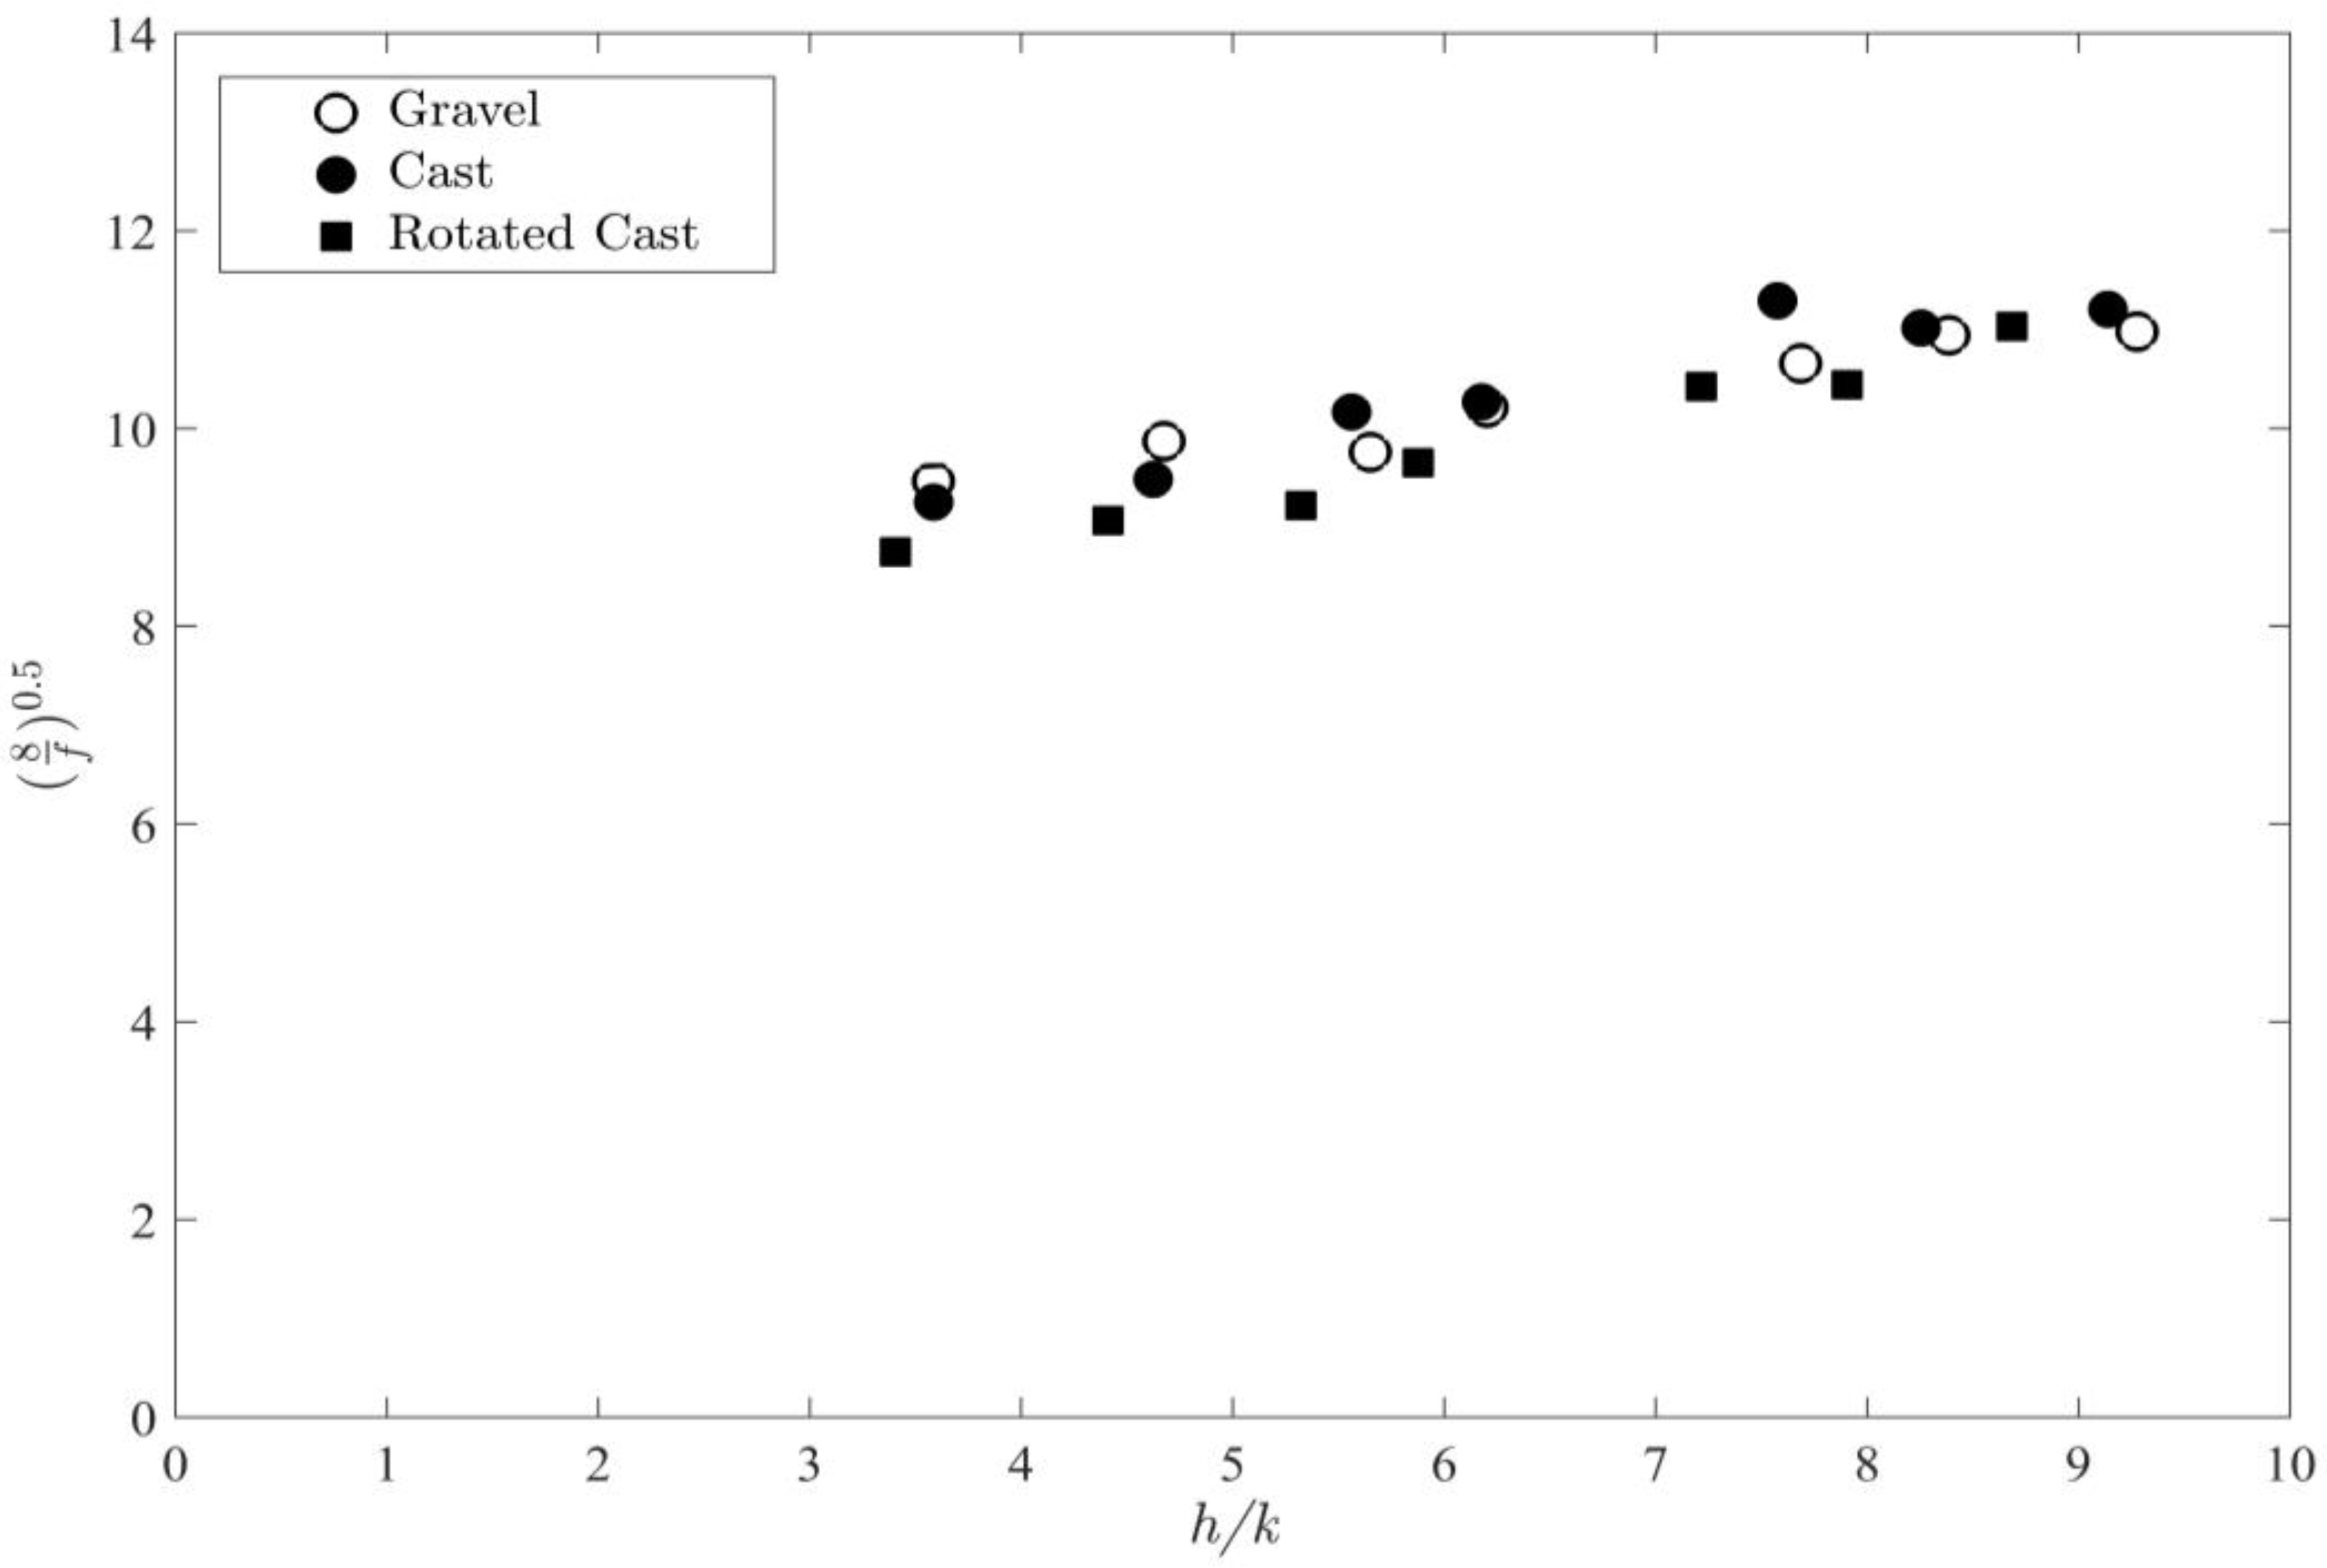
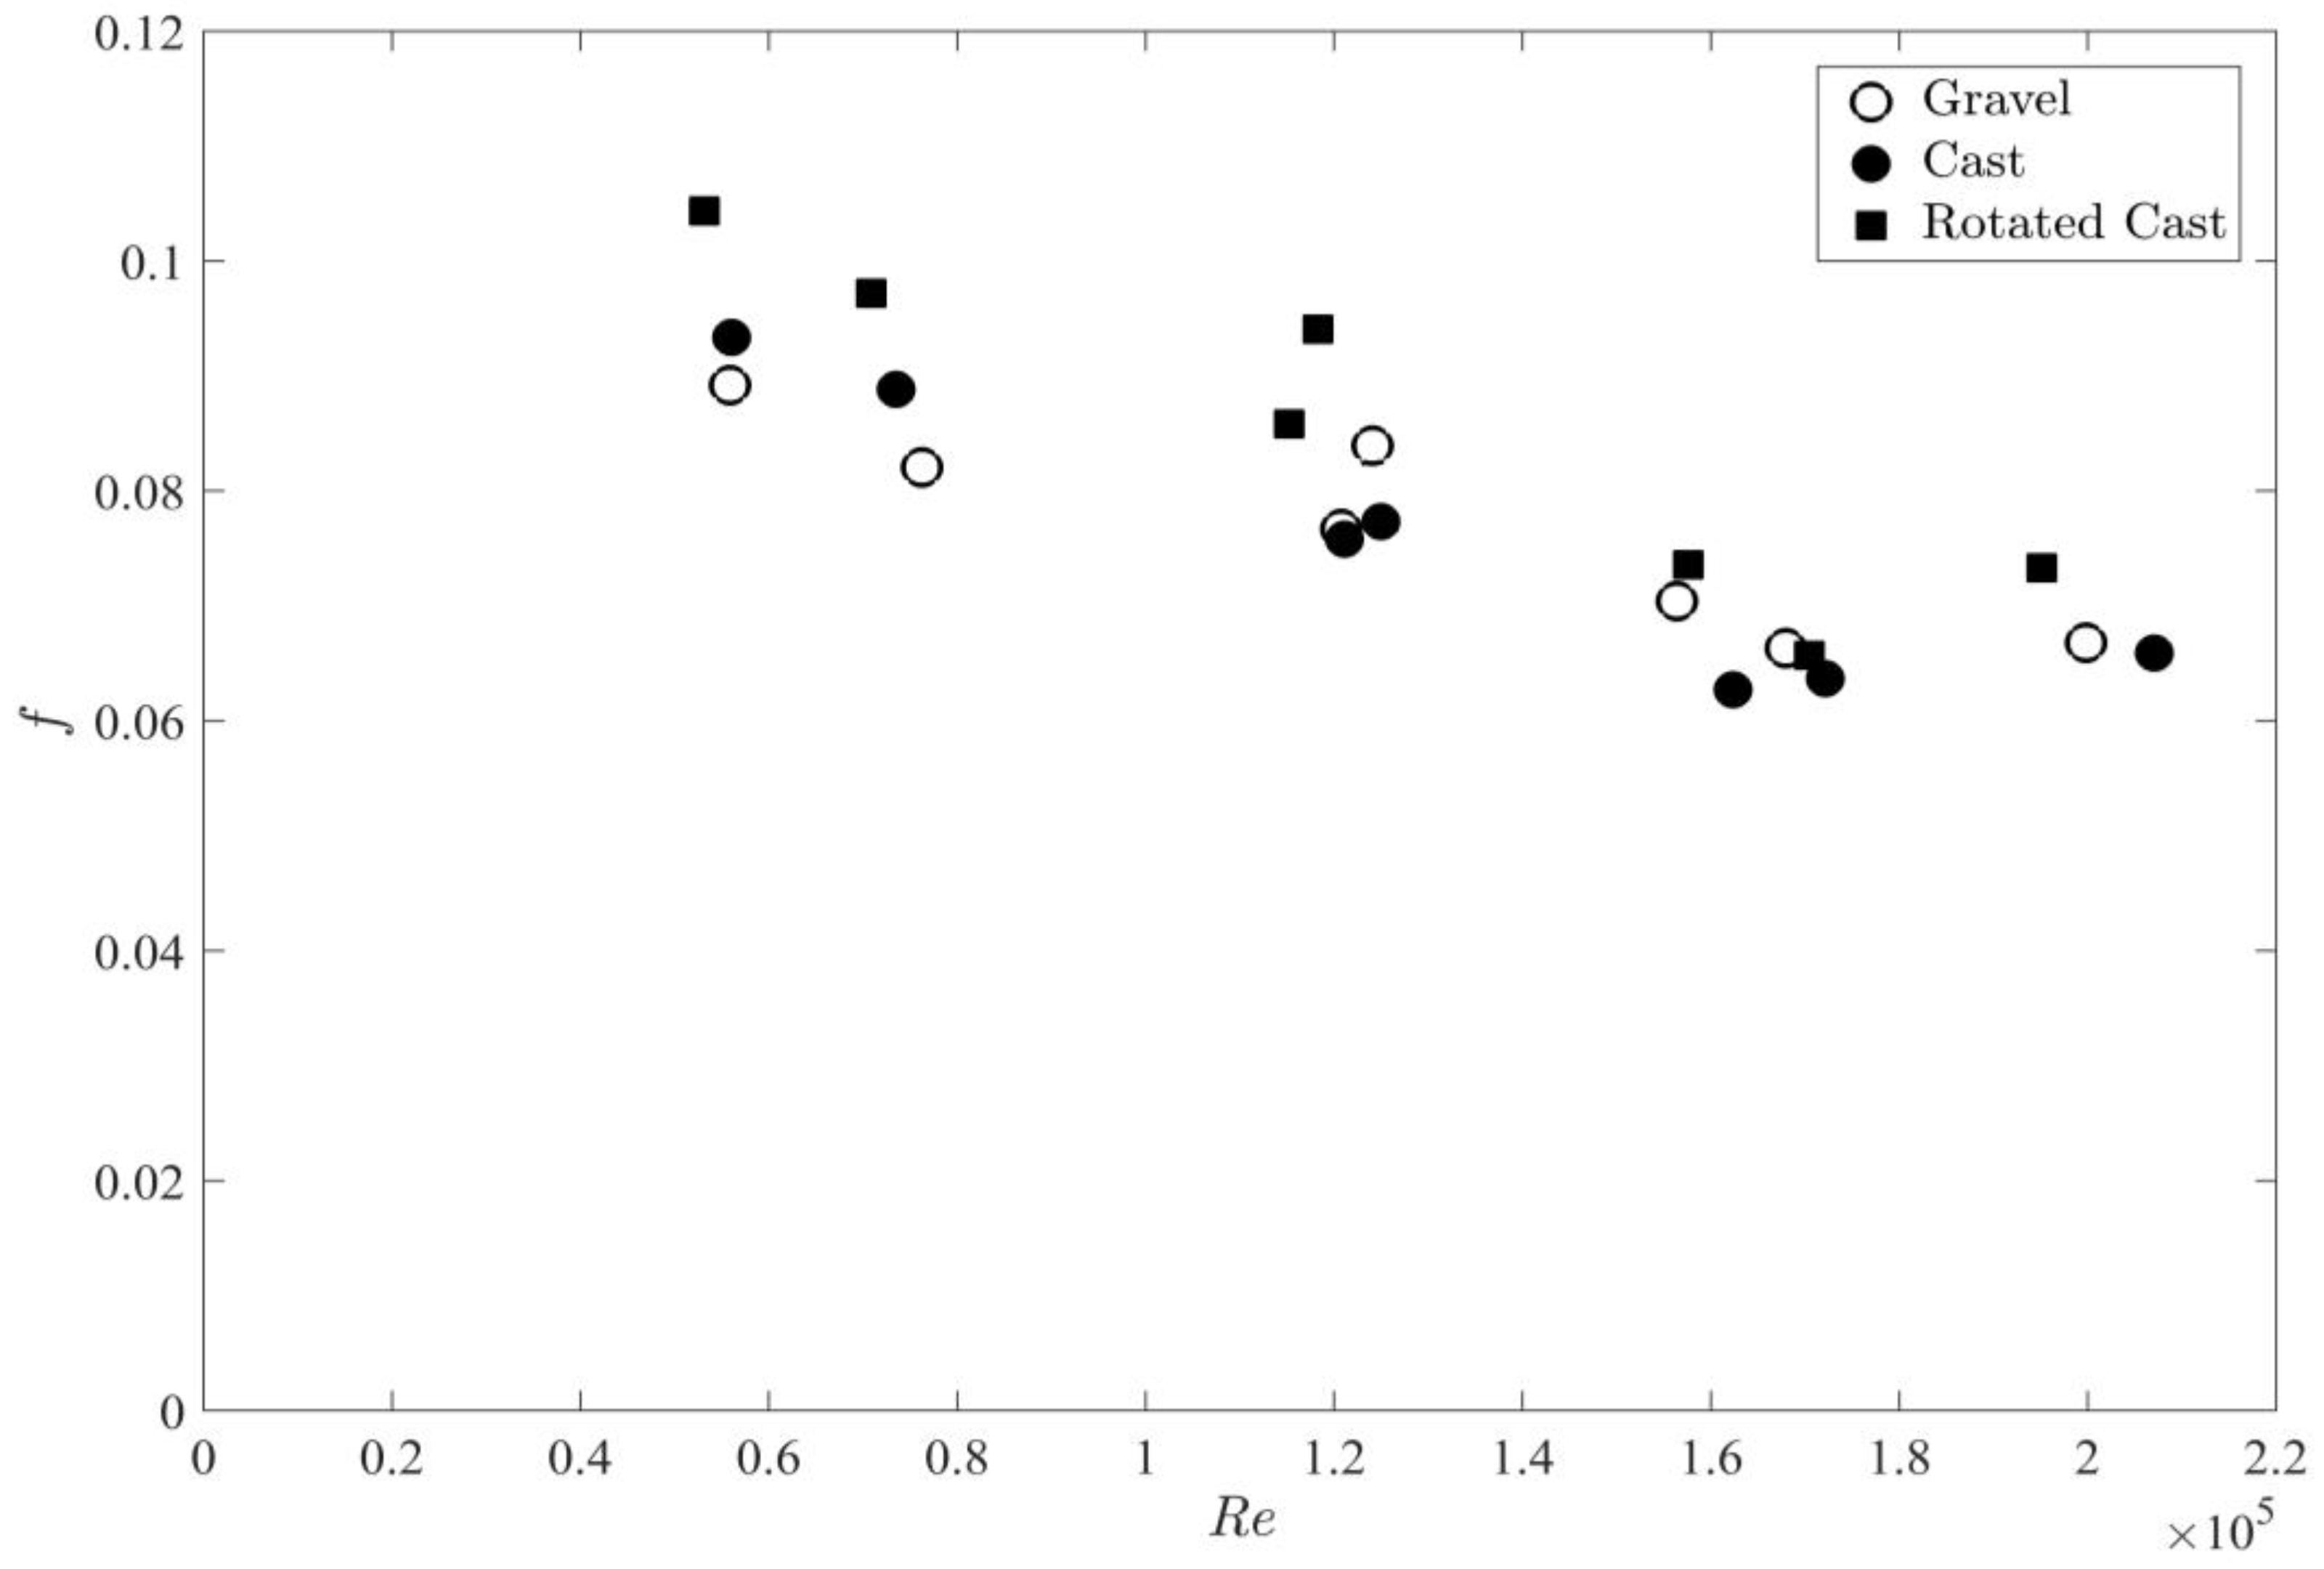
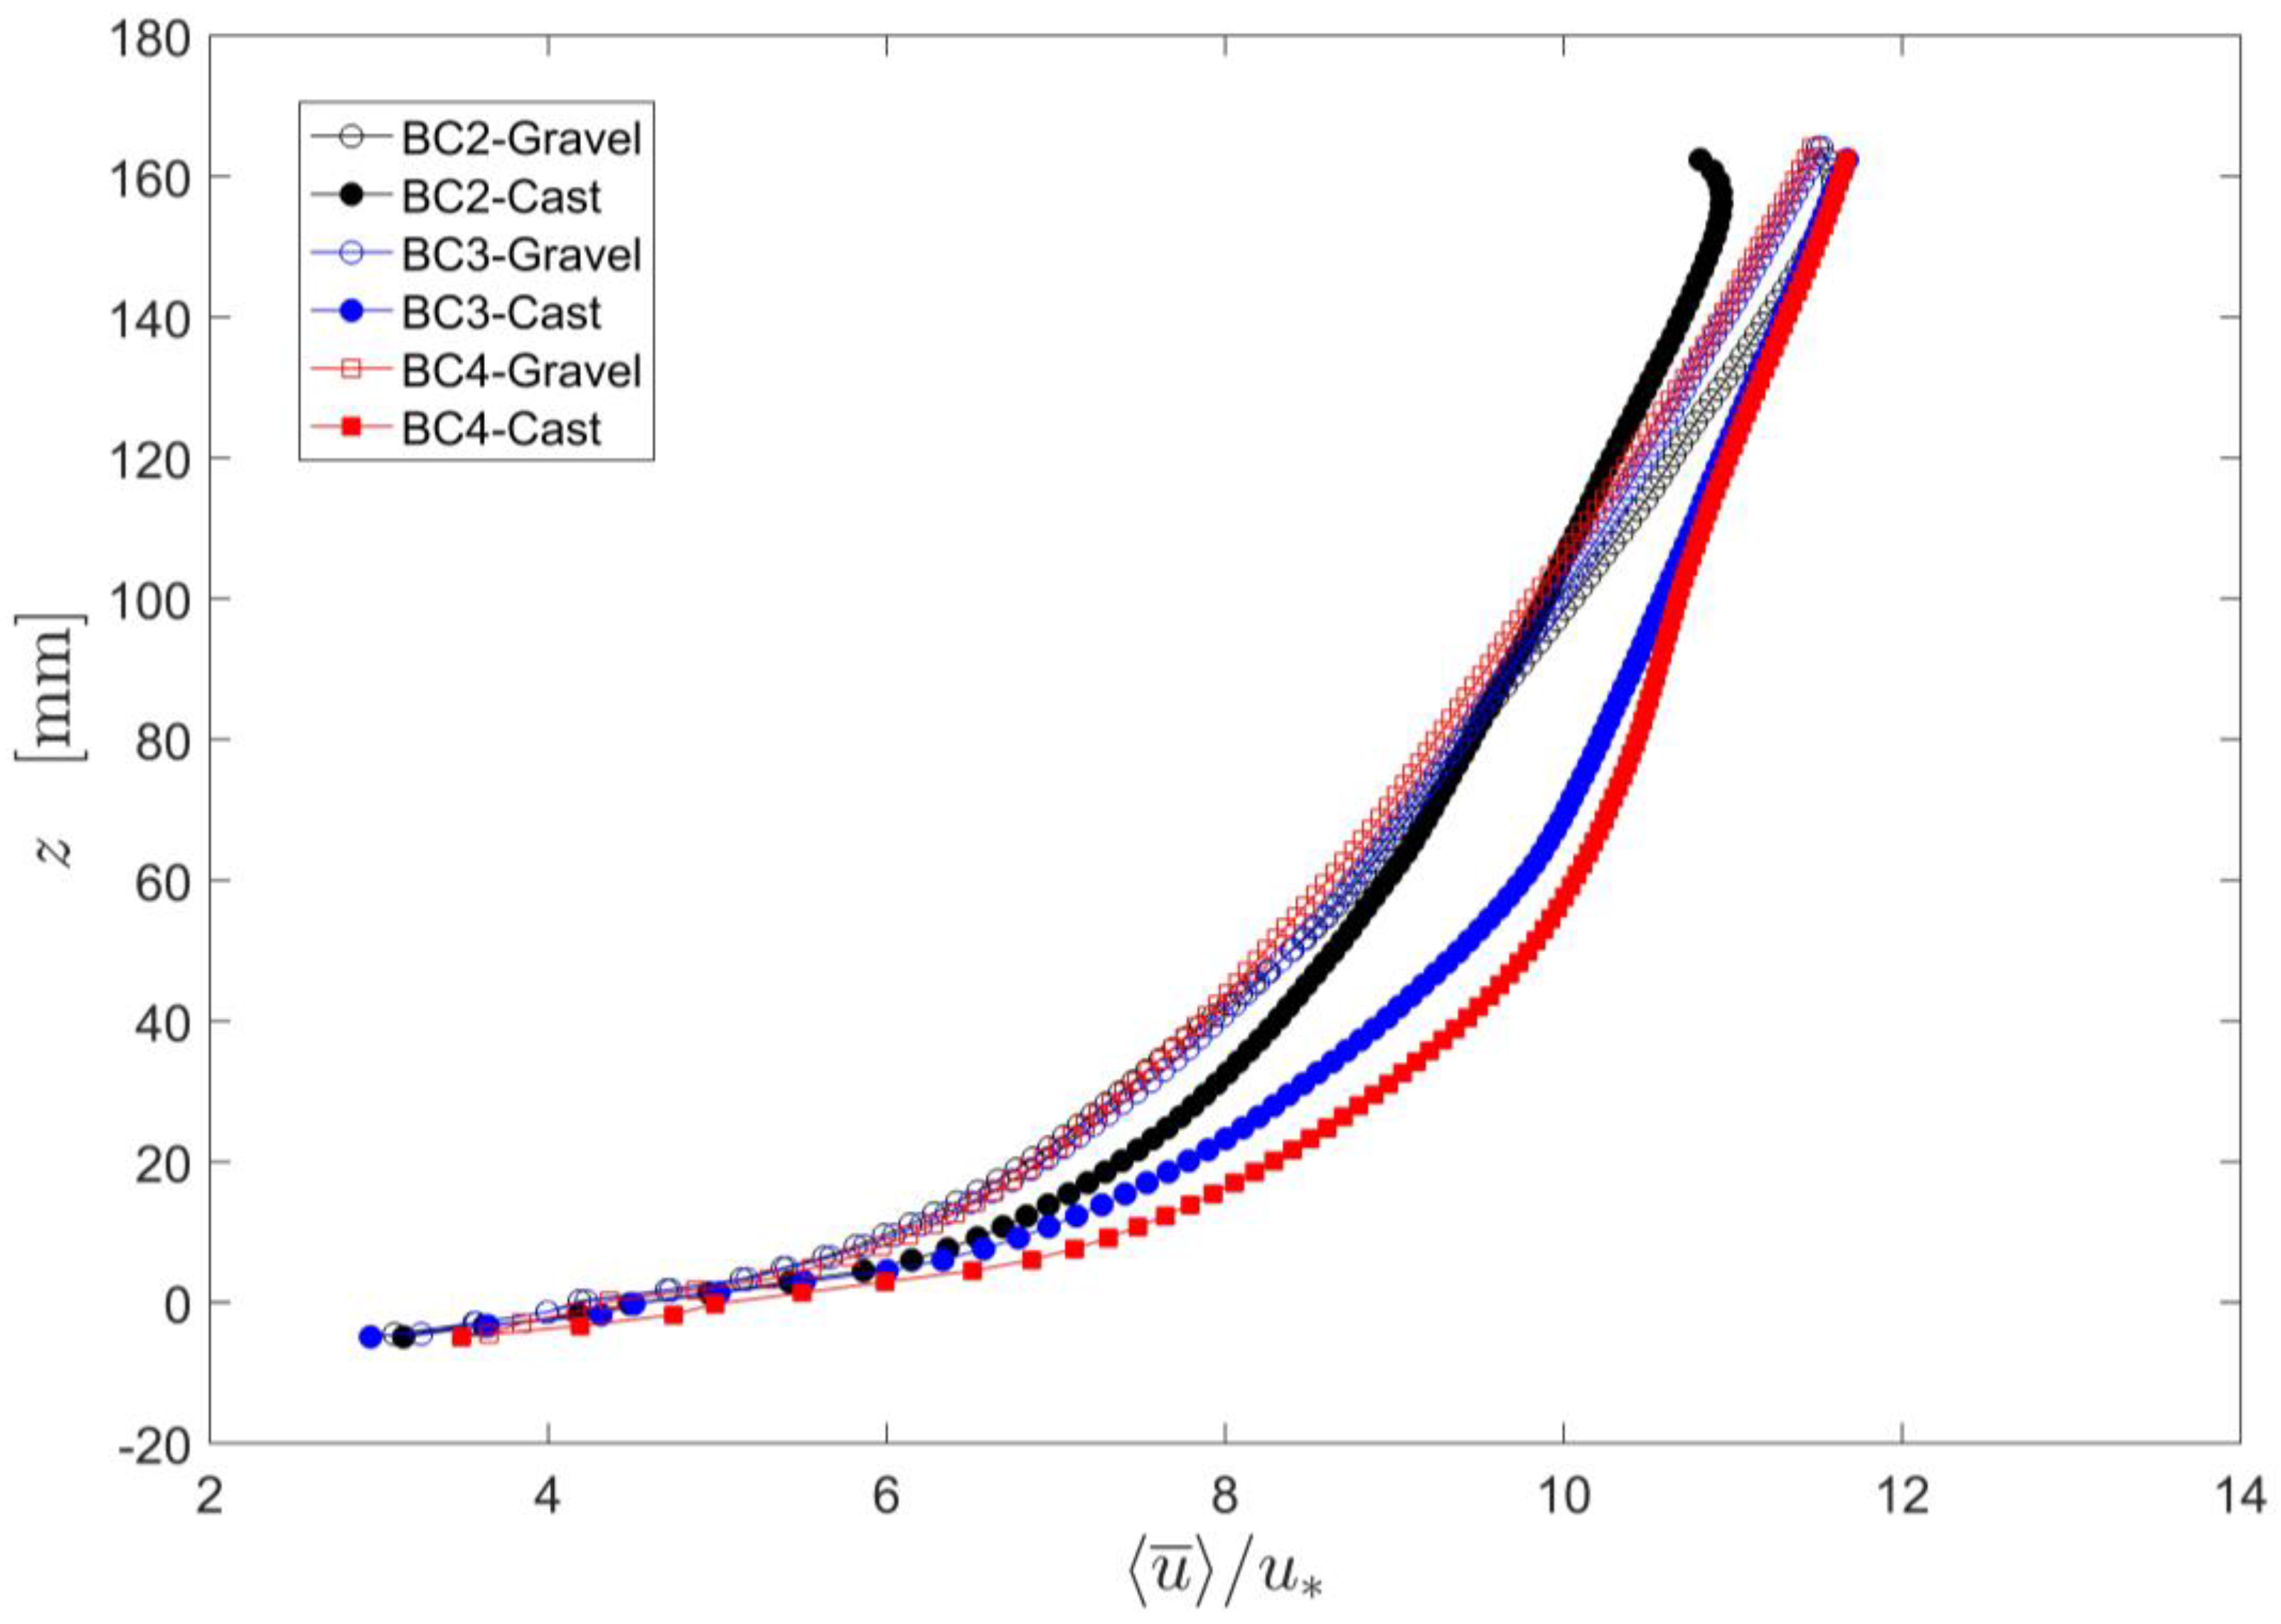
4.2. Flow Resistance
5. Summary and Conclusions
Author Contributions
Funding
Acknowledgments
Conflicts of Interest
References
- Nikora, V.; Koll, K.; McEwan, I.; McLean, S.; Dittrich, A. Velocity Distribution in the Roughness Layer of Rough-Bed Flows. J. Hydraul. Eng. 2004, 130, 1036–1042. [Google Scholar] [CrossRef]
- Aberle, J.; Koll, K.; Dittrich, A. Form induced stresses over rough gravel-beds. Acta Geophys. 2008, 56, 584–600. [Google Scholar] [CrossRef]
- Coleman, S.E.; Nikora, V.I.; Aberle, J. Interpretation of alluvial beds through bed-elevation distribution moments. Water Resour. Res. 2011, 47, W11505. [Google Scholar] [CrossRef]
- Vollmer, S. Einfluß der Oberflächenströmung auf die Permeable Gewässersohle; Universität Karlsruhe (TH): Karlsruhe, Germany, 2005. [Google Scholar]
- Detert, M. Hydrodynamic Processes at the Water-Sediment Interface of Sreambeds. Doctoral Thesis, Universität Karlsruhe (TH), Karlsruhe, Germany, 2008. [Google Scholar]
- Chow, V.T. Open-Channel Hydraulics; McGraw-Hill, Inc.: Singapore, 1959. [Google Scholar]
- Keulegan, G.H. Laws of Turbulent Flow in Open Channels. J. Res. Natl. Bureau Standards 1938, 21, 707–741. [Google Scholar] [CrossRef]
- Hey, R.D. Flow Resistance in Gravel-Bed Rivers. J. Hydraul. Div. 1979, 105, 365–379. [Google Scholar]
- Bathurst, J.C. Flow Resistance Estimation in Mountain Rivers. J. Hydraul. Eng. 1985, 111, 625–643. [Google Scholar] [CrossRef]
- Ferguson, R. Flow resistance equations for gravel- and boulder-bed streams. Water Resour. Res. 2007, 43, W05427. [Google Scholar] [CrossRef]
- Hendrick, R.R.; Ely, L.L.; Papanicolaou, A.N. The role of hydrologic processes and geomorphology on the morphology and evolution of sediment clusters in gravel-bed rivers. Geomorphology 2010, 114, 483–496. [Google Scholar] [CrossRef]
- Nikora, V.I.; Goring, D.G.; Biggs, B.J.F. On gravel-bed roughness characterization. Water Resour. Res. 1998, 34, 517–527. [Google Scholar] [CrossRef]
- Smart, G.M.; Duncan, M.J.; Walsh, J.M. Relatively Rough Flow Resistance Equations. J. Hydraul. Eng. 2002, 128, 568–578. [Google Scholar] [CrossRef]
- Aberle, J.; Smart, G.M. The influence of roughness structure on flow resistance on steep slopes. J. Hydraul. Res. 2003, 41, 259–269. [Google Scholar] [CrossRef]
- Yochum, S.E.; Bledsoe, B.P.; David, G.C.L.; Wohl, E. Velocity prediction in high-gradient channels. J. Hydrol. 2012, 424–425, 84–98. [Google Scholar] [CrossRef]
- Aberle, J.; Nikora, V. Statistical properties of armored gravel bed surfaces. Water Resour. Res. 2006, 42, W11414. [Google Scholar] [CrossRef]
- Qin, J.; Aberle, J.; Henry, P.-Y.; Wu, T.; Zhong, D. Statistical significance of spatial correlation patterns in armoured gravel beds. J. Hyraul. Res. 2018, in press. [Google Scholar]
- Powell, D.M. Flow resistance in gravel-bed rivers: Progress in research. Earth-Sci. Rev. 2014, 136, 301–338. [Google Scholar] [CrossRef]
- Flack, K.A.; Schultz, M.P. Review of Hydraulic Roughness Scales in the Fully Rough Regime. J. Fluids Eng. 2010, 132, 041203. [Google Scholar] [CrossRef]
- Tonina, D.; Buffington, J.M. Hyporheic exchange in gravel bed rivers with pool-riffle morphology: Laboratory experiments and three-dimensional modeling. Water Resour. Res. 2007, 43, W01421. [Google Scholar] [CrossRef]
- Boano, F.; Harvey, J.W.; Marion, A.; Packman, A.I.; Revelli, R.; Ridolfi, L.; Wörman, A. Hyporheic flow and transport processes: Mechanisms, models, and biogeochemical implications. Rev. Geophys. 2014, 52, 603–679. [Google Scholar] [CrossRef]
- Marion, A.; Nikora, V.; Puijalon, S.; Bouma, T.; Koll, K.; Ballio, F.; Tait, S.; Zaramella, M.; Sukhodolov, A.; O’Hare, M.; et al. Aquatic interfaces: A hydrodynamic and ecological perspective. J. Hydraul. Res. 2014, 52, 744–758. [Google Scholar] [CrossRef]
- Zagni, A.F.E.; Smith, K.V.H. Channel flow over permeable beds of graded spheres. J. Hydraul. Div. 1979, 102, 207. [Google Scholar]
- Zippe, H.J.; Graf, W.H. Turbulent boundary layer flow over permeable and non-permeable rough surfaces. J. Hydraul. Res. 1983, 21, 51–65. [Google Scholar] [CrossRef]
- Breugem, W.P.; Boersma, B.J.; Uittenbogaard, R.E. The influence of wall permeability on turbulent channel flow. J. Fluid Mech. 2006, 562, 35–72. [Google Scholar] [CrossRef]
- Manes, C.; Pokrajac, D.; McEwan, I.; Nikora, V. Turbulence structure of open channel flows over permeable and impermeable beds: A comparative study. Phys. Fluids 2009, 21, 125109. [Google Scholar] [CrossRef]
- Manes, C.; Poggi, D.; Ridolfi, L. Turbulent boundary layers over permeable walls: Scaling and near-wall structure. J. Fluid Mech. 2011, 687, 141–170. [Google Scholar] [CrossRef]
- Manes, C.; Pokrajac, D.; Nikora, V.I.; Ridolfi, L.; Poggi, D. Turbulent friction in flows over permeable walls. Geophys. Res. Lett. 2011, 38, L03402. [Google Scholar] [CrossRef]
- Kuwata, Y.; Suga, K. Direct numerical simulation of turbulence over anisotropic porous media. J. Fluid Mech. 2017, 831, 41–71. [Google Scholar] [CrossRef]
- Aberle, J. Measurements of armour layer roughness geometry function and porosity. Acta Geophys. 2007, 55, 23–32. [Google Scholar] [CrossRef]
- Navaratnam, C.U.; Aberle, J.; Daxnerová, J. An Experimental Investigation on Porosity in Gravel Beds. In Free Surface Flows and Transport Processes; Springer International Publishing: Cham, Germany, 2018; pp. 323–334. [Google Scholar]
- Cooper, J.R.; Ockleford, A.; Rice, S.P.; Powell, D.M. Does the permeability of gravel river beds affect near-bed hydrodynamics? Earth Surf. Process. Landf. 2018, 43, 943–955. [Google Scholar] [CrossRef]
- Aberle, J.; Dittrich, A.; Koll, K.; Schoneboom, T. Sohlnahes turbulentes Strömungsfeld. In BAW-Workshop: Boden- und Sohl-Stabilität—Betrachtungen an der Schnittstelle zwischen Geotechnik und Wasserbau; Bundesanstalt für Wasserbau: Karlsruhe, Germany, 2004. [Google Scholar]
- Spiller, S.; Rüther, N. Artificial reproduction of the surface structure in a gravel bed. In 2nd IAHR Europe Conference; TU Munich: Munich, Germany, 2012. [Google Scholar]
- Navaratnam, C.U.; Aberle, J.; Spiller, S.M. Evaluation of the accuracy of a bed casting technique. In River Flow 2016; CRC Press: St. Louis, MO, USA, 2016; pp. 398–403. [Google Scholar]
- Graf, W.H.; Song, T. Bed-shear stress in non-uniform and unsteady open-channel flows. J. Hydraul. Res. 1995, 33, 699–704. [Google Scholar] [CrossRef]
- Leopold, L.B.; Langbein, W.B. The Concept of Entropy in Landscape Evolution. In Theoretical Papers in the Hydrologic and Geomorphic Sciences; United States Government Printing Office: Washington, DC, USA, 1962; pp. A1–A20. [Google Scholar]
- Cassan, L.; Roux, H.; Garambois, P.-A. A Semi-Analytical Model for the Hydraulic Resistance Due to Macro-Roughnesses of Varying Shapes and Densities. Water 2017, 9, 637. [Google Scholar] [CrossRef]


| Test | Sb | Sw | h [m] | h/k [-] | Q [m3/s] | U [m/s] | Fr | Re | u* [m/s] |
|---|---|---|---|---|---|---|---|---|---|
| BC1 | 0.0018 | 0.00134 | 0.137 | 3.6 | 0.056 | 0.41 | 0.35 | 55 890 | 0.043 |
| BC2 | 0.0015 | 0.00103 | 0.178 | 4.7 | 0.076 | 0.43 | 0.32 | 76 270 | 0.043 |
| BC3 | 0.0015 | 0.00103 | 0.236 | 6.2 | 0.121 | 0.51 | 0.34 | 120 787 | 0.050 |
| BC4 | 0.0020 | 0.00159 | 0.215 | 5.7 | 0.124 | 0.58 | 0.40 | 124 107 | 0.059 |
| BC5 | 0.0013 | 0.00083 | 0.293 | 7.7 | 0.156 | 0.53 | 0.31 | 156 412 | 0.050 |
| BC6 | 0.0010 | 0.00051 | 0.353 | 9.3 | 0.168 | 0.48 | 0.25 | 167 987 | 0.043 |
| BC7 | 0.0015 | 0.00098 | 0.319 | 8.4 | 0.200 | 0.63 | 0.35 | 199 883 | 0.057 |
| Bed Surface | Roughness Height, k [mm] | Standard Deviation σ [mm] | Skewness [-] | Kurtosis [-] |
|---|---|---|---|---|
| Gravel | 38.1 | 7.57 | 0.76 | 1.03 |
| Cast | 38.6 | 7.96 | 0.50 | 0.66 |
| Rotated Cast | 40.6 | 8.52 | 0.56 | 0.49 |
© 2018 by the authors. Licensee MDPI, Basel, Switzerland. This article is an open access article distributed under the terms and conditions of the Creative Commons Attribution (CC BY) license (http://creativecommons.org/licenses/by/4.0/).
Share and Cite
Navaratnam, C.U.; Aberle, J.; Qin, J.; Henry, P.-Y. Influence of Gravel-Bed Porosity and Grain Orientation on Bulk Flow Resistance. Water 2018, 10, 561. https://doi.org/10.3390/w10050561
Navaratnam CU, Aberle J, Qin J, Henry P-Y. Influence of Gravel-Bed Porosity and Grain Orientation on Bulk Flow Resistance. Water. 2018; 10(5):561. https://doi.org/10.3390/w10050561
Chicago/Turabian StyleNavaratnam, Christy Ushanth, Jochen Aberle, Jie Qin, and Pierre-Yves Henry. 2018. "Influence of Gravel-Bed Porosity and Grain Orientation on Bulk Flow Resistance" Water 10, no. 5: 561. https://doi.org/10.3390/w10050561
APA StyleNavaratnam, C. U., Aberle, J., Qin, J., & Henry, P.-Y. (2018). Influence of Gravel-Bed Porosity and Grain Orientation on Bulk Flow Resistance. Water, 10(5), 561. https://doi.org/10.3390/w10050561