Abstract
The Wenchuan Earthquake took place in the upper reach catchment of the Min River. It resulted in large amounts of loose materials gathering in the river channel, leading to changes in the sediment transport system in this area. The Zipingpu Reservoir is the last and the largest reservoir located in the upper reach of the Min River. It is near the epicenter and receives sediment from upstream. This paper puts forward a study on the reservoir sedimentation and storage capacity of the Zipingpu Reservoir, employing a multi-beam echo-sounder system in December 2012. Then, the data were merged with digital line graphics and shuttle radar topography mission data in ArcGIS to build a digital elevation model and triangulate the irregular network of Zipingpu Reservoir. Via the analysis of the bathymetric data, the results show the following: (1) The main channels of the reservoir gradually aggrade to a flat bottom from the deep-cutting valley. Sedimentation forms a reach with a W-shaped longitudinal thalweg profile and an almost zero slope reach in the upstream section of the reservoir due to the natural barrier induced by a landslide; (2) The loss ratios of the wetted cross-section surface are higher than 10% in the upstream section of the reservoir and higher than 40% in the natural barrier area; (3) Comparing the surveyed area storage capacity of December 2012 with March 2008, the Zipingpu Reservoir has lost 15.28% of its capacity at the dead storage water level and 10.49% of its capacity at the flood limit water level.
1. Introduction
Dam construction breaks the sediment balance in a natural river, creating an impounded river reach [1]. As the water level rises, the flow speed decreases, and so does the sediment transport capacity [2,3,4,5]. Therefore, the reservoir will gather sediment and lose capacity until a balance is once again achieved, normally after the sediment fills up the impoundment [6]. An estimated value of 0.5–1% of the global reservoir storage is lost each year, while the sedimentation rate varies between 0.1% and 2.3% [7]. The worldwide loss of storage caused by sedimentation each year is greater than the increased capacity from newly built reservoirs [8]. Continual sedimentation can no longer assure reservoir capacity, flood control, power generation, irrigation, and other benefits related to the storage capacity [9,10,11]. Regarding power generation, when the reservoir sedimentation reaches a high level, the energy production will decrease. Regarding irrigation, reservoirs hold and store the sediment and sediment-associated nutrients, resulting in a decline of nutrients downstream [12]. Schmitter et al. [13] found a decreased field nutrient status in the uplands of northwestern Vietnam because local people established a reservoir as a sink for sediment, leading to a nutrient-rich sediment in the reservoir, causing a low level of nutrients downstream and endangering the balance of the ecosystem. Furthermore, sedimentation in a reservoir may also influence the security of the waterway systems and hydraulic structures. For instance, sediment transported by the turbidity current may block or damage the intakes and outlets. Then, it will decrease the efficiency and increase the maintenance costs [14,15].
Hydrographic surveys are the most accurate method to measure the distribution patterns of sediment and the volume occupied. The depth with horizontal coordinates (X, Y) must be obtained in hydrographic surveys. In recent years, there have been many ways to measure the underwater topographic data, like the single-beam echo-sounder (SBES), the multi-beam echo-sounder (MBES), and remote sensing methods like air-borne light detection and ranging (LiDAR), and so forth. The deposition pattern of Tahtali Reservoir in Izmir, Turkey, was surveyed via the dual frequency (28/200 kHz) SBES. The bathymetry and sediment thickness were revealed through the estimation from the difference of depths measured by transducer [16]. Haregeweyn et al. [17] surveyed the Angereb Reservoir in northwestern Ethiopia by employing the SBES and estimated the total annual capacity loss during different periods. Kubinský et al. [18] employed a double-beam sonar and external GPS with a measured step of 5 m to study and analyze the changes of the storage capacity of the vel'ký kolpašký water reservoir from the year 1889–2012. Wang [19] calculated the storage capacity curve of White Oak Bayou watershed utilizing the high-resolution LiARD method. Lima et al. [20] adjusted regression models between field bathymetry values and Landsat 5 TM satellite data, providing satisfactory accuracy for estimating the bathymetry values of the Saco reservoir in Serra Talhada-PE, Brazil. Although the MBES method is commonly used in submarine topography surveys [21,22] and marine scientific investigations [23], a few reports about its application in reservoir surveys can be found.
The economic and societal importance of water storage makes sedimentation in reservoirs an active and expanding field of research. It is necessary to study the rate, pattern, and volume of sediment deposition in order to find out the accurate storage capacity of a reservoir. However, in China, no research has focused specifically on the detailed topographic changes, the precise sedimentation situation, and the accurate capacity loss of the Zipingpu Reservoir after the Wenchuan Earthquake. This paper aims to apply the MBES in the reservoir topographic survey and conduct research within the Zipingpu Reservoir using the MBES bathymetric data and other supplemented data to derive reliable terrain and accurate reservoir capacity. The historical bathymetric data and the MBES data were compared to study topographic changes, sedimentation situation, and reservoir capacity loss that were directly or indirectly induced by the Wenchuan earthquake for the reservoir management.
2. Material and Methods
2.1. Study Area
Zipingpu Reservoir is located in Dujiangyan, Sichuan, Southwestern China, as shown in Figure 1. The reservoir was constructed in 2001 and began to impound water in September 2005. It was built on a mountainous river reach of the Min River, where the rock-cut channel with narrow and V-shaped cross-sections was set in the deep valley. The Min River is the largest tributary of the Yangtze River. It originates from the Min Mountain, with a mean annual discharge of 469 m3/s and total annual runoff of 1.48 × 10¹¹ m3/year. The Zipingpu Reservoir has a catchment area of 22,700 km2 above the dam site, accounting for the drainage area of 98% of the Min River upstream. It effectively controls 98% of the sediment inflow and 90% of the flood inflow of upstream reaches. Downstream of the dam, the reservoir links up with the traditional Dujiangyan Irrigation System. The Zipingpu Reservoir meets the irrigation and municipal water supply of the Dujiangyan irrigation area and Chengdu district as its main purposes, and its other purposes are balancing flood control, power generation, environmental protection, and tourist industry, and so forth. Therefore, the safety of reservoir directly relates to the safety and property of people downstream. Other basic engineering characteristics of the Zipingpu Reservoir are shown in Table 1.
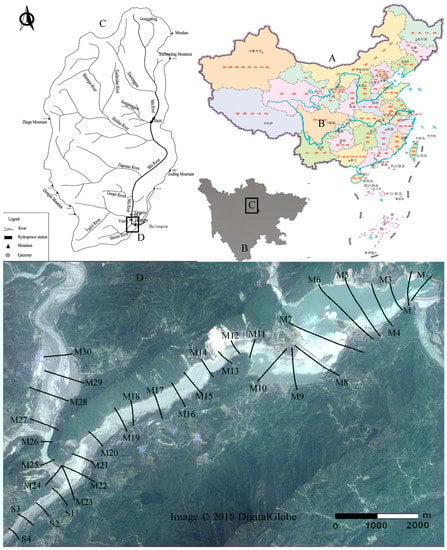
Figure 1.
The location, survey area, and transects. (A) A map of China; (B) Sichuan province; (C) a map showing the location of the Zipingpu reservoir and the upper Min River basin; (D) the survey area and cross-sections (M) denotes the main stream, S denotes the tributary Shouxi River). (A–C) are from the National Administration of Surveying, Mapping and Geoinformation; (D) is from Google Earth.

Table 1.
The basic engineering characteristics of Zipingpu Reservoir.
At 14:28 (UTC + 8) on 12 May 2008, the catastrophic Wenchuan Earthquake (Magnitude = 8.0) took place on the Longmenshan fault zone. The Longmenshan fault consists of the Wenchuan-Maowen fault, the Yingxiu-Beichuan fault, and the Pengzhou-Guanxian (Dujiangyan) fault [24]. Those three faults are located in the catchment of the Zipingpu Reservoir. The Yingxiu-Beichuan fault mainly induced the earthquake. Yingxiu, the earthquake epicenter, is about 17 km from the dam site. The Ministry of Land and Resources of China carried out a systematic investigation and observed landslides, rock falls, and debris flows induced by the earthquake in 15,000 sites [25]. Some occurred in the catchment of Zipingpu Reservoir. For example, the Niujuan landslide was the largest landslide near the epicenter and was located at the end of the reservoir backwater. It destroyed roads and highways, delivered sediment to the Min River, blocked the Niujuan Valley, and formed a barrier lake [26].
Since this was the largest and most destructive earthquake that occurred in this mountainous area in the last 100 years in China, secondary disasters such as landslides, rock falls, debris flows, and so forth, altered the river transport system and increased the sediment discharge in the upper reaches of the Min River. As the last and largest reservoir on the upper reaches of the Min River, the Zipingpu Reservoir received the sediment from upstream and lost its storage capacity. Once the sedimentation reaches a certain degree, it will influence the reservoir operation or cause safety problems, and it may lead to disasters, affecting people downstream in the coming decades. Therefore, the change of the storage capacity of the reservoir caused by sedimentation must be analyzed, and hydrographic data of the reservoir must be obtained.
2.2. Bathymetric Theory
We employed the SBES in the hydrographic survey in the reservoir in 2008 and 2011, and the MBES in the 2012. Both the SBES and the MBES are acoustic depth sounding equipment, measuring the pulse travel time from the transducer to the bottom. The surveys also need to measure the speed of sound in the water column, the horizontal position (X, Y), and the reference water elevation. In this way, the relative depth can be calculated by multiplying the travel time and the speed of the pulse. Then, the space coordinate can be obtained by means of integrating the horizontal position and relative depth data. Although the two pieces of equipment have the same fundamental bathymetric algorithm theory, they still have obvious differences as shown in Figure 2. The SBES may have transducers either with a single transducer or an array, while the number of depth data obtained in one ping equals the number of sensors. With an array of sensors built-in, the MBES transmits a series of fan-shaped pulses directly towards the bed and achieves a depth data profile. The depth is computed while accounting for the beam angle. Along the survey line, the MBES has a better coverage of the bed and can obtain topographic data of a certain area, while the SBES can only measure a line of data underneath the transducer, which cannot represent the terrain. The MBES has many advantages such as saving field observation time. However, the SBES is still used in hydrographic surveys worldwide due to the relatively low cost in terms of money and manpower in China.
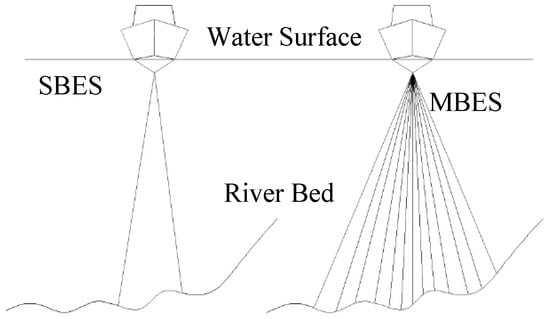
Figure 2.
A sketch of the differences between the SBES and the MBES.
2.3. Equipment
The MBES system is an integrated system. It consists of four parts: The acoustic system, auxiliary system, data collection and visualization system, and post-processing system. In this paper, the survey employed R2sonic 2022 MBES as an acoustic system in December 2012. The R2sonic 2022 MBES can transfer pulses and receive backscatter data. Then, it calculates the hydrographic data profile normal to the trajectory of the ship via built-in microchips. Parameters and configurations of acoustic transducers can be adjusted while operating the Sonic Control software (Sonic Control 2000, R2Sonic, LLC, Austin, TX, USA) during the survey. The auxiliary system consists of devices that can measure the sound speed in water, the position, the heading, and the attitude of the vessel. Those data are of crucial importance in post-processing. Because the speed of sound changes with temperature, pressure, and salinity, it will affect the survey results if it is not correct. Minos-X, produced by the AML Company (Sidney, British Columbia, Canada), provides a measure of the vertical distribution of sound speed for the sound propagation track calibration. The VS 111 GPS compass toolkit, produced by Hemisphere GPS Inc. (Scottsdale, AZ, USA), is utilized to provide the horizontal position, heading, and GPS time for the space coordinate calculation. The Trimble R8 GPS (Trimble, Sunnyvale, CA, USA) is utilized to provide a RTK-GPS solution to position the horizontal and vertical position of the transducers. The IMU-108 attitude sensor, produced by the SMC Company (Gzira, Malta), is also used to collect the attitude data of the vessel. All the data collected by the transducers are integrated, transported, and saved in a computer using the software Navipac and Naviscan (developed by EIVA, Skanderborg, Denmark, www.eiva.com) as a data collection and visualisation system. Navipac is mainly used to monitor and record the trajectory of the ship, and the Naviscan is used to integrate and save the data sets while visualizing the data as 3D point clouds in the topography underwater. Table 2 shows the specifications of the devices in the MBES system. The Hydrographic Information Processing System and Sonar Information Processing System (HIPS&SIPS) software (Version 7.2, CARIS, Fredericton, NB, Canada) was used in the post-processing to derive the topographic data.
Table 2.
The specifications of devices in the MBES system.
2.4. Field Survey
In March 2008 (before the Wenchuan Earthquake) and March 2011, hydrographic data, only including the cross-section depth profiles, were obtained utilizing the real-time kinematic global positioning satellite (RTK-GPS) and the SBES. The traditional volume calculation method was employed to calculate the storage-capacity curve.
In December 2012, the MBES system was employed to survey the reservoir. Before the survey, the MBES system was mounted on a vessel as shown in Figure 3. The relative positions of each sensor to the transducer and the mounted angle offset were measured. As the sound speed in water has a fundamental effect on the accuracy of depth, the distribution of the sound speed in water was measured using the Minos-X during the surveys. After measuring the sound speed, the field survey started. During the survey, the water elevation was measured hourly at each survey region by recording the water gauge reading near the shore. Those data were used to correct the hydrographic raw data in the post-processing to derive the terrain of the reservoir. This survey was conducted over six days, and the survey area covered 15 km2 as shown in Figure 1. However, the other areas in the backwater area of the reservoir were not surveyed, considering the safety.
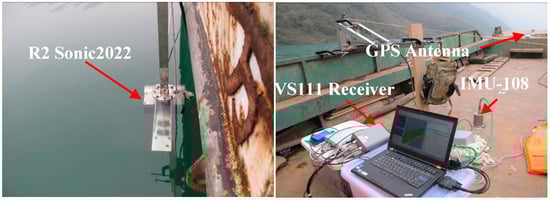
Figure 3.
The MBES system on the vessel during the survey.
2.5. Data Processing
The data post-processing was firstly done in HIPS&SIPS. The hydrographic data with a resolution of 2 m × 2 m were derived from HIPS&SIPS. Then, we imported the data into ArcGIS (V10.2, Esri, Redlands, CA, USA) for further processing. The ArcGIS software has the capability for 3D modeling and visualizing the data with a variety of analyst tools. Triangulated Irregular Network (TIN), one of the most widely used 3D terrain models for creating and representing surfaces with mass data worldwide, was used to create the topographic surface of the Zipingpu Reservoir in ArcGIS [27,28].
Due to the following reasons, the MBES has a blind area the swath cannot cover in the survey: (1) Considering the safety, the MBES should not be applied in shallow water zones with complex terrain; (2) Because the mounting of the echo-sounder requires a draft of water, the MBES cannot obtain data above the transducer; (3) Owing to the swath angle and the distance between the survey vessel and shore, the MBES system will result in a blind area on the shore terrain outside the swath coverage. Considering the safety of the equipment, we generally avoid the bank survey and use digital line graphics (DLG) with a resolution of 1:50,000 and the Shuttle Radar Topography Mission (STRM) 90 m DEM data from the Computer Network Information Center in the Chinese Academy of Science (http://srtm.datamirror.csdb.cn/) [29,30]. In this paper, we created the TIN and DEM (refer to Figure S1 and Figure S2 in Supplemental Material) of the reservoir and its catchment using the data mentioned above.
2.6. Storage Capacity Calculation Methods
Nowadays, in China, the topographic data of the river channel reservoir are generally surveyed using the SBES and RTK (GPS). Considering the small amount of data, the storage capacity of the river channel reservoir is calculated by a cross-section method (Figure 4A). The cross-section method is recommended in the code for the reservoir hydrologic and sediment survey (issued by the Ministry of Water Resources of the People’s Republic of China). It firstly divides the river channel into several prisms according to the cross-sections. Each prism is divided into several trapezoids with the bases divided on the cross-sections. The volume of the trapezoids can be calculated with the height and base areas. The volume of the prism between the two cross-sections can be calculated by summing the volume of the trapezoids. Hence, we can also calculate the storage capacity of the river channel reservoir by summing the volume of those trapezoids (refer to Formula 1–3 and Figure S3A in Supplemental Material).
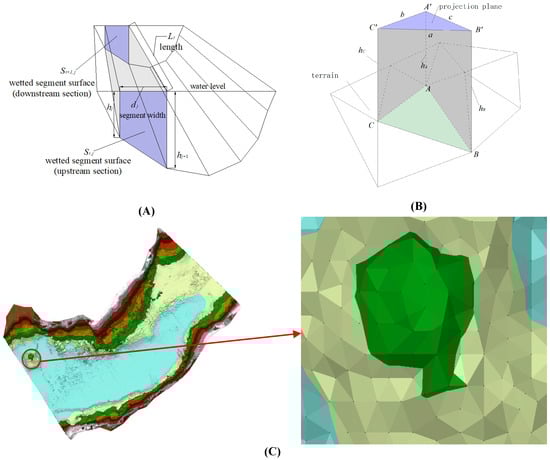
Figure 4.
The storage capacity calculation method. (A) Cross-section Method; (B) Triangle Prism Method; and (C) Triangulated Terrain between M13 and M14.
With the high-density survey data of the river channel reservoir and the rigorous terrain modeling method, TIN, the whole survey area is constructed into a triangular network. To calculate the capacity of the river channel reservoir, we can divide the river channel reservoir into several tri-prisms with TIN terrain and the specified water surface as their bases. The volume of the tri-prism can be calculated by multiplying the base area (on the specified water surface) with the average height (Figure 4B). To calculate the capacity of the river channel reservoir, we only need to sum all the volumes of the tri-prisms (refer to Formula 4–6 and Figure S3B in Supplemental Material). This method can be implemented in ArcGIS.
3. Results
3.1. Comparison of the Calculation Method
A straightforward case was carried out to determine the method to calculate the storage capacity of the Zipingpu Reservoir. The reach between the cross-section of M13 and M14 was chosen. A TIN of the reach was built and can be viewed in Figure 4C. The storage of the river reach under different water levels ranging from 820 m to 850 m was calculated by increments of 5 m and is shown in Table 3. Here, we defined that the storage calculated by the cross-section method is V1 and the storage calculated by the triangular prism method is V2. The results indicated that the relative error (the formula is shown in Table 3) of the calculated storage ranges from 2.37% to 8.04% and increases with the water level. The triangular prism method can provide more detailed information of the terrain with the sufficient MBES data, while the cross-section method can only generalize the volume into several prismoids with trapezoid bases, straighten the centerline between the cross-sections along the reach, and smooth the rough into a slope with insufficient data. Therefore, the cross-section method is less accurate, and the result is less reliable than that of the triangular prism method.
Table 3.
The computational results comparison.
3.2. Accuracy and Reliability of Terrain Data Obtained by the MBES
A spatio-temporal analysis of the consecutive hydrographic survey will contribute to understanding the physical dynamics of the Zipingpu Reservoir. Important indicators for reservoir management monitoring, such as the coastline changes, the reservoir sedimentation situation, and the terrain changes, are also required for the analysis of the lifetimes of the reservoir. For an accurate analysis, the accuracy and reliability of the hydrographic data must be ensured. Compared with the 785 SBES survey points of the river bank, 87.8% of the MBES points were with 0.2 m, 9% were within 0.5 m, and the rest were within 1 m. The achieved accuracy is sufficient for this study. It meets the International Hydrographic Organization (IHO) S-44 Standards for Hydrographic Surveys [31], where the horizontal accuracy is 2 m.
In this study, we established the underwater terrain of the Zipingpu Reservoir using the MBES data and HIPS&SIPS software with a 2 m spatial resolution. For the first time, the underwater terrain of the Zipingpu Reservoir has been revealed. We found that the terrain beneath the water surface was imaged well with detailed topographic features obtained by the MBES as shown in Figure 5, which can show the reliability of the terrain. It is obvious that the MBES survey is more reliable, while the SBES survey only obtains the relatively discrete depth data along the track sketched as the black line in Figure 5. Compared with the images of the same reaches taken in April 2011 from Google Earth, the 2D terrain images are consistent in the morphology of the shallow water zones (shown in the red circle in Figure 6), such as terraces, gullies, overbanks, and so forth. Those consistencies suggest the high resolution, accuracy, and superior performance of the MBES in hydrographic surveys.
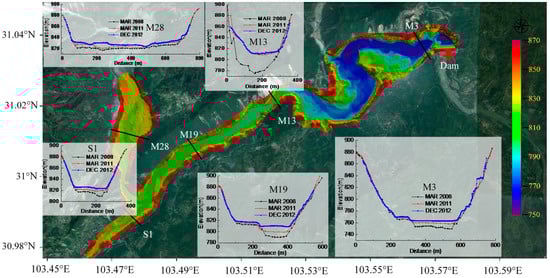
Figure 5.
A map showing the underwater terrain of the Zipingpu Reservoir and the topographic profiles at transects M3, M13, M19, M28, and S1 (M denotes the main stream, S denotes the tributary Shouxi River).
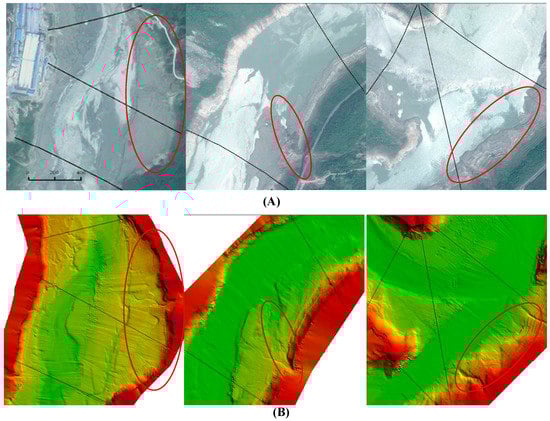
Figure 6.
The comparison between the Google image (A) and the MBES terrain (B).
3.3. Characteristic Deposited Feature on the River Bed
3.3.1. Longitudinal Bed Profiles along the Thalweg
The underwater channel thalweg is a preferential zone of the erosion and deposition. Axial thalweg erosion and deposition occur in the channel during the cycles of the water level lowstand and highstand. The longitudinal bed profile along the thalweg was quantified using sequential topographic data of the reservoir in March 2008, March 2011, and December 2012. The thalweg profiles and the slopes were analyzed. The configuration of the cross-sections measured in the reservoir is shown in Figure 1 and Table 4. The direct sediment supply to the Zipingpu Reservoir increased the axial thalweg deposition within the channel, resulting in the characteristic deposited features on the river bed.
Table 4.
The distance from the dam to each cross-section on the main stream and the Shouxi River (M denotes the main stream, S denotes the tributary Shouxi River).
The longitudinal thalweg profiles evolve with time, as shown in Figure 7, in which the thalweg elevation at each cross-section is plotted against the corresponding distance from the dam. The comparison of the two previous thalweg lines (March 2008 and March 2011) indicates that the thalweg profile of March 2011 has been raised by an averaged value of 9.25 m, with a range of −6.70 m to 33.84 m along the main channel. At the reach between M3 (1.05 km) and M7 (3.57 km) close to the dam site, the elevation of the thalweg along its length increases from 4.45 m to 7.61 m, with an averaged value of 6.68 m. Between M8 (4.27 km) and M11 (6.21 km), the range of the thalweg increment is from 4.34 m to 5.98 m, with an average of 5.09 m. At the reach between M12 (6.62 km) and M14 (7.66 km), the thalweg increases by a maximum value of 33.84 m and the average of 27.32 m in the 1 km reach, where there are counter-slopes and steep slopes because the landslide took place on the left bank of the steep hill. This landslide volume is estimated to be 5.3 × 10⁶ m3. As such large quantities of materials slid into the river channel, a stable natural natural barrier formed. From M15 (8.21 km) to M26 (14.13 km), the thalweg increases from 7.00 m to 13.40 m and it shows a stream-wise growth along its length. The thalweg of the reach between M26 (14.14 km) and M30 (16.46 km) has elevation increments ranging from 3.00 m to 3.95 m, with an average of 3.41 m. According to the information above, it can be concluded that in the upper reaches of M11 (6.21 km), the thalweg has greater elevation increments than those of the lower reach.
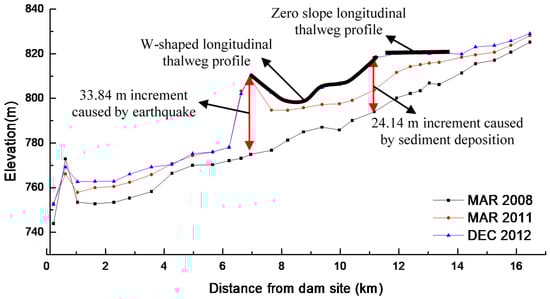
Figure 7.
The evolution of the longitudinal bed profiles along the thalweg.
Comparing the thalweg profile of 2012 to 2011, the averaged increment along the main channel is 3.78 m. The averaged increment of thalweg of the reach between M3 (1.05 km) to M7 (3.57 km) is 3.39 m. The increment ranges from −1.27 m to 1.64 m with average of −0.03 m between M8 (4.27 km) and M13 (6.95 km). In the reach between 7.65 km (M14) and 11.16 km (M20), the thalweg elevation increases from 3.02 m to 14.38 m, with an average of 7.89 m. The increment of thalweg between M21 (11.92 km) and M26 (14.13 km) ranges from 1.42 m to 8.35 m, with an average of 4.89 m. The thalweg of the reach at the reservoir tail has an increment varying from 0.88 m to 3.56 m.
Via analyzing the increment of thalweg profiles, one may draw a conclusion that the variation mainly occurs at the upper reach of M11 (6.21 km). The average annual rate of increase in the thalweg elevation falls from 2 m/a (March 2008 to March 2011) to 1.17 m/a (March 2011 to December 2012) in the reach between M3 (1.05 km) and M10 (5.65 km). A similar trend could be noted in the upper reach. However, the thalweg along the reach between M14 (6.95 km) and M20 (11.16 km) can be characterized to be W-shaped. The upper reach between M20 (11.16 km) and M26 (14.13 km) has an almost zero slope.
3.3.2. Sectional Shape and Wetted Cross-Section Surface Loss
Since there are remarkable changes in the thalweg profile, the river transects vary along the main stream. Figure 5 and Figure 8 show the typical transects on the main stream and tributary (the profiles of all transects are shown in Figure S4), indicating that before the earthquake, the original morphology shape of the Zipingpu Reservoir channel presents as deep cutting V-shaped cross-sections. After the earthquake, the channel shows a greater variation in the bed morphology with U-shaped cross-sections. Figure 5 and Figure 8 show that the bank slopes vary very little, while the deposition of the river bed increases. The bottom of each cross-section on the main stream rises and the main channel has been filled up to be level with sediment. However, compared to other reaches, the topographic changes of the cross-sections in the reach between M9 (4.97 km) and M13 (6.95 km) are different. There are few variations in the topography in this reach during March 2011–December 2012.
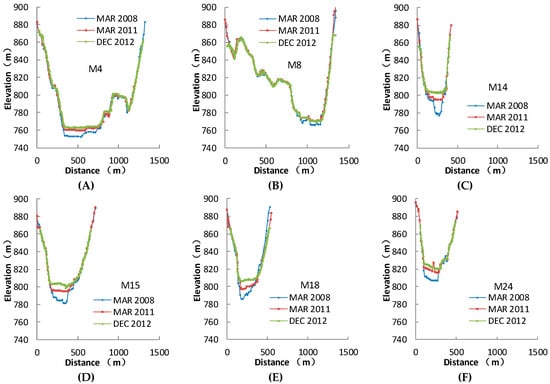
Figure 8.
The topographic profiles of some typical cross-sections. (A) M4; (B) M8; (C) M14; (D) M15; (E) M18; (F) M24.
To analyze the area changes of the cross-sections, here we define the area loss of the wetted cross-section surface as the flow area reduction due to the river bed lifting caused by sedimentation under a certain water level. Via analyzing all the topography of transects, it can be found that the main topographic changes took place under the water level of 850 m. The area loss of wetted cross-section surface under the water level of 850 m is calculated and shown in Figure 9. Compared with the area loss of March 2008–March 2011 and March 2011–December 2012, the highest area loss is 7270 m2 at M13 (6.95 km) during March 2008–March 2011, and 5491 m2 at M6 (2.85 km) during March 2011–December 2012. The average area loss during March 2011–December 2012 in the upstream cross section at M15 (8.21 km) is greater than that of March 2008–March 2011. Therefore, the upstream of the main stream has been more seriously deposited during March 2011–December 2012. At the downstream of the main stream near the dam site, although the area loss mainly concentrates in the reach between M3 (1.05 km) and M8 (4.27 km) in both periods, the elevation of the bed along the river had a small increment due to the enlargement of the river and increment of the water depth (shown in Figure 5 and Figure 7). It can be concluded that the general area loss trends for the two periods are similar along the reservoir, except for the reach between M11 (4.95 km) and M13 (6.95 km).
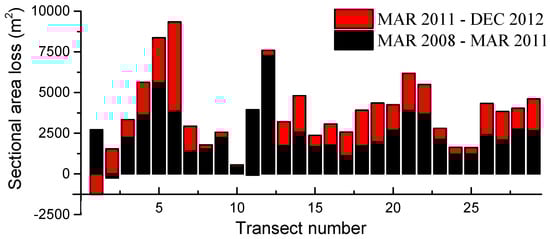
Figure 9.
The wetted cross-section surface loss under the water level of 850 m.
3.3.3. Sedimentation Situation
Considering the prevention of sediment, the operation, and the management of the reservoir, the area with severe sedimentation must be located to ensure the security and reasonable operation of the reservoir. In this paper, we define the loss ratio of the wetted cross-section surface as the wetted cross-section surface loss during 2008–2012 over the flow area of the cross-section under the water level of 850 m in 2008. According to the aforementioned results, the loss ratio of the wetted cross-section surface of each cross-section under the water level of 850 m was calculated and interpolated to the whole survey area as shown in Figure 10. Obviously, the most severe reach is between M12 (6.62 km) and M14 (7.66 km), where the natural barrier is located, and the loss ratio of the wetted cross-section surface exceeds 40%. From the dam site to M11 (6.21 km), the downstream section of the reservoir, the loss ratio of the wetted cross-section surface is lower than 10%. The reach, with a loss ratio of wetted cross-section surface between 10% and 20%, is located between M14 (7.66 km) and M18 (9.97 km). All the remaining reaches have severe depositions with a loss ratio of wetted cross-section surface higher than 20%. Therefore, along with the main stream, the natural barrier divided the reservoir into two sections, the upstream section with a loss ratio of wetted cross-section surface higher than 10%, and the downstream section, with a loss ratio of wetted cross-section surface less than 10%.
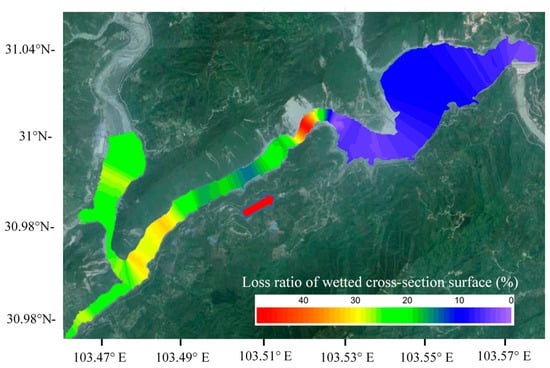
Figure 10.
The distribution of the loss ratio of the wetted cross-section surface in the Zipingpu Reservoir.
3.4. Storage Capacity
Figure 11 shows the storage-capacity curve of the survey area of design, March 2008 (before the Wenchuan Earthquake) and December 2012. It is obvious that the storage-capacity curves of the design and March 2008 almost coincide and seriously deviate from that of December 2012. Via comparison to the storage–capacity curve of March 2008 before the Wenchuan Earthquake, the storage capacity loss ratios are found to be less than 20% at each depth. The dead storage is 1.858 × 10⁸ m3 with a loss ratio of 15.28% compared to the designate curve at the water level of 817 m. At the flood restricted water level of 850 m, the storage capacity is 5.032 × 10⁸ m3 and it had a loss ratio of 10.49%. However, those are approximate results owing to the incomplete survey and imprecise storage capacity of March 2008, calculated by the cross-section method. However, it is still obvious that most of the loss of the storage capacity occurred after the 2008 Wenchuan Earthquake, and mostly under the level of dead water.
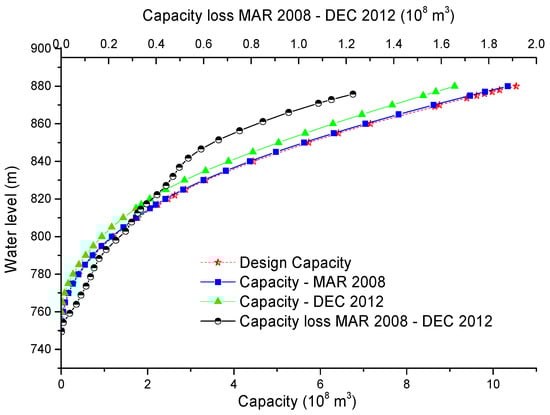
Figure 11.
The storage–capacity curve of the survey area of March 2008 (before the Wenchuan Earthquake) and December 2012.
4. Discussion
In this paper, the results clearly demonstrate that the MBES method is suitable to provide a detailed map and visualization of a large reservoir. The accuracies and reliabilities of this method were checked by comparison with Google images and MBES terrain, and MBES data and SBES data. The MBES method also allowed for the survey in the shallow-water zone, which can hardly be mapped in detail (Figure 5 and Figure 6), and it can accurately detect the features of the topography by covering a large area. This is important since the SEBS method only obtains the discrete depth data along the cross-sections. The higher the water level, the larger the reservoir area the MBES method can cover. This means that the MBES method should be employed at a high water level for the purpose of “full coverage” survey. Generally, the full coverage survey cannot be achieved because of the complex river terrain that the survey cannot reach. The MBES method cannot detect the terrain above the water level. However, this problem could be solved if we consider using LiDAR to detect both the shallow water zone and the terrain above water.
In this case, we compared the two storage-capacity calculation methods and the computed results show a relative error ranging from 2.37% to 8.04%. The main source of this relative error was due to the cross-section method. This is because the cross section method straightens the centerline between the cross-sections along the reach and smooths the rough into a flat slope by generalizing the natural river into prismatoids with trapezoid bases. Another source of error is the quantity of the topographic data. The more data the survey obtains, the more detailed terrain we can establish and the more precise storage capacity result we can get. Given that the storage capacity curves are calculated by different calculation methods and bathymetric data, the design capacity and capacity of March 2008 should be less than the real reservoir capacity. The influences of the sedimentation on the reservoir storage can be considered negligible before March 2008. The capacity loss under the water level of 870 m should be larger than the calculated value due to the low capacity of March 2008 calculated by the cross-section method. Unfortunately, we cannot determine those capacities and the capacity loss values limited by the SBES data.
Changes of longitudinal bed profiles along the thalweg are indicative of a temporal sequence of sedimentation in the Zipingpu Reservoir (Figure 7). In the reach between M11 (6.62 km) and M14 (7.66 km), the thalweg elevations dramatically rise during March 2008–March 2011 and remain constant during March 2011–December 2012. However, changes of the rest of the cross-sections differ. Their thalweg elevations keep rising during March 2008–December 2012. Similar results can be concluded from Figure 5, Figure 8 and Figure 9. Hence, the topographic changes of reach between M11 (6.62 km) and M14 (7.66 km) can mainly be generated by the landslide triggered by the earthquake, while the topographic changes of the remaining reaches are formed mainly due to the sediment inflow after the earthquake. It should be noted that this result lacks effective support of timely topographic survey after the earthquake, and the contribution of landslide and sediment inflow to sedimentation cannot be quantitatively distinguished.
5. Conclusions
The underwater topographic terrain of the Zipingpu Reservoir is derived and revealed for the first time. The influences of the earthquake on the Zipingpu reservoir are investigated and presented as follows: (1) A natural barrier is generated by a landslide, with a bed lifting of 33.84 m at 7.21 km upstream of the dam, and division of the reservoir channel into the upstream and downstream section. In the upstream section, the main channel is substantially silted by the sediment, and gradually changes from a V-shaped channel into a U-shaped channel. Besides, there are zero slopes and W-shaped slopes forms in the longitudinal direction along the thalweg in the upstream reservoir section; (2) The most important deposition area is the reach where the natural barrier located, with a loss ratio of wetted cross-section surface over 40%. The loss ratios of the wetted cross-section surface are lower than 10% in the downstream reservoir section, ranging from 10% to 20% in the reach between 7.66 km and 9.97 km, respectively, and higher than 20% in the remaining reaches in the upstream reservoir section; (3) The calculated results of the storage capacity curve of March 2008 and December 2012 show that the storage capacity loss ratios are 15.28% at the dead storage water level and 10.49% at the flood limit water level owing to the sedimentation after the Wenchuan Earthquake.
Supplementary Materials
The following are available online at http://www.mdpi.com/2073-4441/10/5/557/s1. Figure S1. The storage capacity calculation method. (A) Cross-section Method; (B) Triangle Prism Method; and (C) Triangulated Terrain between M13 and M14; Figure S2. The TIN terrain of Zipingpu Reservoir; Figure S3. The DEM and 3-dimensional visualization of the Zipingpu Reservoir. (A) The DEM of the reservoir; (B) The 3-dimensional visualization of the reservoir; Figure S4. The topographic profiles of all cross sections.
Author Contributions
Zhong-luan Yan and Rui-dong An performed the experiments, analyzed the data and wrote the manuscript. Jia Li designed the experiments and revised the manuscript. Lei-lei Qin, Rui Wang, Xiao-ming Wang and Xi-liang Tang processed the data and revised the manuscript. The authors also thank the anonymous reviewers for their help in improving the scientific content of the manuscript.
Acknowledgments
This research was supported by the National Natural Science Foundation of China (Grant No. 51579164 and 91547211), China Three Gorges Projects Development Co., Ltd. (Contract No. JG/18019B and JG/18020B) and Sichuan Province Zipingpu Development Co., Ltd.
Conflicts of Interest
The authors declare no conflict of interest.
References
- Mulu, A.; Dwarakish, G.S. Different approach for using trap efficiency for estimation of reservoir sedimentation. An overview. Aquat. Procedia 2015, 4, 847–852. [Google Scholar] [CrossRef]
- Alemu, M.M. Integrated watershed management and sedimentation. J. Environ. Prot. 2016, 7, 490–494. [Google Scholar] [CrossRef][Green Version]
- Schwindt, S.; Franca, M.J.; Schleiss, A.J. Effects of lateral and vertical constrictions on flow in rough steep channels with bedload. J. Hydraul. Eng. 2017, 143. [Google Scholar] [CrossRef]
- Pandey, A.; Chaube, U.C.; Mishra, S.K.; Kumar, D. Assessment of reservoir sedimentation using remote sensing and recommendations for desilting patratu reservoir, India. Int. Assoc. Sci. Hydrol. Bull. 2014, 61, 711–718. [Google Scholar] [CrossRef]
- Morris, G.L.; Fan, J. Reservoir Sedimentation Handbook: Design and Management of Dams, Reservoirs, and Watersheds for Sustainable Use; McGraw-Hill: New York, NY, USA, 1998; ISBN 007043302X. [Google Scholar]
- O’Connor, J.E.; Grant, G.E. A Geological Framework for Interpreting Downstream Effects of Dams on Rivers, A Peculiar River. Am. Geophys. Union 2013, 203–219. [Google Scholar] [CrossRef]
- Rashid, M.U.; Shakir, A.S.; Khan, N.M.; Latif, A.; Qureshi, M.M. Optimization of multiple reservoirs operation with consideration to sediment evacuation. Water Resour. Manag. 2015, 29, 2429–2450. [Google Scholar] [CrossRef]
- Schleiss, A.J.; Cesare, G.D. Physical model experiments on reservoir sedimentation. J. Hydraul. Res. 2010, 48, 54–57. [Google Scholar]
- Wisser, D.; Frolking, S.; Hagen, S.; Bierkens, M.F.P. Beyond peak reservoir storage? A global estimate of declining water storage capacity in large reservoirs. Water Resour. Res. 2013, 49, 5732–5739. [Google Scholar] [CrossRef]
- Schleiss, A.J.; Franca, M.J.; Juez, C. Reservoir sedimentation. J. Hydraul. Res. 2016, 54, 595–614. [Google Scholar] [CrossRef]
- Morris, G.L. Sediment management and sustainable use of reservoirs. Mod. Water Resour. Eng. 2014, 279–337. [Google Scholar] [CrossRef]
- Beusen, A.H.W.; Bouwman, A.F.; Van Beek, L.P.H.; Mogollón, J.M.; Middelburg, J.J. Global riverine N and P transport to ocean increased during the twentieth century despite increased retention along the aquatic continuum. Biogeosciences 2015, 13, 2441–2451. [Google Scholar] [CrossRef]
- Schmitter, P.; Fröhlich, H.L.; Dercon, G.; Hilger, T.; Thanh, N.H.; Lam, N.T. Redistribution of carbon and nitrogen through irrigation in intensively cultivated tropical mountainous watersheds. Biogeochemistry 2012, 109, 133–150. [Google Scholar] [CrossRef]
- Faghihirad, S.; Lin, B.; Falconer, R.A. Application of a 3D layer integrated numerical model of flow and sediment transport processes to a reservoir. Water 2015, 7, 5239–5257. [Google Scholar] [CrossRef]
- An, R.D.; Li, J. Characteristic analysis of the plunging of turbidity currents. J. Hydrodyn. Ser. B 2010, 22, 274–282. [Google Scholar] [CrossRef]
- Elci, S.; Bor, A.; Caliskan, A. Using numerical models and acoustic methods to predict reservoir sedimentation. Lake Reserv. Manag. 2009, 25, 297–306. [Google Scholar] [CrossRef]
- Haregeweyn, N.; Melesse, B.; Tsunekawa, A.; Tsubo, M.; Meshesha, D.; Balana, B.B. Reservoir sedimentation and its mitigating strategies: A case study of Angereb reservoir (NW Ethiopia). J. Soils Sediments 2012, 12, 291–305. [Google Scholar] [CrossRef]
- Kubinský, D.; Lehotský, M.; Weis, K. Changes in bathymetry and land cover of riparian zone of an old artificial water reservoir vel’ký kolpašký. Carpath. J. Earth Environ. Sci. 2014, 9, 171–178. [Google Scholar]
- Wang, L.; Yu, J. Modelling detention basins measured from high-resolution light detection and ranging data. Hydrol. Process. 2012, 26, 2973–2984. [Google Scholar] [CrossRef]
- Lima, J.R.D.C.; Shinozakimendes, R.A.; Almeida, A.Q.D. Bathymetry estimation of the Saco reservoir-PE with the help of orbital data. Eng. Agríc. 2013, 33, 1017–1023. [Google Scholar] [CrossRef]
- Rollet, N.; Mcgiveron, S.; Hashimoto, T.; Hackney, R.; Petkovic, P.; Higgins, K. Seafloor features and fluid migration in the Capel and Faust basins, offshore eastern Australia. Mar. Pet. Geol. 2012, 35, 269–291. [Google Scholar] [CrossRef]
- Song, G.S.; Lo, S.C.; Fish, J.P. Underwater slope measurement using a tilted multibeam sonar head. IEEE J. Ocean. Eng. 2014, 39, 419–429. [Google Scholar] [CrossRef]
- Cox, M.J.; Warren, J.D.; Demer, D.A.; Cutter, G.R.; Brierley, A.S. Three-dimensional observations of swarms of Antarctic krill (euphausia superba) made using a multi-beam echosounder. Deep-Sea Res. 2010, 57, 508–518. [Google Scholar] [CrossRef]
- Xu, Q.; Fan, X.M.; Huang, R.Q.; Westen, C.V. Landslide dams triggered by the Wenchuan earthquake, Sichuan province, South West China. Bull. Eng. Geol. Environ. 2009, 68, 373–386. [Google Scholar] [CrossRef]
- Yin, Y.P.; Wang, F.; Ping, S. Landslide hazards triggered by the 2008 Wenchuan earthquake, Sichuan, China. Landslides 2009, 6, 139–152. [Google Scholar] [CrossRef]
- Wei, F.; Chernomorets, S.; Aristov, K.; Petrakov, D.; Tutubalina, O.; Su, P. A seismically triggered landslide in the Niujuan valley near the epicenter of the 2008 Wenchuan earthquake. J. Earth Sci. 2010, 21, 901–909. [Google Scholar] [CrossRef]
- Yanalak, M. Effect of gridding method on digital terrain model profile data based on scattered data. J. Comput. Civ. Eng. 2003, 17, 58–67. [Google Scholar] [CrossRef]
- Aykut, N.O.; Akpınar, B.; Aydın, Ö. Hydrographic data modeling methods for determining precise seafloor topography. Comput. Geosci. 2013, 17, 661–669. [Google Scholar] [CrossRef]
- Hutchinson, M.F. A new procedure for gridding elevation and stream line data with automatic removal of spurious pits. J. Hydrol. 1989, 106, 211–232. [Google Scholar] [CrossRef]
- Khan, A.; Richards, K.S.; Parker, G.T.; Mcrobie, A.; Mukhopadhyay, B. How large is the upper Indus basin? the pitfalls of auto-delineation using dams. J. Hydrol. 2014, 509, 442–453. [Google Scholar] [CrossRef]
- Standards for Hydrographic Surveys (S-44); International Hydrographic Bureau: Monte Carlo, Monaco, February 2008.
© 2018 by the authors. Licensee MDPI, Basel, Switzerland. This article is an open access article distributed under the terms and conditions of the Creative Commons Attribution (CC BY) license (http://creativecommons.org/licenses/by/4.0/).