1. Introduction
Mountain-valley systems exist throughout the world, but perhaps nowhere is this better expressed than in the state of Nevada (USA), where over 314 mountain ranges enclose over 200 valleys [
1]. Plant communities in these mountain-valley systems are dependent on snowmelt, rain and often precipitation redistribution to lower elevations, including mountain block recharge that supplies water to valley groundwater systems [
2,
3,
4]. Such systems are sensitive to shifts in the climate regime that are manifested along elevation gradients. In the Great Basin, temperatures at lower elevations have increased 0.6 to 0.8 °C during the period between 1970 and 2010 [
5], and annual precipitation has been reported to increase from 6% to 16% since 1950 [
6]. Significant increases in the annual minimum temperatures in the Great Basin have also been documented [
7], occurring faster in the winter, leading to a decrease in the number of frost days during 1901–2010. Longer-term shifts to warmer temperatures have been linked to changes in the vegetation communities, but with confounding factors of human-related disturbances [
8,
9]. Significant research, particularly across elevation gradients, is still needed to understand how vulnerable such mountain-valley systems are to climate variability and if plant communities could become decoupled from what are currently reliable sources of water [
3].
Snow is a key component of mountain hydrologic systems in the Great Basin [
10], as it is with other mountainous regions in the western U.S., where over the last half century, snowmelt has been documented to occur earlier [
11] with the center of mass of annual runoff also shifting earlier. A recent report by the United States Bureau of Reclamation (BOR) indicates that runoff is expected to occur earlier in the year in the western U.S., with less runoff in summer and more in the winter and spring [
12]. Earlier shifts in snowmelt have also been linked to earlier stream-flow (2–3 weeks earlier) over a 29-year period in Colorado [
13].
In the arid and semi-arid west, evapotranspiration (ET) is often limited by precipitation amounts at lower elevations but becomes less restricted at higher elevations where snowmelt can exceed plant water requirements during shorter growing periods. Growing periods at higher elevations are generally constrained by temperature, which can be seasonally out of synchrony with precipitation or soil moisture availability, leading to poorly defined relationships between temperature and ET [
14,
15].
If the climate continues to warm and snowmelt occurs even earlier, much of the snowmelt water may move to lower elevations before plants at higher elevations become active and able to use the water for growth. As such, snowmelt may contribute to larger drainage fluxes that could recharge valley groundwater systems. If plants not already limited by photoperiod could respond to warmer climates by becoming active earlier in the year, i.e., photosynthesis and transpiration occurring earlier [
16,
17,
18,
19,
20,
21,
22,
23,
24,
25] substantial shifts in ET might occur at lower snow/rain transition zones [
26], in turn leading to reduced drainage and basin recharge. However, earlier extraction of soil moisture may lead to deficit conditions later in the spring period with significant declines in ET, causing a shift in the ET curve but perhaps not a shift in the total ET, as has been documented using terracosms in Oregon [
27].
In this paper, we focus on near surface hydrologic processes and how these change with elevation and plant communities in a typical Great Basin environment. Complex flow paths occur within the mountains influencing mountain block recharge [
4,
28], but such hydrogeologic research was outside the scope of this study. However, we were fortunate to be able to monitor flow from an inactive mine located near the Pinyon-Juniper West site that we believe reflected mountain block recharge. Therefore, the objective of this research was to examine a unique data set derived from a network of monitoring stations (soil and atmospheric parameters) located in Spring Valley and on the western slope of the southern Snake Range in east central Nevada (NV), specifically assessing shifts in precipitation, soil water status and associated drainage with elevation and how this may influence the responses in mine water flow, groundwater levels in the valley and plant specific responses in NDVI and ET, all critical for better understanding the impact of possible climate warming and/or basin water diversion on mountain valley systems.
2. Material and Methods
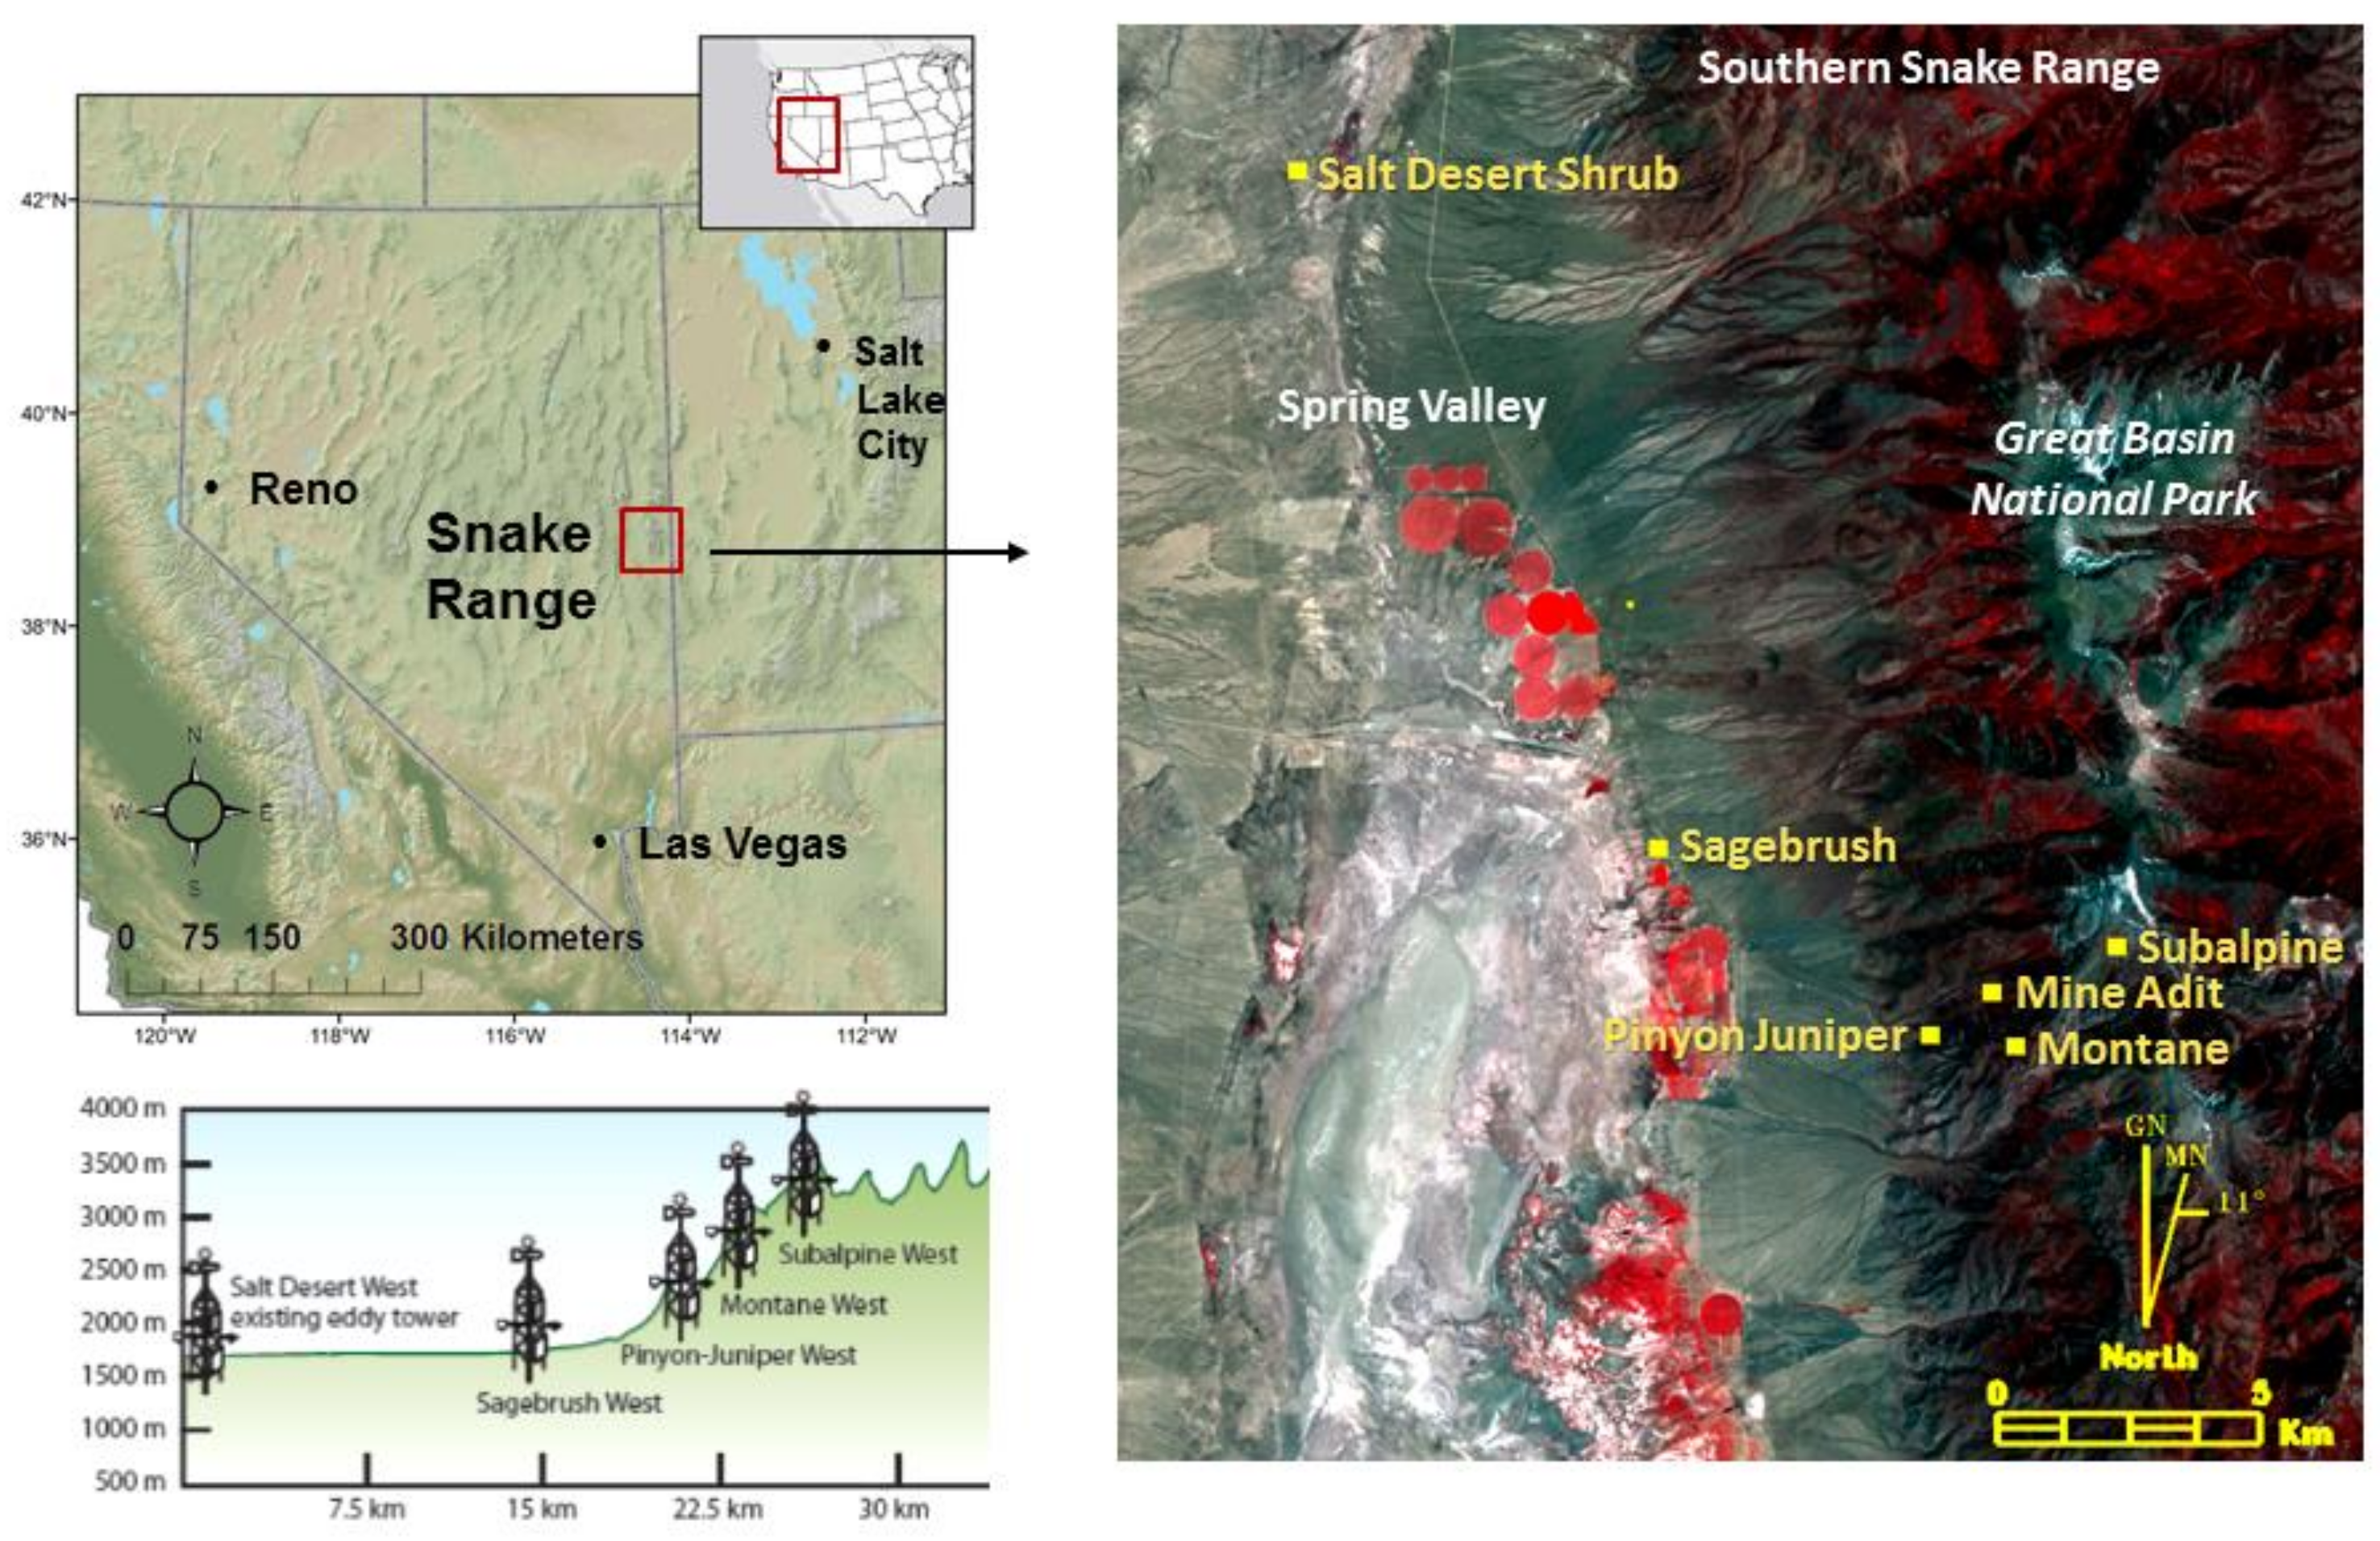
A field study was conducted at five sites located on either the valley floor (Spring Valley, NV, USA) or on the western slope of the Snake Mountain Range (
Figure 1,
Table 1) to assess near surface hydrologic processes in distinct plant communities over a mountain valley gradient. Our study sites were in representative locations for each major vegetation “zone” or assembly in the mid-to-upper elevations of the Great Basin Desert ecosystem. The Salt Desert Shrub West site was in the apex of the Spring Valley floor, where the lowest elevations of the valley are found. The site was highly exposed, being surrounded by salt-tolerant shrubs and grasses to a height of 0.5–1 m. The Sagebrush site was in the valley well away (~4.5 km) from the mountain front in a classic sage-dominated shrubland with canopy height to 1 m. The Pinyon-Juniper site was situated on a small west-facing sub-ridge at the top of the piedmont transition, within a healthy woodland of moderately-dense <200-year-old trees with canopy height to ~5–6 m. The Montane West site was located on a broad west-facing ridge in classic mixed-conifer vegetation, with scattered shrub understory and mixed-age trees with a dominant canopy height of 12–16 m. The Subalpine West site was placed in a near-tree line south-facing woodland slope dominated by low-density 8–12 m high pine and spruce, with a sparse grass/forb understory. None of the sites were in a local hydrological convergence zone, and none exhibited signs of human-caused mechanical disturbance that would alter natural runoff, infiltration, or drainage characteristics.
2.1. Meteorological Stations
Monitoring stations used in this study were part of the Nevada Climate-ecohydrological Assessment Network (NevCAN), a set of elevational transects across representative Great Basin life zones [
29]. The NevCAN system records automated observations of atmospheric and near-surface soil variables, as well as vegetation growth characteristics, hourly imagery, and other specialized measurements at select locations. Instruments are examined seasonally, and field calibrations are performed on a routine basis. Data are transmitted in real time to servers at the University of Nevada, Reno via a digital field cyber-infrastructure [
30].
Each 10-m tower was equipped with a wide range of sensors; full descriptions are provided at the NevCAN website (nevcan.dri.edu). Only data from sensors reported in the study are discussed. Sensors used in this study are as follows; camera (Canon VB-C60 Wide Angle PTZ Network Camera, B&H, New York, NY, USA), combination temperature and relative humidity sensors (HMP50,Campbell Scientific, Logan, UT, USA), all-weather precipitation gage with single hinged alter-type wind shield (T-200B, Geonor Inc., Augusta, NJ, USA), a tipping bucket rain gage with no shield (TB04, Campbell Scientific, Logan, UT, USA), soil water content sensors (CS650, Campbell Scientific, Logan, UT, USA) and soil temperature sensors (Type-T Thermocouple, Omega Engineering Stamford, CT, USA). In 2012 we installed soil water content sensors (CS650, Campbell Scientific, Logan, UT, USA) and soil matric sensors (CS229, Campbell Scientific, Logan, UT, USA) in a paired arrangement at depths of 12.5, 25, 50 and 100 cm at all but the Salt Desert Shrubland West site. The soil matric sensors were all calibrated prior to installation using the method of Bilskie [
31]. Soil samples taken with depth associated with each site were sampled and sent to a commercial laboratory for textural analysis.
Reference evapotranspiration (ET
ref) was calculated by inputting hourly air temperature, relative humidity, wind speed and solar radiation into the Kimberly-Penman equation [
32] as part of basic Western Regional Climate Center (WRCC) climate data services (2016), recognizing limitations associated with the lack of homogeneous fetch in mountain forested areas.
2.2. Mine Water Flow
Mine water flow was monitored from an abandoned (1960) tungsten mine located on the western slope of the southern Snake Range in a Pinyon Juniper West plant community within the elevation gradient. The adit mine portal discharges water year-round. Water-bearing fractures were not evaluated, due to mine safety concerns; however, water is assumed to be issuing from the fracture-controlled ore body. The adit extends 1189 meters easterly, from the massive cliff band of Mt. Washington (Snake Range), then the ore body extends north and south of the adit (ore body strikes NW 45° and dips 05 degrees south). Underground openings total approximately 1500 m (Mindat.org, accessed on 11 February 2017). The mine is basically all at one level, with no deep shafts. The mine adit has a very gradual slope to allow water to drain to the portal. The mine was excavated into fractured rock near the contact of a granitic intrusion with host rocks of Prospect Mountain quartzite, Pioche shale and Pole Canyon limestone (D. Prudic, personal communication).
An H-flume (LLC-30.5 cm, Virtual Polymer Compounds, Medina, NY, USA) was installed in the mine portal to measure water flow rates; stage was monitored with a pressure transducer (CS451–2 kPa, Campbell Scientific, Logan, UT, USA) and calibration coefficients specific to the H flume were applied to the data to convert stage readings to flow rates in liters per second (LPS). Measurements were acquired every ten seconds and average readings were recorded to memory every ten minutes on a data logger (CR 1000, Campbell Scientific, Logan, UT, USA). During the period of record, the flow rate ranged from 0.1 to 10 LPS, water temperature ranged from 4.9 to 5.7 °C, and electrical conductance range from 0.268 to 0.292 dSm−1 (CS 547 water temperature and conductance sensor, Campbell Scientific, Logan, UT, USA).
2.3. Monitoring Well
In May 2007, a monitoring well was installed at the Salt Desert Shrubland West site in Spring Valley (NV). The well was constructed using a 0.18-m diameter hollow stem auger. Core samples, 0.60 m in length, were removed with a split-spoon sampler through the center of the hollow stem auger. The well screen was positioned so that 0.8 m of screen was above the static water level. As the auger was removed, gravel pack material was poured into the annular space, filling it to approximately 0.6 m above the upper screen slot. Bentonite aggregate was then packed over the gravel and then hydrated with water to create a 0.3-m gap at the top of the annulus. The remaining annulus was filled to the surface with neat cement. A surface level well protector was placed over the top of the well and a concrete pad was poured to finish well construction.
The well was equipped with a pressure transducer (Pressure Systems, Inc., Hampton, VA, USA) that was connected to a CR5000 data logger (Campbell Scientific, Logan, UT, USA). The transducer was vented with a pressure range of 0 to 34 kPa (gauge). The pressure transducer was lowered into the well with about 2.7 m of groundwater head over the sensor. Pressure was recorded every 60 min.
2.4. Remote Sensing
Remote sensing analysis for this project included both satellite image analysis as well as field spectra analysis. Landsat 8 Thematic Mapper (TM) images were acquired from the U.S. Geological Survey’s National Center for Earth Resources and Observation Science (EROS) Data Center at the highest level of terrain correction (L1TP) with 30 m spatial resolution [
33]. The TM data are comprised of eleven bands; an ultra-blue band, four visible bands, one near infrared (NIR), two shortwave infrareds, a panchromatic, a cirrus and two thermal infrared bands. Scenes from the 2013–2015 growing seasons, with little or no cloud cover; were acquired for the southern Snake Range region of east-central Nevada.
The image processing steps performed included: (1) calibration, atmospheric correction and normalization; (2) calculating the normalized difference vegetation index (NDVI); RNIR − RRed/RNIR + RRed, where R = reflectance of either the NIR or Red bands; and (3) extracting the single pixel NDVI value (30 m) for the NevCAN tower locations as well as an average NDVI value for a nine by nine pixel area centered on the NevCAN towers. However, all derived correlations with NDVI were highest with the single pixel approach, which is reported in this paper.
Calibration to top-of-atmosphere radiance values was performed using the ENVI (Environment for Visualizing Images; Harris Geospatial Solutions, Boulder, CO, USA) Landsat 8 calibration subroutine [
34]. The second step was atmospheric correction, image normalization and conversion to ground reflectance values. Atmospheric correction and normalization was performed using the Empirical Line Method using ground-based spectral measurements of light and dark targets [
35,
36,
37]. Ground-based spectral measurements were acquired on the summer solstice at solar zenith with a field spectrometer during a Landsat overpass to enable atmospheric correction and normalization of all Landsat images. The FieldSpec Pro (Analytical Spectral Devices, Inc., Boulder, CO, USA) has an effective spectral range of 350 to 2500 nm with 1 nm waveband increments, which encompasses all the Landsat TM 8 bands except the thermal band. The field spectra were resampled to the Landsat 8 band wavelength intervals and then regression analysis was performed between resampled field spectra and Landsat pixel radiance values for the same locations. Normalization was simultaneously performed by atmospherically correcting all images to the one common set of resampled field spectra. The final step of the image processing was the calculation of an NDVI band from the atmospherically corrected and normalized image data and extraction of the NDVI values for the tower location for each image date. Aerial imagery available on Google Earth was used in addition to GPS coordinates to ensure that both ground targets for atmospheric correction and locating the NevCAN towers was performed accurately.
2.5. Drainage Flux Meters
A drainage flux meter (G2 passive capillary lysimeter, Decagon, Pullman, WA, USA) was installed at each site in 2012 apart from the Salt Desert Shrubland West site. High salt buildup in the upper 2 m of the mixed desert shrubland site signaled no drainage was occurring at this site. Sites for drainage flux meter installation were selected to be representative of the landscape, avoiding areas that would be impacted by significant runoff. Holes were hand dug and soil in the 15 to 75 cm region was collected and hand packed into the column to attain similar soil bulk densities as observed in the field. At the same time, intact cores were taken to assess saturated hydraulic conductivity [
38]. Columns were positioned 15 cm below the soil surface. Cables were run below ground to a meter box that housed a small data logger (Decagon Devices, Pullman, WA, USA). Once the drainage flux meter and associated cables were in place, soil and native vegetation (grass/annuals) were placed over the flux meters. Because of rocky strata it was not possible to install a 66 cm column at all sites (Subalpine West; 66 cm, Montane West 41 cm, Pinyon Juniper West 51 cm, Sagebrush West 51 cm). Soil pits dug at the lower sites revealed little moisture with depth, few roots beyond 70 cm and the presence of salts. However, we recognize that severing roots for the installation of the flux meters could have influenced drainage in an unknown way and that water draining from the bottom of the flux meters into fractured rock may have been intercepted by deeper roots (although not observed at the bottom of installation pits ~ 1.5 m). Soil textural data is reported in
Table 1. Clay content in the surface soil at all sites was not considered high as clay content ranged from 10 to 23%, with the NRCS classifying internal drainage as “Well” for all sites except at the Sagebrush site where we observed greater compaction. Data were downloaded twice per year and batteries for the data logger were replaced annually.
2.6. Data Analysis
Data were analyzed using descriptive and linear/multiple regression analyses to assess plant, soil, water, and atmospheric interactions. Multiple regressions were performed in a backward stepwise manner, with deletion of terms occurring when p values for the t-test exceeded 0.05. To eliminate the possibility of co-correlation, parameters were included only if variance inflation factors (VIF) were ≤2.0 and the total was ≤10.0. If the accepted VIF were exceeded, parameters were eliminated, and regression analyses were rerun. All statistical analyses were performed using SigmaStat Software (Systat Software Inc., Point Richmond, CA, USA).
3. Results
The climate assessment network associated with the mountain valley system in this study provided a unique data set of atmospheric and soil-based monitoring parameters. We present results that reflect the first 3 years of data acquisition with emphasis on near surface hydrologic processes and plant level response as inferred from NDVI values and ET estimates.
3.1. Precipitation and Reference Evapotranspiration with Elevation
All the sites were situated within specific plant communities that ranged from the Salt Desert Shrubland (greasewood/sagebrush) at 1756 m elevation to Subalpine (bristle cone pine) at the 3355 m elevation (
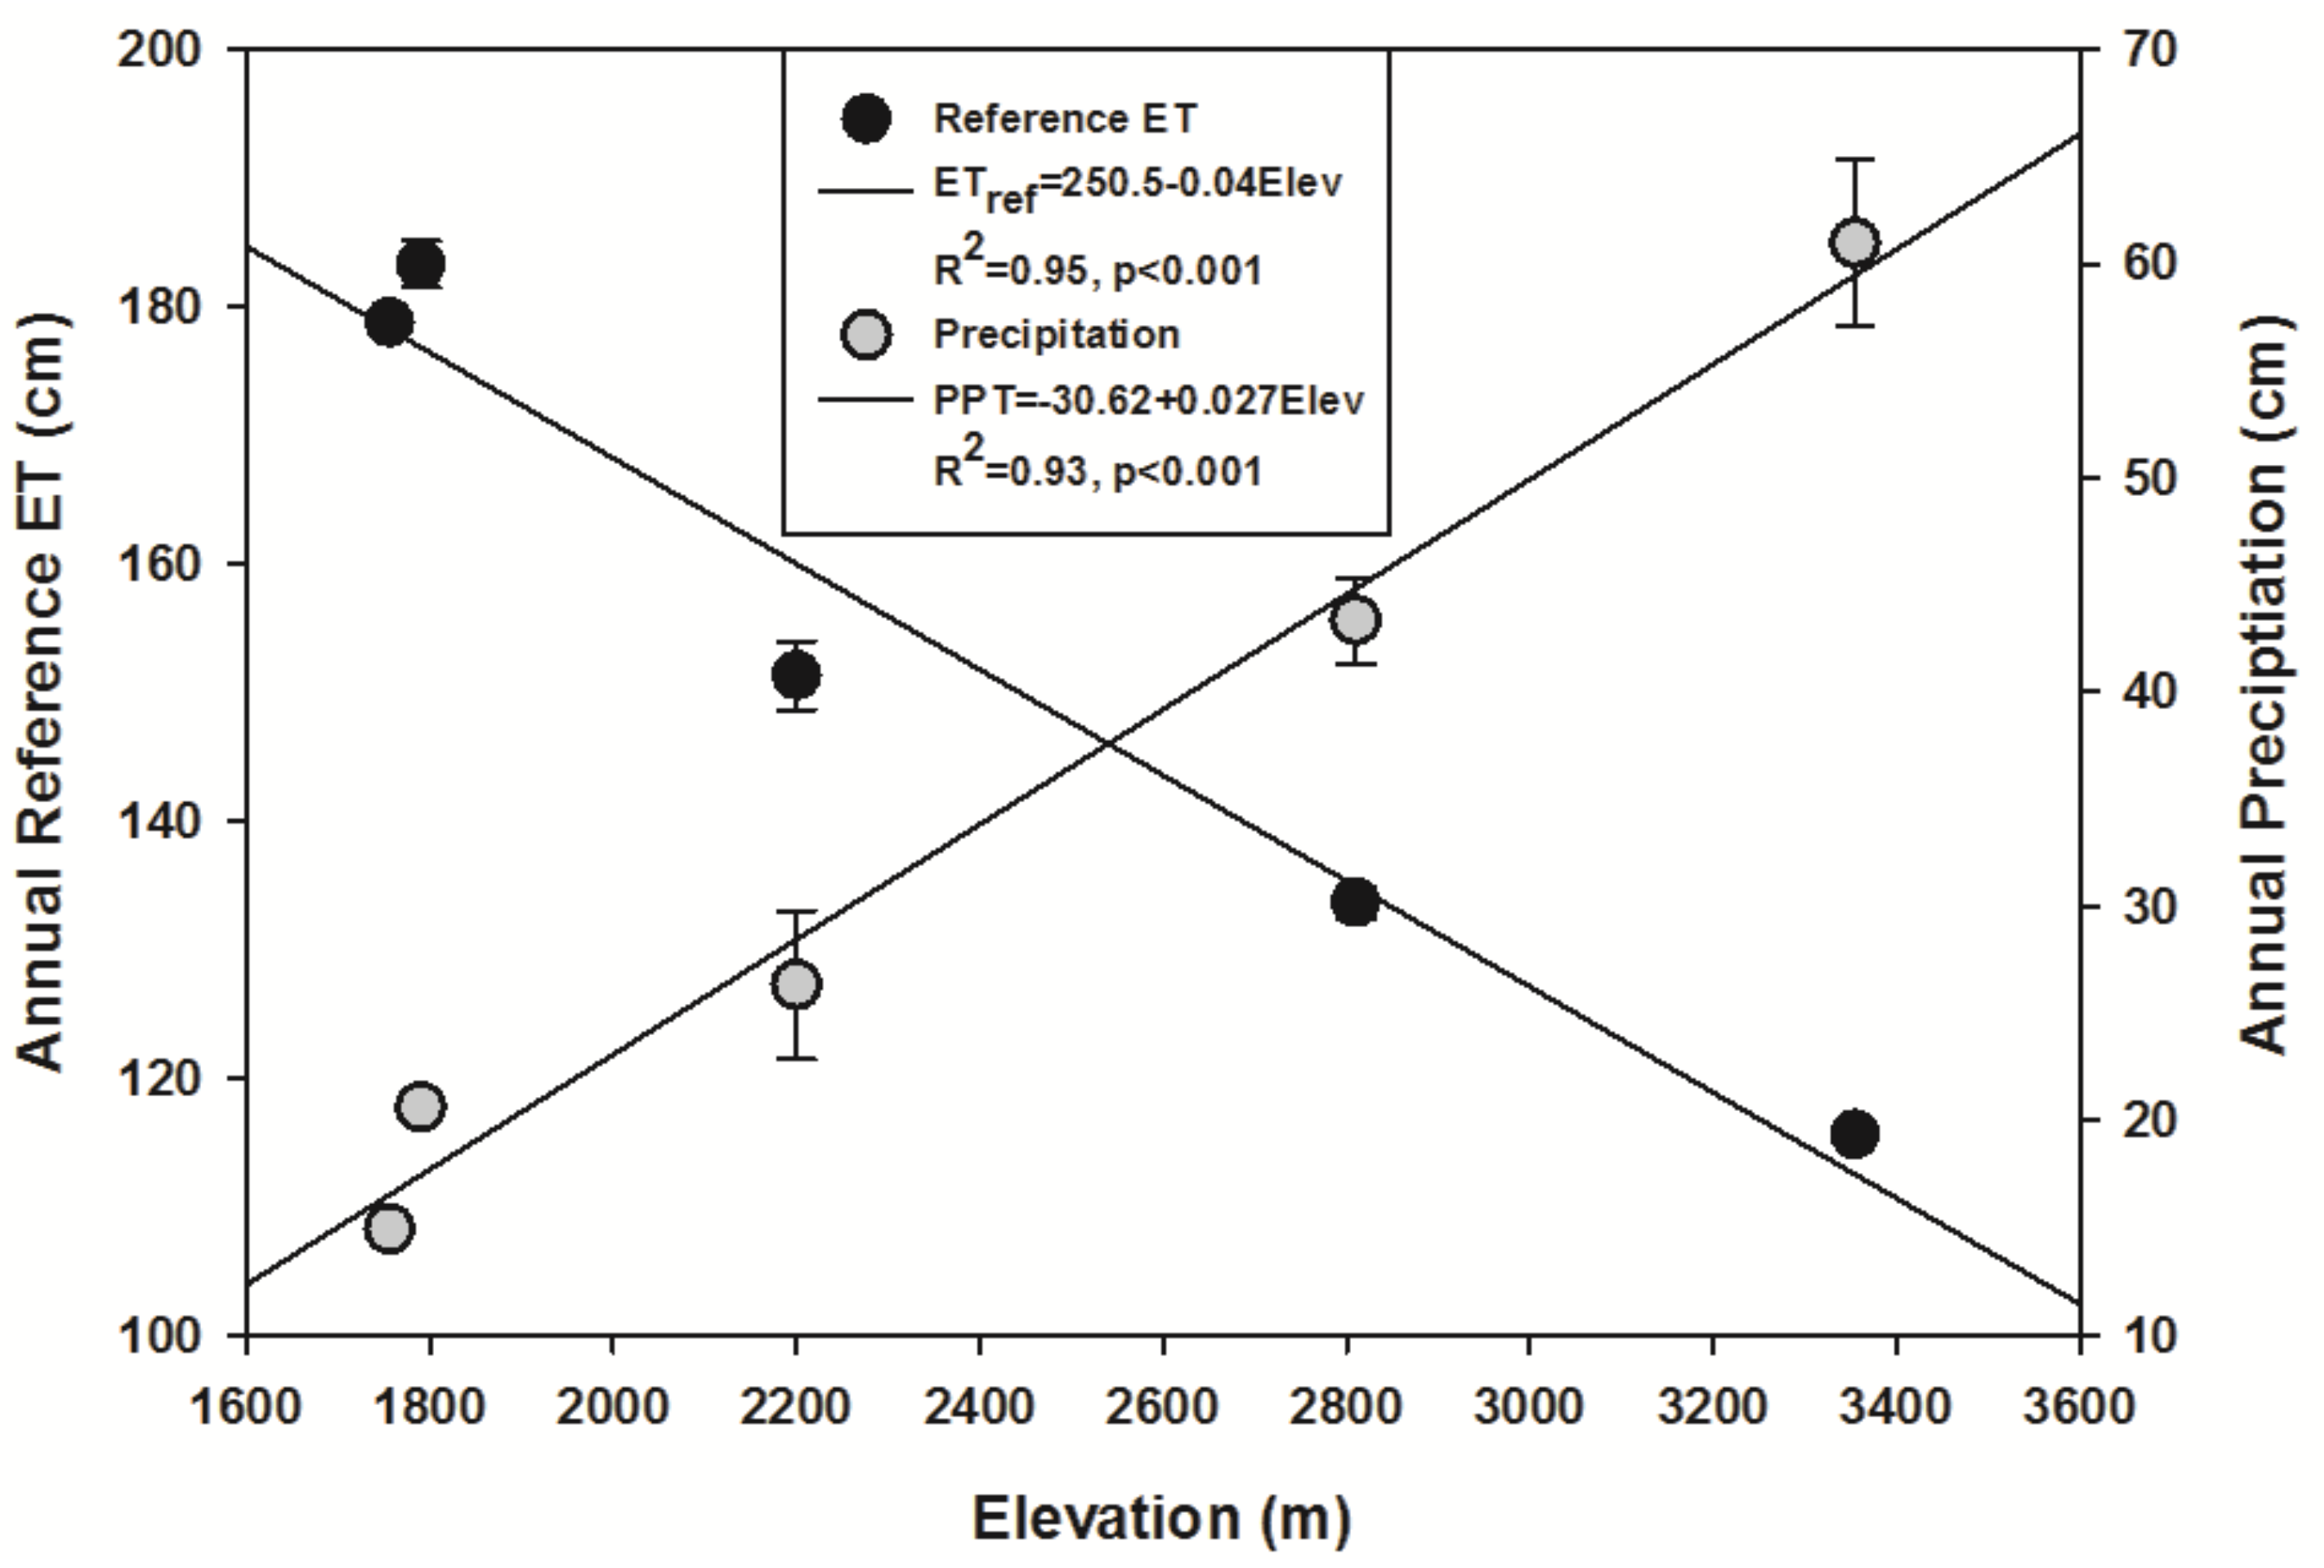
Table 1). Annual precipitation increased with elevation in a highly linear fashion (
Figure 2, R
2 = 0.93,
p < 0.001), with an average increase of 2.9 cm for every 100 m rise in elevation. The Salt Desert Shrub West community at the lowest elevation averaged 14.9 cm per year, whereas the Subalpine West site averaged 60.9 cm, representing a 76% reduction in precipitation when comparing the lowest to the highest elevation site. We were able to compare the long-term records for average annual rainfall for the Great Basin National Park (elevation 2088 m) during the period 1938–2010 with the 3-year average annual rainfall for the Pinyon Juniper West site (2200 m elevation). The National Park site averaged 33.9 ± 8.4 cm, which was not statistically different (
p > 0.05) from the 26.3 ± 6.0 cm for the Pinyon Juniper site. Annual snowfall totals are reported in
Table 2 for all 5 sites [
39]. Snowfall as a percentage of total precipitation varied from a low of 22.1 ± 11.6% at the Sagebrush site to a high of 71.3 ± 6.4% at the Subalpine site. Snowfall totals revealed a declining trend over the 2012–2014 period at all sites, with a significant increase in snowfall in 2015 compared to 2014 (41% higher at the Montane West site and 54% higher at the Subalpine West site).
Reference evapotranspiration (ET
ref, Kimberly-Penman) (
Figure 2) declined in a highly linear fashion with elevation (R
2 = 0.95,
p < 0.001), with an average 4.0 cm decline for every 100 m rise in elevation. The Salt Desert Shrub West community at the lowest elevation averaged 178.8 cm per year, whereas the Subalpine West site averaged 115.6 cm per year, representing a 35% reduction in ET
ref when comparing the high to the low elevation site. Subsequently ET
ref was found to be inversely related to precipitation over the 1600 m elevation gradient (PPT = 126.9−0.613 ET
ref, R
2 = 0.86,
p < 0.001).
3.2. Growing Period
The change in precipitation and environmental demand with elevation influenced growing conditions in all the plant communities. We assessed the growing period by calculating growing degree days (GDD) using a baseline temperature of 4.44 °C (40 °F). GDD4.44 was found to decrease linearly with increasing elevation (GDD4.44 = 4483−1.01 Elevation (m), R2 = 0.81, p < 0.001) and was positively correlated with ETref (GDD4.44 = −1207.6 + 21.5 ETref, R2 = 0.63, p < 0.001) setting up a complex stress gradient in which higher environmental demand and less precipitation was found at the lowest elevation while at the highest elevation precipitation was highest, but growth was limited by ambient and soil temperatures that restricted the growing period. The amount of precipitation that fell during the growing period, as defined by GDD4.44, differed significantly with elevation as approximately 80% of the precipitation occurred during the growing period at the Montane West site (~35 cm) compared to only 50% at the Subalpine West site (~30 cm).
3.3. Drainage
Precipitation that fell within each plant community and infiltrated into the soil, drained from the soil, contributed to soil water in storage or was lost by evapotranspiration. Drainage was measured with flux meters that assessed the amount of water draining from the surface root zone into the shallow underlying rock strata. Unfortunately, not all the soil columns were of the same length due to the shallow nature of the mountain soils at some locations (66 cm of soil above the drainage collection point at the Subalpine West site vs. 41 cm at the Montane West site), which complicated interpretation of some of the data. However, the flux meter data were still a strong reflection of water movement into the underlying rock strata contributing to potential recharge.
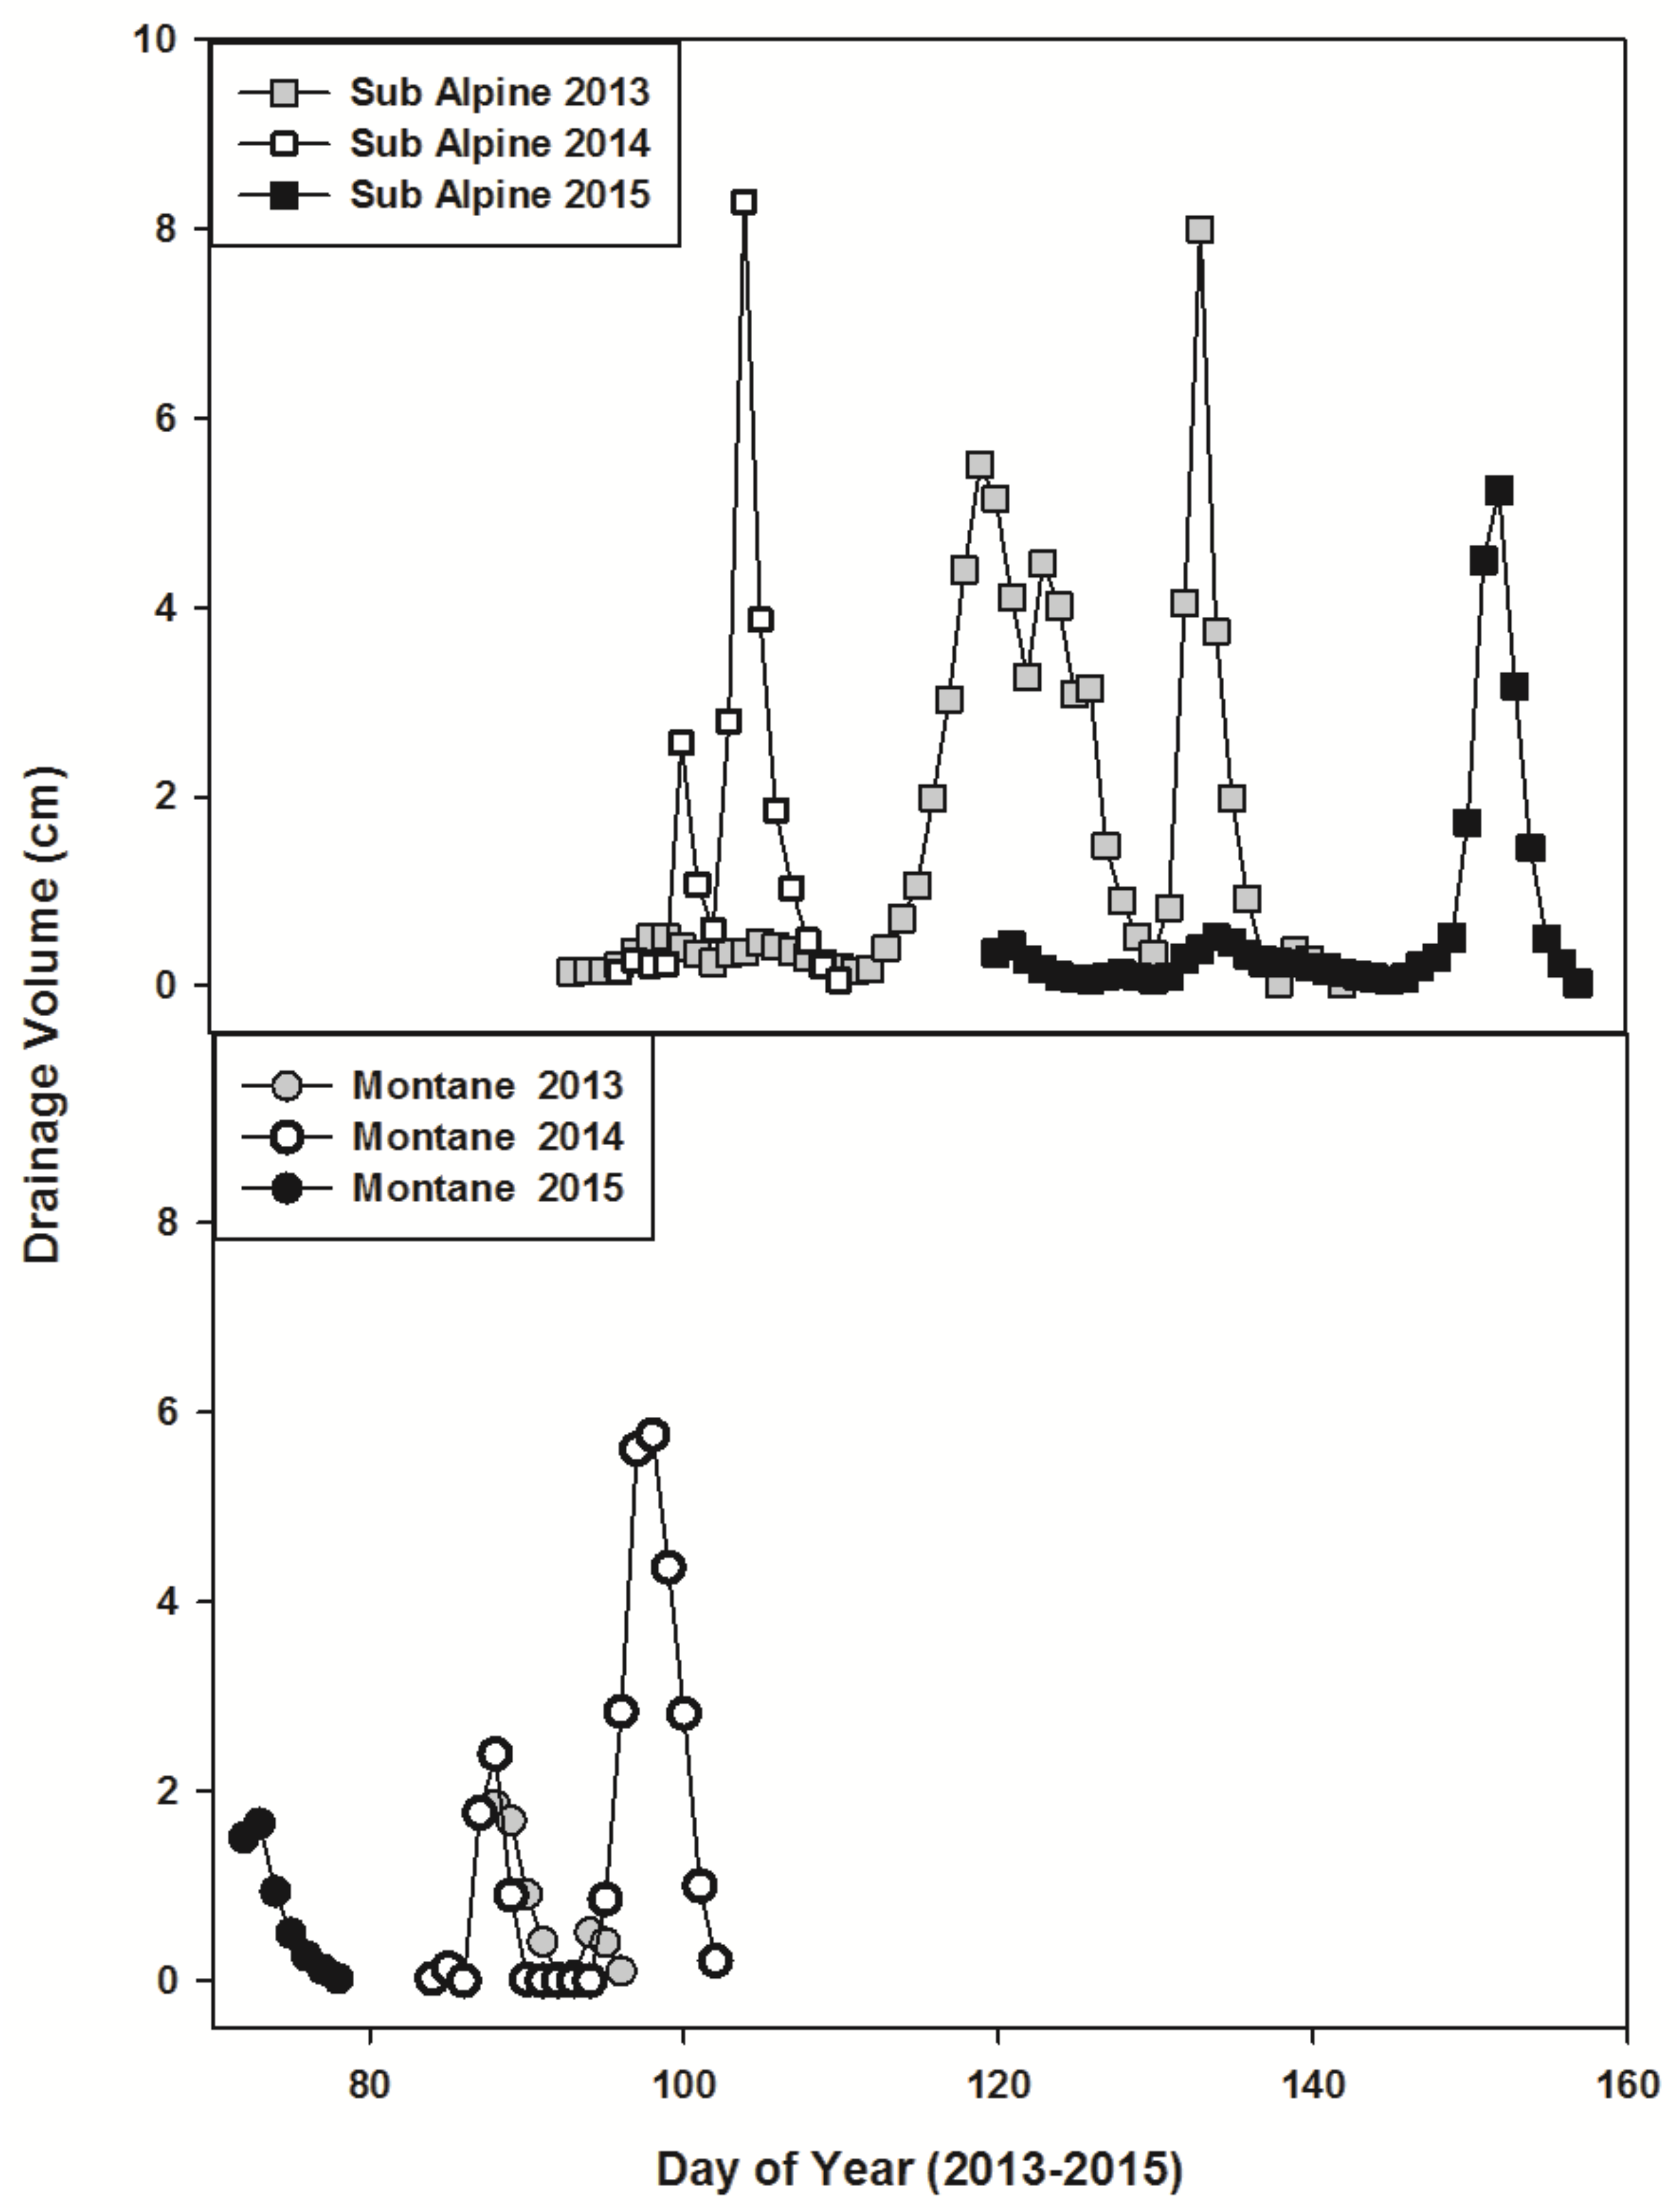
Drainage occurred at the Montane West and Subalpine West sites but not at the lower elevations. The timing and amount of drainage varied on a yearly basis, with drainage occurring at about the same time in 2013 at both the Montane West site (March) and the Subalpine West sites (April/May
Figure 3). In 2014 the flow occurred first at the Montane West site with some overlap with the Subalpine West site. However, in 2015 flow began and ended at the Montane West site before flow began at the subalpine site (>40 days). Part of this timing difference in 2015 was related to the approximate 7 cm decline in precipitation at the Montane West site in 2014 and 13 cm decline at the Subalpine West site. This timing difference was also related to the 25 cm difference in soil depth associated with the flux meters but more importantly the difference we believe was reflective of the arrival time of drainage to the rock strata. Although drainage occurred for a longer period at the Subalpine West site, all drainage events occurred during periods ranging from 7 to 50 days, occurred daily during the drainage period and were all completed by Julian day 160. The drainage periods that were longer in duration were typically associated with larger drainage volumes (Drainage Volume = −3.48 + 1.30 Days, R
2 = 0.78,
p = 0.002).
More favorable growing conditions influenced when and if drainage occurred, with no drainage occurring at the lower elevations. The growing period as assessed by the GDD4.44 was found to be negatively associated with the day peak drainage occurred (Peak Day = 218.1−0.084 GDD4.44, R2 = 0.94, p < 0.001) and to be negatively associated with the day drainage first occurred (Drain Start = 182.6−0.069 GDD4.44, R2 = 0.90, p < 0.001). GDD4.44 was also negatively related to drainage duration (Drain Duration = 62.20−0.189 Days GDD4.44, R2 = 0.79, p < 0.001) and total drainage volume (Total Drainage Volume = 72.17−0.22 Days GDD4.44, R2 = 0.59, p < 0.001).
Drainage was recorded on an hourly basis with peak drainage measured at 0.92 cm h−1 at the Subalpine West site and 1.03 cm h−1 at the Montane West site in 2014. These maximum values represented only 3.9% of the saturated soil hydraulic conductivity measured with intact cores taken at the sites (2.64 ± 1.48 cm h−1 Sagebrush, 5.69 ± 1.18 cm h−1 Pinyon Juniper West, 26.34 ± 5.64 cm hr-1 Montane West and 23.69 ± 6.75 cm hr−1 Subalpine West), indicating that even immediately after snowmelt, flow never approached saturated flow conditions. We did not assess interflow; however, slopes were all less than 12%, average saturated hydraulic conductivities in the surface horizon at the two higher elevations were greater than 23 cm h−1, no compacted restrictive layers were observed with depth except at the lower Sagebrush site and no flow was observed in down gradient washes in close proximity to the flux meters. Instead what we observed was that 80 percent of the variation in the drainage at the two highest elevations could be described by the total annual precipitation and the average December-March soil temperature at 10 cm, with higher drainage associated with higher precipitation and warmer soil temperatures (Drainage = −95.43 + 2.81 (Precipitation) + 63.3 (Soil Temp), R2 = 0.82 p < 0.05). At the Subalpine West site, a very high drainage volume was measured in 2013 (~70 cm), associated with a 27–34-day earlier occurrence of drainage with mean soil temperatures at 10 cm in March equaling 0 °C, whereas average monthly soil temperatures ≥0 °C did not occur until May in 2014 and April in 2015.
3.4. Soil Water in Storage
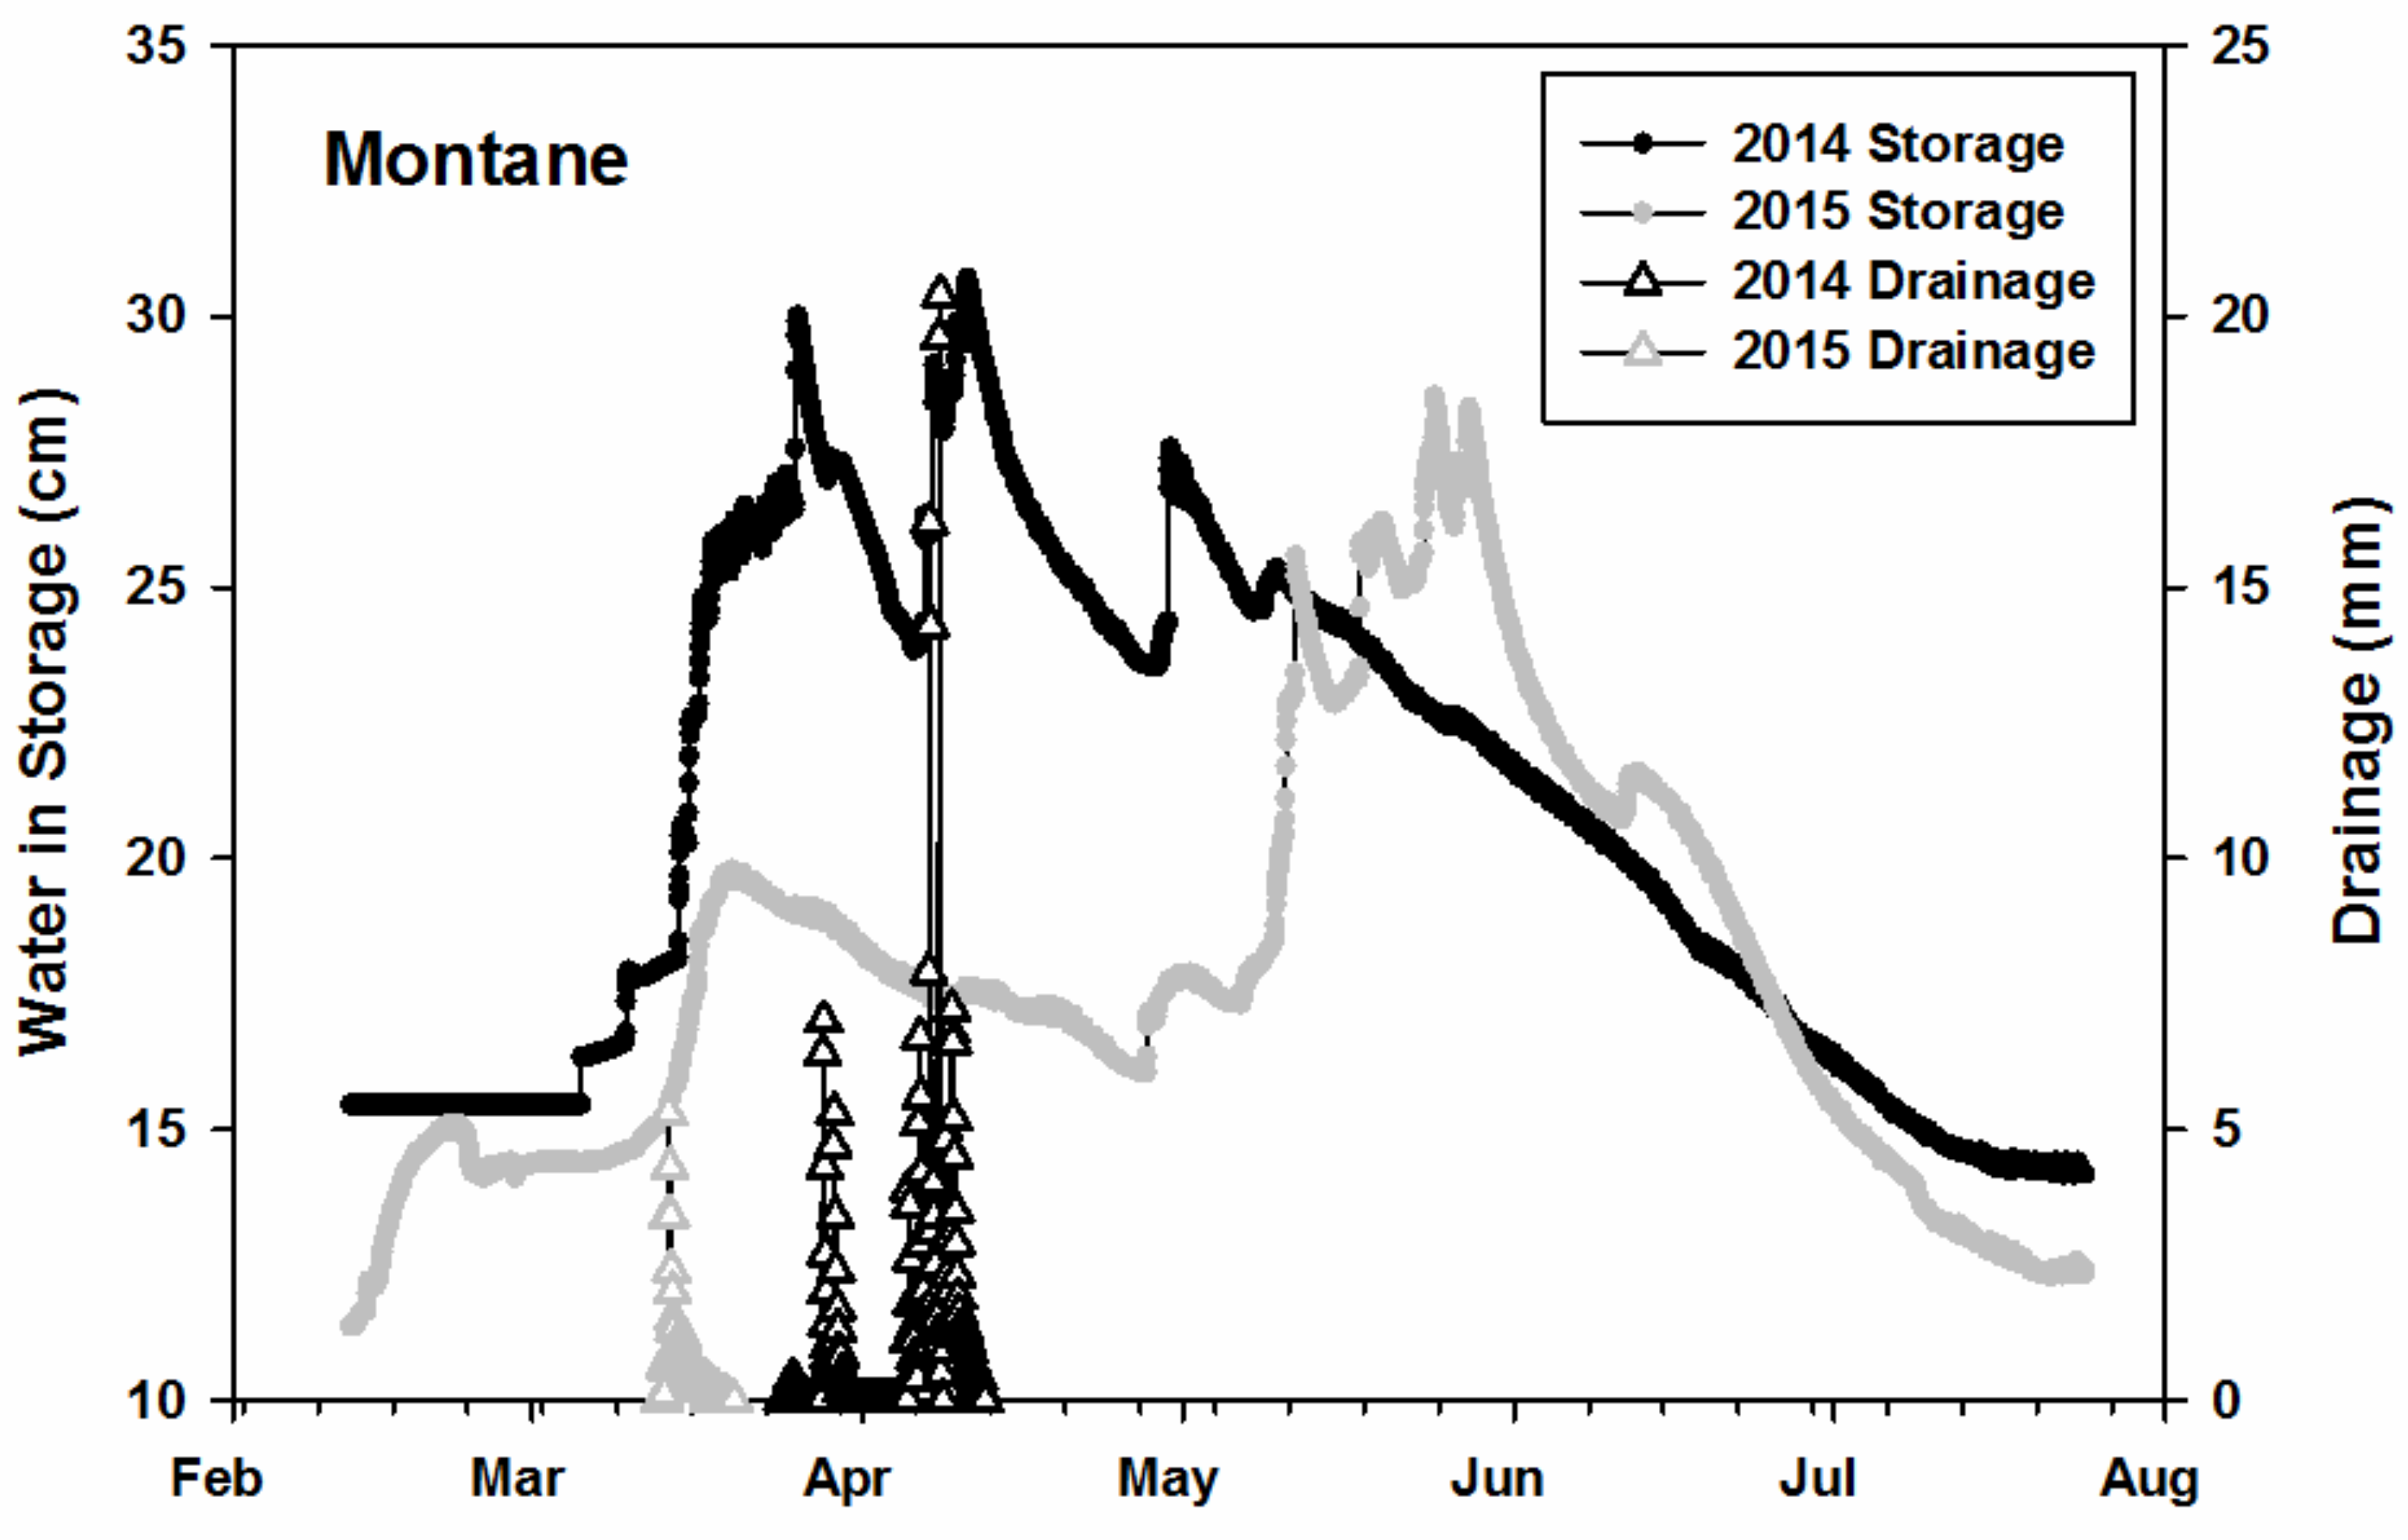
Soil water in storage increased in response to winter precipitation and decreased in response to plant water extraction during the warmer summer months. We report soil water in storage only for the Montane West site because it was the only site in which we were able to successfully measure volumetric soil water content on a continuous basis over a 2 year period within the upper 100 cm depth of soil and it was the only site in which we had an extended data set demonstrating the association between soil water in storage and actual drainage. In
Figure 4 water in storage is plotted over time for both 2014 and 2015 along with drainage volumes measured with the flux meter. In 2014 soil water in storage values rose during March and peaked twice above 25 cm. This dual peak in storage was associated with a dual peak in drainage which was continuous over a 19-day period. Interestingly, in 2015, storage rise in March was also associated with drainage even though the same storage amount as occurred in 2014 was never reached. This lower storage value was associated with a greater than five-fold decrease in drainage volume. Although storage values did reach 25 cm in 2015, they occurred during late spring in the active growing period and were associated with rainfall events in May exceeding 14 cm. The spring rain events did not contribute to any drainage, as volumetric soil water contents at the 50 cm depth peaked at 0.28 in late May, but quickly fell to 0.08 within 7 weeks, while at the 100 cm depth the volumetric soil water contents remained virtually unchanged (0.108 ± 0.007) over the entire 2015 growing period.
3.5. Drainage as Related to Mine Water Flow and Groundwater Levels
Drainage from shallow mountain soils (as assessed with flux meters) represents the first stage toward potential recharge of valley groundwater systems. Evaluating the relationship between site specific drainage estimates with mountain block recharge (as inferred from mine water flow) and groundwater response is critical to achieving a better understanding of how water is partitioned in mountain valley systems.
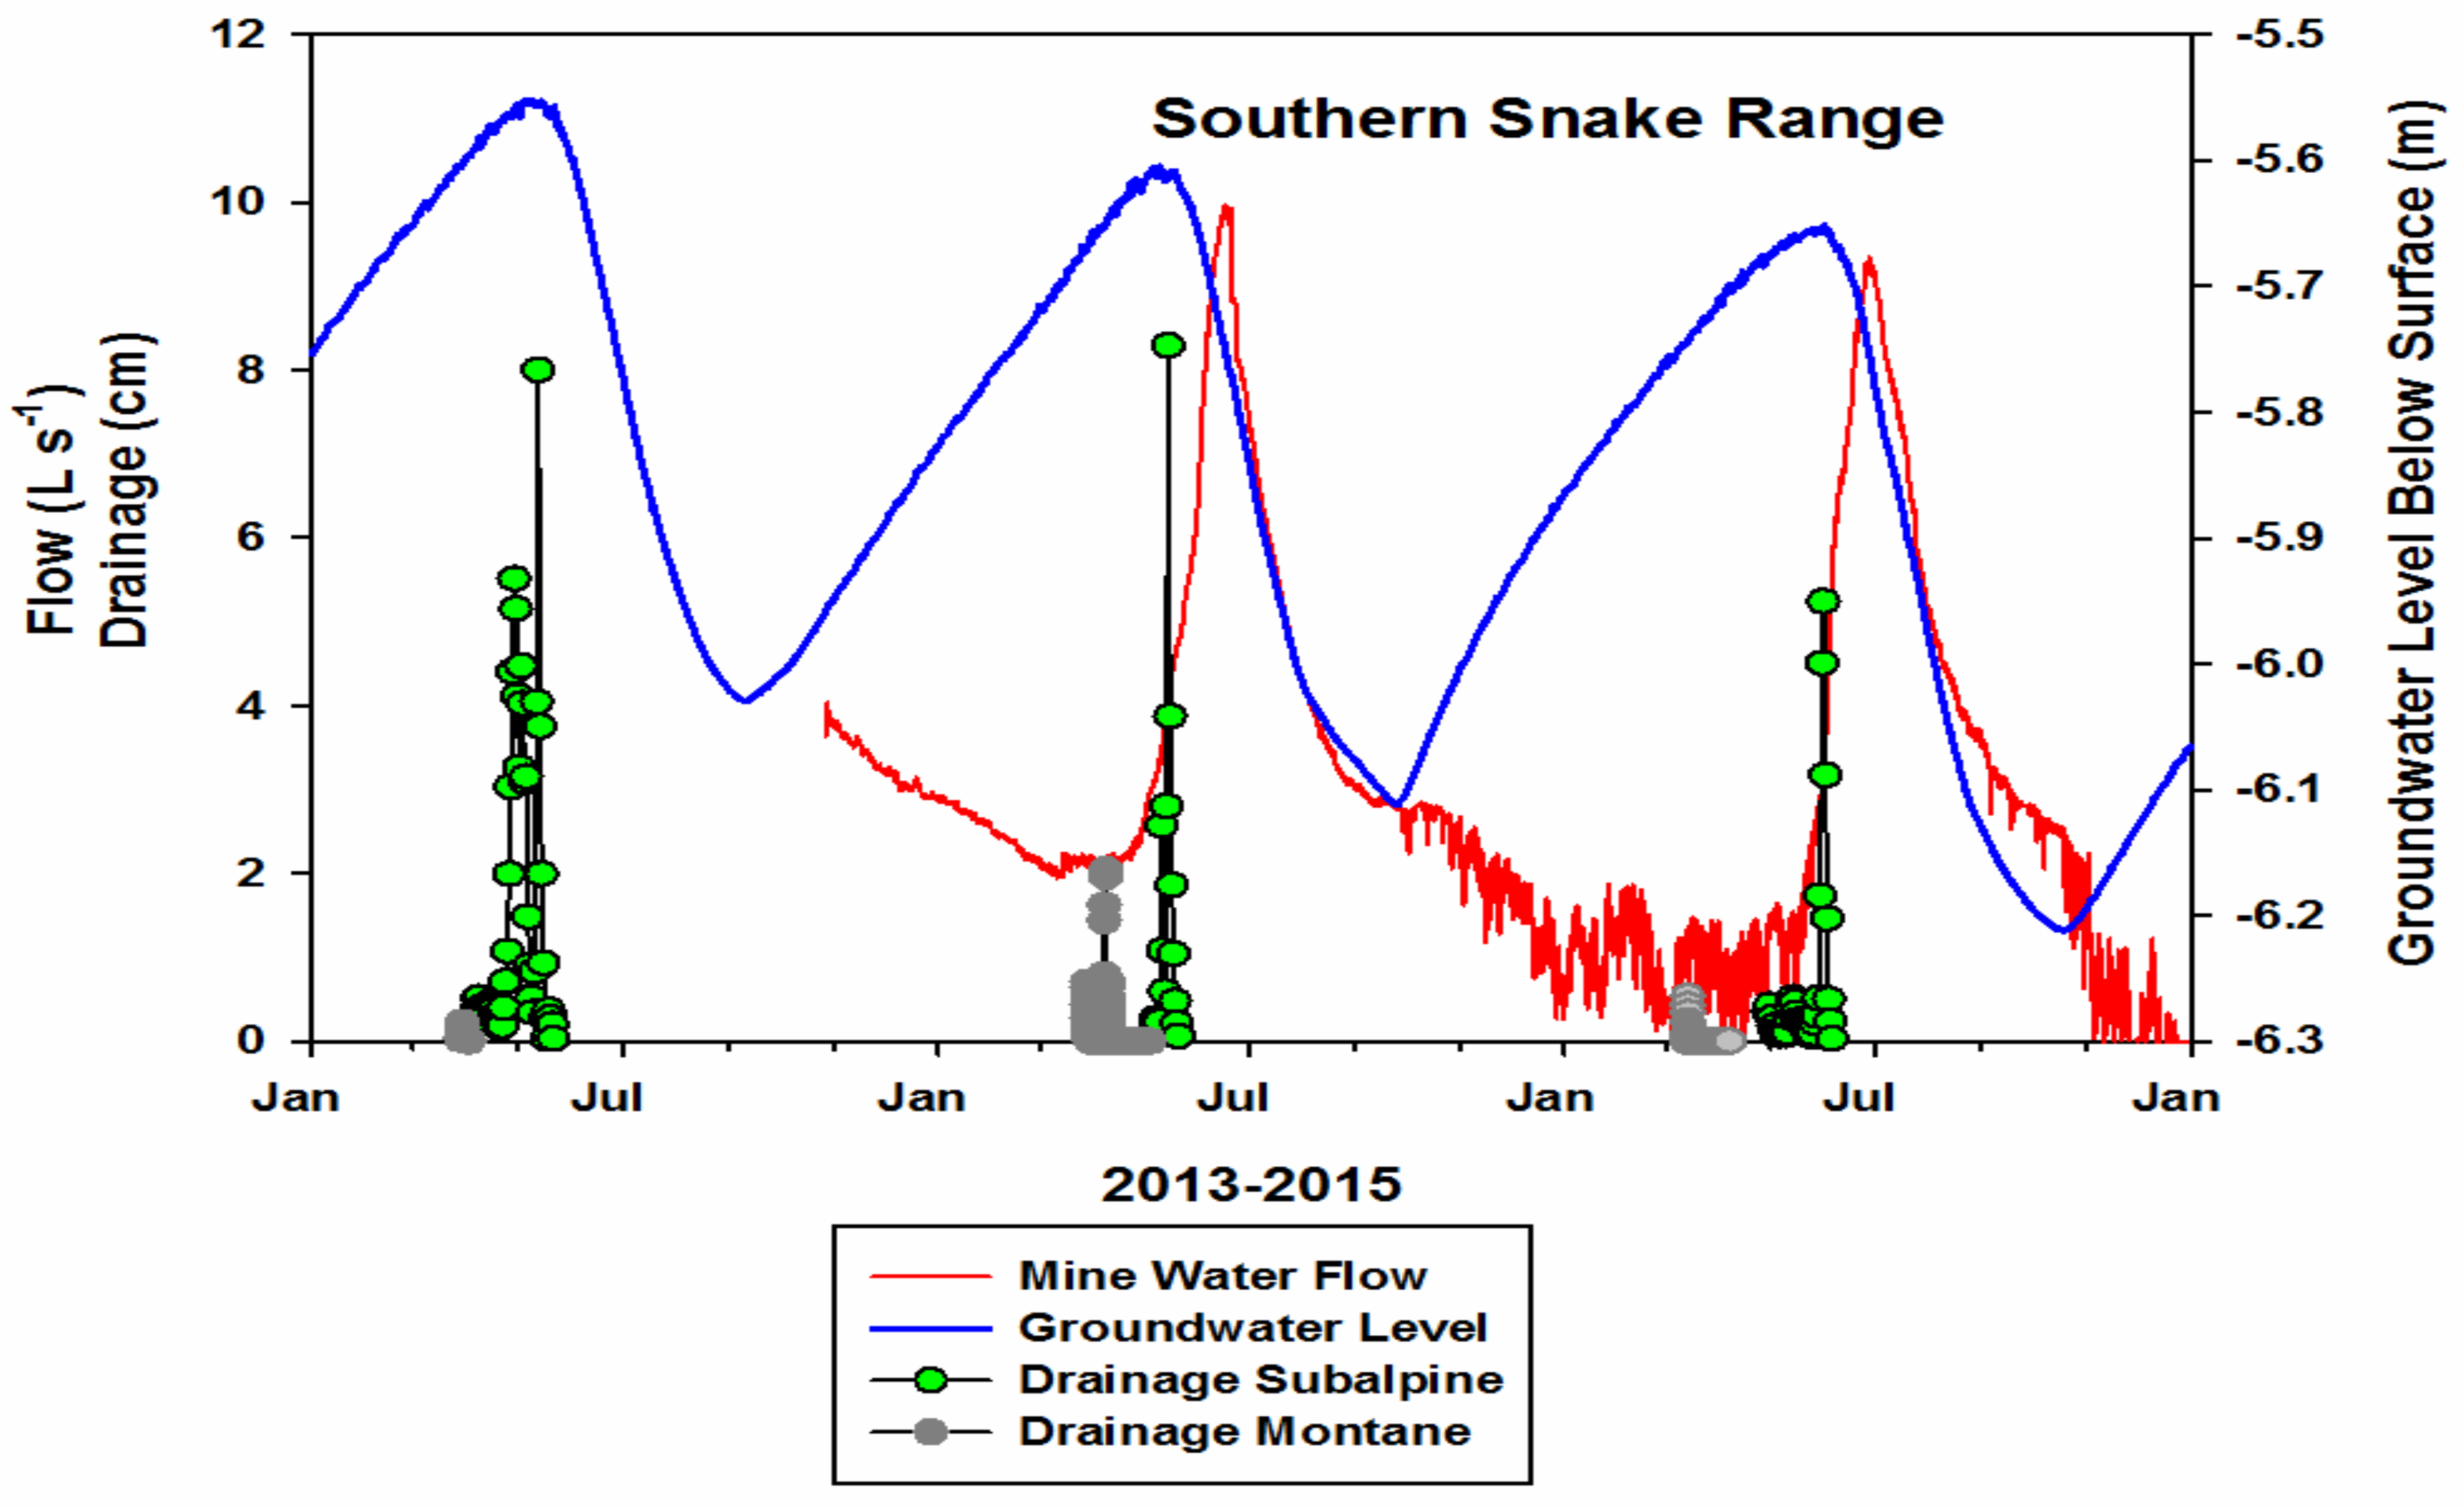
Drainage from the flux meter at the Montane West site was found to occur at the same time mine flow stabilized in 2014 but it occurred just prior to increased water flow from the mine in 2015 (
Figure 5), whereas at the Subalpine West site drainage began after flow in the mine increased in 2014, but at about the same time mine flow increased in 2015. A greater than 40-day separation between the end of the Montane West drainage and the beginning of the Subalpine West drainage occurred in 2015, associated with a 13 cm decline in precipitation at the Subalpine site in 2014, and mine flow that approached zero during the winter of 2014/2015. The mine adit was located 397 m in elevation below the Montane West site and 942 m below the Subalpine West site. Mine water flow during the two-year period was found to peak after groundwater levels at the Salt Desert Shrub during the two-year period was found to peak after groundwater levels at the Salt Desert Shrub West site peaked in June of each year. Mine flow temperatures deviated from a baseline temperature of 6.5 °C (data not reported) during the peak flow period, with significant deviation events (>0.5 °C cooler, 13 events in 2014 and 15 events in 2015) suggesting that colder water from snowmelt was occurring in a non-uniform pulse fashion. The minima or “turning point” in the sinusoidal groundwater data occurred prior to the turning point associated with the mine flow.
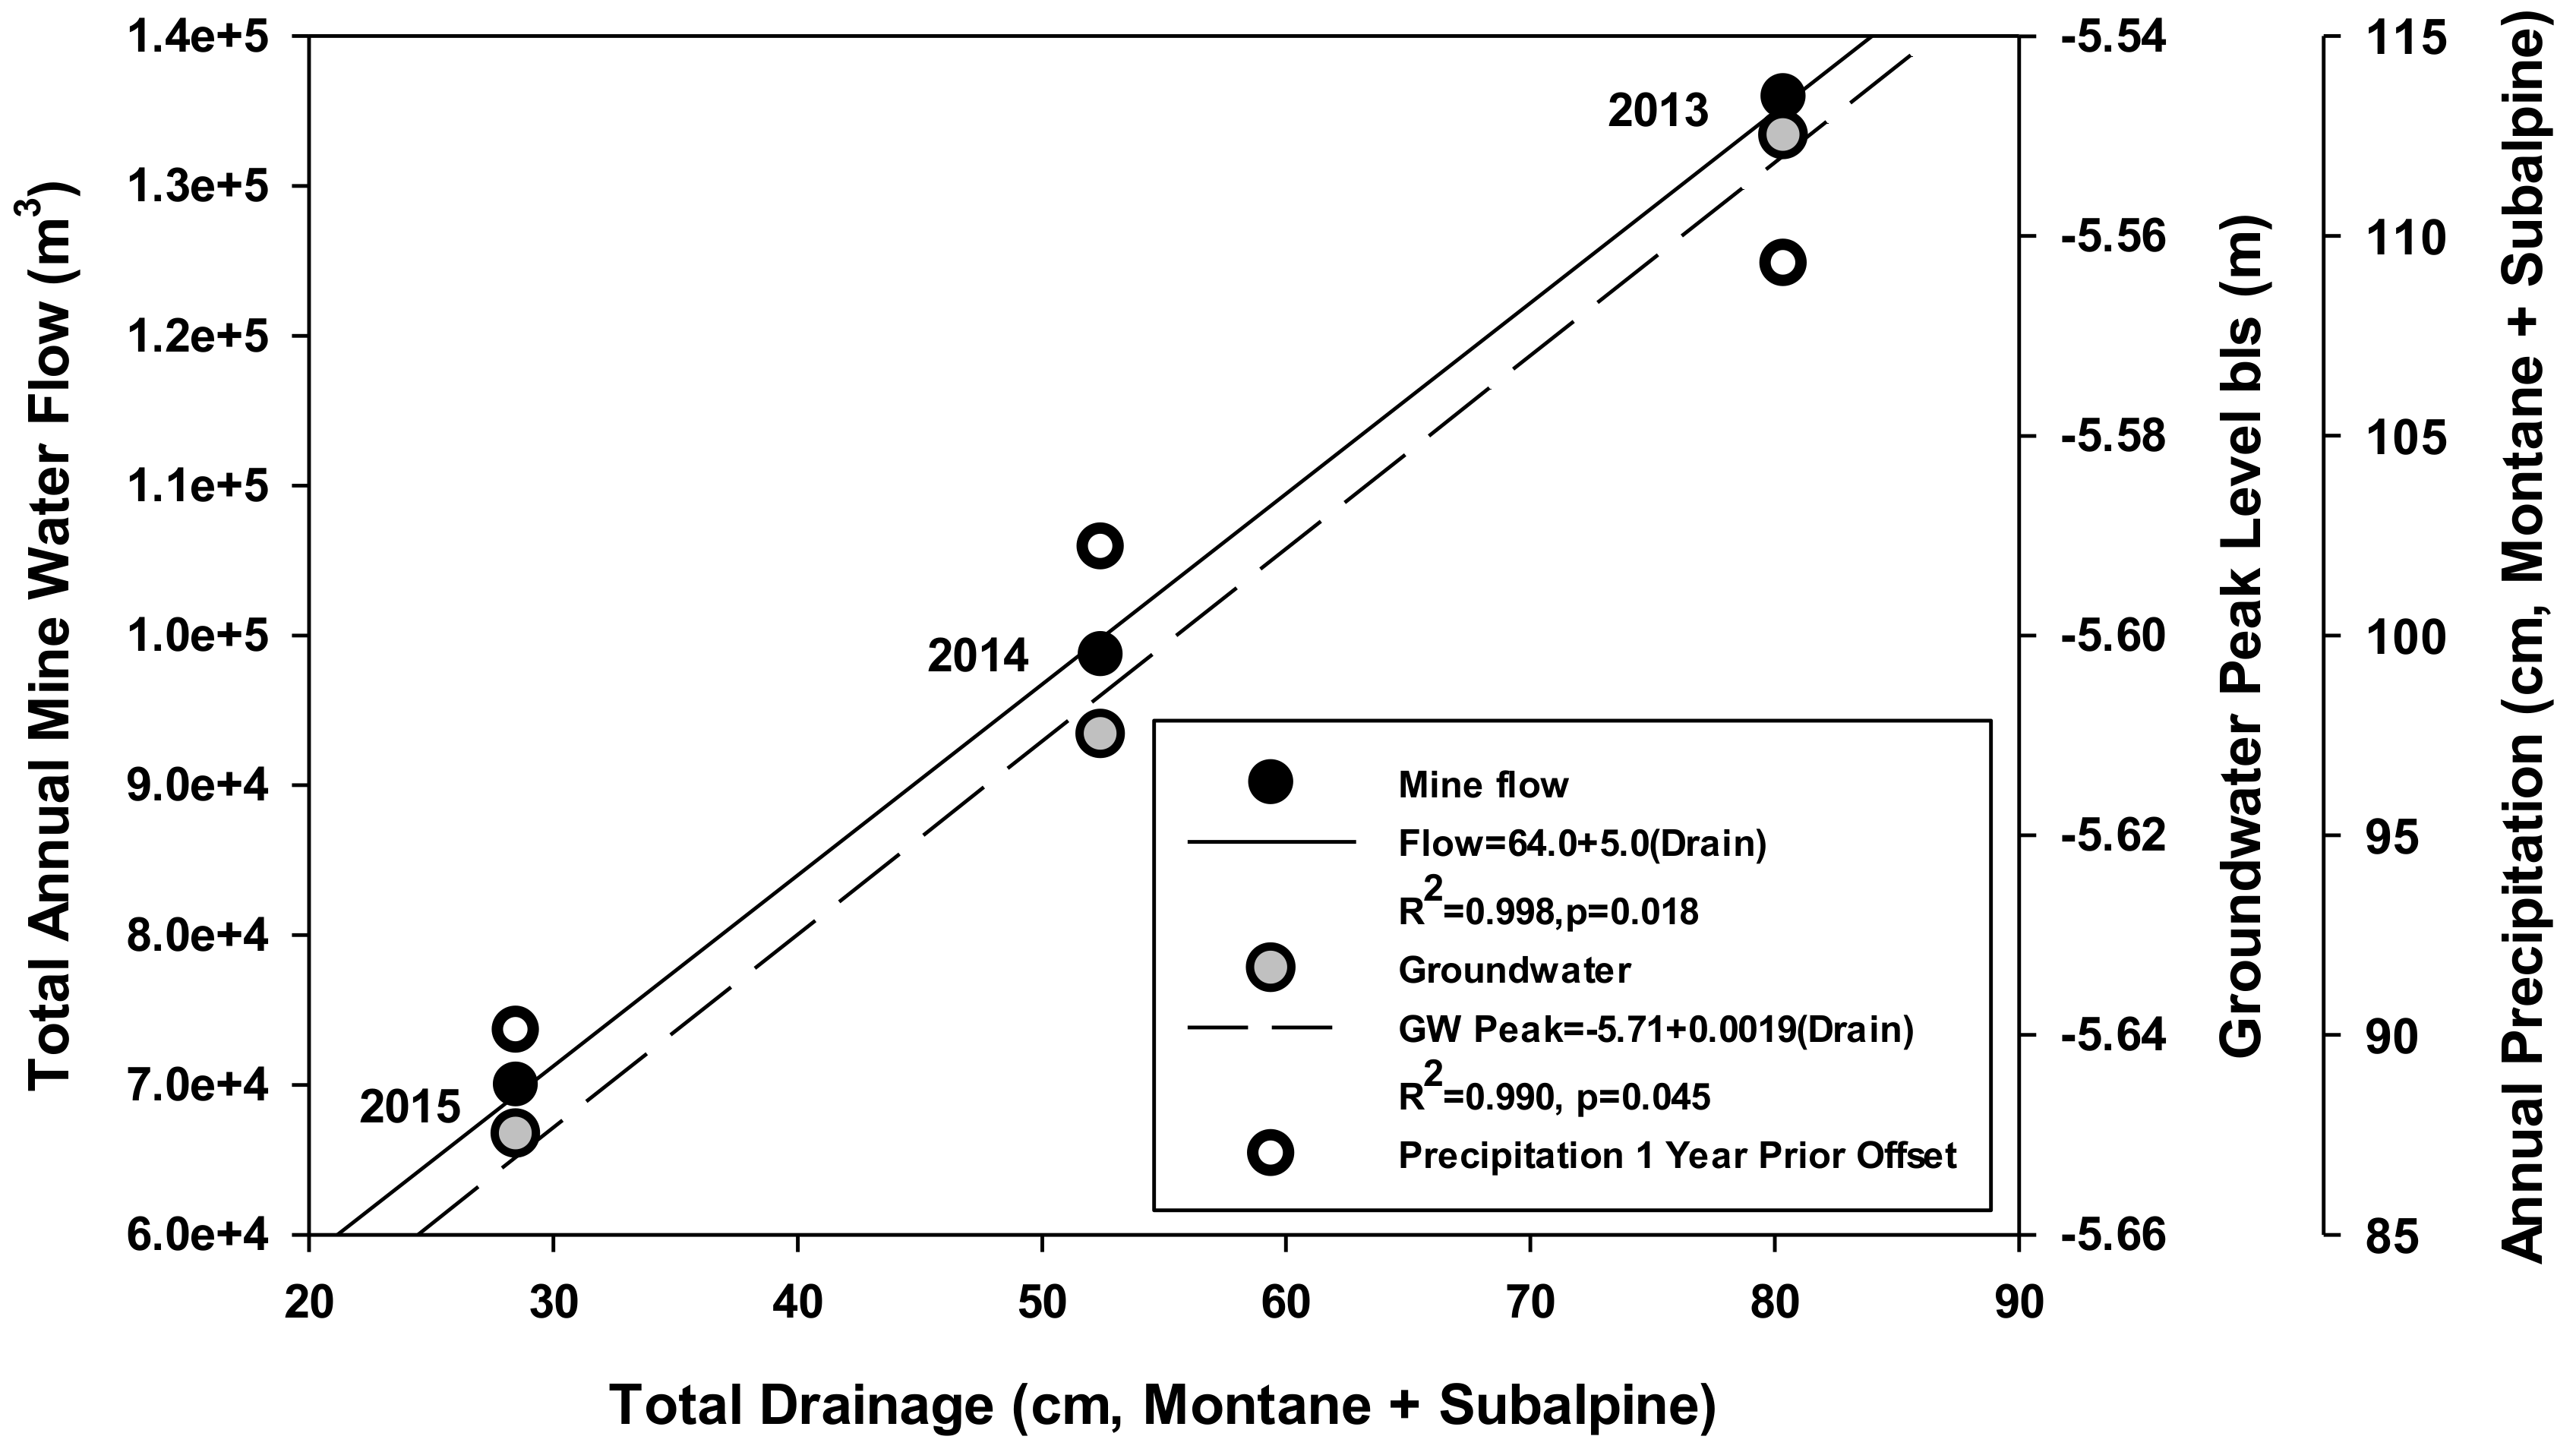
Groundwater levels peaked in June and were at their low in October, reflecting recharge, redistribution, and discharge. Active pumping of groundwater occurred in the valley to support alfalfa during the spring and summer period, which was also the active period for groundwater extraction by phreatophytes. A fundamental relationship existed between annual mine water flow discharge, groundwater peak levels and total drainage from the flux meters (Subalpine West plus Montane West) over the 2013–2015 period (
Figure 6), suggesting that both mine water flow and peak groundwater levels could possibly be used as a means to estimate drainage within the upper montane and subalpine regions (site specific relationship). This relationship was also shown to be influenced by precipitation at the higher elevation sites if a one-year offset was considered (mine flow and ground water levels). However we recognize that complex geologic formations exist in the Snake Mountain Range which control when and if recharge occurs in Spring Valley and that relationships with groundwater levels may have been entirely coincidental, as groundwater levels could have reflected a different geologic formation that was poorly connected to our higher elevation sites and that such relationships between mountain drainage and groundwater levels over a 1600 m change in elevation would be expected to have an offset in the response time.
The precipitation (P) that was partitioned to drainage (D) was quantified as a leaching fraction (LF = D/P). The LF at the three lower sites based on D/P were zero but increased significantly at the Montane West site (0.27, based on the sum of years 1, 2 and 3) and Subalpine West site (0.66 based on the sum of years 1, 2 and 3 vs. 0.40 if year 1 drainage not included, which was greater than 70 cm).
3.6. Snow-Melt as Inferred from Soil Temperatures and Volumetric Soil Water Contents
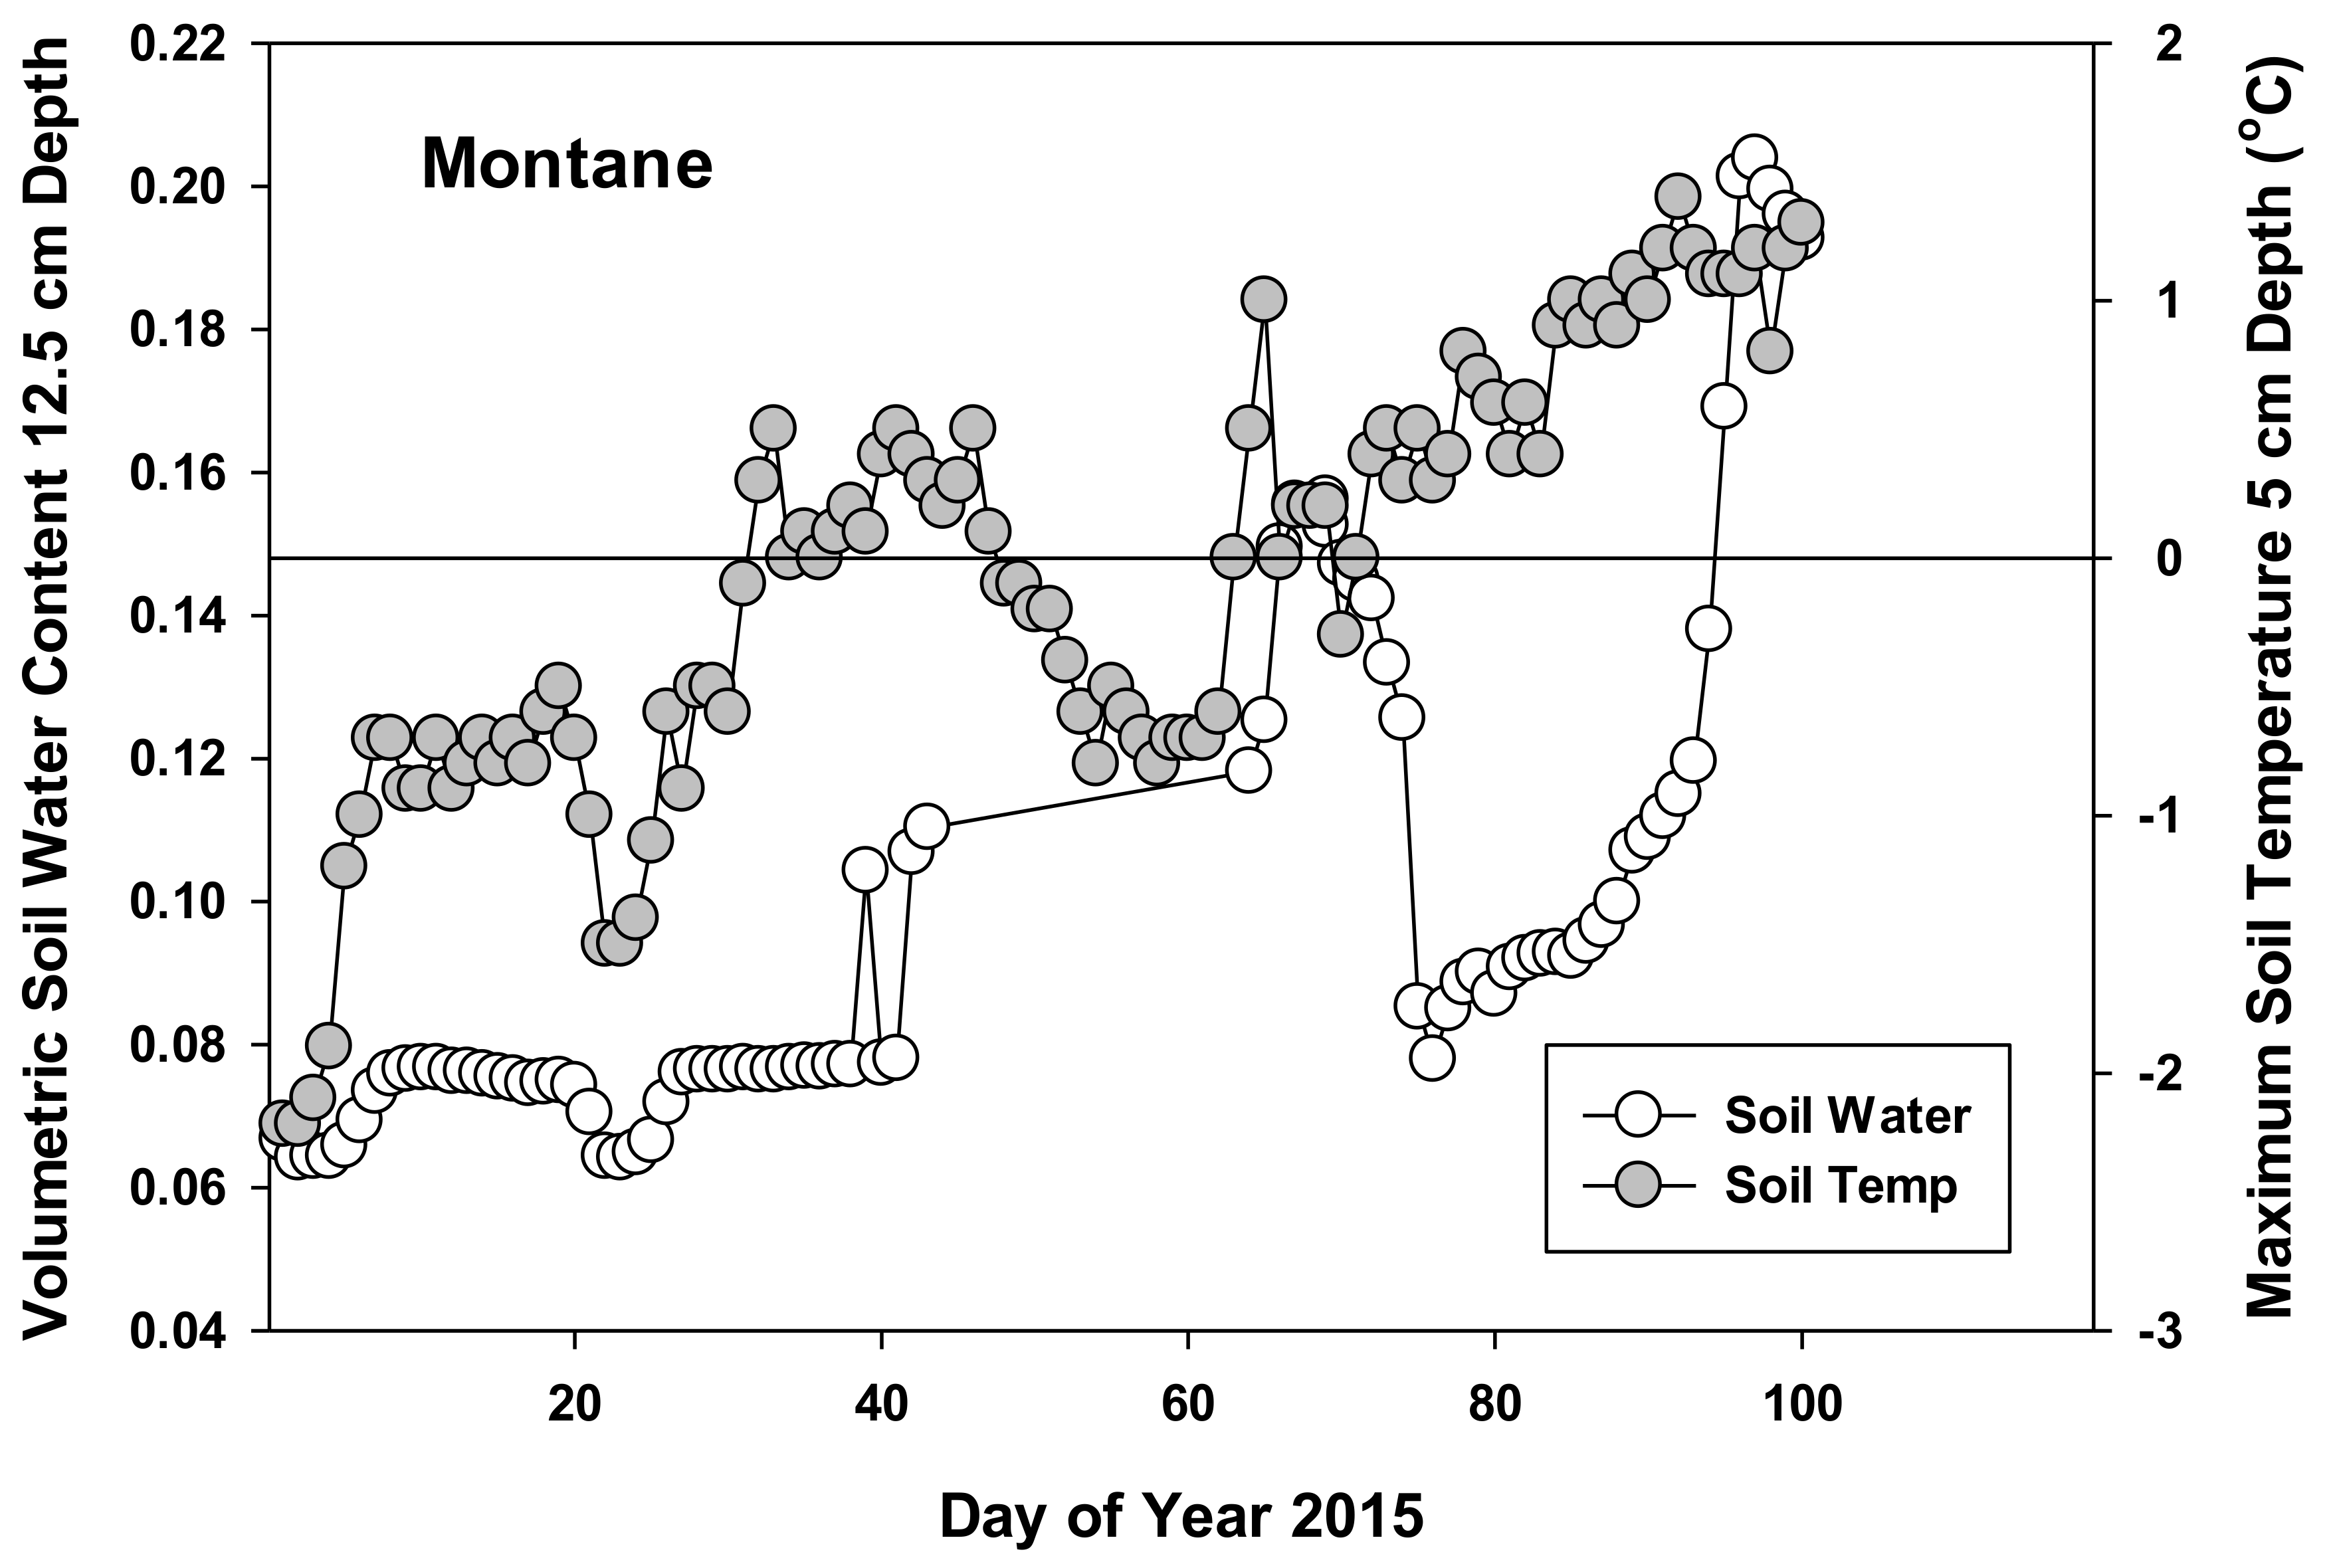
Drainage from the flux meters occurred after snowmelt began at the higher elevation sites. To assess when snow-melt occurred we looked closely at temperature soil moisture relationships. Soil temperature at the 5 cm depth was assessed to determine when maximum temperatures were above freezing and how soil temperature was associated with sequential events, such as soil volumetric water contents rising in the near surface soil layer. At the Subalpine site, soil temperature at 5 cm > 0 °C did not occur until approximately Julian day 55, whereas at the lowest elevation this occurred approximately 40 days earlier (Day = −35.2 + 0.027 Elevation, R
2 = 0.70,
p < 0.001). In
Figure 7 we show the relationship between soil temperatures at 5 cm with volumetric soil water content at 12.5 cm over the 2015 time period at the Montane West site. Only after temperatures increased and remained above the freezing point did soil water contents increase significantly. This water content sensor response to freezing conditions reflected freeze thaw dynamics [
40] where lower soil volumetric water contents would be sensed because of a higher fraction of the soil water in the solid phase. However, once temperatures were consistently maintained above freezing (Day 71), the higher soil water contents reflected the occurrence of melt (0.127 rise in volumetric water content over a 31-day period).
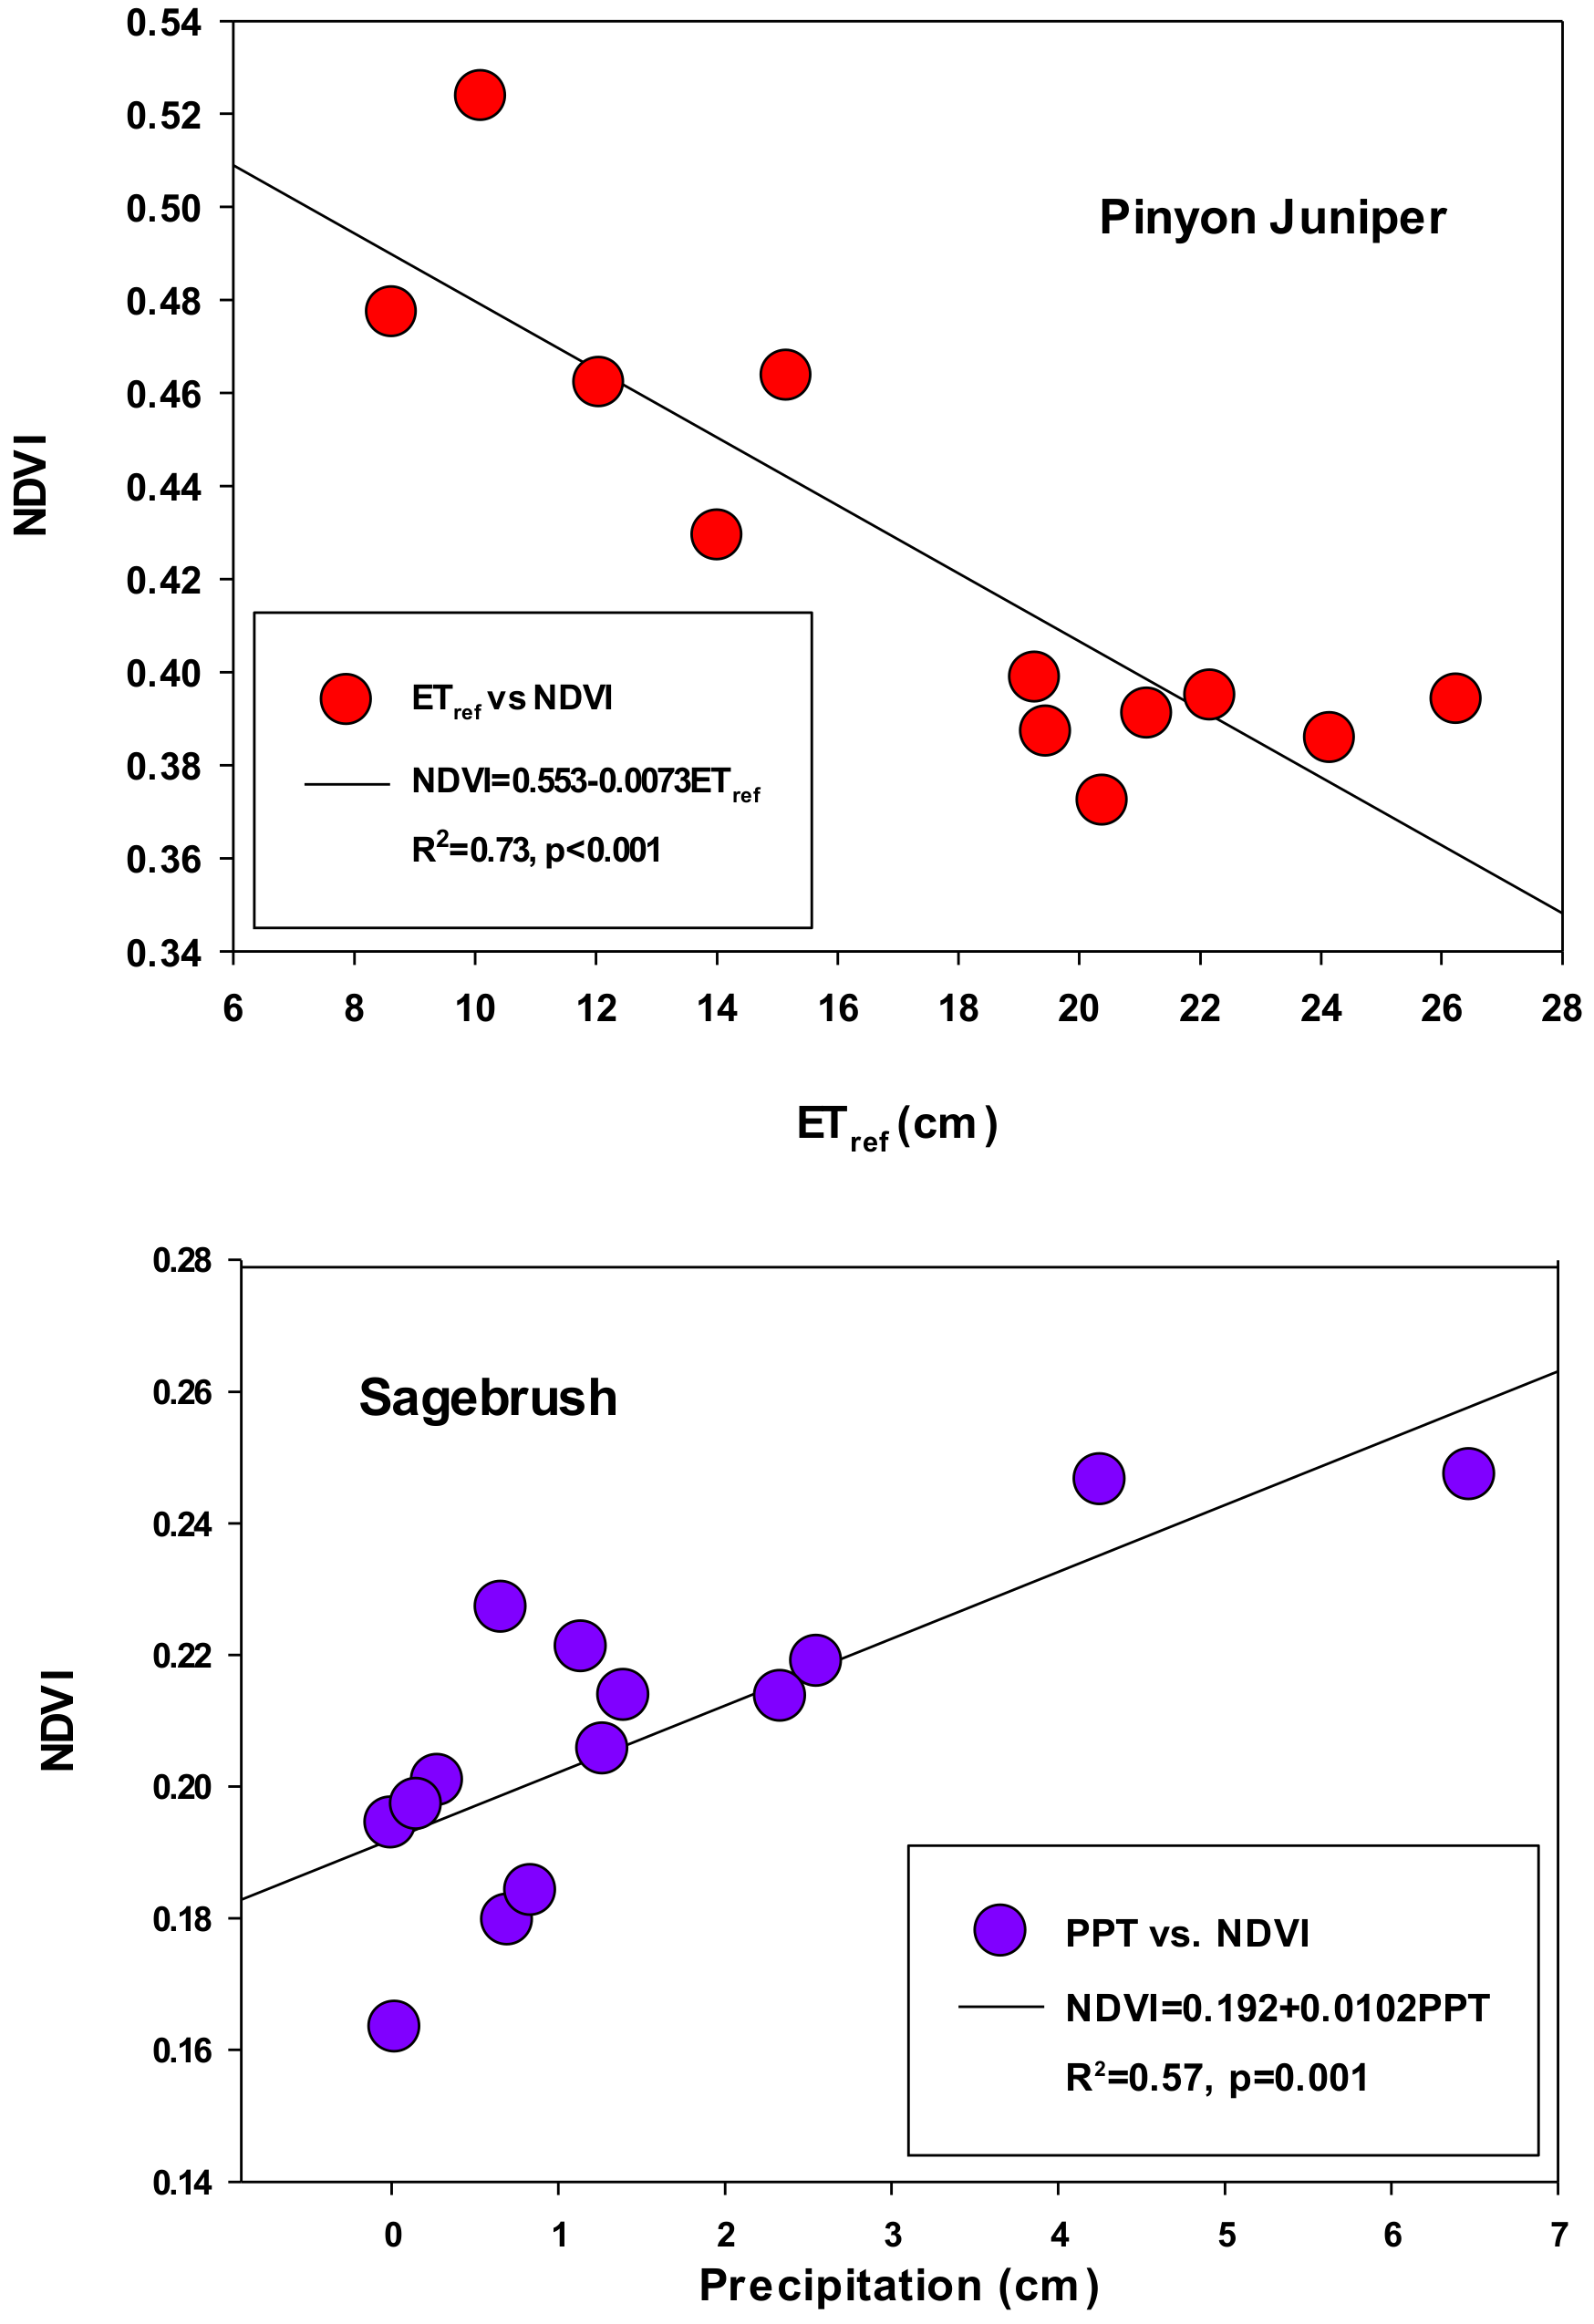
3.7. NDVI
Assessing plant response to changing environmental conditions in a remote mountain valley system was made possible by accessing satellite derived spectral data. We monitored NDVI using Landsat 8 satellite data at all the sites to assess health and greenness at the canopy level. During the 2013–2015 time period we obtained at least 12 values at each site. When all the sites were merged, % vegetation cover and ET
ref accounted for 84% of the variation of the average yearly NDVI (NDVI = 0.494 + 0.0062% cover − 0.0031 ET
ref, R
2 = 0.84,
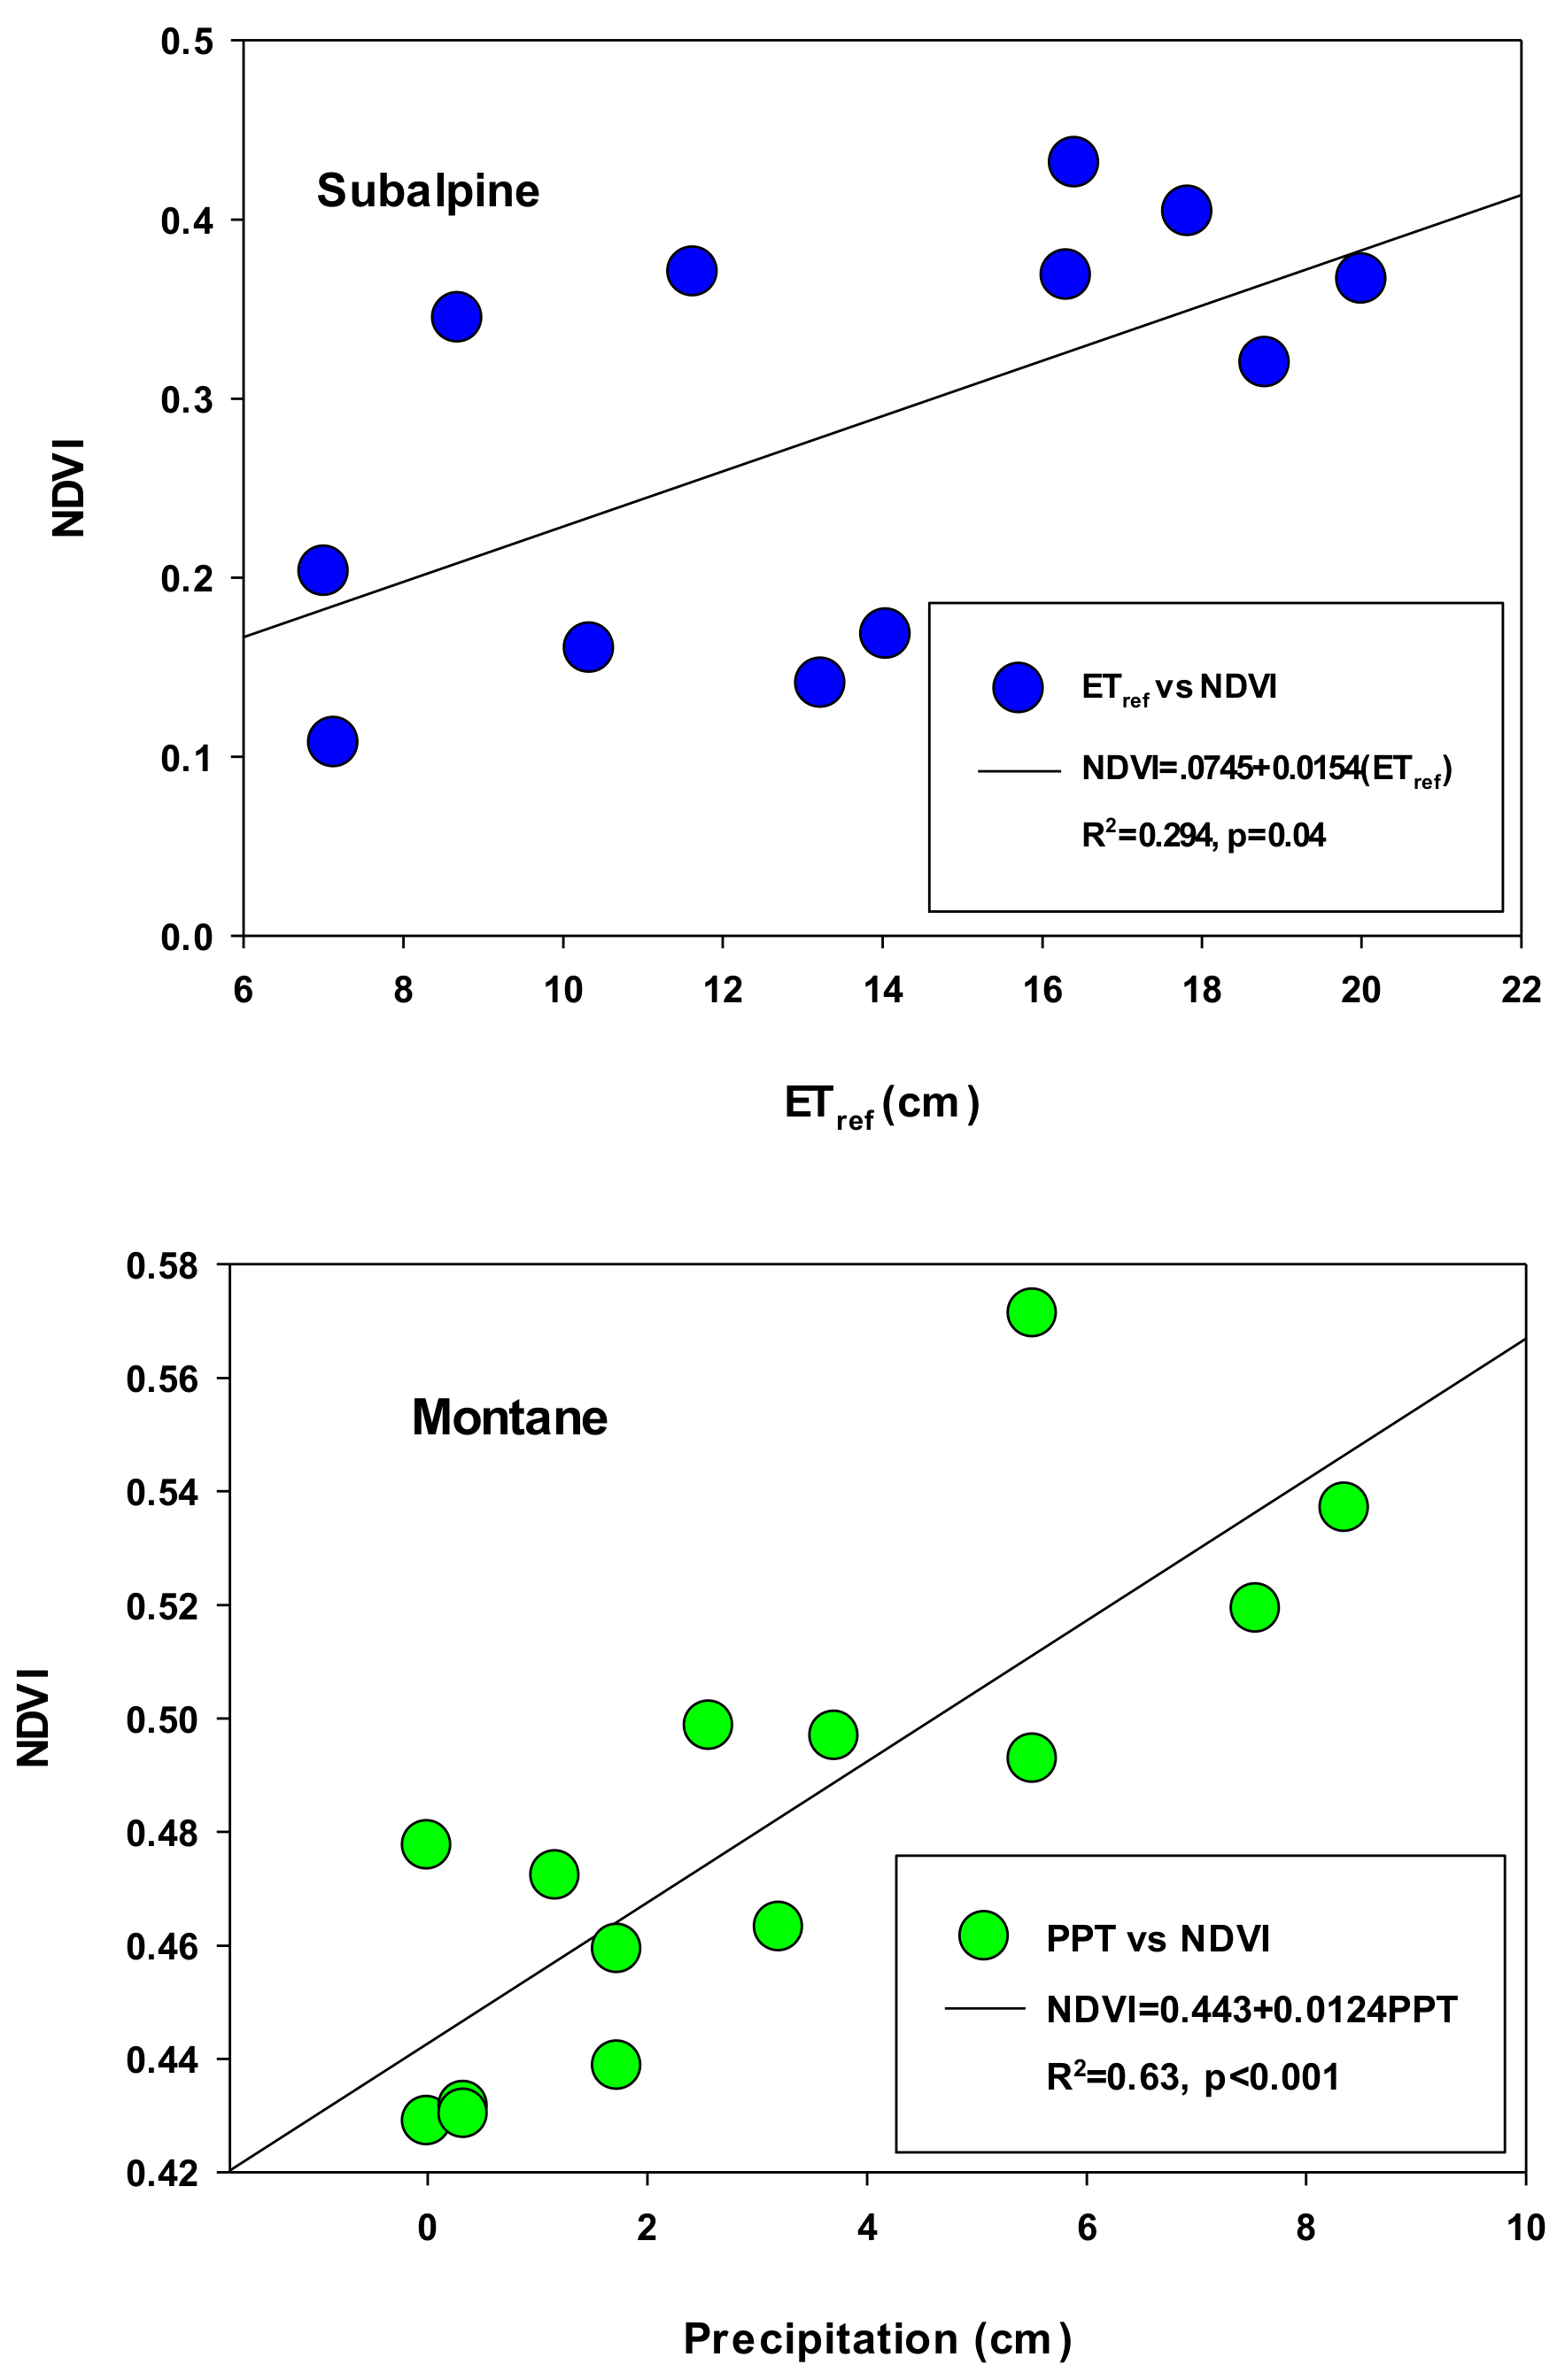
p < 0.001). When NDVI was separated by plant community and analyzed based on individual measurements we found NDVI to be linearly correlated to precipitation and ET
ref. In
Figure 8 the correlation with the highest coefficient of determination at each site is reported. The R
2 values ranged from 0.57 to 0.73 with NDVI increasing with precipitation in both the sagebrush and montane plant communities. However, at the Pinyon Juniper site, NDVI declined as ET
ref increased whereas at the Subalpine site NDVI increased as ET
ref increased. At the lower elevation Pinyon Juniper site, soil water in storage declined during the summer months as ET
ref increased leading to increased stress reflected in lower NDVI values. Whereas at the upper subalpine site, growth was limited by temperature. As snowmelt occurred and the trees became more active, NDVI increased in response to water availability and warming as reflected in the higher ET
ref values. Thus, the NDVI-ET
ref relationship could be either positive or negative depending on water availability. The R
2 value associated with this relationship at the Subalpine West site was the lowest of all the comparisons. However, when we utilized multiple regression analysis both precipitation and ET
ref were accepted in the stepwise backward analysis, accounting for 70% of the variation in NDVI, indicating higher NDVI associated with both higher precipitation and ET
ref at the Subalpine West site (NDVI = −0.297+ 0.0328 ET
ref + 0.0269 PPT, R
2 = 0.70,
p = 0.006). At all the other sites either ET
ref or precipitation was excluded in the backward stepwise regression approach.
3.8. Evapotranspiration
The dynamic relationship between precipitation and volumetric soil water content and environmental demand directly influenced the amount of water lost via ET. ET was estimated at each site by closing a hydrologic balance based on the equation; ET = P − D − ΔS, where P equals precipitation, D equals drainage and ΔS equals change in soil water storage. Although we had three years of precipitation and drainage estimates, we had no runoff estimates or assessments of lateral flow and we only had two years of storage change and no storage change estimates for the Salt Desert Shrub West site. We also recognize that at the Subalpine site in 2013, drainage exceeded precipitation. As such, ET estimates are reported based on closing the water balance based on the available data for the entire three-year period and then dividing this total by three to generate an average yearly ET estimate. The average ET estimates for the sites were: Salt Desert Shrub West 21.49 cm (assuming no change in storage at the Salt Desert Shrub West site and using a value of 6.54 cm for groundwater extraction [
41]), Sagebrush West 19.94 cm, Pinyon-Juniper West 27.93 cm, Montane West 31.80 cm and Subalpine West 21.50 cm. Only at the two highest elevations was the difference between average P and average ET significantly greater than 2 cm, with P exceeding ET by 11.57 cm at the Montane West site and P exceeding ET by 39.48 cm at the Subalpine West site. Multiple regression analysis-based solely on average yearly values revealed that 90% of the variation in the average ET could be accounted for based on average ET
ref and % vegetation cover (ET = 24.90−0.10 ET
ref + 0.32% cover, R
2 = 0.90,
p = 0.053). ET
ref and % vegetation cover were the same two variables that were accepted into the backward stepwise regression explaining 84% of the variation in the average yearly NDVI. Finally, average ET for the 3-year period was found to be highly correlated with average NDVI (ET = 11.74 + 39.68 NDVI, R
2 = 0.87,
p = 0.013).
4. Discussion
Mountain and valley hydrologic and ecological systems are critically connected by the partitioning of precipitation into runoff, recharge, and evapotranspiration. This partitioning is driven to a great extent by changes in air temperature/ environmental demand, as it influences the timing of snowmelt and the rate of evaporation and transpiration. This is particularly relevant for the southwestern USA which is predicted to have the greatest rise in temperature compared to other regions in the USA [
42]. Future changes in precipitation may also alter how the hydrologic components are coupled [
43,
44]. For example, increasing precipitation may augment both runoff and evapotranspiration, especially in areas where ET is strongly water limited [
10]. It has also been demonstrated that in water limited landscapes, increasing precipitation can often be associated with increased growth and ET, leading to decreased drainage and a need to better understand the coupling between vegetation and the hydrologic cycle [
45].
For this study, we assessed near surface hydrologic processes to determine the connection between drainage events (with elevation) and when mine water flow occurred and groundwater levels changed. All the drainage events were associated with snowmelt that occurred during early spring. This agrees with an earlier study in the Great Basin [
46] that indicated that recharge is dominated by snowmelt during the spring period, making the Great Basin region potentially susceptible to changes in climate. As snow-melt occurred in early spring at the higher elevation sites, changes in soil water storage occurred. However, at the Montane West site, storage values that were associated with drainage in early spring were shown not to be associated with drainage during the active growing summer months, indicating a dynamic relationship between vegetation and the underlying space-time dynamics of soil moisture [
47]. All drainage occurred as single continuous events ending by Julian day 160. These results are similar in nature to those reported in a study [
27] that grew grasses in terracosms that simulated Mediterranean climate under elevated air temperatures (+3.5 °C). These researchers [
27] concluded that recharge depended on the frequency and intensity of precipitation events during the spring, with less recharge occurring under pre-storm deficits in soil water storage. This is especially true for mountain landscapes that typically have thin soils storing low volumes of water and therefore making them more vulnerable to changes in climate [
28].
It was estimated that 27% of precipitation at the Montane West site (years 1, 2, and 3) and 66% at the Subalpine West site (years 1, 2 and 3 vs. 40% if year 1 not included) potentially contributed to drainage recharge, indicating a strong contribution from the higher elevation sites. Over 70 cm of drainage at the Subalpine West site in the first year suggested that additional inflow was occurring over the direct precipitation which may have been associated with interflow [
48]. The high drainage value limited our ability to close the short-term water balance in such years. Further monitoring will be required to better understand such deviations. However, drainage volumes from the two highest elevations were shown to be driven by the annual precipitation totals and the soil temperature as the higher 70 cm volume was associated with drainage occurring 27–34 days earlier than in the other two years and to be associated with temperatures that were at or above freezing one to two months earlier (R
2 = 0.80,
p < 0.05). In a study in Colorado [
49], 14% to 38% of annual precipitation was estimated to become mountain block recharge, while mountain block recharge from mountain aquifers (diffuse mountain catchment recharge) was reported between 7% and 39% in the western USA [
50]. In our study, we cannot be certain that the drainage measured at the upper 2 sites actually led to mountain recharge; we only know that it left the upper vadose zone and entered fractured rock just below the flux meters.
At the Subalpine West site, snowmelt was not initially observed with the camera system (snow poles that measured snow depth) even though soil temperatures increased consistently above freezing and soil water contents increased, indicating that snowmelt was indeed occurring. Thus, it is likely significant warming would have to occur early in the growing season to influence growth and ET in a positive way. This logic would agree with an earlier study [
51] that suggested that changes in the timing of snowmelt runoff would induce a negative feedback on changes in ET. However, to truly understand the growth ET response requires assessing the actual growing period with techniques such as eddy covariance as opposed to selecting a threshold temperature as done in our study. A year-round growing season was confirmed in montane forests in CA, USA at an elevation of 2015 m [
52], but a winter dormant period at 2700 m. In our study, both the Montane West (2810 m) and the Subalpine West (3355 m) sites exceeded the highest elevation in the CA, USA study [
52] and based on camera observations and soil temperatures it was assumed that physiological activity of the trees at these higher elevations were low during the winter period. At the lower elevations, no drainage was ever recorded at the Pinyon-Juniper or Sagebrush sites. Precipitation was typically below 30 cm at the lower elevation sites, possibly representing a threshold for drainage to occur from the upper vadose zone. The lack of drainage at the Pinyon Juniper West site is similar to values in pinyon-juniper woodlands in the North Rio Grande Valley of TX, USA where the downward fluxes were reported [
53] to range from 0.05 to 0.20 cm year
−1.
The lack of drainage at the lower elevations supported the contention that precipitation on the valley floor is mostly decoupled from the groundwater [
3,
35]. Thus, phreatophytes (predominantly greasewood) on the valley floor that rely on groundwater to meet part of their water requirements would be strongly coupled to valley recharge from the mountains. Groundwater extraction by greasewood in the Great Basin has been documented to occur beyond depths of 10 m [
3], but no information exists on the physiological maximum rooting depth for this species. If groundwater pumping occurs and/or if mountain block recharge declines, such species/plant communities would face an uncertain future, as any dramatic shifts in climate that alter water availability can have a prolonged impact on ecosystem processes [
54]. A recent assessment of phreatophyte communities at Needle Point Spring in the Snake Valley (NV) using Landsat 7/8 data indicated that groundwater pumping near the spring coincided with a stronger relationship between vegetation vigor and precipitation [
55]. Irrigation of alfalfa also uses mountain recharge, with wells providing water from deeper depths than accessed by greasewood. Whether the irrigation of alfalfa altered ET of adjacent mixed shrubland plant communities or contributed to recharge is not known.
In our study, we investigated the extent of connectivity between drainage events with mine flow and groundwater levels in an otherwise data-sparse region. Recharge from the surrounding mountains is not fully understood because of complex rock formations within the Snake Range and Spring Valley area (as well as the Schell Creek Range on the west side of the valley) which are made up of poorly permeable quartzite as well as granite and permeable rocks of limestone and dolomite [
4]. Calculations of travel time from the alluvial fan on the western slope of the Snake Range to the monitoring well were estimated to be near 50 years (D. Prudic, personal communication, assuming that groundwater moves only from bedrock in the mountain block into the sediments beneath the alluvial fan). We believe the groundwater signal has occurred in a similar fashion on a yearly basis for decades, driven by irrigation pumping to support alfalfa production in the valley, increasing rapidly in late spring and declining rapidly during late fall. This same signal was also driven by the annual groundwater extraction by greasewood, also increasing rapidly in late spring and declining rapidly by mid-October as the plants went into winter dormancy. Thus, the connection on an annual basis between groundwater levels and mine water flow and drainage from the flux meters is not fully known. Such relationships will require long-term monitoring to unravel the various time signal contributions. However, we do believe there was a real time connection between the drainage from the flux meters and the mine flow. Mine flow coming off baseline values occurred at or slightly after drainage from the up gradient Montane West site occurred. However, base flow from within the mountain block occurred continuously in the mine, suggesting that the annual pulses observed in the mine flow were in fact a mix of current flow contributions with contributions from the past (larger fractures contributing more after snow melt events). We believe the offset was about one year as a more linear relationship existed between mine flow and precipitation if a one-year offset was considered (
Figure 7, precipitation and groundwater offset as well). A true understanding of the temporal response will require continued monitoring of all three variables and potentially geochemistry studies to examine seasonal isotopic content. Although correlations between stream hydrographs and groundwater levels have been reported by many research groups [
4,
56,
57], including one study on the east side of the Snake Range [
4] where a highly synchronized relationship between stream flow and groundwater levels occurred, comparisons with ground water levels at greater distances from the point of recharge (our study) is more problematic. It was reported in CO [
58] that base flow in mountain streams and the elevation of perennial flow was more sensitive to recharge rates changing than valley water tables. Our data also suggest greater sensitivity between changes in mine flow (artificial stream) and recharge as quantified with drainage flux meters as compared to changing valley water tables which are associated with a larger storage capacity (basin filled deposits with responses lagged and dampened).
We also assessed the connection between near surface hydrologic processes and plant response by monitoring NDVI and ET. When NDVI was assessed on a site basis, 70% of the variation in NDVI values at the Subalpine site could be accounted for based on a positive relationship to both precipitation and ET
ref. Such results would support a positive effect of warming on the overall growth, health and greenness at the higher elevation site as inferred from higher NDVI values [
52,
59,
60,
61,
62]. In an ET study [
52] conducted in the Sierra Nevada mountain range of CA, USA, peak ET values in the montane region that were not constrained by climate at higher and lower elevations were correlated with NDVI. It was concluded in the CA study that a warming of 3 °C could shift the vegetation distribution upslope by approximately 600 m with a possible 60% increase in localized ET. ET estimates in our study were found to be highly correlated with NDVI values over the 3-year monitoring period (R
2 = 0.87,
p = 0.013). Similar correlations between NDVI and ET have been reported in the shrubland region of the Great Basin (energy balance approach) [
35]. Thus, if NDVI in the subalpine zone were to increase because of warming it would also suggest a possible increase in ET and a clear signal that the water balance was being altered. However, this would be dependent on how well precipitation matched demand during the extended growing period. Continued analysis of satellite data combined with ground observations should prove to be a powerful tool in assessing the impact of climate change on these remote plant communities.

 ,
, 


