Abstract
A quantitative understanding of the interplay between the different components of the hydrologic cycle at the watershed scale can be gained from analyzing high-frequency hydrologic time series. High-frequency measurements of precipitation, soil water content, shallow groundwater, and streamflow were collected and analyzed in Otter Creek, a 122 km2 watershed located in Northeast Iowa, USA. For selected rainfall events occurring in 2014, it was found that there is at least 4 h of delay between soil water content and water table time series response and streamflow peak. This is true even when the water table was approximately 6.5 m below the ground surface before rainfall started. Data reveal a strong linear dependence between the soil water content and the water table, which suggests the existence of a capillary fringe that extends approximately 2.5 m above the water table. The highest streamflow values in Otter Creek occurred when both the water table was close to the ground surface and the near surface soil (top 65 cm) was close to full saturation. Analyses show that, in the study area, data on depth to water table or deep soil water content have the potential to play a key role in the development of a flood warning system. The transformation of rainfall into streamflow is a complex process that we simplified in this study. Additional analyses using physically based coupled surface-subsurface models or non-linear or stochastic models are recommended for more rigorous analysis.
1. Introduction
Floods are the most damaging natural disaster in the United States [1]. Damages for the 1993 flood in Iowa were estimated to be $152 million and the 1993 and 2008 floods in the Upper Midwest exceeded economic losses of 1 billion dollars [2]. Analysis of long term records collected in the Mississippi River Basin (MRB) show increasing trends in the frequency of heavy rainfall and annual maximum daily rainfall [2,3]. Areas prone to flooding in the MRB are likely to be affected by extreme precipitation events in the coming years. In an agricultural region, such as Iowa, that is characterized by high water tables [4] and runoff from cropped areas, evaluating flood risks warrants increasing attention [5].
Temporal resolution in hydrologic data collection, from the early part of the 20th Century to today, has increased from daily or intermittent values to sub-hourly [6,7]. This allows for better resolution of the timing of various hydrologic processes, including floods. In the U.S., several federal, state, local, and private entities operate high-frequency hydrologic data collection networks [8]. Typically, hydrologic variables monitored at high frequency include precipitation, stream discharge, stream stage, and groundwater levels, among many others. High temporal resolution data are important for developing and calibrating hydrologic models and assessing the dependence and timing among different hydrologic processes and water quality variables. The authors in [9] investigated seasonal variability in runoff generation processes in a well-instrumented 1.96 ha watershed using end-member mixing analyses and hydrometric data and specific conductance collected at a frequency of 5 to 15 min. Hydrograph separation using similar techniques has been used in studies to quantify baseflow in snowmelt-dominated, agricultural, and forested watersheds [10,11,12].
Soil moisture has been identified as a unifying theme in physical hydrology, and high-frequency soil moisture data have been used to investigate its relation with other hydrologic variables [13]. Likewise, the influence of soil moisture on runoff generation, recharge, and evapotranspiration has been analyzed [14,15,16,17]. Rapid groundwater responses to precipitation and the riparian-stream system dynamics have also been studied using continuously monitored data. The authors in [18] demonstrated the importance of the groundwater component in flood generation using high-resolution water table monitoring in 10 wells and other hydrometric and geochemical data. Other studies have reported distributed patterns of pore water pressure head [19], soil salinity impacts on farmland [20], and dynamics of the hyporheic zone [21].
In this study, we evaluated high-resolution hydrologic time series, including rainfall, shallow soil water content (SWC), streamflow, and depth to water table (DWT) at upland locations, collected in an agricultural watershed in northeast Iowa. Since the region is prone to flooding, our goal was to evaluate the timing and interdependence of these upland water quantity measures (rainfall, SWC, DWT) and streamflow peaks at the watershed outlet. An improved understanding of how the hydrologic cycle behaves in a watershed is foundational for the development of early warning systems for flood mitigation.
2. Materials and Methods
2.1. Study Area
Otter Creek is a 122 km2 watershed located in northeast Iowa, USA (Figure 1). The stream is a tributary of the Turkey River which drains into the Mississippi River. Approximately 50% of the watershed area is devoted to agricultural activity, with corn and soybeans being the predominant crops. Forest and grassland represent approximately 12% and 25% of the land cover, respectively. The western half of the watershed is characterized by gentle slopes compared to the more rugged eastern portion (Figure 1a). The total watershed relief is approximately 130 m. Most of the agricultural activity and associated tile drainage is concentrated in the western part of the watershed, whereas the eastern part is dominated by grasslands and forest. Average annual precipitation in northeast Iowa is approximately 910 mm [22], and approximately 70% of the total annual precipitation is lost through evapotranspiration [23].
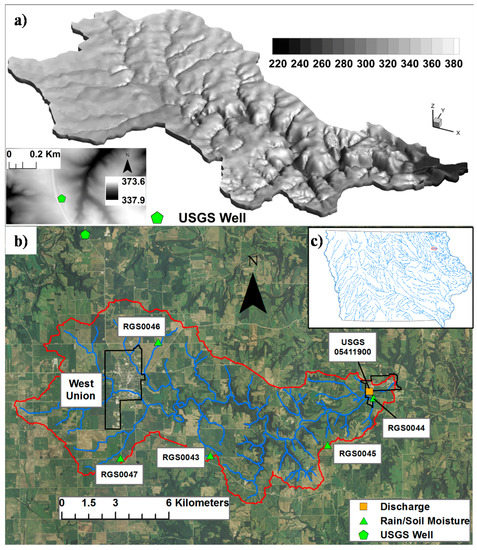
Figure 1.
Otter Creek. (a) Elevation expressed in meters above sea level (m.a.s.l.); (b) Aerial photo and monitoring stations locations; (c) Location in the State of Iowa. Black outlines in frame (b) show incorporated city boundaries. USGS: U.S. Geological Survey.
2.2. Sensors and Field Measurements
Otter Creek is a well-instrumented watershed with several sensors collecting hydrometric data (precipitation, streamflow, SWC, and DWT) at 15-min frequency (Table 1). The availability of data played a key role in the selection of Otter Creek for this study. Locations of the monitoring stations are presented in Figure 1b. Sensors collecting precipitation, SWC, and stream discharge were installed in the early part of 2014. For most of the study period, shallow groundwater data were obtained from a well located outside of the watershed that was monitored by the U.S. Geological Survey (USGS). Note that this well was decommissioned in October 2014 (Table 1). In September 2014, water table monitoring was initiated in three new sites located in the Otter Creek. Results presented below include data from the well installed at station RGS0046. Precipitation was measured at five stations in the watershed using two MetOne 380 (Met One Instruments, Inc., Grants Pass, OR, USA) Precipitation Gauges at each site. Readings from the two gauges were averaged to derive an estimate of the 15-min rainfall intensity. At the same five sites, Campbell Scientific CS655 (Campbell Scientific, Logan, UT, USA) Soil Water Content Reflectometers were installed at depths of 5, 10, 20, and 50 cm. A borehole was dug to a depth of approximately 60 cm to facilitate probe installation. Pilot horizontal holes at the target depths were made using a rod insertion guide tool. At targeted depths, probe rods were installed horizontal to the ground surface, which allows for the detection of vertical water fluxes, and the hole was backfilled with native soil. SWC measurements were obtained using the default relationship between dielectric permittivity and volumetric water content and were collected every 15 min. Probes are designed to measure SWC in the 5% to 50% range with a typical accuracy of ±3%.

Table 1.
Data collected by the monitoring stations shown in Figure 1. Groundwater well at station RGS0046 was installed in late fall 2014.
The well at station RGS0046 was installed to a depth of approximately 8.0 m using a truck-mounted, hollow-stem drilling rig. A 3-m long factory-slotted PolyVinyl Chloride (PVC) well screen and a solid PVC riser were installed in the borehole. A silica sand filter pack was poured around the screen, bentonite chips were added to provide a seal, and drill cuttings were backfilled in the rest of the borehole. Water table levels in the well were recorded every 15 min using Decagon CTD-10 transducers (Decagon Devices, Inc., Pullman, WA, USA). Both wells (RGS0046 and USGS) were located in topographical high spots away from streams in regions that are likely to be recharge areas where groundwater levels are not significantly influenced by stream level fluctuations.
Soils consist of predominantly silt loam throughout much of the watershed, with loam soil texture primarily found in the southwestern portion of the basin [24]. Soil samples taken at RGS0044, RGS0045, and RGS0046 (see Figure 1) indicated soil textures of silt loam, silty clay loam, and silt loam, respectively. The thickness of soil A and B horizons at these locations ranged from approximately 1 to 2 m. Lithologic logs from private wells in the area indicate that clay, loess, sandy clay, and shale comprise the deeper geologic materials. The depth to bedrock averages approximately 11.0 m in the watershed [25].
2.3. Hydrologic Time-Series Data
Time series of hydrologic data collected in 2014 were analyzed in this study. To estimate rainfall and SWC for the entire watershed, the arithmetic average of the values recorded at the five RGS stations was calculated. SWC readings were averaged by soil depth class. It is important to mention that SWC time series at each of the five sites responded to rainfall events at similar times but displayed differences in magnitude, which highlights the influence of local characteristics (e.g., soil properties, slopes, etc.) on SWC readings. The temporal dynamics among the different time-series records were analyzed for the period between 1 May and 7 November 2014. We focused on six precipitation events observed during the study period. Five events (e1 to e5) were recorded in the summer of 2014 and the sixth event (e6) was observed in mid-October. We defined the response of the different hydrologic time series to precipitation events based on an analysis of the time-series slopes. A second-order polynomial was fit to every point in the time-series record to estimate the slope at the given point. A three-point stencil defined by the given point and a point backward and forward in time was fitted with the polynomial. High-order polynomials can display oscillatory behavior and introduce a high number of inflexion points. For the analyses presented in this paper, a simple second-order polynomial was deemed appropriate. Time-series response to precipitation was defined as the first data point after the first recorded rainfall when the time-series slope exceeded a threshold value. Slopes were calculated for the entire record (1 May to 7 November), and the response threshold value was assumed to be the 98th percentile. A slope that exceeded the 98th percentile was assumed to be the response of the hydrologic time series to the precipitation event. The slope threshold for DWT was estimated in the same manner using water level data collected by the USGS.
3. Results
3.1. Time-Series Data
Hydrologic data measured during 1 May to 7 November 2014 are displayed in Figure 2. In this figure, the top panel shows rainfall intensity and the bottom frame displays time series of SWC at four depths, DWT at two wells, and streamflow at the watershed outlet. A total of 710 mm of rainfall occurred during the study period, which represents 78% of the long-term annual average for Northeast Iowa. Approximately 36% of the measured rainfall was recorded in the month of June. The maximum average rainfall intensity and the longest period of uninterrupted rain were 12.4 mm/15 min and 22.5 h, respectively. The maximum rainfall intensity recorded at the five monitoring sites (see Table 1) corresponds with a 1-year 15-min duration storm.
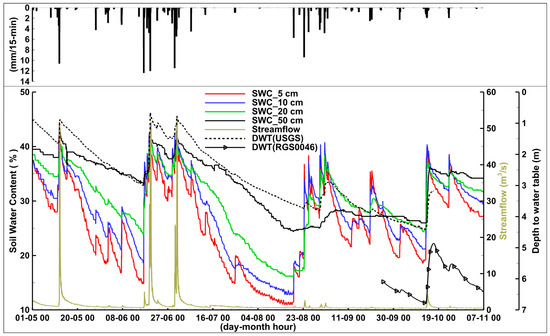
Figure 2.
Hydrologic time series measured in 2014. The top frame shows rainfall intensity. SWC and DWT stand for soil water content and depth to water table, respectively.
The hydrologic time series show large fluctuations during the monitoring period (Figure 2). The largest fluctuations were associated with SWC at 5-, 10-, and 20-cm depths. SWC at the 5-cm depth showed the largest range in values, ranging from 44% after rainfall events in May to 11% following an extended dry period in August. SWC at 50 cm fluctuated within a narrower range (24–43%) than the shallower depths and closely followed water table patterns. During dry periods, the steepest and the gentlest decline in SWC slopes were observed for the sensors located at 5 cm and 50 cm, respectively.
DWT (USGS) levels ranged between 0.7 m and 4.4 m from the ground surface (Figure 2). Rapid water table rise was observed on several occasions during 2014, rising as fast as 1.8 m in 15 h during some intense rainfall events. During drier periods, the water table steadily declined. The DWT time series observed in the USGS well and the DWT values recorded at station RGS0046 displayed very similar trends over a short time period. In the 21 days that they overlapped, the Pearson correlation coefficient between the time series was 0.99 and their maximum instantaneous slopes were 1.5 m/day (USGS well) and 1.8 m/day (RGS0046). However, values reported at RGS0046 showed a water table location that was on average 2.2 m deeper than that recorded at the USGS well. It is important to mention that Pearson correlation coefficients measure the degree of linear association between two variables, and in highly non-linear relationships other metrics (e.g., Spearman’s rank correlation coefficient and Kendall’s rank correlation coefficient) can be more appropriate.
DWT fluctuations correlated with SWC patterns, with the greatest correlation between DTW and SWC at 20 and 50 cm (r = 0.86 and 0.95, respectively; 1 May to 16 October; Table 2). In the late fall (early September and mid-October) the DWT displayed a downward trend that was not evident in the SWC data at 50 cm. Hence, the correlation between DTW and SWC at 50 cm decreased to 0.53 during this fall period. The correlation between SWC and the DWT was affected by the depth of the water table (Table 3). When the water table was located close to the ground surface (<2 m deep), SWC at the four depths and DWT time series showed a strong correlation (r = 0.84 to 0.90). For values of DWT greater than 2 m, the correlation with shallower SWC depths (<10 cm) decreased to r < 0.24. At DWT greater than 3 m, correlation of SWC with DWT was <0.36 at all soil depths.

Table 2.
Pearson correlation coefficients between the soil water content and depth to water table (USGS well) time series for different times of the year.

Table 3.
Pearson correlation coefficients between the water content and depth to water table (USGS well) time series for different positions of the water table.
Table 3 shows that correlation coefficients, for SWC depths of 10, 20, and 50 cm, monotonically decrease with DWT. In contrast, the SWC sensor at 5 cm shows the smallest correlation for DWT values between 2.0 and 3.0 m. Based on Figure 2, values of DWT between 0.0 and 2.0 m represent wet conditions and DWT measurements deeper than 3.0 m are indicative of dry conditions. The dynamics between SWC and evapotranspiration in the transition between wet and dry conditions influence the first and more severe SWC readings at 5 cm and can potentially explain the very low correlation coefficient presented in Table 2 for this sensor (DWT = 2.0–3.0 m). Since land cover at the SWC consists of shallow-rooted cool season grass (Poa pratensis), the shallow SWC measurements at 5 cm are impacted first when plant water uptake begins drying soils following a wet period. Hence, the relation of shallow SWC to DWT are first to decouple and correlation decreases when DWT decreases.
3.2. Timing of Hydrologic Processes
Six events (e1 to e6), for which data from all the monitoring sites were available, were selected to evaluate the timing among different hydrologic variables (Figure 3, Figure 4, Figure 5 and Figure 6). Note that in these figures the scales for the horizontal and vertical axes are not the same. The six events presented in Figure 3, Figure 4, Figure 5 and Figure 6 had a streamflow peak of at least 4.3 m3/s and displayed both SWC (at the four depths) and DWT time series responding to rainfall (Table 4). In the period between early July and early October, several rainfall events were recorded in Otter Creek but none of them increased the streamflow appreciably (Figure 2). However, SWC changes and, to a considerably lesser extent, DWT changes were observed in this period.
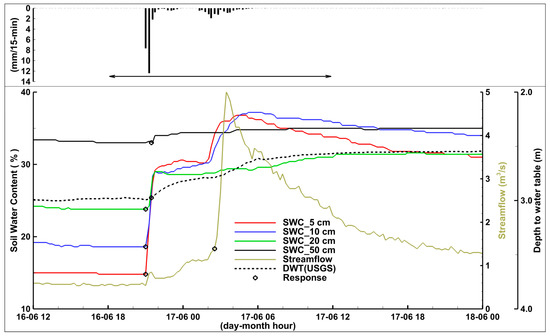
Figure 3.
Event 1 (e1). Hydrologic time series measured in 2014. The horizontal arrow in the top panel shows the analyzed time window.
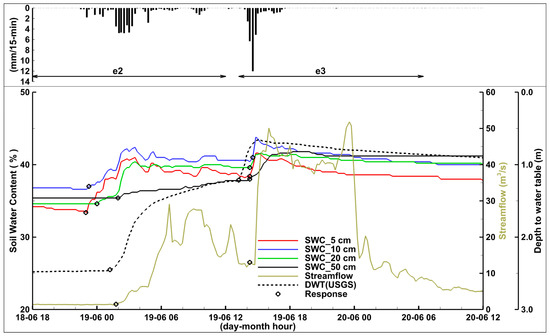
Figure 4.
Event 2 (e2) and Event 3 (e3). Hydrologic time series measured in 2014. The horizontal arrows in the top panel show the analyzed time windows.
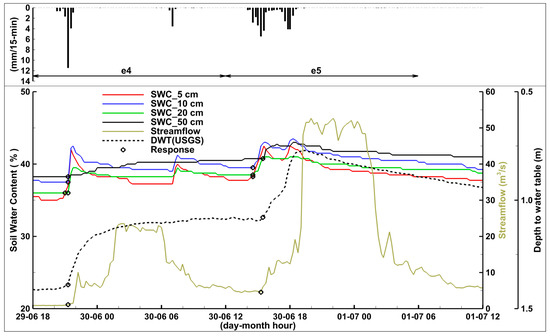
Figure 5.
Event 4 (e4) and Event 5 (e5). Hydrologic time series measured in 2014. The horizontal arrows in the top panel show the analyzed time windows.
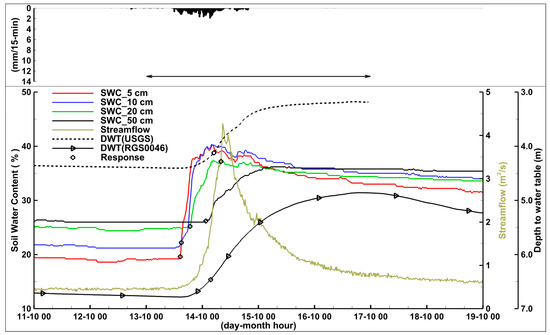
Figure 6.
Event 6 (e6). Hydrologic time series measured in 2014. The horizontal arrow in the top panel shows the analyzed time window.

Table 4.
Time series main features during June and October periods in 2014. Initial values correspond with the first rainfall recorded within the analyzed window. Groundwater data are based on the USGS well.
Summer events (e1 to e5) were characterized by short rainfall durations and high intensities. In contrast, rainfall during event e6 (in the fall) spanned approximately 45 h with intensities lower than 2 mm/15 min. Peak discharge was lowest during events e1 and e6 (<5m3/s) and much greater during events e3, e4, and e5 (23–53 m3/s). Furthermore, in all of the events, the groundwater table rise was larger than the measured rainfall depth. The largest ratio (25.2) between water table rise and rainfall depth was found in event e2 and the smallest (5.5) in event e5 (Table 4).
During event e1, approximately 36 mm of precipitation fell over 9.5 h with a maximum intensity of 12.4 mm/15 min (Table 4). Streamflow peaked at 5.0 m3/s approximately 6.5 h after the rainfall began. SWC rapidly increased at depths less than 20 cm with SWC at 5 cm increasing from 14.8 to 36.8% during the first 7 h of rainfall (Figure 3). In contrast, SWC at 50 cm and DWT exhibited a minor response to the event, increasing 2% and 0.43 m, respectively. The time to the maximum SWC from the initiation of rainfall ranged from 7.25 to 13.75 h (Table 4), which was less than the time needed for water table rise to reach the minimum DWT (15 h). The response time (time between change in time-series slope (response) and first rain) was less than 0.5 h for the SWC and DWT table but was considerably delayed for streamflow (5.5 h).
Event e2 occurred approximately 1 day after event e1 when soil moisture conditions were wetter; initial SWC ranged from 33.6% to 36.6% in the upper 50 cm (Table 4). After 49 mm of rainfall, shallow SWC at the end of the event (<20 cm) increased approximately 5% (Figure 4) and streamflow peaked at 29.2 m3/s, more than five times larger than e1, whereas DWT changed 1.23 m. The time to measured hydrologic response from the first rainfall was 0.5 to 1.5 h for shallow SWC (<20 cm) and 3.5 and 2.75 h for SWC at 50 cm and DWT, respectively. Approximately 13 h after the hydrologic response of event e2, another 33.4 mm of additional rainfall fell in the watershed (e3) (Figure 4). Streamflow during e3 peaked at 51.8 m3/s as the rain fell on wet soils (38–41%). DWT was observed to quickly rise (0.35 m) with the rainfall event. The response time from the first rain was rapid in all hydrologic time series, ranging from 0 h (DWT) to 1.25 h (10 cm SWC) (Table 4).
Events e4 and e5 occurred in short succession approximately 9 days after e3 (Figure 5). A total rain of 24 mm on 29 June resulted in SWC increasing 2–4% and DWT decreasing 0.3 m. Approximately 18 h after event e4, 35.5 mm of additional precipitation fell in the watershed. Again, with precipitation falling on wet soil, streamflow rapidly increased, with peak discharge (52.7 m3/s) and volume similar to event e3. A rapid hydrologic response was observed in the SWC and DWT time series (Figure 5) with the elapsed time between the start of rainfall and the hydrologic response ranging from 0.5 to 1.5 h. (Table 4).
After the series of events in June 2014, another significant streamflow event in Otter Creek did not occur until mid-October (Figure 2). Event e6 was characterized by low rainfall intensities (<1.96 mm/15 min) and despite having the largest total rainfall depth (71 mm) produced the minimum streamflow hydrograph peak (4.3 m3/s) out of the six analyzed events (Table 4 and Figure 6). Initial SWC conditions in the upper 50 cm of the soil column were relatively dry with an average value of approximately 23%. In addition, the water table location (DWT = 4.40 m; USGS well) was considerably deeper than at the beginning of events e1 to e5 (Table 4). Variations observed in event e6 occurred at a slow pace consistently with the recorded low rainfall intensities. Maximum SWC values in the probes located within the first 20 cm of the soil column and those located at 50 cm were observed 28 and 53 h after the onset of precipitation, respectively (Table 4).
In Table 4, the minimum value of DWT at the USGS well was found 90 h after the first recorded rain. Figure 6 also shows that for the DWT at station RGS0046 a similar time elapsed between the first rain and minimum DWT value.
Differences in time-series response times, location of the SWC sensors, and initial DWT (USGS) values measured in event e6 were used to roughly estimate average water vertical fluxes. The vertical movement rate in the top soil (<50 cm) was estimated using data for the SWC sensors at 5 and 50 cm. It was on average 1.14 × 10⁻⁵ m/s (45 cm in 11 h (differences in response times), see Table 4). In contrast, the results show a considerably faster rate in the soil column between the lower-most SWC probe and the water table of 3.1 × 10⁻⁴ m/s (3.9 m in 3.5 h (differences in response times), see Table 4). Vertical movement rates were not estimated for the other events because for several sensors the response was found to be almost instantaneous.
3.3. Comparison of Timing for Various Events
For the six events, the SWC and DWT time series responded prior to the peak in streamflow, even in event e6 when the water table (DWT (RGS0046)) was approximately 6.5 m below the ground surface before rainfall started (Figure 6). Times between peak streamflow and time-series response (lag times) for SWC and DWT varied between 3.8 and 18.3 h, with the shortest and longest lag times found in event e6 for DWT(USGS) and SWC_5 cm, respectively (Figure 7). As was mentioned before, measurements at each one of the five monitoring sites displayed similar response times and there was no significant difference in lag times based on spatial location in the watershed.
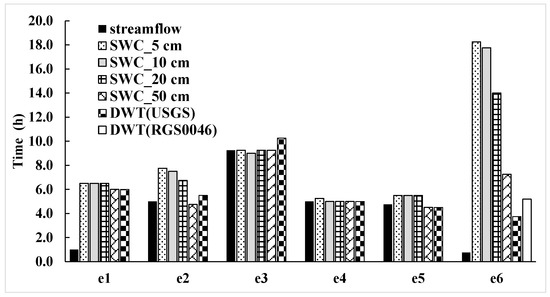
Figure 7.
Time between time series response and peak streamflow (lag times).
Lag times for the streamflow time series are influenced by the watershed SWC initial conditions. The two events with the driest SWC initial conditions (e1 and e6) had the shortest streamflow rising limbs (see black bars in Figure 7) and the smallest ratio between streamflow and rain (see Table 4).
In contrast, a within-event comparison of lag times for events e2, e3, e4, and e5 show similar values for all of the analyzed time series (Figure 7). It is worth noting that the streamflow peaks for events e1 and e6 are considerably smaller than those of the other events. On average, in events e2, e3, e4, and e5, streamflow time-series lag times are closer to those of DWT or SWC at 50 cm with this behavior being more apparent for events e2 and e5.
3.4. Relations among Hydrologic Variables
Figure 8 shows scatter plots created with data collected between 1 May and 16 October 2014 (Figure 2) and displays the relationships between SWC, DWT, and streamflow in Otter Creek. SWC values in this figure were calculated as a weighted average of measurements taken at the four depths (5, 10, 20, and 50 cm) and are considered representative of conditions within the top 65 cm of the soil column. Panels in Figure 8 display a clear non-linear relationship between streamflow and either SWC or DWT and a close-to-linear relationship between DWT and SWC. In addition, they show that the highest streamflow values in Otter Creek occurred when both the water table was close to the ground surface and the near surface soil (top 65 cm) was close to full saturation.
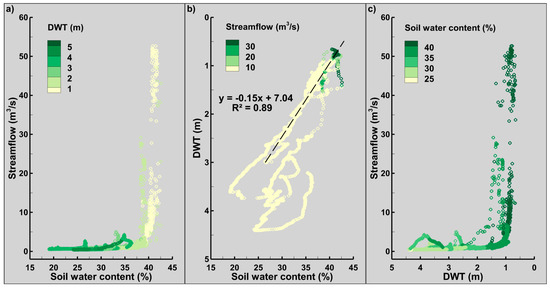
Figure 8.
Relationship between depth to water table (DWT) (a); streamflow (b); and soil water content (c) (top 65 cm of the soil column); and Data measured between 1 May and 16 October 2014 (see Figure 2). Dashed line in Frame (b) shows a fitted straight line for DWT < 3.0 m.
The relationship between weighted SWC and streamflow can be separated into two parts divided by an SWC of approximately 38% (Figure 8a). For SWC values below this threshold, streamflows were smaller than 5 m3/s. In contrast, when SWC was above 38%, the data show streamflows varying in a considerably wider range (3–52 m3/s) and changing drastically with small variations in weighted SWC.
The scatter plot presented in Figure 8c displays two distinct regions in the relationship between DWT and streamflow divided by a DWT of about 1.0 m. The highest streamflow recorded in Otter Creek in 2014 was 52.7 m3/s, which coincided with weighted SWC and DWT values of 41.5% and 0.78 m, respectively (Figure 8a,c). The linear dependency between weighted SWC and DWT is revealed in Figure 8b, particularly when the water table is close to the ground surface. In this plot, the straight line fitted for the points with DWT < 3.0 m has an R2 = 0.89. In contrast, the straight line fitted with the points with DWT > 3.0 m (not shown in Figure 8) has a coefficient of determination of 0.15.
A simple multiple linear regression analysis was performed to further investigate the interdependence among the monitored hydrologic variables. The streamflow measured at a given time t (Qt) was assumed to be a linear function of measurements taken at a previous time t-δ and the accumulated precipitation (Pcumu) between t and t-δ. In addition to the accumulated rainfall, the predictors selected included depth to water table (DWTt-δ), weighted soil water content in the top 65 cm of the soil column (SMt-δ), and measured streamflow (Qt-δ). Predictors were chosen to provide information on how much water was stored in the soil at the beginning of the rainfall event (SMt-δ and DWTt-δ), rainfall depths (Pcumu), and initial stream conditions (Qt-δ). Other variables that can play an important role in runoff generation processes, such as vegetation type, time of the year, and evapotranspiration, were not considered because the emphasis of the present paper is on analysis of the available hydrologic time series.
Table 5 displays values of adjusted R2 for seven different combinations of predictors and values of the lag time δ.

Table 5.
Adjusted R2. Multiple linear regression analysis. Qt = f (predictors).
For the most complex model (Model 1), values of adjusted R2 tended to decrease with increasing values of δ, revealing a loss in the model’s predictive capabilities. In addition, the relative contribution of the predictor Pcumu to Model 1 adjusted R2 increases with δ (see Model 1 and Model 7). For a lag time of δ = 5 h, accumulated precipitation accounted for approximately 30% of the Model 1 adjusted R2, whereas for δ = 35 h Pcumu represented 90% of the Model 1 adjusted R2. The most important predictor (for δ ≥10 h) is Pcumu, and for large values of lag time neither SMt-δ nor Qt-δ improve values of adjusted R2. Furthermore, irrespective of the values of δ, Model 2 displays values of adjusted R2 that are slightly higher than those of Model 6. Based on the values displayed in Table 5, the best two-predictor and three-predictor models are Model 6 and Model 2, respectively.
The comparison of values presented in Table 5 for Models 1 and 2 suggests that the addition of SMt-δ has a minor effect on the values of adjusted R2. The results for these two models are virtually the same (Table 5). This is not surprising, since Figure 8b reveals a strong linear dependence (R2 = 0.89) between DWT and soil water content, which suggests that only one of those two variables should be included as a predictor to avoid multicollinearity in the regression model. In other words, adding DWTt-δ (or SMt-δ) as a predictor once SMt-δ (or DWTt-δ) is already in the model does not improve the model’s prediction ability.
4. Discussion
In Otter Creek, the high-resolution time series reveal a strong interdependence among soil water content, shallow groundwater, and streamflow. Increasing streamflow indicative of a runoff event required that both deeper SWC (>20 cm) and the groundwater table responded to rainfall. When a response to precipitation was observed in the deeper SWC and DTW time-series records, there was approximately 4 to 6 h between the time-series response and the peak streamflow. In contrast, changes in shallow SWC (<10 cm) together with rainfall did not necessarily lead to increasing streamflows. Shallow SWC responded rapidly to many rainfall events during the study, but streamflow in Otter Creek was often unaffected.
Based on data collected in an alpine catchment, [26] reports that for soil water content values higher than approximately 40–45% both streamflow and depth to water table drastically rose with small changes in soil water content (threshold behavior). Results presented in Figure 8a display a similar relation between soil water content (>38%) and streamflow. In contrast, results presented in Figure 8b show a strong linear dependency between DWT and SWC. The strong correlation of DWT to SWC and the magnitude of the water table rise after rainfall events suggest commingling of these indicators at the capillary fringe. Under this assumption, pre-event water held above the water table via capillary forces would be quickly released after event water travelled through the top layers of the soil. The hydrologic influence of the capillary fringe can explain the similarity in response time between DWT and SWC and the disproportionate response in the water table to rainfall events [27,28,29]. These findings suggest that the capillary fringe may extend approximately 2.5 m above the water table in the fine-textured Otter Creek watershed soils consistent with results of [30].
Antecedent SWC conditions were found to play a significant role in both time-series response and streamflow peak magnitude. Of the six analyzed events, those with wetter initial conditions (e2 to e5) had peak streamflows above 29 m3/s and had similar lag times. Higher discharge events in 2014 were associated with high weighted average top soil SWC (>38%) and the water table located close to the surface (DTW < 1.0 m). Our results are consistent with other studies that used high-frequency hydrometric data. The authors in [17] found, in watersheds with loessial soils, a non-linear response in runoff generation with SWC and a runoff generation threshold of 0.39 cm3·cm−3. In a study performed in a small headwater catchment, the authors in [15] identified steep increases in runoff when average soil moisture content exceeded 0.60 cm3·cm−3. Abrupt changes in runoff above a threshold were similarly reported in [9,31]. Our results as well as findings from the studies mentioned above suggest that the relation between streamflow and soil moisture always exhibits a threshold behavior irrespective of topography, soil type, land cover, and scale.
A similar hydrologic response of shallow groundwater (USGS well and RGS0046) was observed in two upland areas (Figure 1) with diverging surface topographies. At both locations, subsurface lateral flow was not likely to contribute significantly to the measured rise in the water table and therefore groundwater response was primarily governed by downward vertical fluxes from precipitation recharge. For event e6 (Figure 6), the two wells displayed a similar response to rainfall despite being located 7.5 km apart and having significantly different values of DWT at the beginning of the event. This suggests that the mechanisms that generate shallow groundwater response during rainfall events can be activated across geographical areas in the watershed. However, it should be stressed that observing a water table response to rainfall does not equate to quantifying groundwater contribution to streamflow and flooding, which should be verified through hydrograph separation studies [11,32] or modeling exercises [33,34] which are beyond the scope of the present paper.
The transformation of rainfall into streamflow is accepted to be a highly non-linear process [35] and therefore the multiple linear regression analysis presented above is unlikely to be an appropriate streamflow forecast tool. However, it can help shed light on the relative importance of the different hydrologic variables in streamflow generation processes. This analysis reveals that, in the study area, there is value in adding information on either DWT or deep soil water content to streamflow forecasting tools.
The use of soft-computing and metaheuristic techniques in modeling environmental phenomena has gained popularity [36,37]. They have been used in studies related to baseflow separation [38], groundwater level fluctuations [39], suspended sediment loads [36,40], water quality [41], and rainfall-runoff modeling [37]. Satisfactory results presented in the studies mentioned above suggest that these techniques offer a more comprehensive approach to analyzing the hydrologic time series presented in our paper. Furthermore, physically based coupled surface-subsurface modeling can also offer a more holistic alternative to our methodology. However, these efforts are beyond the scope of the present study.
Depending on the resources available, communities prone to experience flooding can develop warning systems with different levels of sophistication. The most advanced systems typically involve quantitative short-term precipitation estimates, continuous rainfall-runoff modeling, and real-time monitoring of stream stages, discharges, and other hydrologic variables [42,43]. Currently, the National Weather Service (NWS) River Forecast Centers (RFC) generate streamflow forecasts with the outputs of hydrologic models that take as input data measured and forecasted precipitation and temperatures [44]. In Otter Creek, the analyzed hydrologic time series suggest that subsurface conditions play a role in streamflow generation processes and that there is a benefit in including measurements of deep soil moisture or water table location in flood warning systems.
The hydrologic data collected in Otter Creek for a single year are insufficient to build a set of rules based on thresholds that would give some indication of whether streamflow might exceed a warning threshold. The authors in [45] presented a framework for the development of a groundwater flooding warning system for areas in the Chalk aquifer in England. The warning system consists of a series of nested steps that depend on groundwater levels, the matric potential in the unsaturated zone, and meteorological data. Overall, the interconnectedness among the different hydrologic variables in Otter Creek, in particular deeper soil water content and DWT, suggests that development of a similar framework might be appropriate in this watershed and other basins located in flood-prone areas overlain by fine-textured soils.
The usefulness of a flood warning system that relies on groundwater and soil moisture measurements depends on the role played by these variables on streamflow generation. In a small basin with a short time of concentration and that is affected by flash-flooding, monitoring either SWC or DWT is likely to have limited value. In addition, for cities and communities located at the margins of major rivers, stage and streamflow measurements collected upstream are likely to be better flood predictors than information on DWT and SWC.
5. Conclusions
Analyses of continuous hydrologic time series revealed that streamflow generation processes were correlated with deeper soil water content and rapid changes in water table depth. Groundwater and soil water content displayed a strong linear association (R2 = 0.89) when the water table was within 3 m from the ground surface, which was likely related to the influence of the capillary fringe. For the analyzed rainfall events in 2014, the response time for both deeper soil water content and groundwater was similar, with hydrologic responses preceding the streamflow peak by at least 4 h. These results highlight the importance of monitoring soil water content deeper in the column and including both SWC and groundwater data in potential flood forecast systems.
The transformation of rainfall into streamflow is a complex process that we simplified in this study. Additional analyses using physically based coupled surface-subsurface models or non-linear or stochastic models are recommended for more rigorous analysis.
Acknowledgments
This work was partially funded by the United States Department of Agriculture under the award number: 69-6114-15-011.
Author Contributions
Antonio Arenas, Keith Schilling, and Larry Weber conceived and designed the study. James Niemeier installed and maintained most of the sensors used in this study. Antonio Arenas and Keith Schilling analyzed the data and wrote the paper. Larry Weber and James Niemeier provided critical feedback on the manuscript.
Conflicts of Interest
The authors declare no conflicts of interest.
References
- Perry, C.A. Significant Floods in the United States during the 20th Century-USGS Measures a Century of Floods; US Geological Survey: Reston, VA, USA, 2000.
- Villarini, G.; Smith, J.A.; Baeck, L.M.; Vitolo, R.; Stephenson, D.B.; Krajewski, W.F. On the frequency of heavy rainfall for the Midwest of the United States. J. Hydrol. 2011, 400, 103–120. [Google Scholar] [CrossRef]
- Villarini, G.; Smith, J.A.; Vecchi, G.A. Changing frequency of heavy rainfall over the central United States. J. Clim. 2013, 26, 351–357. [Google Scholar] [CrossRef]
- Prior, J.C.; Boekhoff, J.L.; Howes, M.R.; Libra, R.D.; VanDorpe, P.E. Iowa’s Groundwater Basics; Iowa Department of Natural Resources: Des Moines, IA, USA, 2003.
- Schilling, K.E.; Gassman, P.W.; Kling, C.L.; Campbell, T.; Jha, M.K.; Wolter, C.F.; Arnold, J.G. The potential for agricultural land use change to reduce flood risk in a large watershed. Hydrol. Process. 2014, 28, 3314–3325. [Google Scholar] [CrossRef]
- Corbett, D.M. Stream-Gaging Procedure, a Manual Describing Methods and Practices of the Geological Survey; U.S. Government Publishing Office: Washington, DC, USA, 1943.
- Sauer, V.B. Standards for the Analysis and Processing of Surface-Water Data and Information Using Electronic Methods; US Geological Survey: Reston, VA, USA, 2002.
- NHWC. Available online: http://www.hydrologicwarning.org/content.aspx?page_id=0&club_id=617218 (accessed on 21 February 2018).
- Penna, D.; van Meerveld, H.J.; Oliviero, O.O.; Zuecco, G.; Assendelft, R.S.; Fontana, G.D.; Borga, M. Seasonal changes in runoff generation in a small forested mountain catchment. Hydrol. Process. 2015, 29, 2027–2042. [Google Scholar] [CrossRef]
- Miller, M.P.; Susong, D.D.; Shope, C.L.; Heilweil, V.M.; Stolp, B.J. Continuous estimation of baseflow in snowmelt-dominated streams and rivers in the Upper Colorado River Basin: A chemical hydrograph separation approach. Water Resour. Res. 2014, 50, 6986–6999. [Google Scholar] [CrossRef]
- Kronholm, S.C.; Capel, P.D. A comparison of high-resolution specific conductance-based end-member mixing analysis and a graphical method for baseflow separation of four streams in hydrologically challenging agricultural watersheds. Hydrol. Process. 2015, 29, 2521–2533. [Google Scholar] [CrossRef]
- Zhang, R.; Li, Q.; Chow, T.L.; Li, S.; Danielescu, S. Baseflow separation in a small watershed in New Brunswick, Canada, using a recursive digital filter calibrated with the conductivity mass balance method. Hydrol. Process. 2013, 27, 2659–2665. [Google Scholar] [CrossRef]
- Legates, D.R.; Mahmood, R.; Levia, D.F.; DeLiberty, T.L.; Quiring, S.M.; Houser, C.; Nelson, F.E. Soil moisture: A central and unifying theme in physical geography. Prog. Phys. Geogr. 2011, 35, 65–86. [Google Scholar] [CrossRef]
- Kim, S.; Lee, H.; Woo, C.N.; Kim, J. Soil moisture monitoring on a steep hillside. Hydrol. Process. 2007, 21, 2910–2922. [Google Scholar] [CrossRef]
- Meyles, E.; Williams, A.; Ternan, L.; Dowd, J. Runoff generation in relation to soil moisture patterns in a small Dartmoor catchment, Southwest England. Hydrol. Process. 2003, 17, 251–264. [Google Scholar] [CrossRef]
- Moore, G.W.; Jones, J.A.; Bond, B.J. How soil moisture mediates the influence of transpiration on streamflow at hourly to interannual scales in a forested catchment. Hydrol. Process. 2011, 25, 3701–3710. [Google Scholar] [CrossRef]
- Radatz, T.F.; Thompson, A.M.; Madison, F.W. Soil moisture and rainfall intensity thresholds for runoff generation in southwestern Wisconsin agricultural watersheds. Hydrol. Process. 2013, 27, 3521–3534. [Google Scholar] [CrossRef]
- Wenninger, J.; Uhlenbrook, S.; Tilch, N.; Leibundgut, C. Experimental evidence of fast groundwater responses in a hillslope/floodplain area in the Black Forest Mountains, Germany. Hydrol. Process. 2004, 18, 3305–3322. [Google Scholar] [CrossRef]
- Dhakal, A.S.; Sullivan, K. Shallow groundwater response to rainfall on a forested headwater catchment in northern coastal California: Implications of topography, rainfall, and throughfall intensities on peak pressure head generation. Hydrol. Process. 2014, 28, 446–463. [Google Scholar] [CrossRef]
- Ibrahimi, M.K.; Miyazaki, T.; Nishimura, T. A high measurement frequency based assessment of shallow groundwater fluctuations in Metouia Oasis, South Tunisia. Hydrol. Res. Lett. 2010, 4, 75–79. [Google Scholar] [CrossRef]
- Dudley-Southern, M.; Binley, A. Temporal responses of groundwater-surface water exchange to successive storm events. Water Resour. Res. 2015, 51, 1112–1126. [Google Scholar] [CrossRef]
- Prism, C.D. Northwest Alliance for Computational Science and Engineering. Available online: http://www.prism.oregonstate.edu/ (accessed on 21 February 2018).
- Sanford, W.E.; Selnick, D.L. Estimation of Evapotranspiration across the Conterminous United States Using a Regression with Climate and Land-Cover Data. J. Am. Water Resour. Assoc. 2013, 49, 217–230. [Google Scholar] [CrossRef]
- Service, U.S.N.R.C. Soil Survey Geographic (SSURGO) Data Base: Data Use Information; United States Department of Agriculture: Washington, DC, USA, 1995.
- Depth to Bedrock: Isopach of Unconsolidated Materials. Available online: https://catalog.data.gov/dataset/depth-to-bedrock-isopach-of-unconsolidated-materials (accessed on 21 February 2018).
- Penna, D.; Tromp-van, M.H.J.; Gobbi, A.B.M.; Dolla, F.G. The influence of soil moisture on threshold runoff generation processes in an alpine headwater catchment. Hydrol. Earth Syst. Sci. 2011, 15, 689. [Google Scholar] [CrossRef]
- Abdul, A.; Gillham, R. Field studies of the effects of the capillary fringe on streamflow generation. J. Hydrol. 1989, 112, 1–18. [Google Scholar] [CrossRef]
- Ghasemizade, M.; Schirmer, M. Subsurface flow contribution in the hydrological cycle: Lessons learned and challenges ahead—A review. Environ. Earth Sci. 2013, 69, 707–718. [Google Scholar] [CrossRef]
- Khaled, I.M.; Tsuyoshi, M.; Kohei, N.; Taku, N.; Hiromi, I. Experimental and modeling investigation of shallow water table fluctuations in relation to reverse Wieringermeer effect. Open J. Soil Sci. 2011, 1, 17–24. [Google Scholar] [CrossRef]
- Gillham, R. The capillary fringe and its effect on water-table response. J. Hydrol. 1984, 67, 307–324. [Google Scholar] [CrossRef]
- Scipal, K.; Scheffler, C.; Wagner, W. Soil moisture-runoff relation at the catchment scale as observed with coarse resolution microwave remote sensing. Hydrol. Earth Syst. Sci. Discuss. 2005, 2, 417–448. [Google Scholar] [CrossRef]
- Mellander, P.-E.; Melland, A.R.; Jordan, P.; Wall, D.P.; Murphy, P.N.C.; Shortle, G. Quantifying nutrient transfer pathways in agricultural catchments using high temporal resolution data. Environ. Sci. Policy 2012, 24, 44–57. [Google Scholar] [CrossRef]
- Cloke, H.; Anderson, M.G.; McDonnell, J.J.; Renaud, J.-P. Using numerical modelling to evaluate the capillary fringe groundwater ridging hypothesis of streamflow generation. J. Hydrol. 2006, 316, 141–162. [Google Scholar] [CrossRef]
- Fiori, A.; Romanelli, M.; Cavalli, D.J.; Russo, D. Numerical experiments of streamflow generation in steep catchments. J. Hydrol. 2007, 339, 183–192. [Google Scholar] [CrossRef]
- Wang, W. Stochasticity, Nonlinearity and Forecasting of Streamflow Processes; Ios Press: Amsterdam, The Netherlands, 2006. [Google Scholar]
- Olyaie, E.; Banejad, H.; Chau, K.-W.; Melesse, A.M. A comparison of various artificial intelligence approaches performance for estimating suspended sediment load of river systems: A case study in United States. Environ. Monit. Assess. 2015, 187, 189. [Google Scholar] [CrossRef] [PubMed]
- Chau, K.-W. Use of Meta-Heuristic Techniques in Rainfall-Runoff Modelling; Multidisciplinary Digital Publishing Institute: Basel, Switzerland, 2017. [Google Scholar]
- Taormina, R.; Chau, K.-W.; Sivakumar, B. Neural network river forecasting through baseflow separation and binary-coded swarm optimization. J. Hydrol. 2015, 529, 1788–1797. [Google Scholar] [CrossRef]
- Gholami, V.; Chau, K.-W.; Fadaee, F.; Torkaman, J.; Ghaffari, A. Modeling of groundwater level fluctuations using dendrochronology in alluvial aquifers. J. Hydrol. 2015, 529, 1060–1069. [Google Scholar] [CrossRef]
- Chen, X.Y.; Chau, K.-W. A hybrid double feedforward neural network for suspended sediment load estimation. Water Resour. Manag. 2016, 30, 2179–2194. [Google Scholar] [CrossRef]
- Wang, W.-C.; Xu, D.-M.; Chau, K.-W.; Lei, G.-J. Assessment of river water quality based on theory of variable fuzzy sets and fuzzy binary comparison method. Water Resour. Manag. 2014, 28, 4183–4200. [Google Scholar] [CrossRef]
- Borga, M.; Anagnostou, E.N.; Blöschl, G.; Creutin, J.-D. Flash flood forecasting, warning and risk management: The HYDRATE project. Environ. Sci. Policy 2011, 14, 834–844. [Google Scholar] [CrossRef]
- Hapuarachchi, H.; Wang, Q.; Pagano, T. A review of advances in flash flood forecasting. Hydrol. Process. 2011, 25, 2771–2784. [Google Scholar] [CrossRef]
- Regonda, S.; Seo, D.-J.; Lawrence, B.; Brown, J.D.; Demargne, J. Short-term ensemble streamflow forecasting using operationally-produced single-valued streamflow forecasts—A Hydrologic Model Output Statistics (HMOS) approach. J. Hydrol. 2013, 497, 80–96. [Google Scholar] [CrossRef]
- Adams, B.; Bloomfield, J.P.; Gallagher, A.J.; Jackson, C.R.; Rutter, H.K.; Williams, A.T. An early warning system for groundwater flooding in the Chalk. Q. J. Eng. Geol. Hydrogeol. 2010, 43, 185–193. [Google Scholar] [CrossRef]
© 2018 by the authors. Licensee MDPI, Basel, Switzerland. This article is an open access article distributed under the terms and conditions of the Creative Commons Attribution (CC BY) license (http://creativecommons.org/licenses/by/4.0/).