Article

Flow Velocity Distribution Towards Flowmeter Accuracy: CFD, UDV, and Field Tests

1
CERIS, Instituto Superior Técnico, Universidade de Lisboa, 1049-001 Lisboa, Portugal
2
Department of Hydraulic, Geotechnical and Environmental Engineering, Università di Napoli Federico II, via Claudio, 21, Napoli 80125, Italy
*
Author to whom correspondence should be addressed.
Water 2018, 10(12), 1807; https://doi.org/10.3390/w10121807
Submission received: 22 October 2018 / Revised: 4 December 2018 / Accepted: 6 December 2018 / Published: 8 December 2018
(This article belongs to the Special Issue New Challenges in Water Systems)

Abstract

:
Inconsistences regarding flow measurements in real hydraulic circuits have been detected. Intensive studies stated that these errors are mostly associated to flowmeters, and the low accuracy is connected to the perturbations induced by the system layout. In order to verify the source of this problem, and assess the hypotheses drawn by operator experts, a computational fluid dynamics (CFD) model, COMSOL Multiphysics 4.3.b, was used. To validate the results provided by the numerical model, intensive experimental campaigns were developed using ultrasonic Doppler velocimetry (UDV) as calibration, and a pumping station was simulated using as boundary conditions the values measured in situ. After calibrated and validated, a new layout/geometry was proposed in order to mitigate the observed perturbations.

1. Introduction

Worldwide, water companies use several flowmeters to measure the amount of water distributed. This equipment is quite vital for the management of water companies since important improvements are made according to the data provided by the available measures. The data provided by these devices also influences several performance indicators regarding the management of the system, such as non-revenue water (NRW) and water balances. The NRW is the volume of treated water that is not purchased. The water balances are important tools to detect leaks throughout the supply and distribution processes. Both these tools require accurate measurements [1].
The flow measurements can be correlated to the system efficiency. Usually, the systems are in part driven by gravity and by pressure differences, which require a pumping station. If the measurement accuracy is guaranteed, a higher energy efficiency level is possible to achieved, making possible a working period plan in the lower energy tariffs depending on the regularization ability and the water needs downstream [2,3].
Thus, the correct measurement by using flowmeters is an extremely important factor in terms of hydraulic system accuracy and management. Amongst other domains, the measured flow values are one of the key issues to detect leaks in pipe systems. Therefore, for any hydraulic system manager, the accuracy in flow measurements has significant impacts regarding both planning and investment decisions. Even when following all the constraints imposed by manufactures, incongruences can be identified in the field [4]. These irregularities suggested many times the occurrence of leaks in pipe systems. This conclusion raises a new problem that was not yet well identified [5].
Hence, this research has the objective to analyze different variables, namely the pipe layout and the way it can disturb the flow and flowmeter accuracy. The purpose is to assess how vertical or horizontal curves, expansions and reductions, among other geometries can influence the flow and, consequently the measurements. To fulfil this goal, the influence of several perturbations were identified, using an electromagnetic flowmeter and ultrasonic Doppler velocimetry (UDV), and compared with the computed velocity profiles, using CFD models. The numerical model was calibrated and validated using the same conditions as the experimental facility. The numerical simulations showed good approximation with the velocity measurements for two different geometries. To evaluate the accuracy of the numerical results, several experimental tests, using two different geometries, were firstly developed, identifying perturbations in the flow measurements, followed by analysis in a real case study.

2. Electromagnetic Flowmeters

Flowmeters are one of the most important and used devices to measure accurately, the volume flow rate [6]. Nowadays there are several types of flowmeters, but the most important for flow measurement are the electromagnetic and the ultrasonic ones. They are characterized for their high accuracy and self-monitoring [7]. According to the authors of [1], electromagnetic flowmeters are only disturbed by existing particles that may change the magnetic properties of each fluid. Properties like temperature, viscosity and the fluid density do not affect the measurements. However, as mentioned in [8], a steady regime is a necessary condition to guarantee accurate measurements.
These flowmeters have two different elements: the primary and the convertor (Figure 1). The first element corresponds to a hollow circular pipe with coils along its length and is set in the pipeline [9,10]. The flow passing through the section, creates an electromagnetic field which is proportional to the volume flow rate. The convertor is the brain element: it creates a magnetic field, reads the voltage, displays the data, and generates outputs. The convertor displays the volume flow rate and the amount of volume passed through.
According to several manufactures, electromagnetic flowmeters assure an accuracy higher than 0.2%, as long as the flow velocities are higher than 1 m/s and the installation requirements are fulfilled. The accuracy of electromagnetic flowmeters depends on the velocity, according to Equation (1) [1] and as represented in Figure 2.
{ 40 U + 6 % U < 0.1   m / s 8 ( U 0.55 ) 2 + 0.38 % 0.1   m / s U   0.5   m / s 0.4 U + 0.6 % 0.5   m / s   U < 1   m / s 0.2 % U 1   m / s
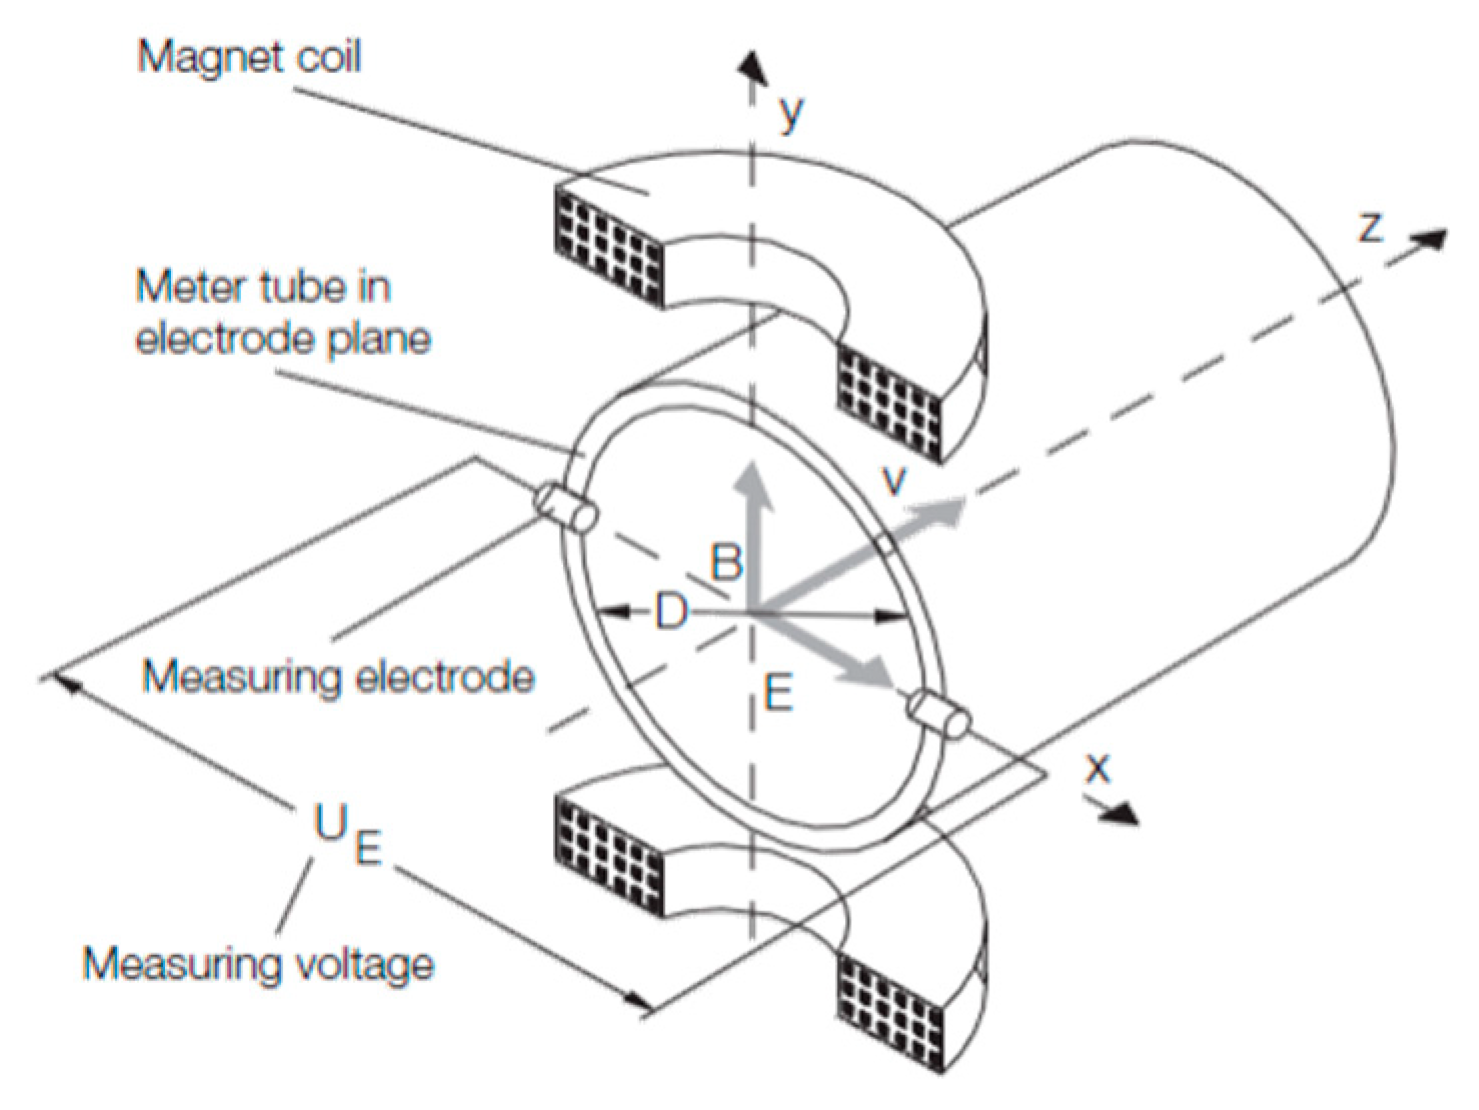
In order to measure the volume flow rate, the Faraday principle is applied in electromagnetic flowmeters. In 1831, Michael Faraday discovered that if an electric conductor is moving in a magnetic field, perpendicular to the direction of the motion, an electrical current is induced and proportional to the magnetic field force, as well as the velocity. If the conductor is water, the flow passing through a magnetic field induces an electrical current proportional to the flow velocity. Figure 3 represents the operating principle, which is important to understand the following developments.
Through mathematical manipulation, the electrical current, UE, induced by the flow passage is directly proportional to the value of the volume flow rate, Q, or U E ~ Q . According to [1], the electrical current induced by the flow is taken into account only in the cross section defined by the electrodes, perpendicular to the flow. In other words, only the parallel component of the velocity is relevant for the volume flow rate measurement [11]. This means that the tri-dimensional nature of flow is disregarded.
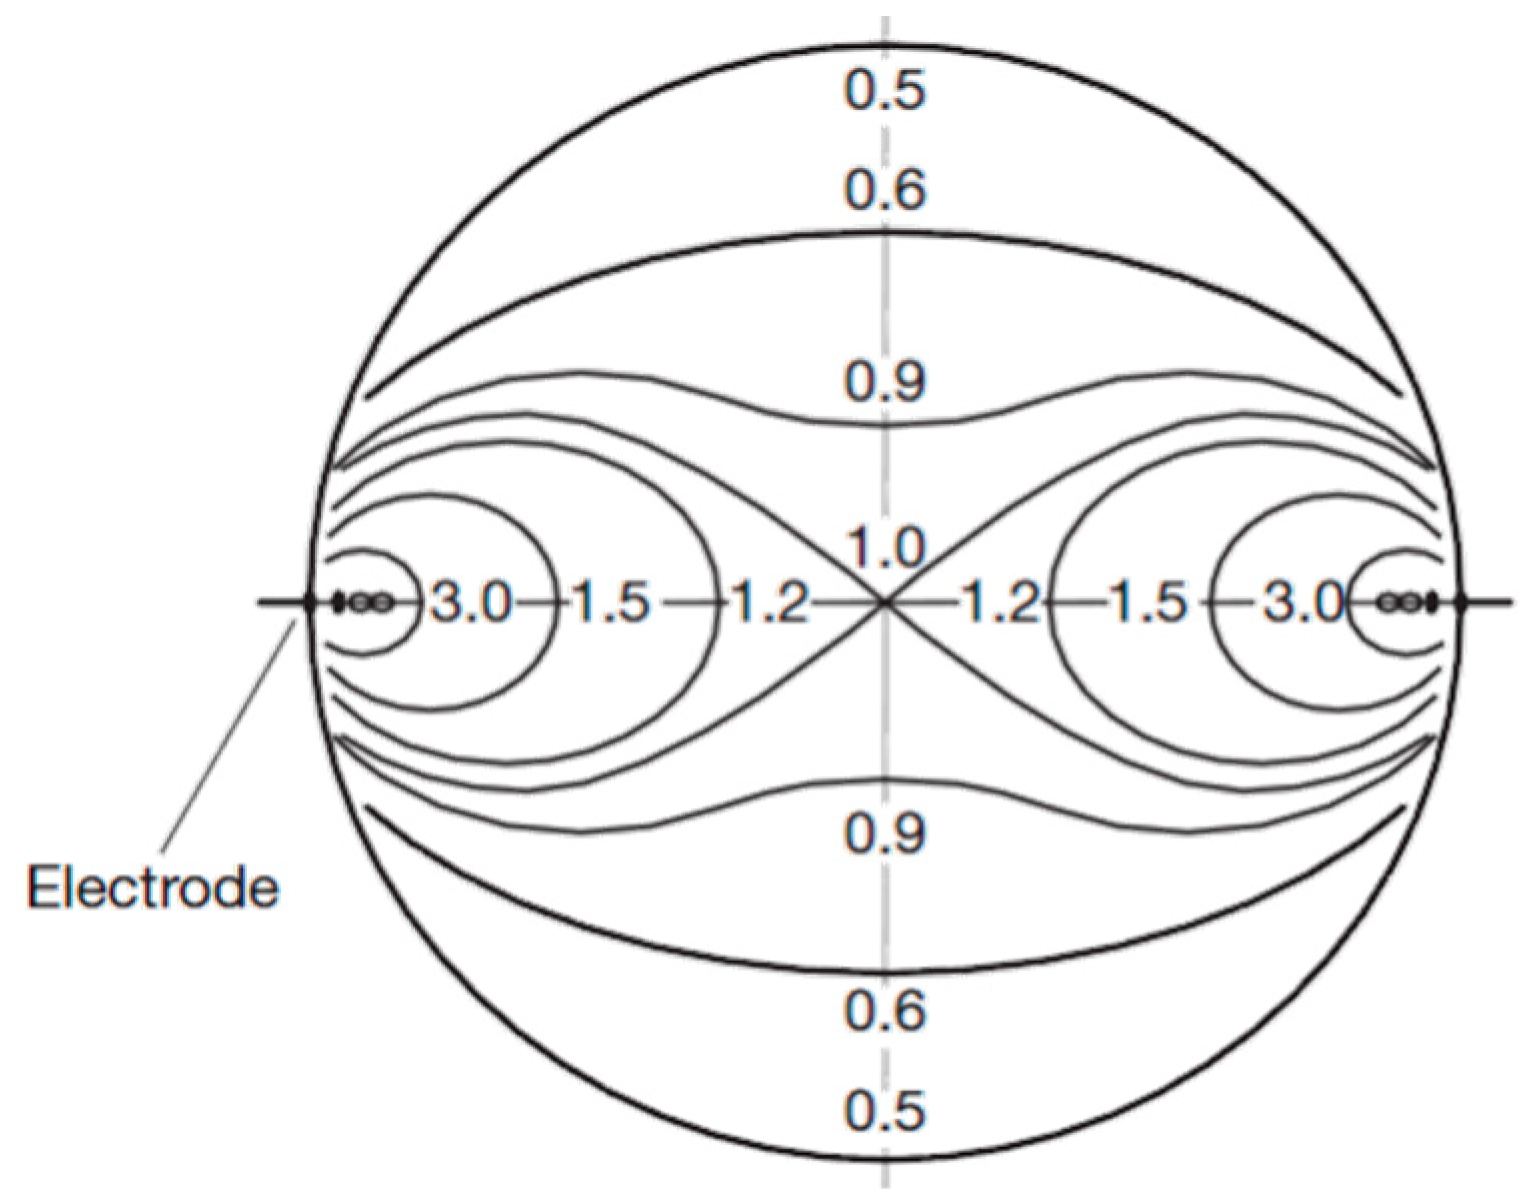
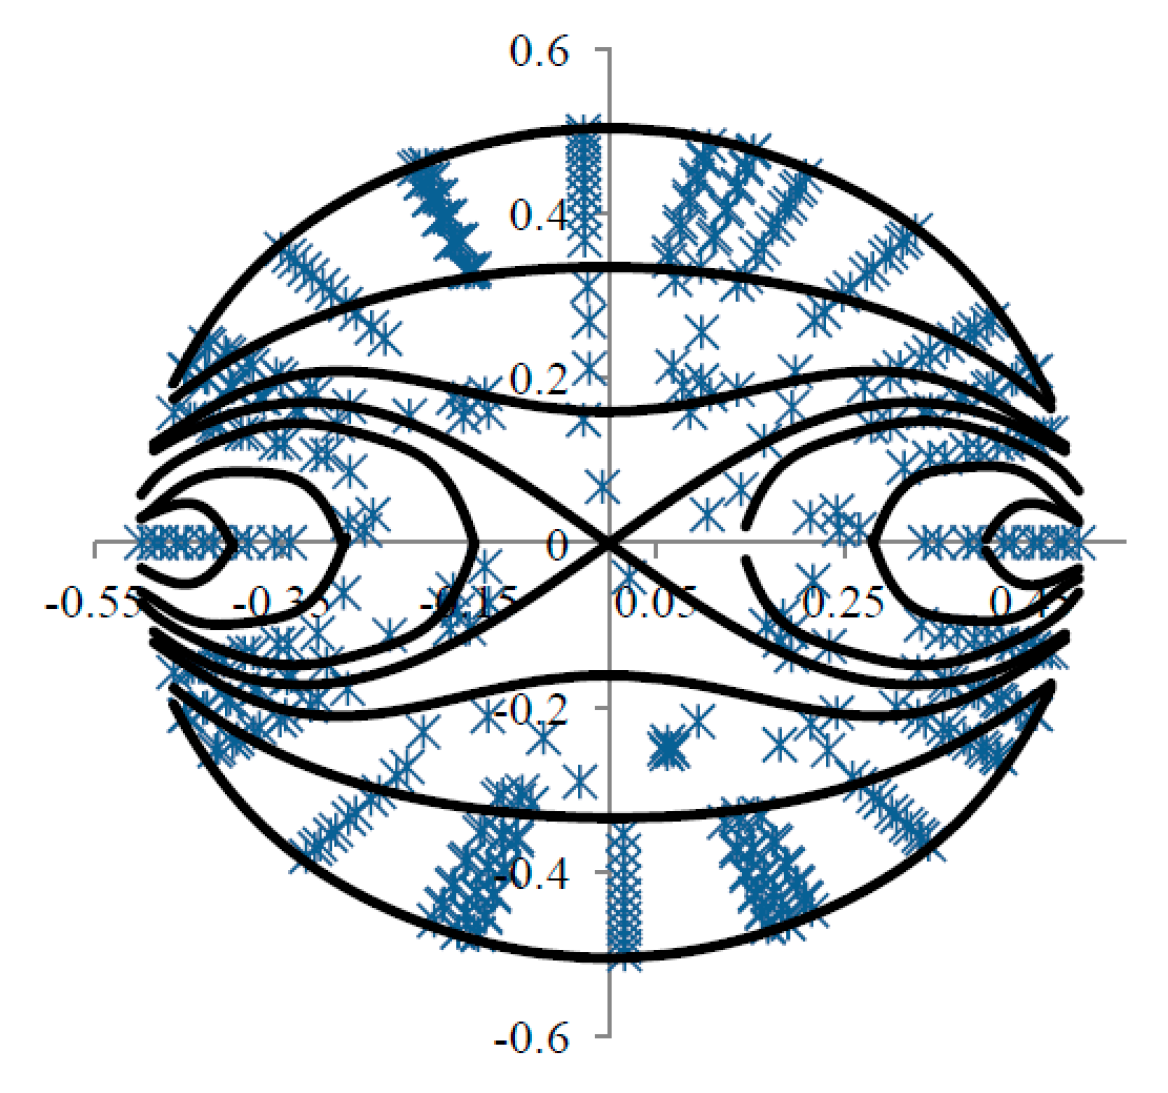
The flow velocity profile is not the same throughout the entire cross section. For that reason, to prevent over or under-evaluations of the flow velocity, the suppliers of this equipment use a weighting factor, W. Figure 4 represents the weighting factor distribution in a cross section.
In Figure 4, each point in the cross section has different weighting factors associated. The sum of the product between the velocity and the respective weighting factor corresponds to the electrical current, which is proportional to the volume flow rate. Although it is a good method to determine the volume flow rate in a homogenous constant magnetic field along symmetric velocity profiles, this formulation does not provide good results for non-symmetric velocity profiles. In these cases, it would over evaluate some values and under evaluate others [1], leading to a inaccurate volume flow rate. To avoid this, the suppliers of the equipment consider a magnetic induction field, B, inversely proportional to the weighting factor W, Equation (2):
W × B = c o n s t
According to Equation (2), for a cross section region in which the weighting factor is small, the magnetic induction field is increased, and vice versa. This action ensures good results even for non-symmetrical velocity profiles [2].

3. Equipment and Layout

3.1. Flow Meter Installation

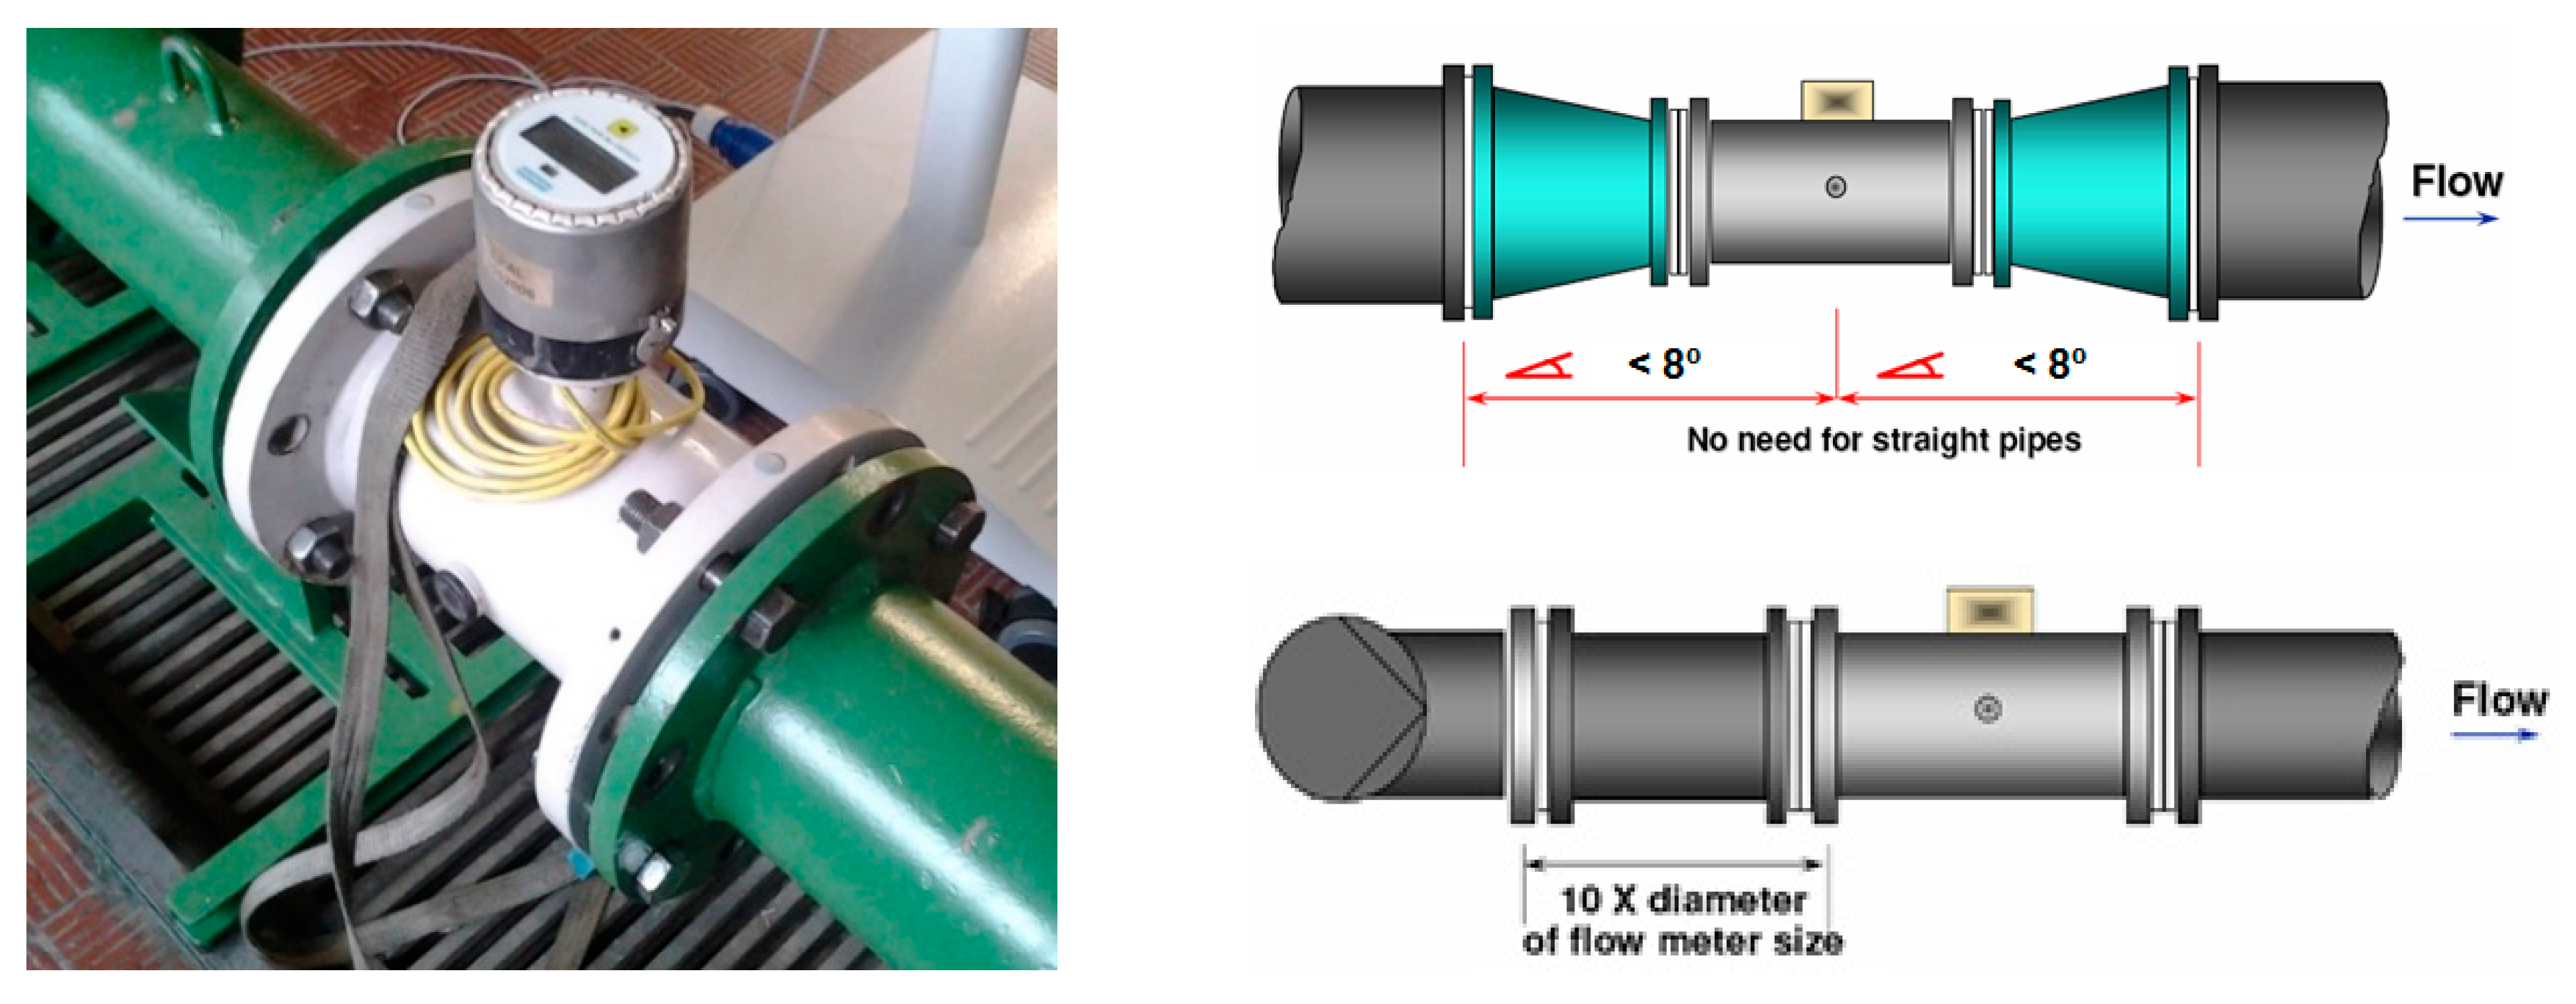
According to several authors [1,2,4], electromagnetic flowmeters (Figure 5) are only disturbed by the existence of particles that might change the magnetic properties of the fluid. Thus, it is necessary to guarantee the existence of linear flow paths, to insure the measurement accuracy. It is therefore necessary to meet the minimum installation requirements for each geometry, specified by each manufacture. Figure 5 presents the installation requirements imposed by the suppliers for the most common geometries.

3.2. UDV Installation

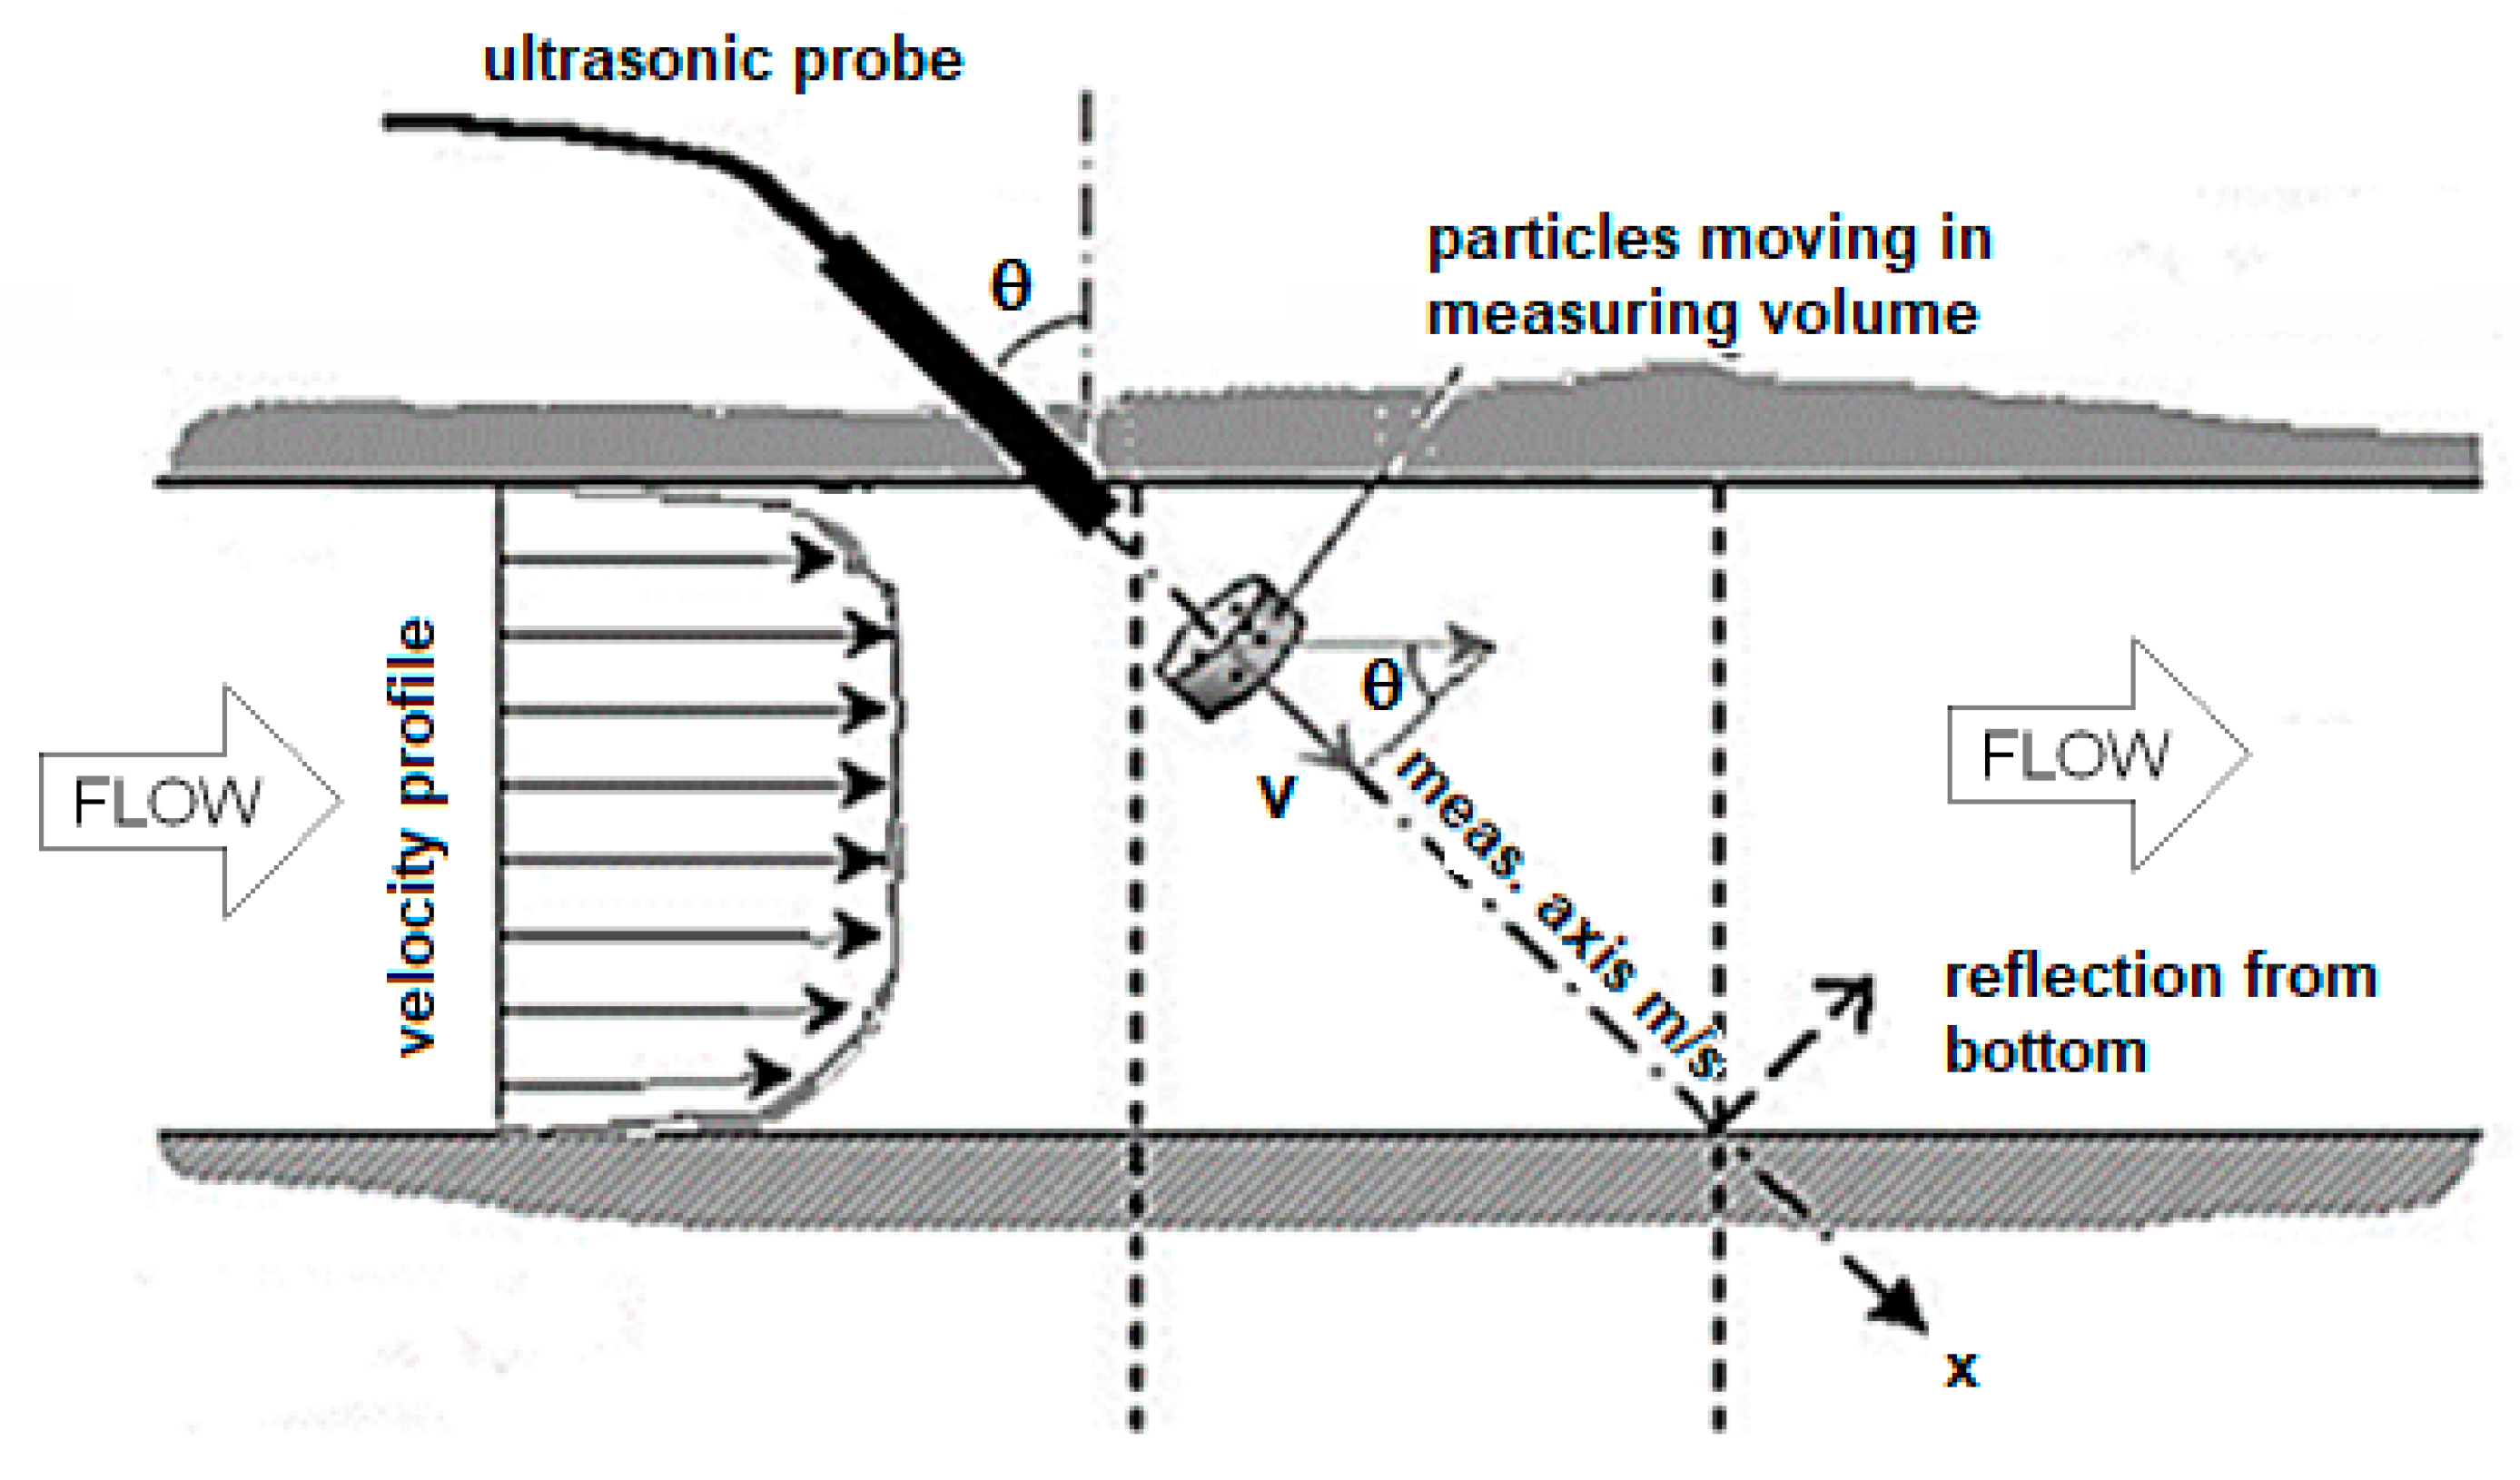
The UDV operating principle is the MET-FLOW approach—an ultrasonic probe is placed near the pipe wall with a certain slope. The ultrasound is emitted and travels across the pipe cross section. When the ultrasound hits a fluid particle, some energy of the ultrasound disperses and produces an echo, which reaches the probe. Then, by a mathematical manipulation, the equipment delivers a velocity value. Figure 6 presents the UDV operating principle.
The UDV uses an ultrasonic wave in order to provide the velocity profile. At a certain time (e.g., t1), a burst is emitted. This burst propagates inside the liquid. At time t2, the burst touches the particle. If the sizes of the particle are much smaller than the wave length, only a very small echo is generated (scattering effect). This echo goes back in direction to the transducer, while the main energy continues its propagation [11,13]. At time t3, the echo reaches the transducer. The depth of the particle, D e p t h = C / 2 ( t 3 t 1 ) , can be determined from the traveling time (t3 − t1), where C is the sound velocity of the acoustic wave in the liquid. Following each emission, the echo signal is sampled at a fixed delay after the emission. This delay defines the depth. However, it the particle moves between the successive emissions the sampled values taken at time ts will change over the time [14]. Depending of the shape of the emitted signal, these values may form a sinusoidal signal. The frequency, F d , of this sinusoidal signal, which is named Doppler frequency, is directly connected to the velocity of the particle, which is given by the Doppler equation [14]:
V = F d C 2 F e C o s θ
where F e is the frequency of the emitted burst.
UDV offers instantaneously a complete velocity profile. Unfortunately, as the information is available only periodically, the maximum velocity (Vmax) exists for each pulse repetition frequency ( F p r f ) [11]:
V m a x = F p r f C 4 F e C o s θ
Thus, the maximum measurable depth (Pmax) is also defined by the pulsed repetition frequency Equation (5), and consequently the product of Pmax and Vmax is constant, and is given by Equation (6) [13,14]:
P m a x = C 2 F p r f
P m a x × V m a x = C 2 8 F e C o s θ
In the presence of air, the equipment signal is not able to read the signal, therefore, the probe needs to be well installed. Thus, the probe is set in a specific probe holder (Figure 6), which is a plastic rectangle with several holes, where each of it has a certain angle associated. This probe holder has two functions: to guarantee the stability to the probe, since it makes possible to attach it to the pipe; and also make sure that there is no air between the pipe and the probe. This is accomplished by inserting a gel in the hole where the probe will be installed, always ensuring contact with it.
Moreover, since UDV uses very sensitive equipment, specially to electromagnetic noise, its reading may be compromised by the electromagnetic field induced by the flowmeters.

3.3. Experimental Facility

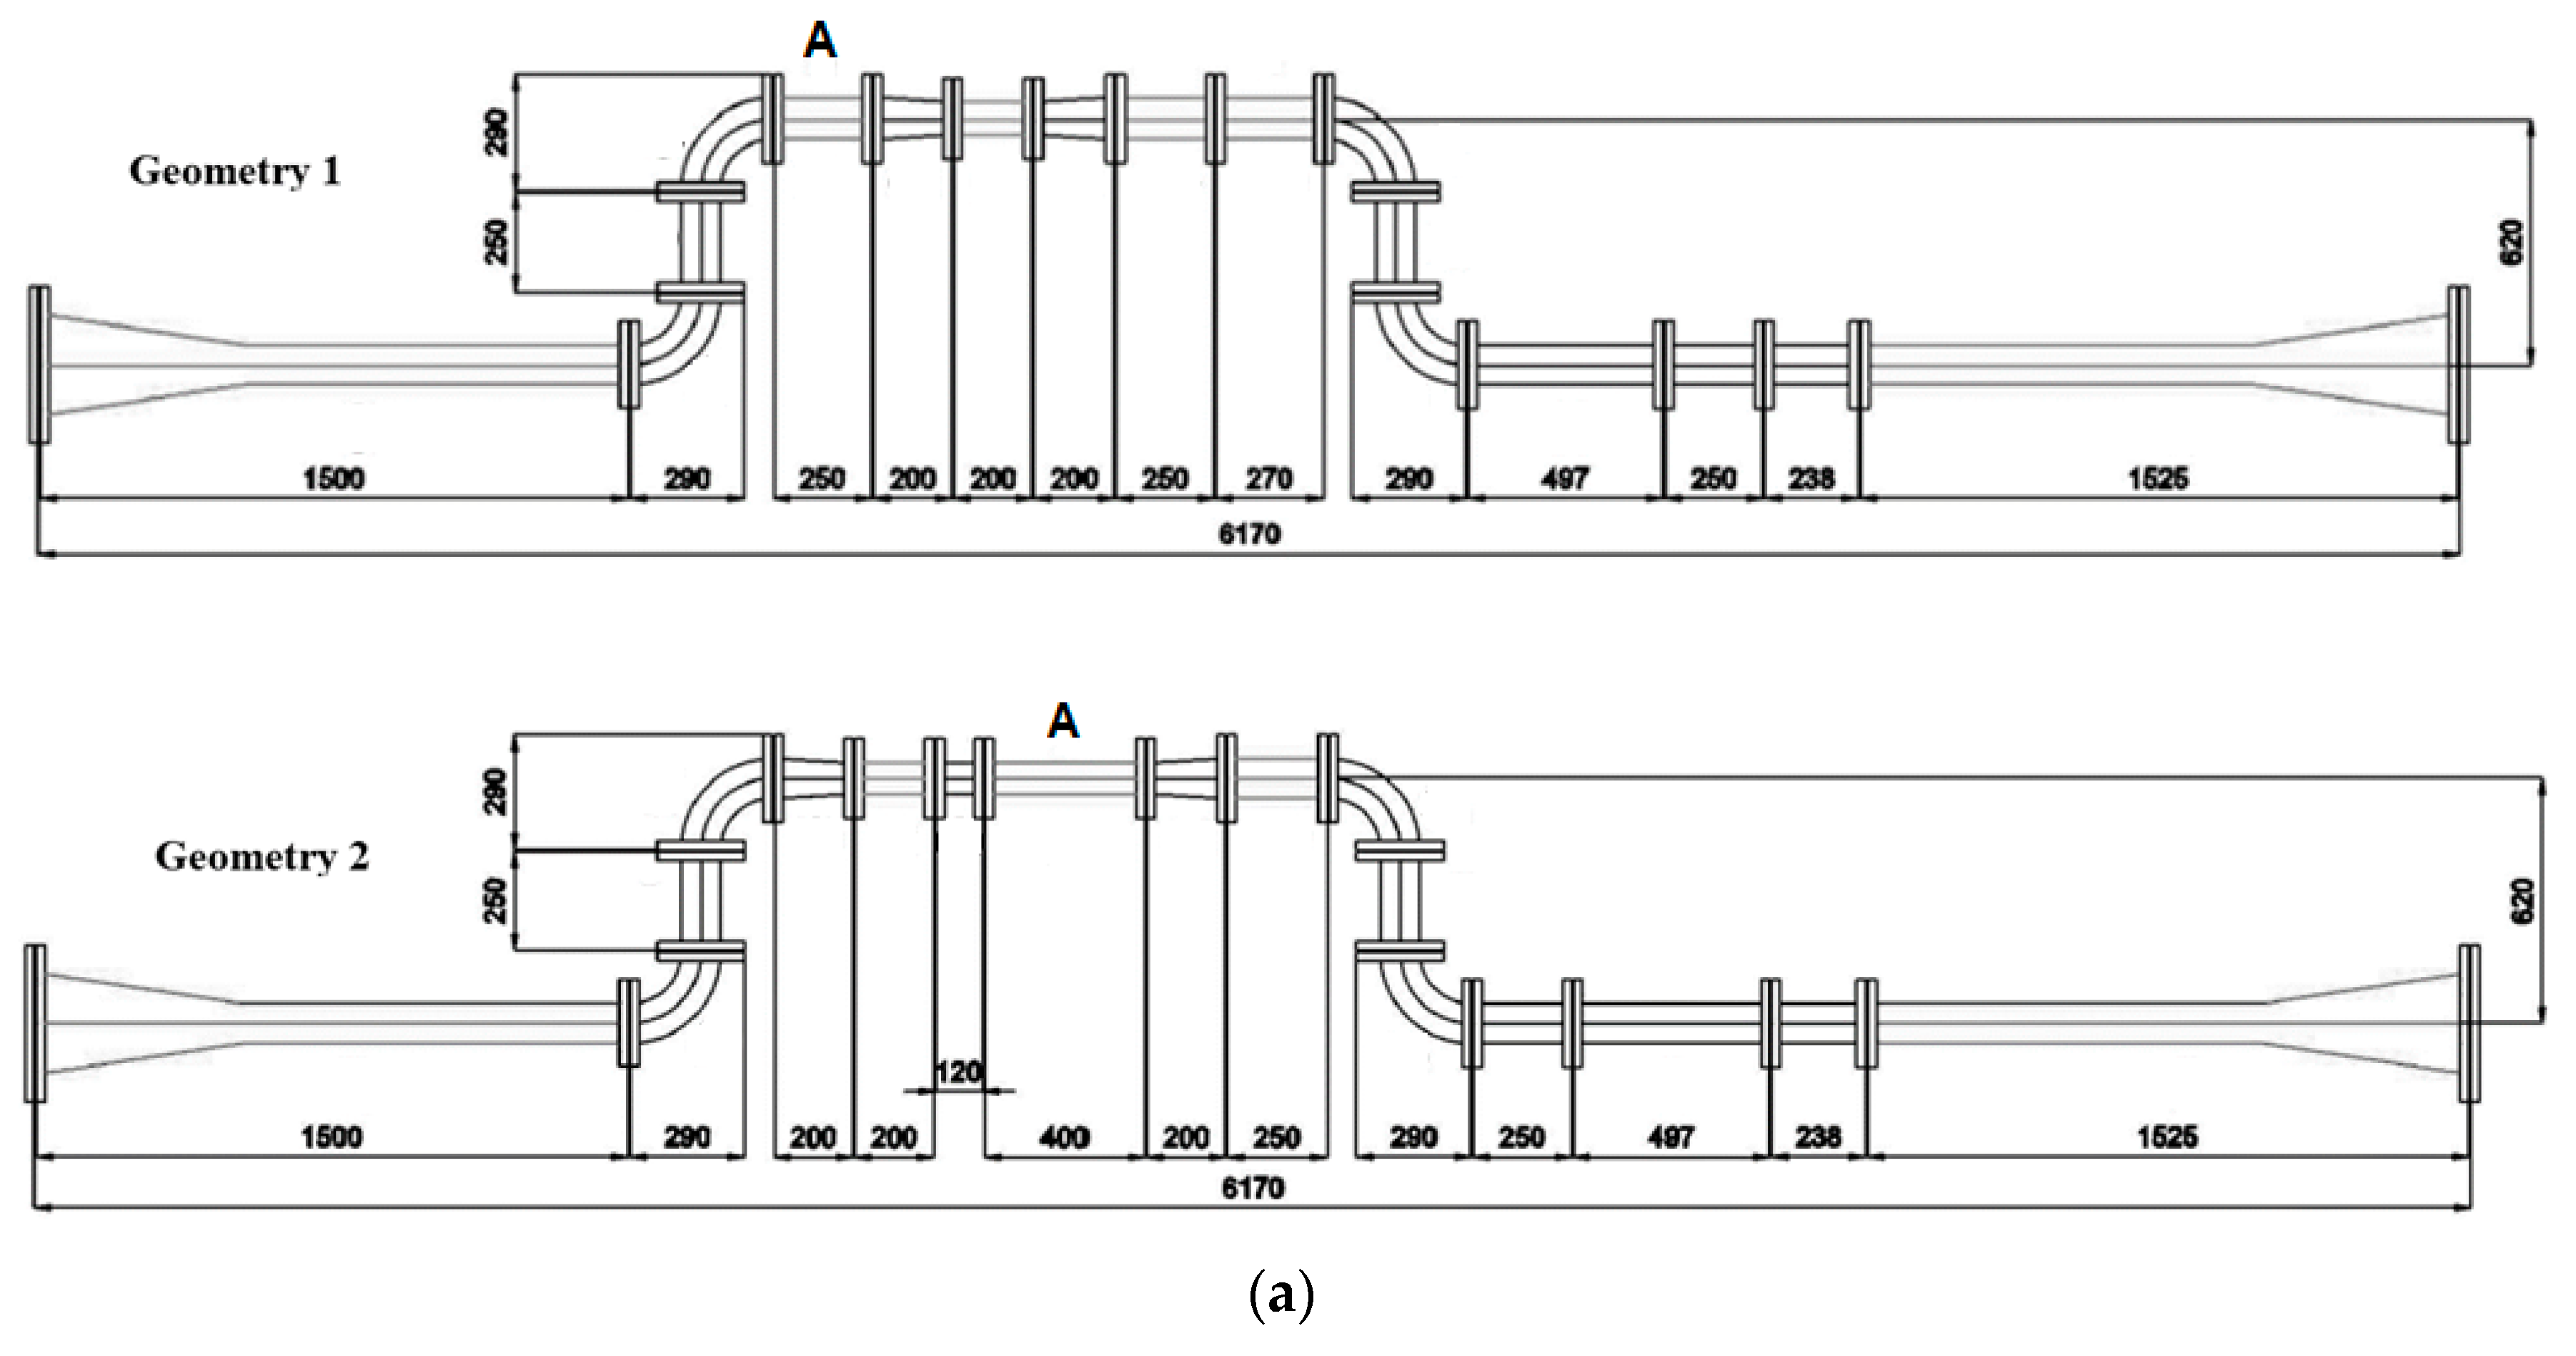
In order to assess the computational results provided by the CFD model, intensive campaigns were developed in an experimental facility, schematically represented in Figure 7, and adapted to two continuous geometries and operating conditions. Regarding this pipe system layout, UVD measurements were made in section A (in Figure 7a). Two different volume flow rates, corresponding to 100 and 12 m3/h were tested. In each UDV measurement, the velocity was captured in 100 different points in a total of 100 profiles.
The results obtained are presented in Table 1 for section A (Figure 7). The flowmeter error decreases as the velocity increases, as it happens for Q = 100 m3/h for both layouts.
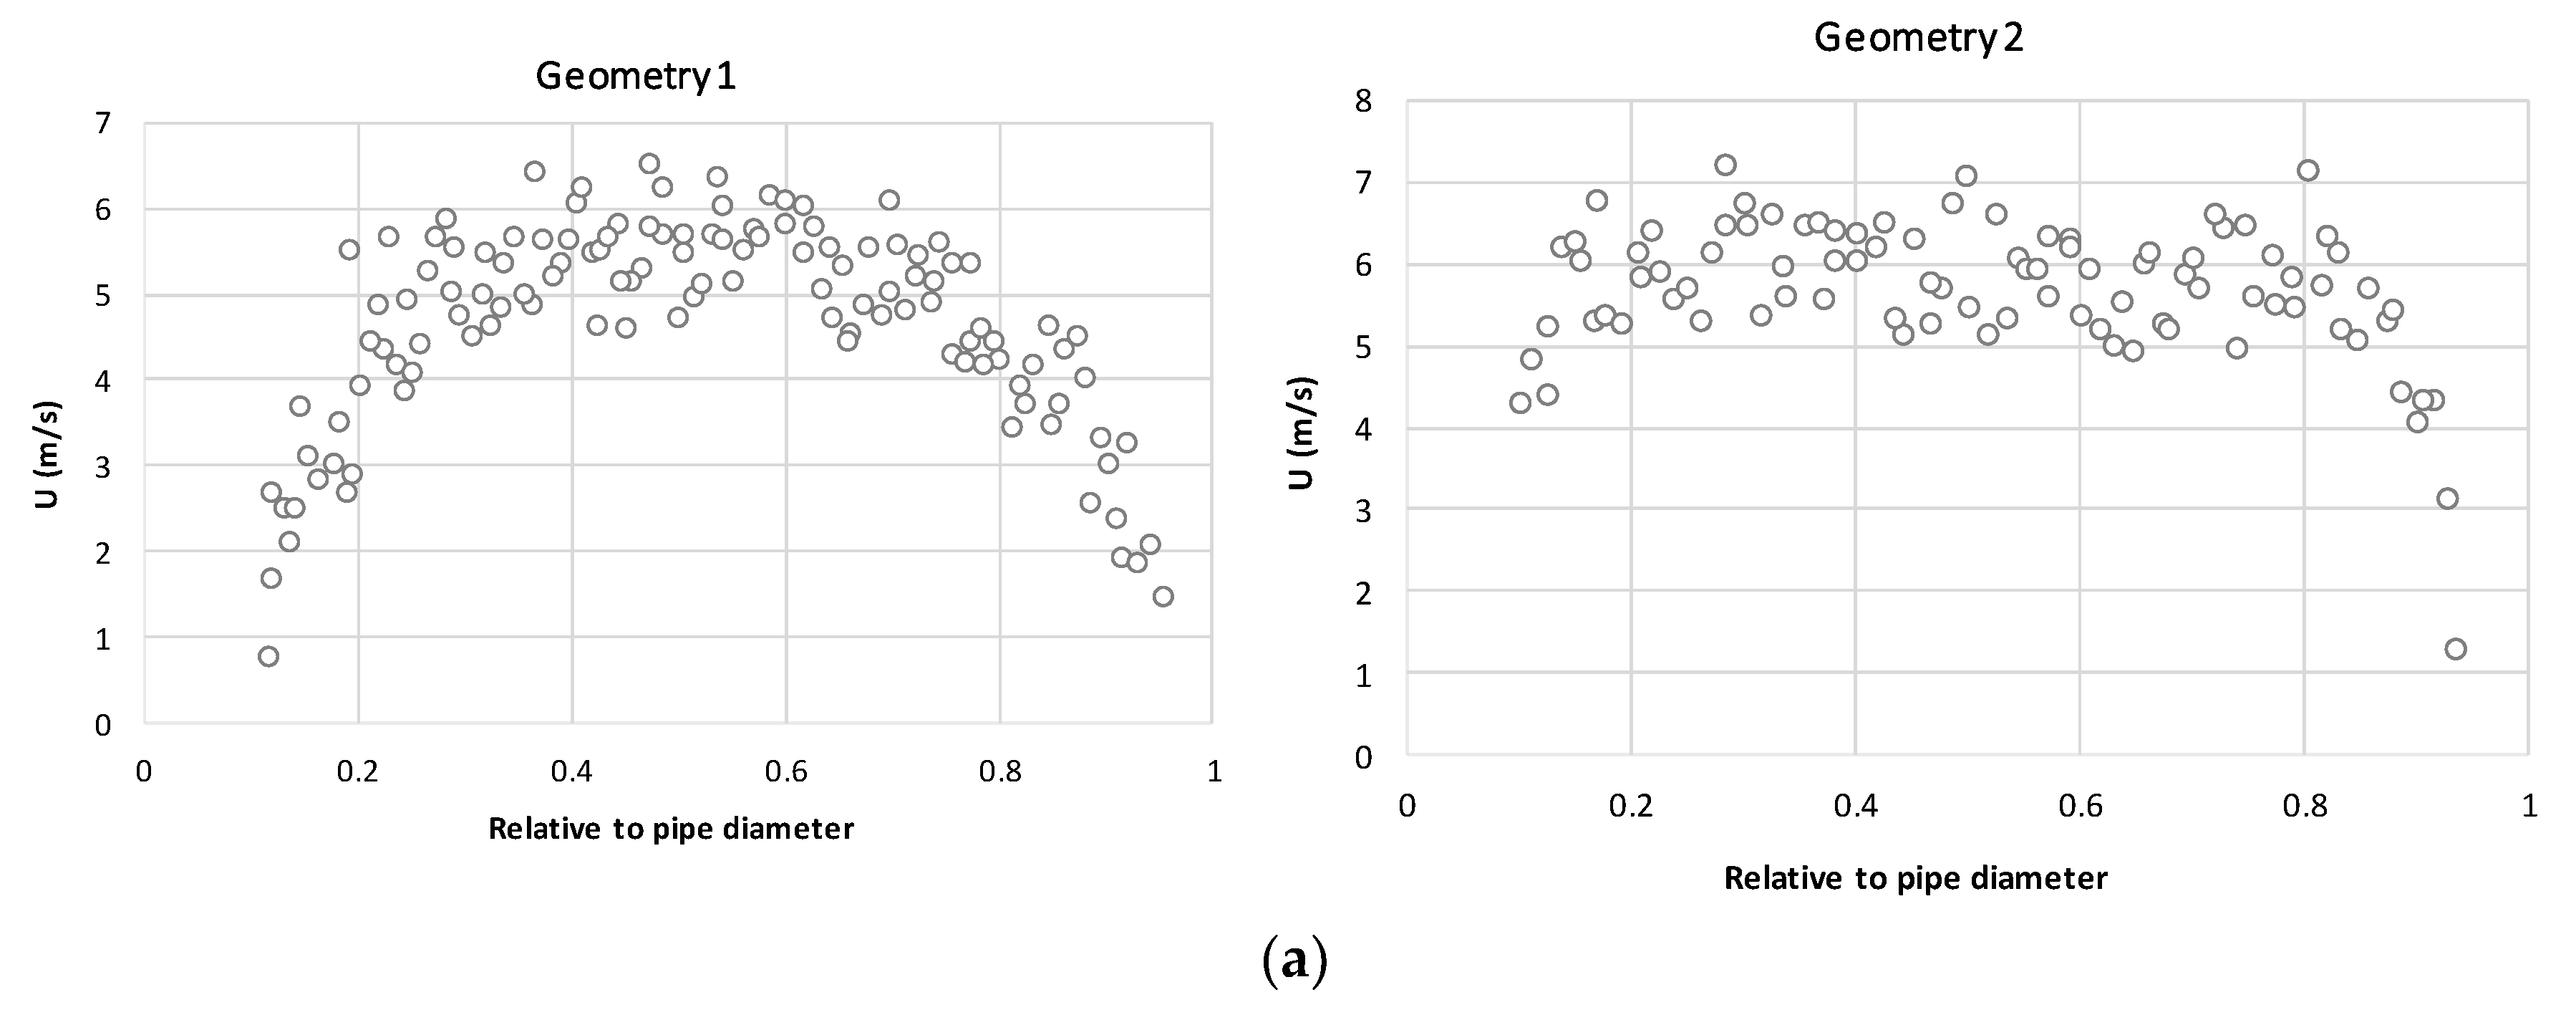
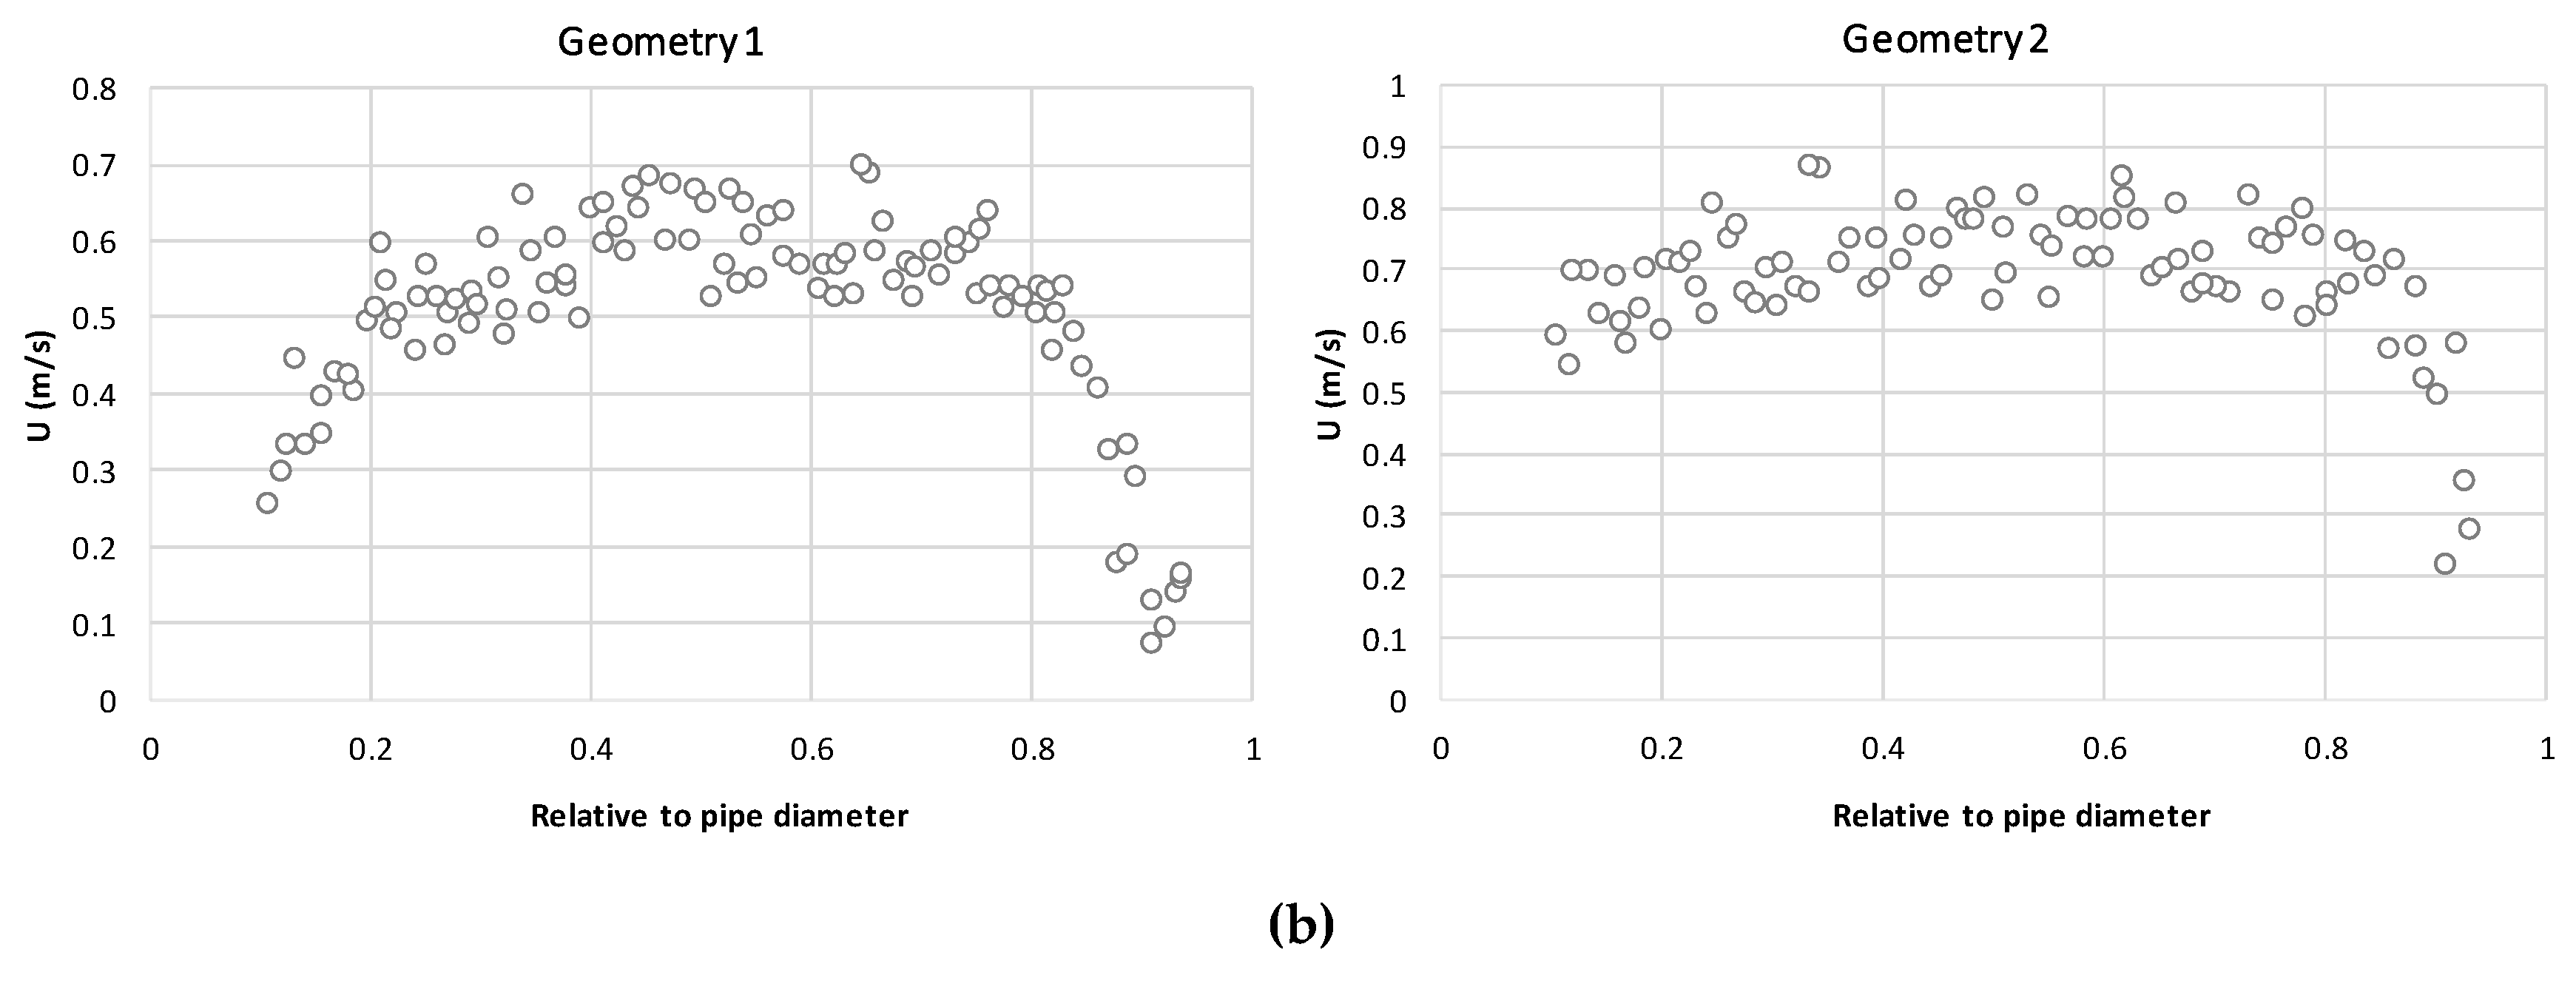
The velocity profiles measured in section A, using the UDV, are presented in Figure 8 for 100 m3/h and 12 m3/h, respectively.

4. CFD Model

4.1. Governing Equations

Computational fluid dynamics (CFD) provide a qualitative and quantitative prediction of fluid flows by means of mathematical and numerical methods. These simulation tools represent an important technological advance towards the detailed understanding of the flow, allowing theoretical considerations regarding the physical behavior of the flow, with mathematical formulations for tri-dimensional modelling analyses [7]. These models make possible, not only to study the behavior of turbulent and laminar flows, but also the multiple forms of exchanges of energy, flow phases, vorticity and turbulence levels [9].
The CFD model used in this work was COMSOL Multiphysics 4.3.b, which presents accurate results for several fluid flow problems [10]. COMSOL is a finite element method (FEM) software, which uses the mass conservation and the RANS (Reynolds averaged Navier–Stokes) equations as governing flow equations:
ρ t + ( ρ u ) x + ( ρ v ) y + ( ρ w ) z = 0
ρ u ¯ j u ¯ i x j = ρ g ¯ i + x j [ p ¯ δ i j + μ ( u ¯ i x j + u ¯ j x i ) ρ u i u j ¯ ]
FEM is a computational method that divides an object into smaller elements. Each element is assigned to a set of characteristic equations that are then solved as a set of simultaneous equations to estimate the behavior of the object [15]. From the available turbulence models, the k-ε model was selected. The k-ε models [16] are the most common and most used models worldwide mostly for industrial applications due to its good convergence rate and relatively low memory requirements. This model solves two variables: k, the turbulence kinetic energy and ε, the rate of dissipation of turbulence kinetic energy. This turbulence model relies on several assumptions, the most important of which is that the Reynolds number is high enough. It is also important that the turbulence is in equilibrium in boundary layers, which means that the production equals the dissipation. These assumptions limit the accuracy of the model because they are not always true, since it does not respond correctly to flows with adverse pressure gradients that can result in under predicting the spatial extension of recirculation zones [17]. Furthermore, in the description of rotating flows, the model often shows poor agreement with experimental data [18]. In most cases, the limited accuracy is a fair trade-off for computational resources saved compared to more complex turbulence models.
While it is possible to modify the k-ε model so that it describes the flow in wall regions, this is not always desirable because of the very high resolution requirements. Instead, analytical expressions are used to describe the flow at the walls [15]. These formulations are known as wall functions. Wall functions ignore the flow field in the buffer region and analytically compute a nonzero fluid velocity at the wall [17,18,19].
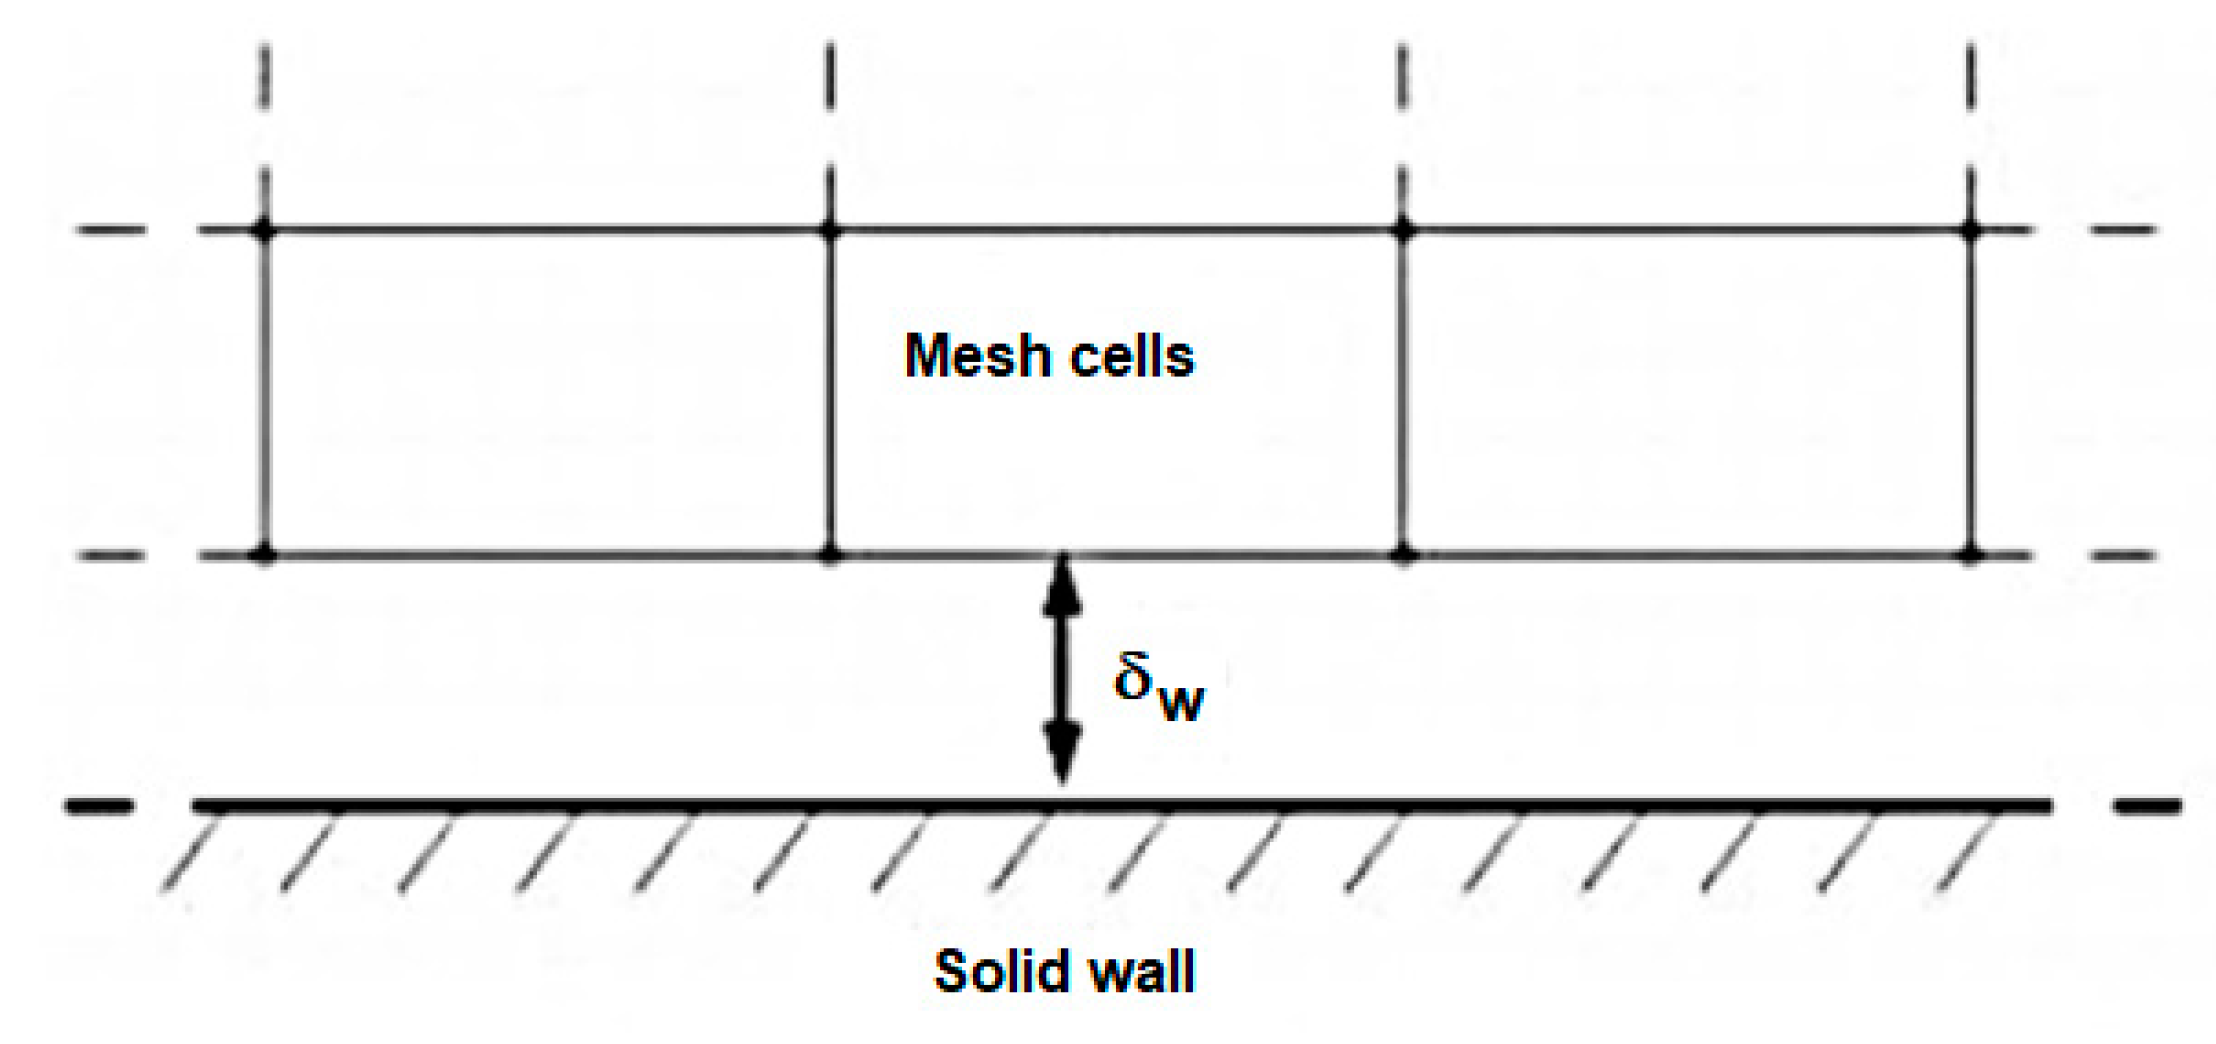
Thus, by using wall functions, the wall lift-off in viscous units δ w + needs to be checked. This value alerts if the mesh at the wall is fine enough and should be 11.06 everywhere. If the mesh resolution in the direction normal to the wall is too coarse, then this value will be greater than 11.06, and a finer boundary layer mesh needs to be applied in these regions. The second variable that should be checked when using wall functions is the wall lift-off δ w (in length units) [18]. This variable is related to the assumed thickness of the viscous layer and should be small relative to the surrounding dimensions of the geometry. If it is not, then the mesh in these regions must be refined, as well.
The wall functions in COMSOL are such that the computational domain is assumed to start a distance δ w from the wall (Figure 9).
Nevertheless, in all simulations the fluid was water, with constant density and viscosity equal to 999.62 Kg/m3 and 1.0097 × 10 6 m2/s, respectively.
In the CFD model, three types of boundary conditions were assigned: inlet, outlet and solid walls. For the inlet boundary condition, the pressure was set, as for the outlet condition, the average velocity. The no-slip condition was considered, which stated that the walls were impermeable. Thus, the boundary conditions used to defined the inlet condition, are governed by the set of the following equations [16]:
p = p 0 [ ( μ + μ T ) ( u + ( u ) T ) 2 3 ρ k l ] × n = 0 k = 3 2 ( U r e f I T ) 2 ε = C μ 3 / 4 k 3 / 2 L T
where p 0 is the input value (of pressure), I T is the turbulent intensity, L T corresponds to the turbulence length scale, l is the mixing length defined by [20], and U r e f is the reference velocity scale.
For the outlet condition, the boundary conditions are expressed by Equation (10), where U 0 corresponds to the average velocity (input value) and, the first equation represents the normal outflow velocity magnitude:
u = U 0 n k × n = 0 ε × n = 0

4.2. Mesh Definition and Solution Convergence

As for the mesh definition, the geometry was discretized into smaller units, called mesh elements. Its resolution and element quality are important aspects to take into account, when validating the model, since the decreasing of resolution can originate low accuracy results [21]. Meanwhile, low mesh element quality can lead to convergence issues [22,23,24].
All calculations have been performed on a PC (Intel 5, CPU 3.90 GHz, RAM 8 GB) with 4 cores and threads running in parallel. The model default uses a physic controlled mesh, which defines, automatically, the size attributes and operations sequences necessary to create a mesh adapted to the problem. This mesh is automatically created and adapted for the model’s physics settings. The default physics-controlled meshing sequences create meshes that consist of different element types and size features, which can be used as a starting point to add, move, disable, and delete meshing operations. Each meshing operation is built in the order it appears in the meshing sequence to produce the final mesh [23]. Customizing the meshing sequence helps to reduce memory requirements by controlling the number, type, and quality of elements, thereby creating an efficient and accurate simulation [25].
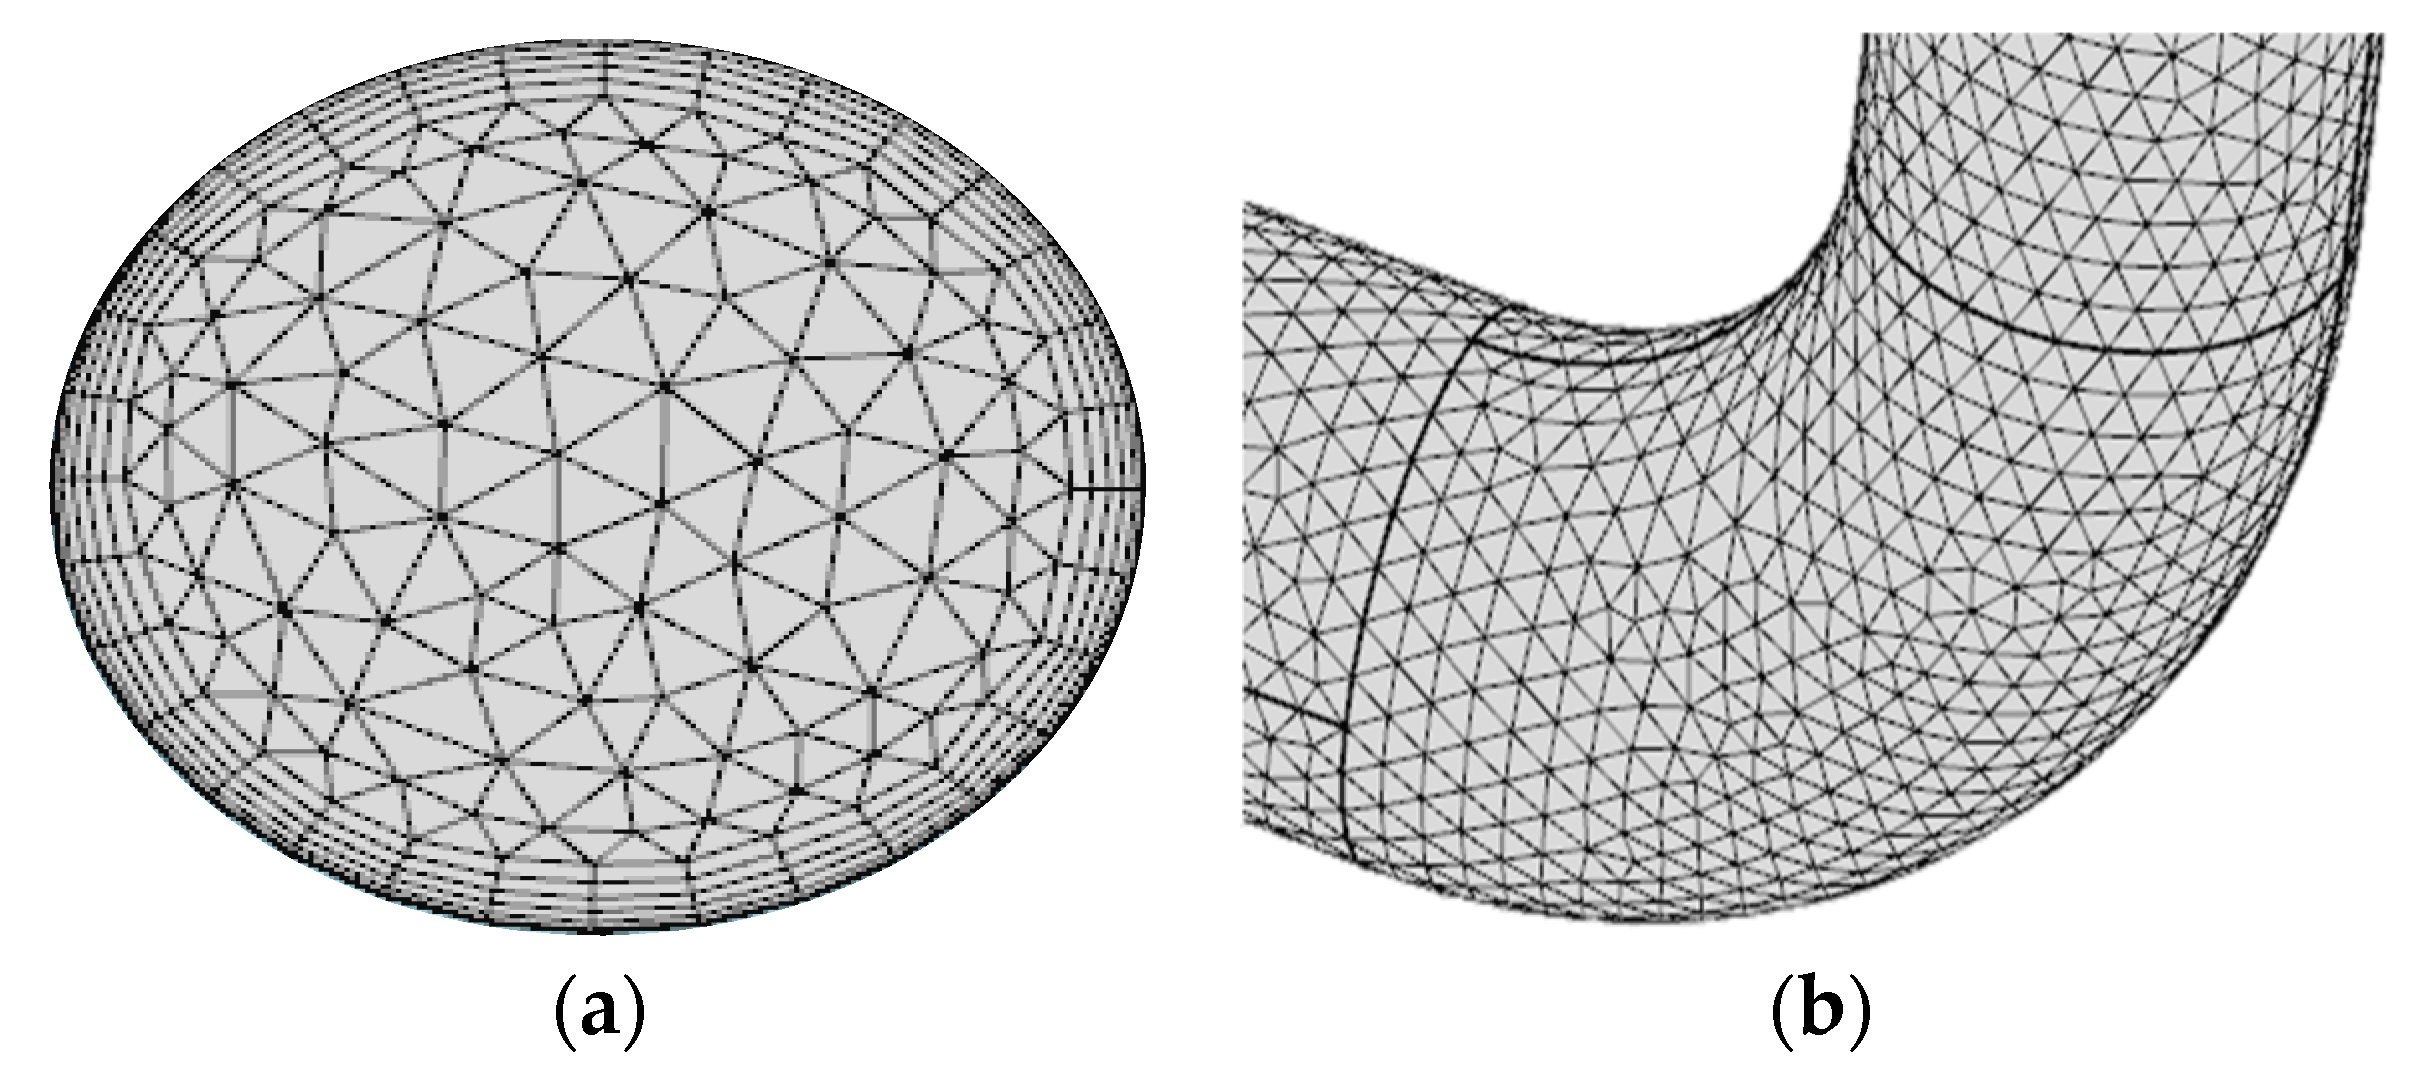
For the fluid-flow model, since the mesh is adapted to the physic setting, the mesh is finer than the default one, with a boundary layer (Figure 10a) in order to solve the thin layer near the solid walls where the gradients of the flow variables are high [26,27,28,29].
To ensure a proper and acceptable accuracy of the results, COMSOL uses an invariant form of the damped Newton method. Starting with Z 0 , the linear model (MUMPS) is solved for the Newton step ( δ Z ) [16]. Afterwards, a new iteration is calculated, according to Equation (7), where λ is the damping factor:
Z 1 = Z 0 + λ δ Z | λ | < 1
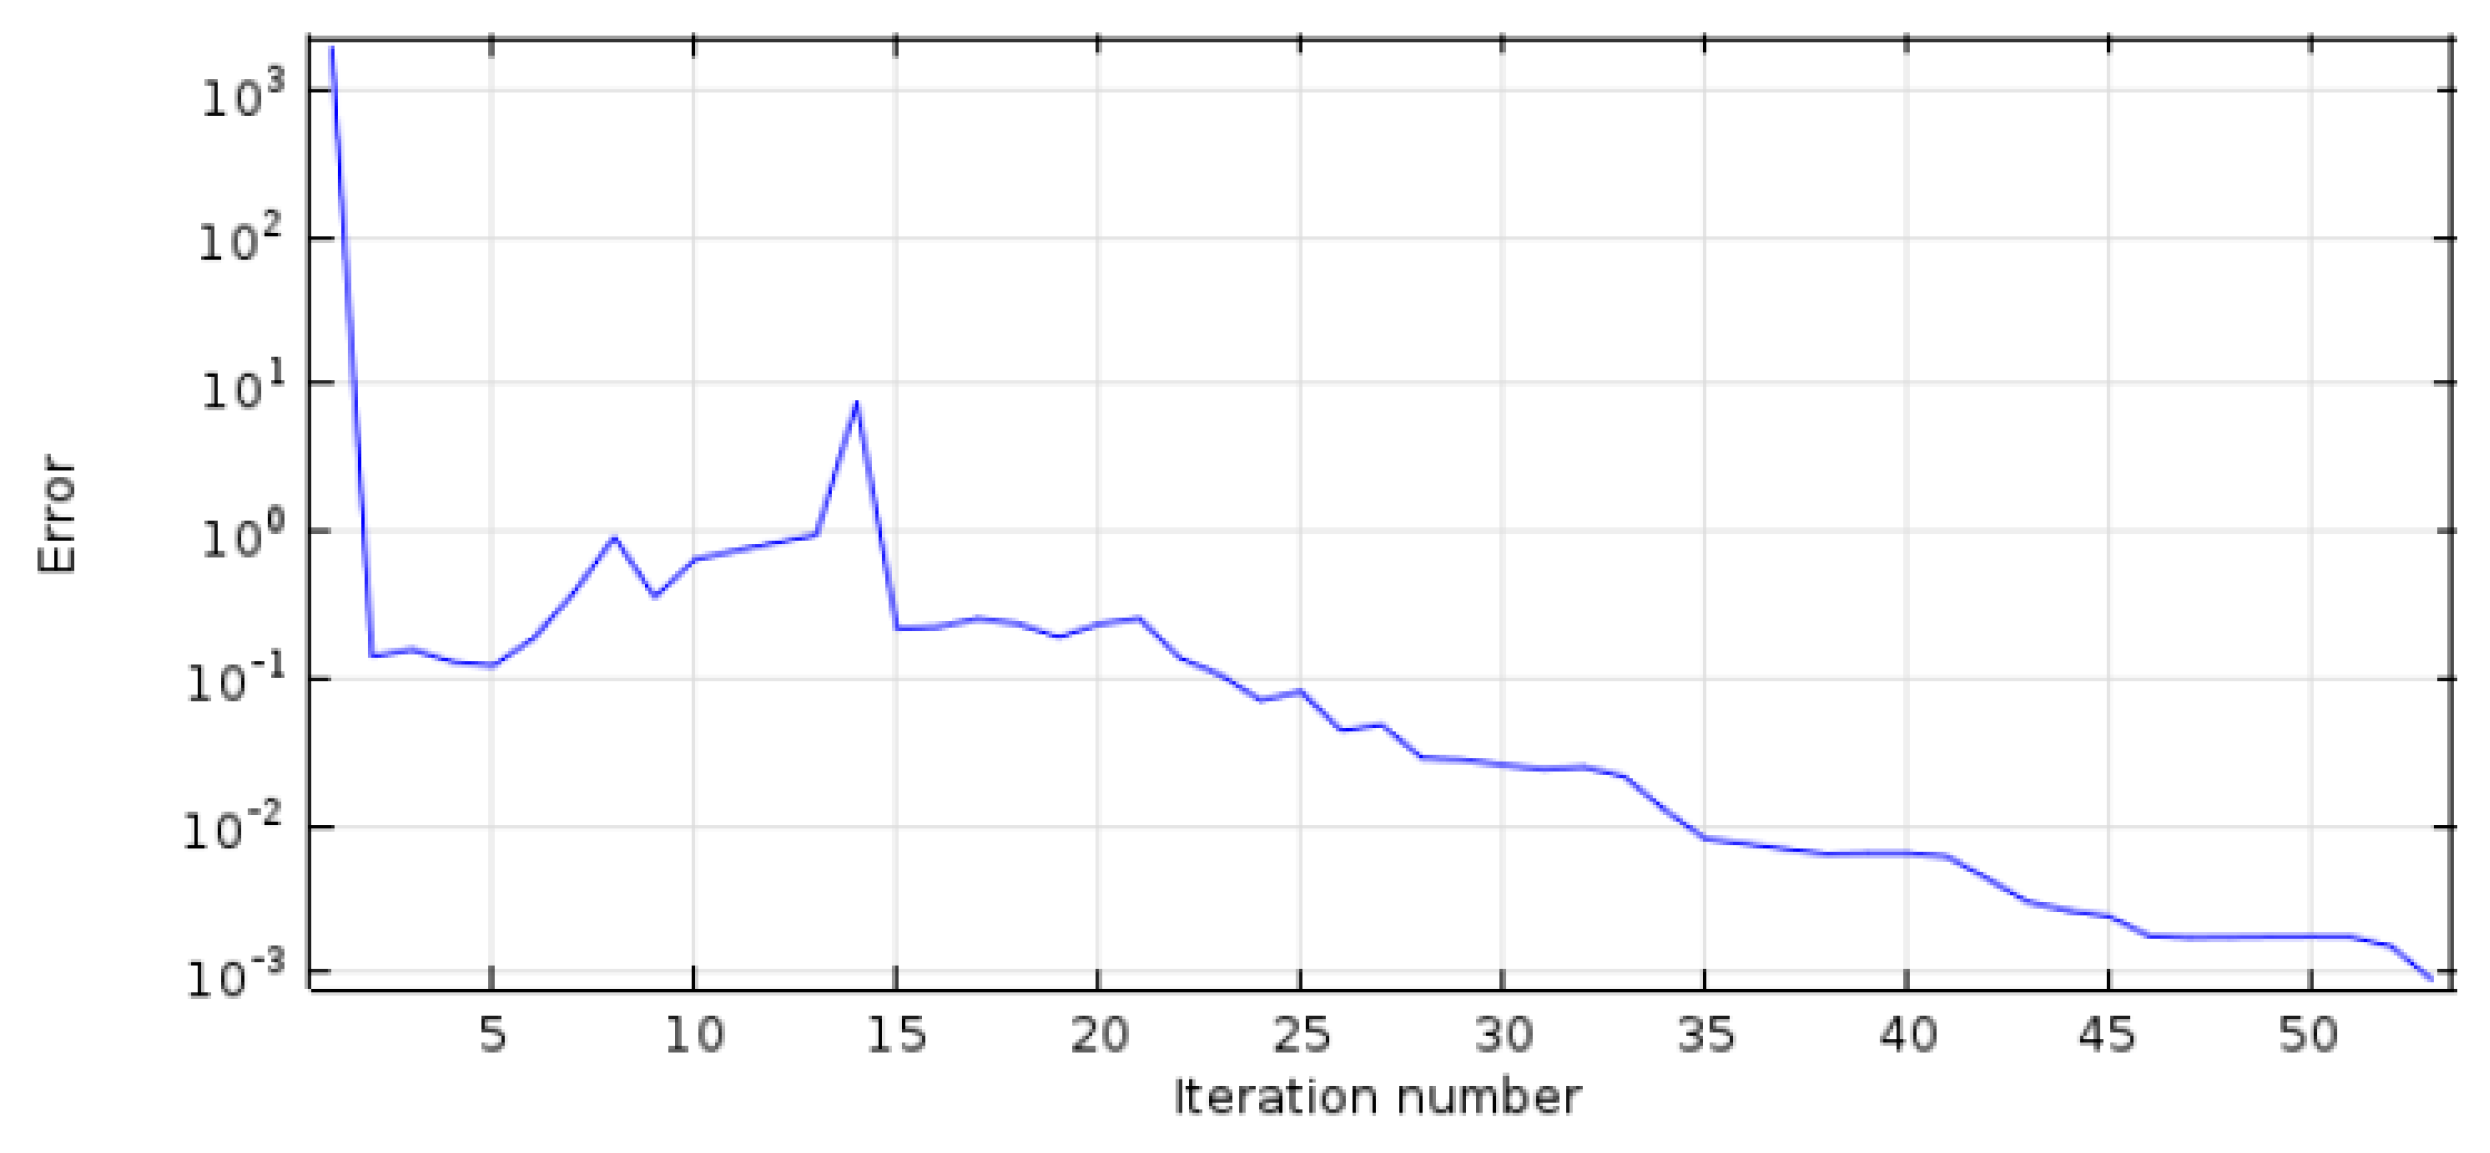
The model estimates the error of the new iteration and, if the error of the current iteration is bigger than the previous one, the code decreases the damping factor and a new iteration process restarts. This procedure will occur until either the error is smaller than the error calculated in the previous iteration or the damping factor reaches its minimum value (i.e., 1 × 10 4 ). When a successful step is reached, the algorithm computes the next iteration. The iteration process finish when the relative tolerance exceeds the relative computed error. The model stops the iteration when the relative error is smaller than 1 × 10 3 and the damping factor is equal to 1. Otherwise the solution would not converge and the iteration would continue. Figure 11 presents the convergence solution reached.

4.3. Calibration and Validation

According to the input data and the respective geometries, presented in Table 2 and in Figure 12, numerical simulations were made and compared with the experimental tests.
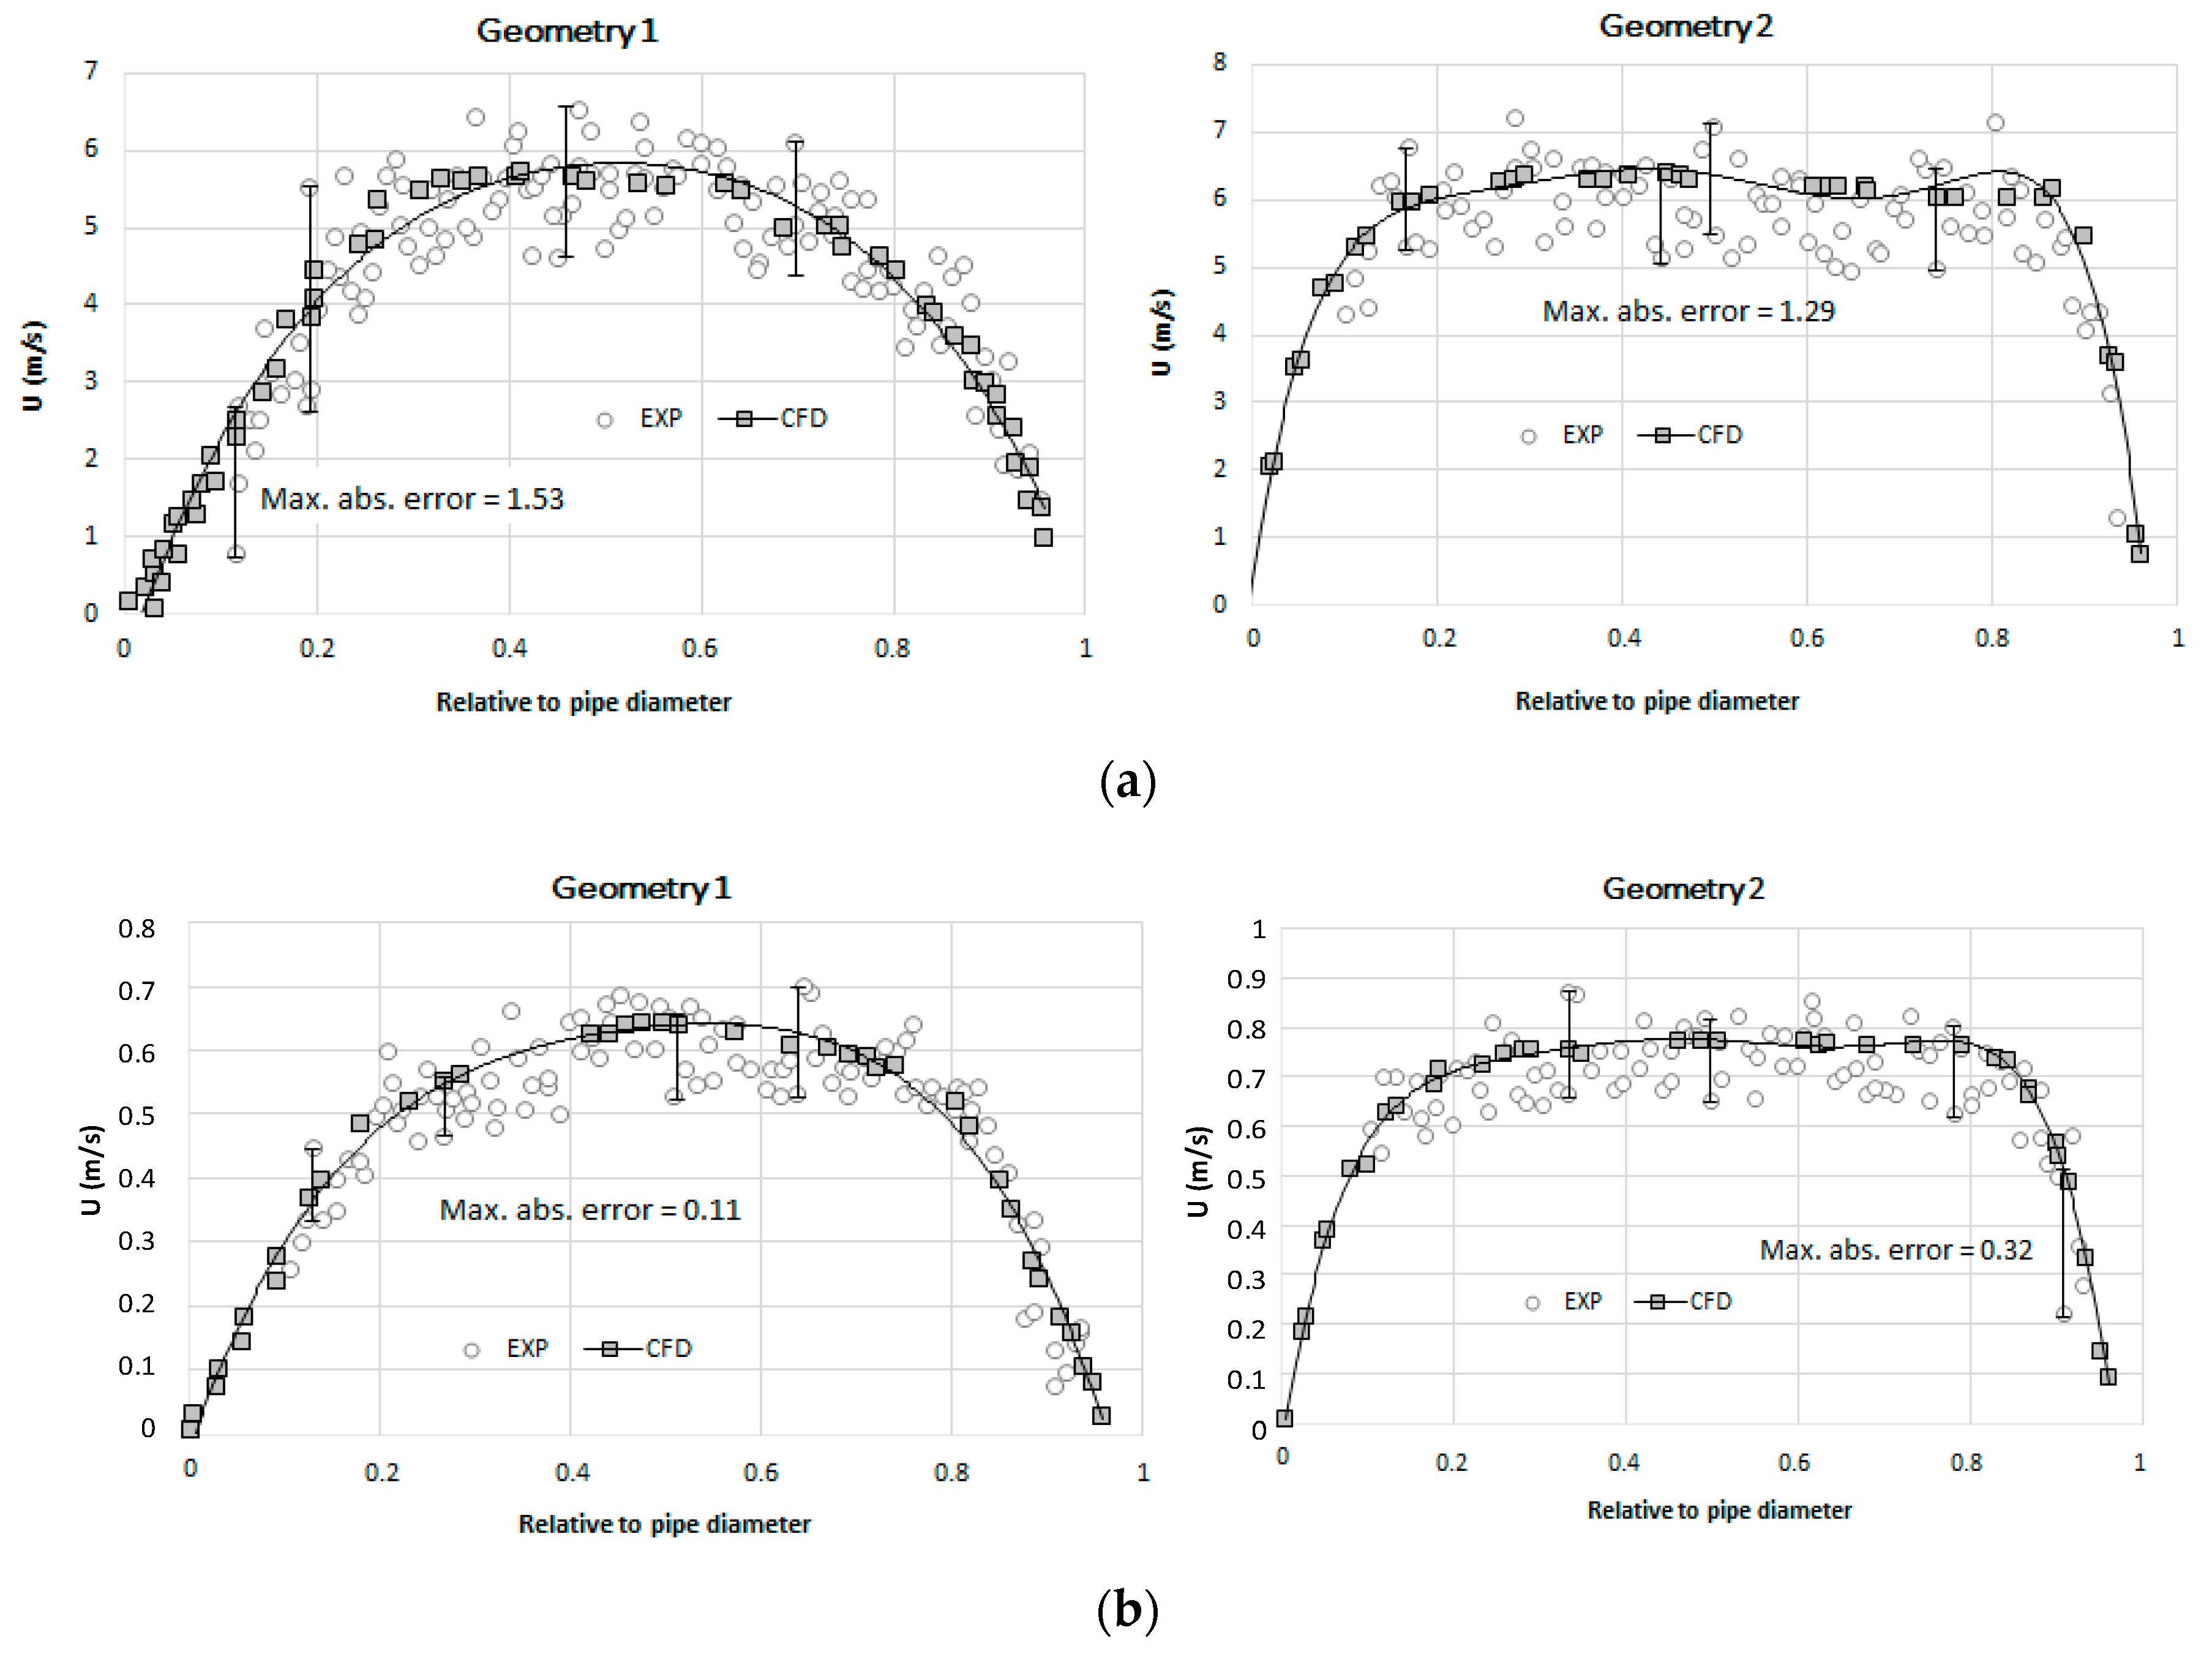
Figure 13 presents the velocity profiles obtained in the CFD model and in the experimental tests, for the same section of the UDV measurements.
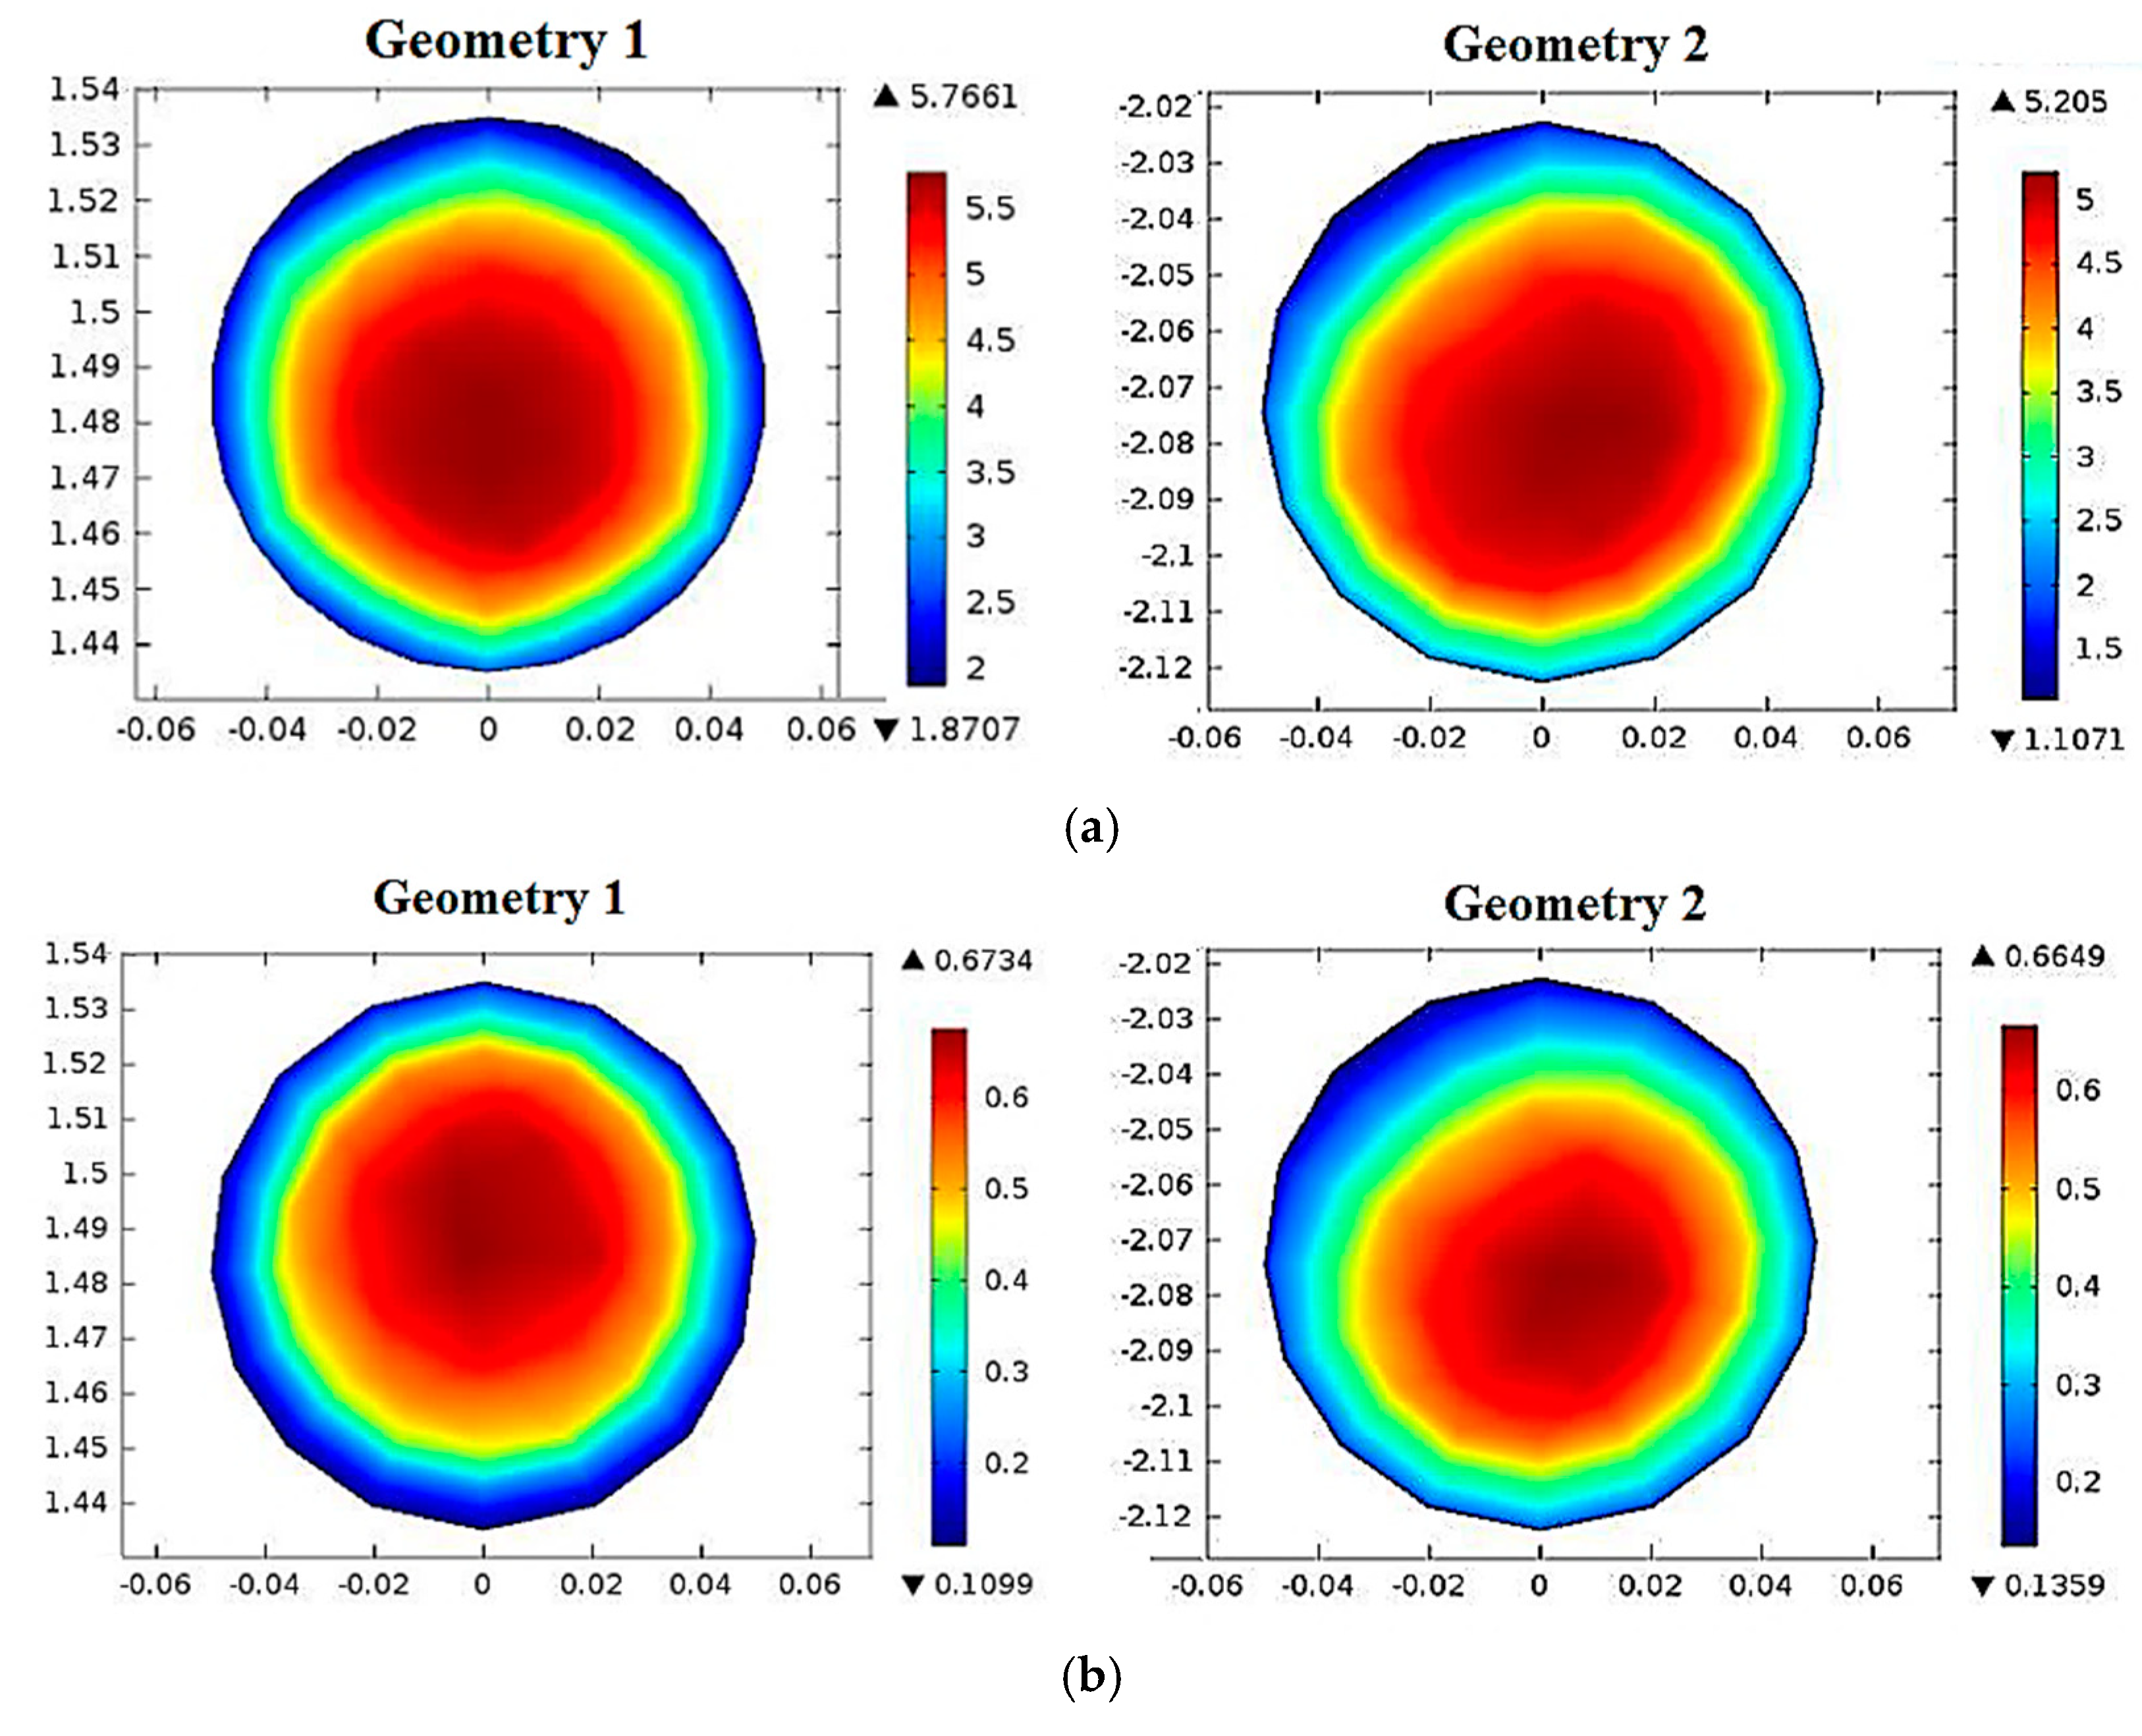
The velocity profiles in Figure 13, related to UDV, presents some spikes. This behavior is justified by the presence of fluctuations in the velocity and the existence of vortexes, both characteristic of deviations on the flow direction. Despite this, the results present a good approximation between the experimental data and the CFD results. In Figure 14 is represented the velocity contours in the pipe cross section for the two different volume flow rates.
In order to assess the associated errors of the volume flow rate measured by the flowmeter, if the velocity distribution is equal to the numerical model, several automatic procedures were implemented. The first step involves the definition of limits presented in Figure 4. The relevant data for this analysis was the one associated to the electrodes cross section of the flowmeter. The data redrawn from the model is a plan with the three coordinates, x, y and z and the average velocity, U. Each two coordinates are associated a velocity and each limit to a certain weight. Therefore, the velocity at points located near the limits (with a maximum error of 0.5%) was multiplied by the corresponding weighting factor (Figure 15).
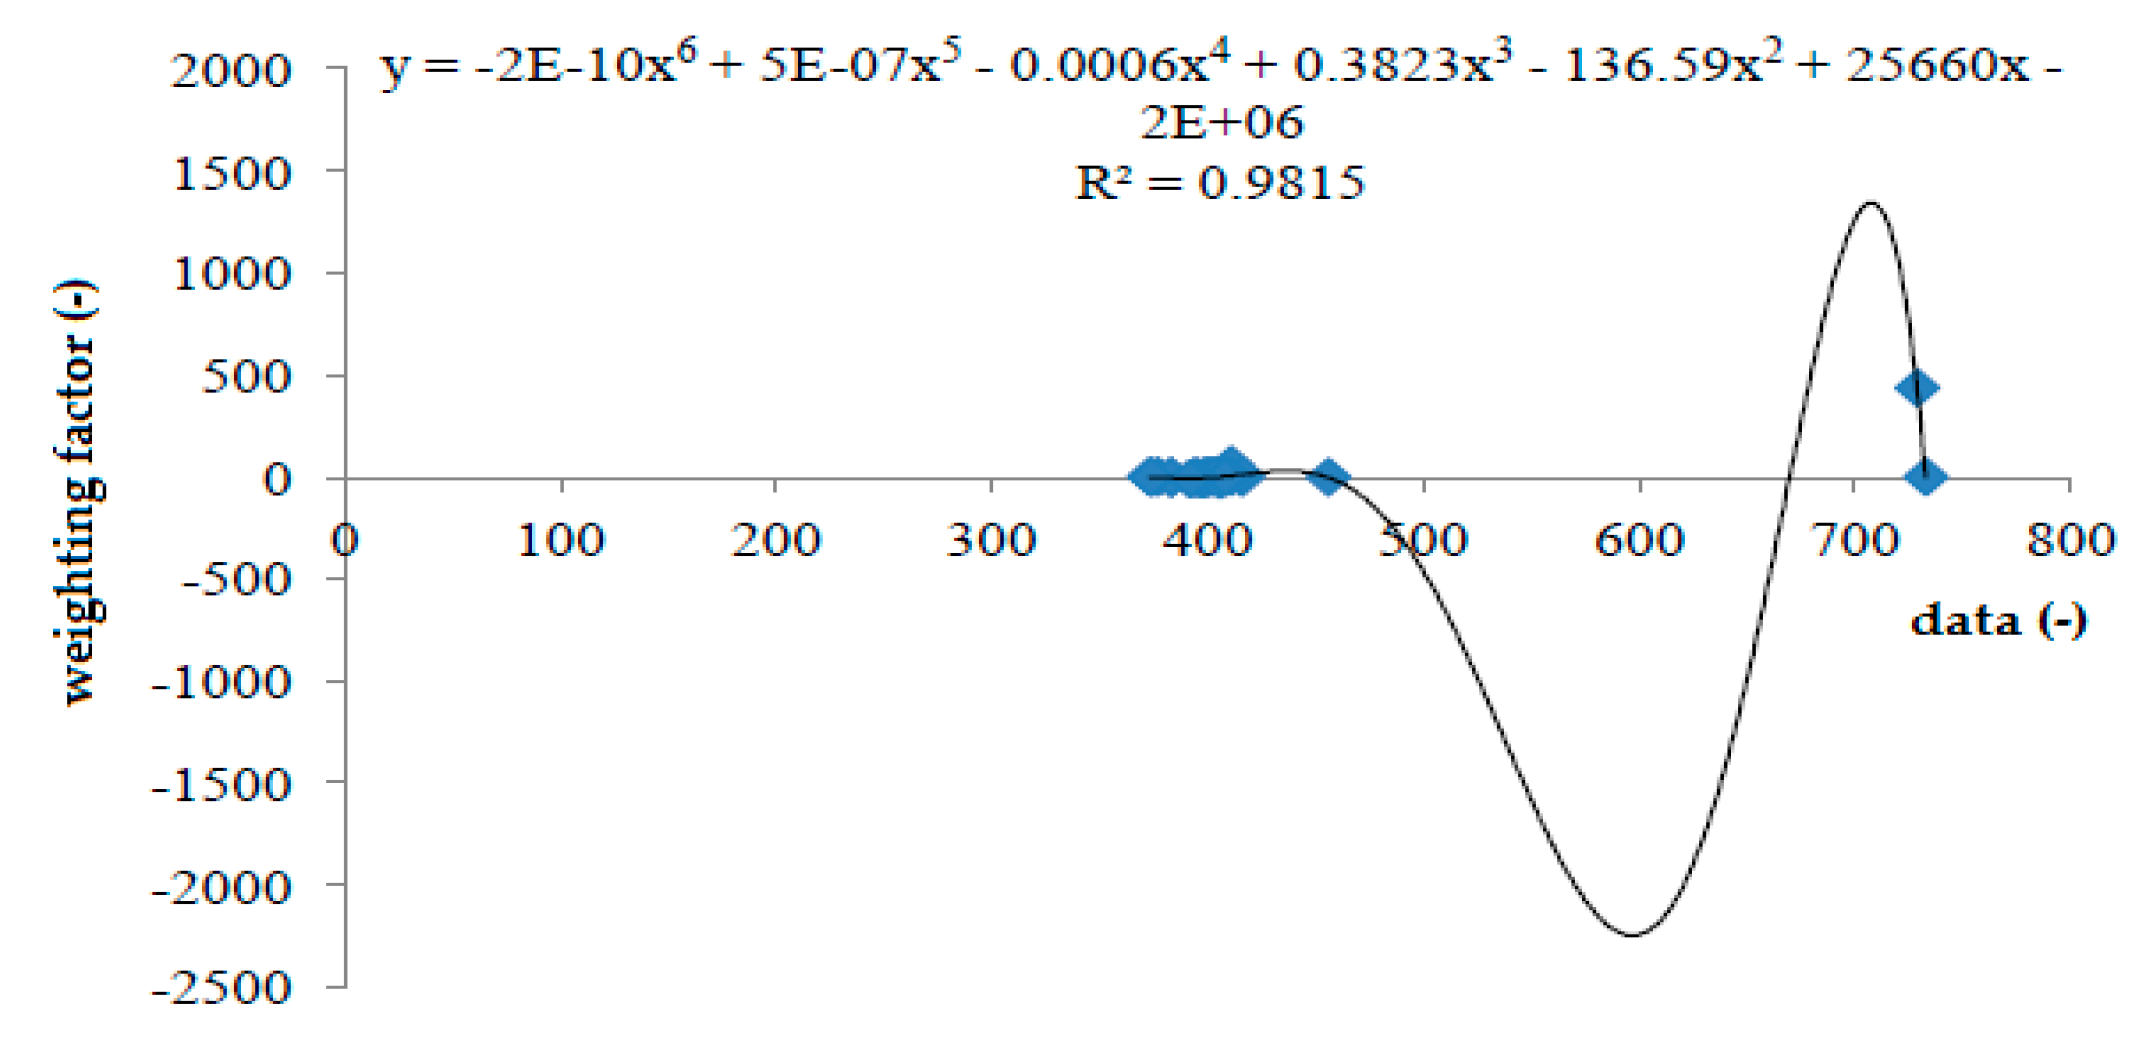
The subsequent step is the interpolation of points between limits, which were multiplied by the correspondent weighting factor. This procedure was made for all limits except the ones that are closer to the electrodes. The limits near the electrodes were very difficult to assess, since closely to the electrodes the weight was not entirely known. Thus, another assumption was taken, i.e., the weighting factor was calculated according to Figure 16. This function was defined and validated through the available experimental data. The x variable is the value resulted from the subtraction of the number of the total data point with the ones in the region near to the electrodes section.
Knowing the remaining factor, the velocity was obtained through the sum of the velocity of each point, multiplied by the corresponding weighting factor, and then divided by the sum of the weighting factors. The error was then determined (Table 3) by applying Equation (12).
E r r o r [ % ] = U c a l c u l a t e d U b o u n d a r y   c o n d i t o n U b o u n d a r y   c o n d i t i o n × 100
The theoretical error of the flowmeters ought to increase with the decrease in the volume flow rate. Thus, it is clear that the error associated to 12 m3/h are bigger than 100 m3/h (Table 3). For the volume flow rate of 100 m3/h it is verified that the error associated to geometry 1 is the smallest one. From the two experimental tests, geometry 2 corresponds to the worst scenario, since the pipe is not long enough to dissipate the flow perturbations caused by the profile vertical curves.
The difference between CFD and the lab tests is twofold: minor installation problems, such as the position of the gasket inserted in between flanges causing obstructions to the reading, and the level of detail of the CFD model.
The error associated to the position of the gasket is important and, in several situations, avoidable errors. In these experiments it is mathematically improbable to assume that the errors could be preventable. However, in practice, since the number of gaskets is much smaller, these errors can be disregarded if engineering good practices are follow.

5. Case Study

5.1. Geometry Layout

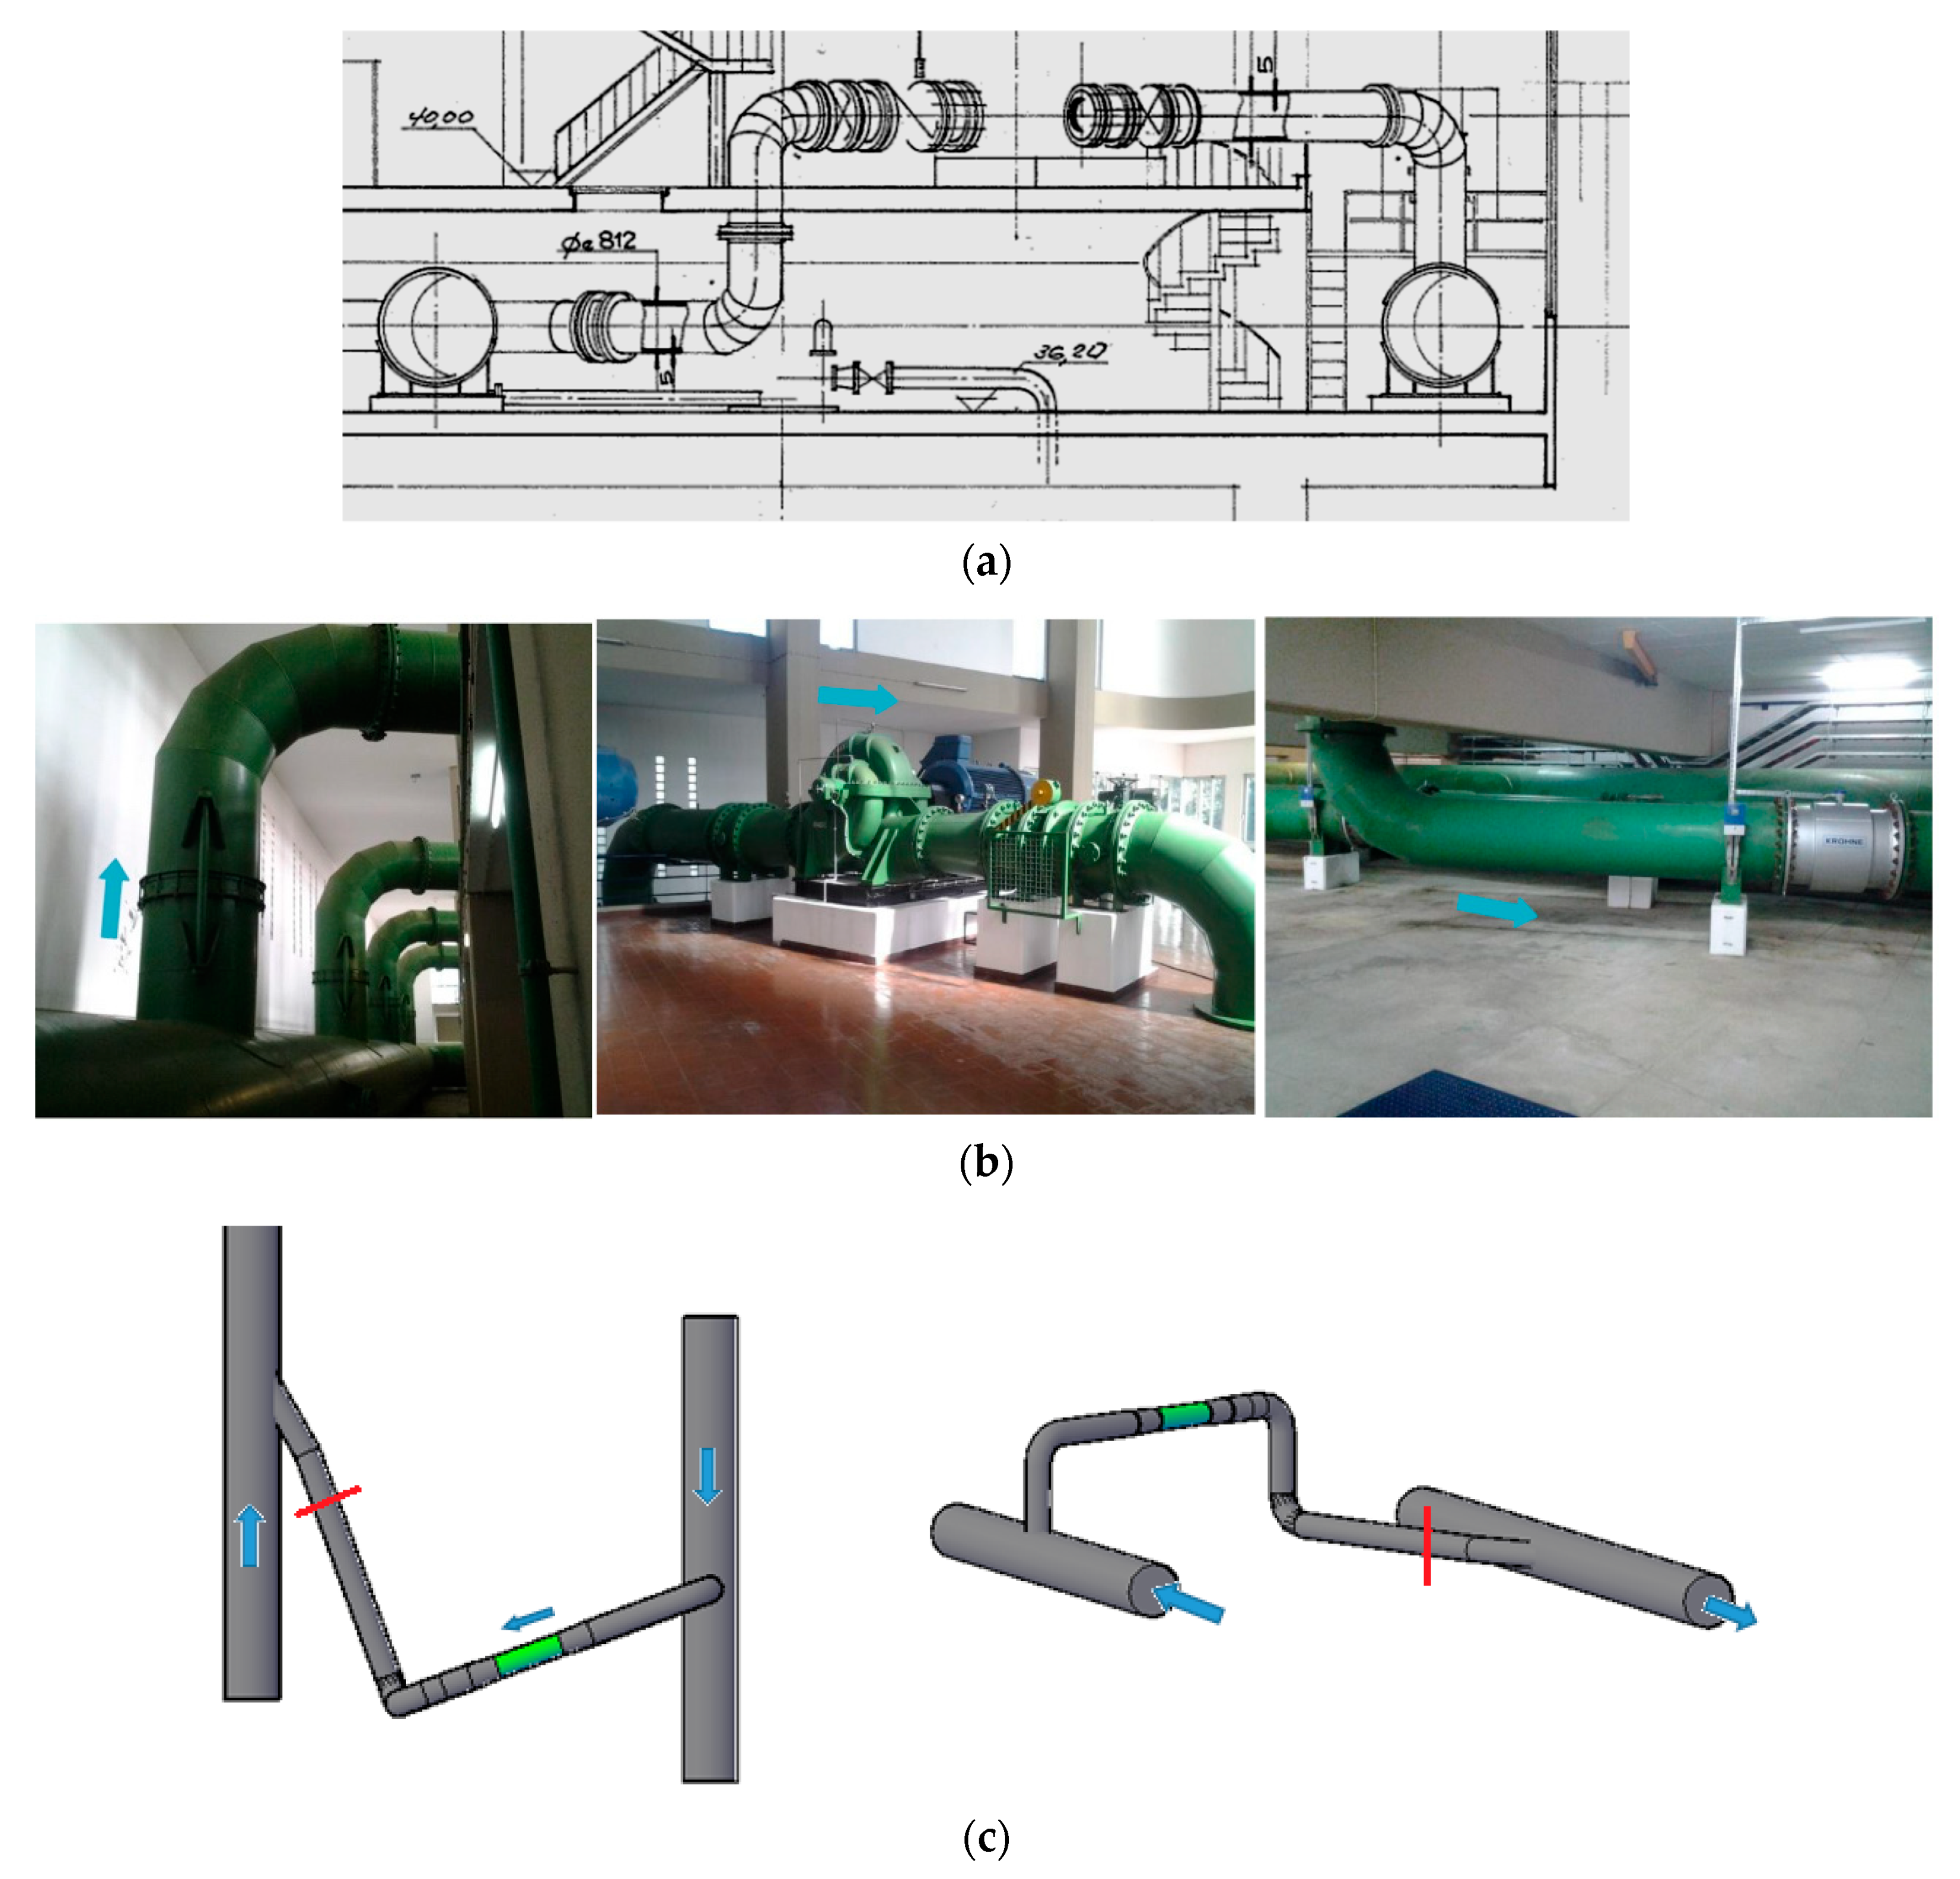
The pumping station layout is presented in Figure 17, where almost 90% of the total water volume is pumped. The flow arrives by the drive pipe, i.e., right to left side of Figure 17c, and follows through the pump (represented by the green section) by a vertical pipe in the top of the drive pipe. Afterwards, the flow reaches the delivery pipe with a 30° angle, sidewise, after passing two 90° curves.

5.2. Simulations

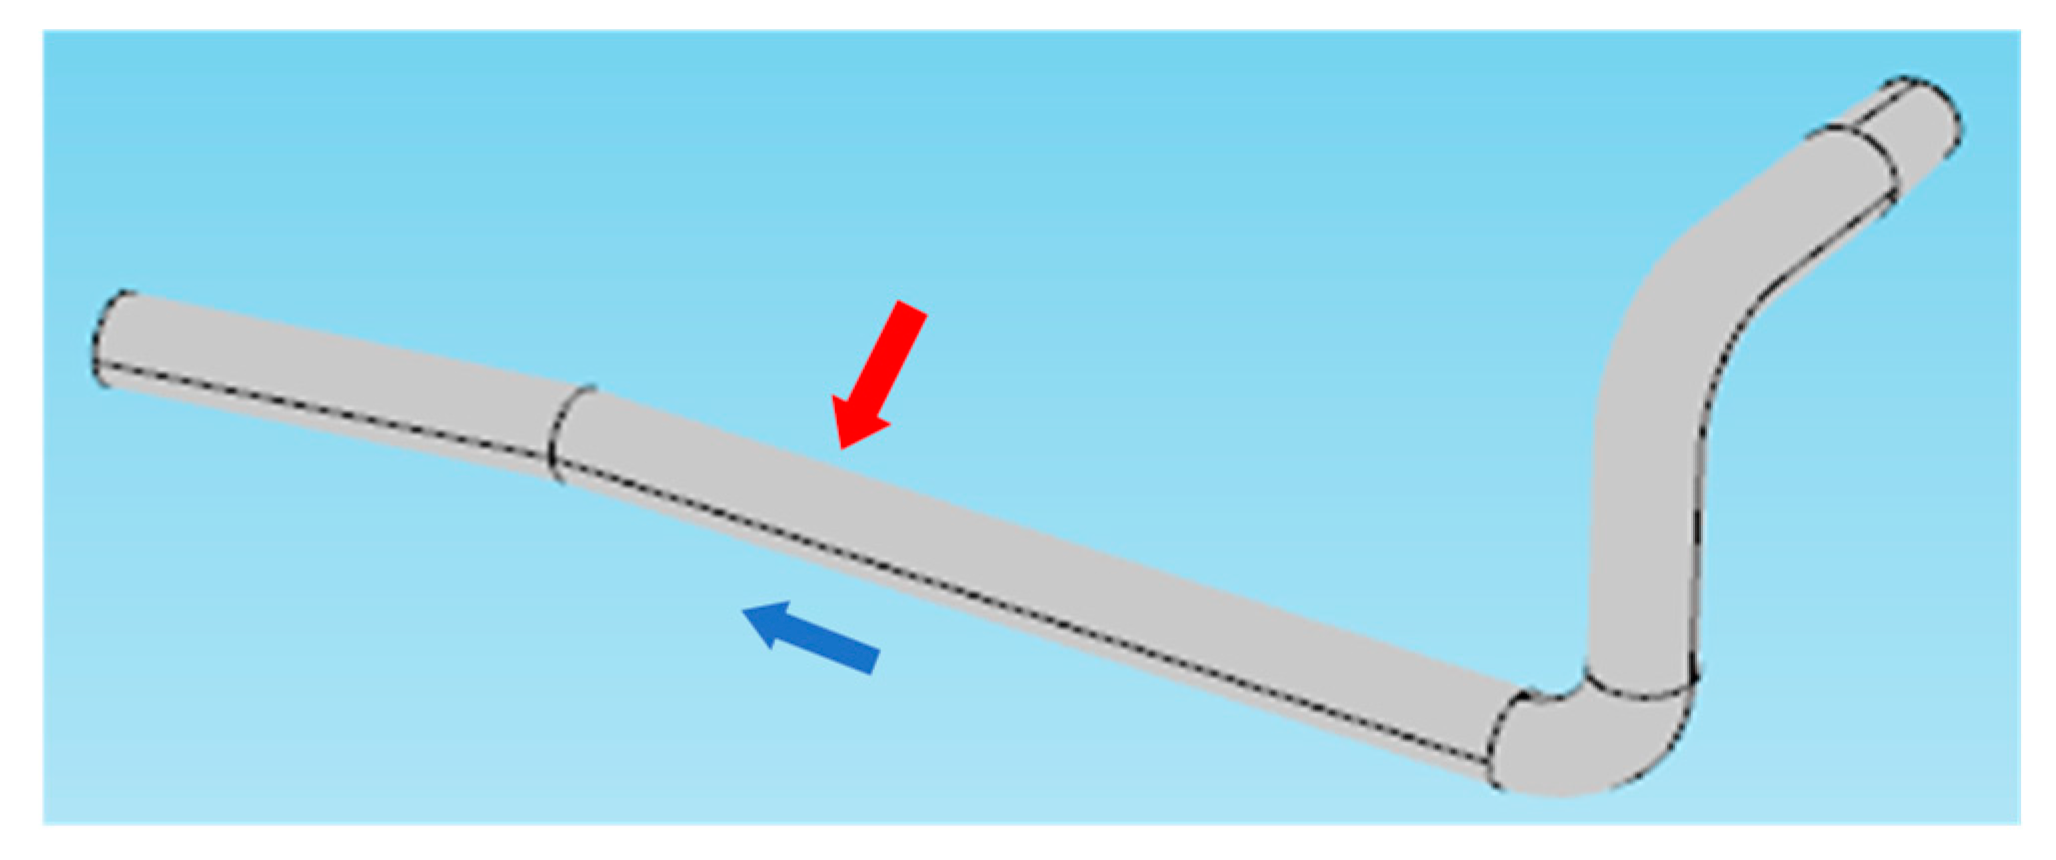
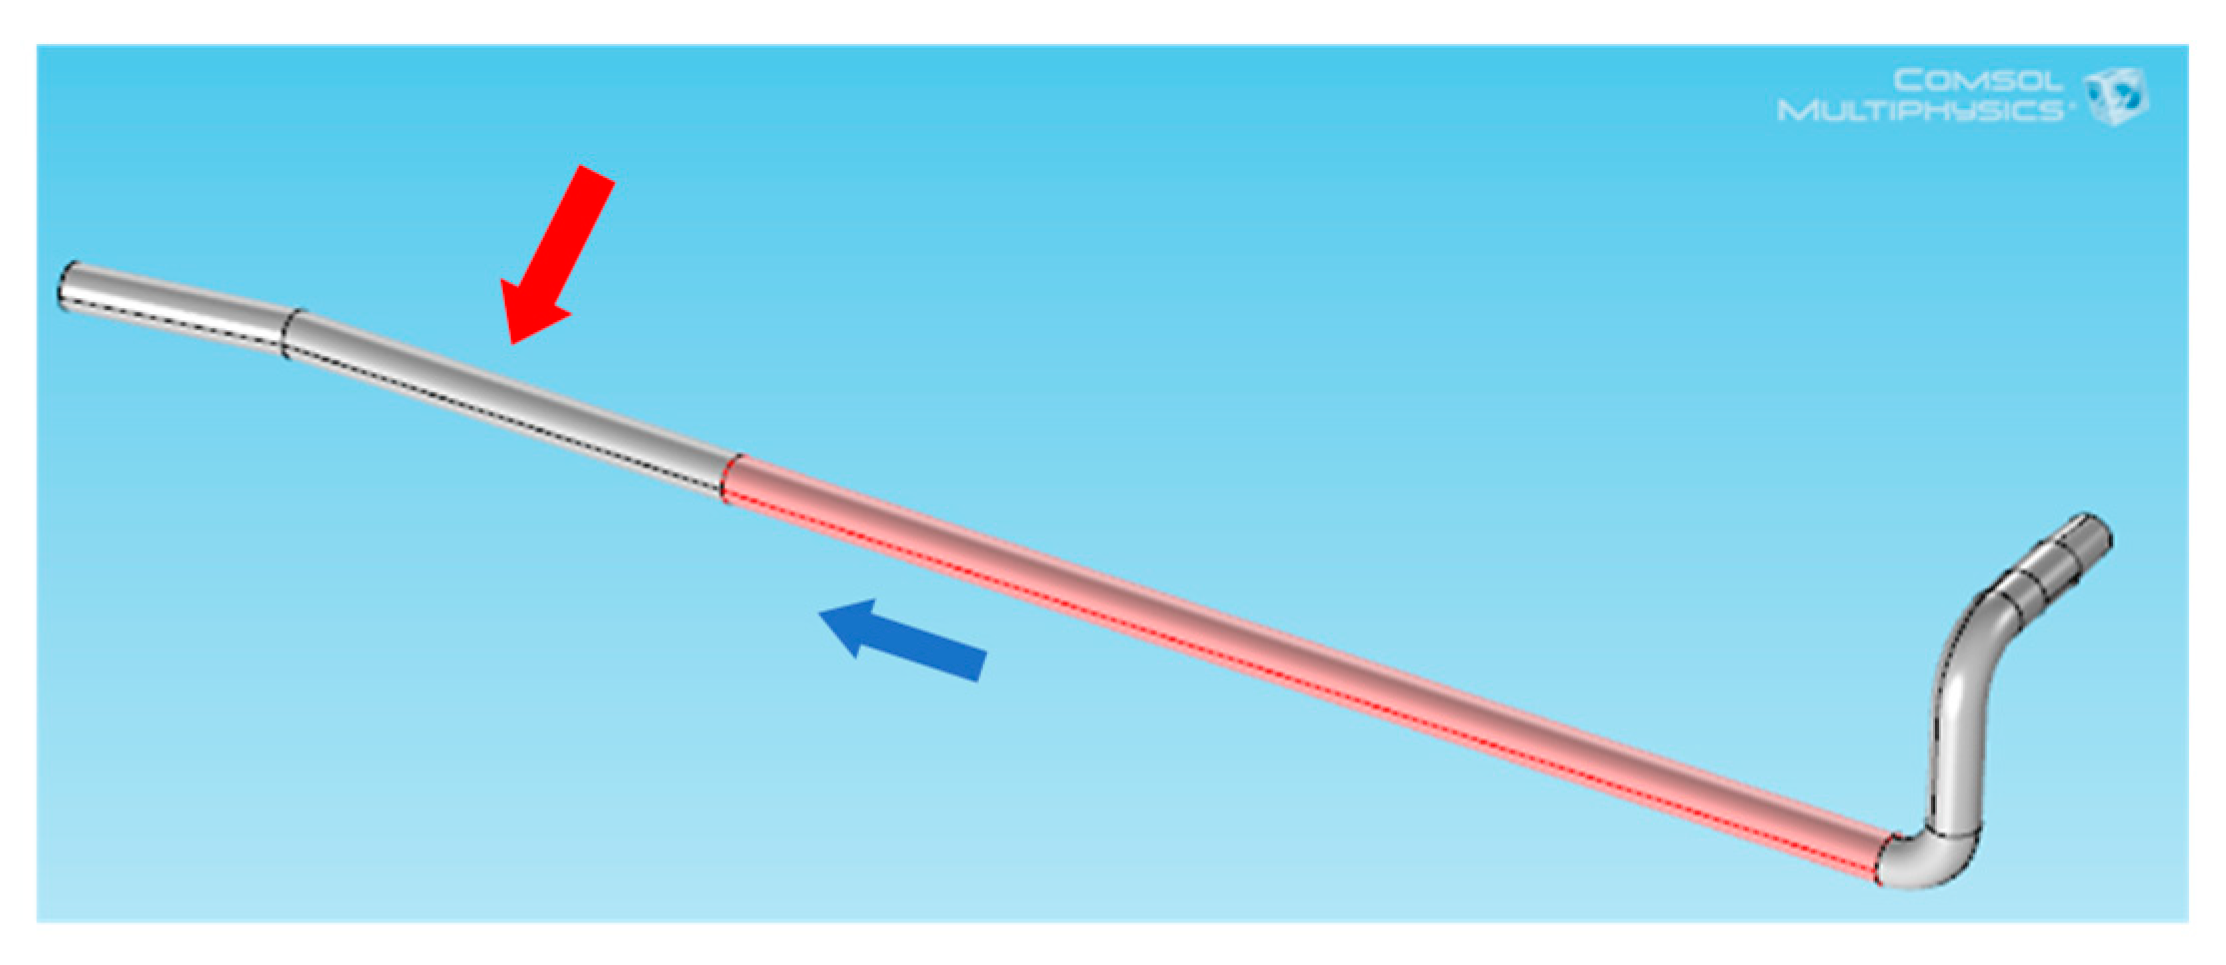
The problems detected in situ were assumed to be correlated to the flowmeters in the pumping station. As the flow passes through the pump, the disturbances from upstream can be disregarded, i.e., considering only the perturbations caused by the pump. Thus, since the pressure is measured just downstream of the pump, the geometry used for simulating the disturbances is presented in Figure 18 and the related characteristics of the pipe and the flowmeter are presented in Table 4.
The simulations were performed by first defining the geometry, after which was necessary to identify the characteristics of the fluid (i.e., water) and the boundary conditions. Lastly the mesh definitions were chosen. The boundary conditions and other important features are described in Table 5.
Figure 19 presents the streamlines velocities and the velocity distribution in the cross section of the flowmeter, respectively. In the flowmeter section, the streamlines appear to be parallel to each other.
The velocity changes largely within the cross section, from zero near the wall to over 1.7 m/s in the right lower side, where the velocity attains the highest value. This behavior was not expected because the flow passes through two 90° curves after the pump, therefore, it would be reasonable to anticipate that the perturbations induced would be, in practice, neglected, according to manufactures experience. Nevertheless, it is important not to forget that the second curve presents a rotation in axis z. Therefore, the non-symmetric velocity is due to the existing geometry (Figure 19b).
For each point, provided by the numerical model, the correspondent weighting factor was estimated. The velocity measured by the flowmeter was calculated dividing the product of the velocity with the weighting factors by the sum of all the weighting factors. The error associated to the flowmeter was about 0.71%, determined according to Equation (8). The error calculated by the manufacture, through water balances, was close to −1%. Since the errors are alike, the model is considered to be validated and the results accurate.

5.3. Solution

In order to achieve a solution that presents a lower error, 3 different procedures can be adopted: (1) changing the geometry but maintaining the values of volume flow rate and pressure; (2) changing the inlet and outlet conditions but maintaining the geometry; and (3) using both solutions. The chosen procedure was the first one, since the volume flow rate and pressure demanded downstream remain the same.
The previous results showed that the existing layout would not be enough to guarantee the dissipation effects and the flow uniformity. For that reason, a new pipe with 20 m of length was added in order to make possible the complete dissipation of disturbances. Considering the flowmeter in the same location, as the previous simulation (i.e., the flowmeter located between 24 m of straight pipe upstream and 4 m downstream), the new proposed geometry corresponds to Figure 20.
For the same boundary conditions and mesh features, presented in Table 5, the streamlines obtained are presented in Figure 21a as well as the velocity distribution across the electrodes plan (Figure 21b).
This profile presents minor perturbations compared to the one in Figure 18b. However, the velocity distribution is not exactly symmetric. The perturbation is still noticeable several meters ahead of the last singularity. For this amount of volume flow rate and pressure, the error associated to this simulation is 0.37%, which is closer to the reference value that the flowmeters suppliers assure for a flow velocity higher than 1 m/s (i.e., 0.2%).

6. Conclusions

The measurement problem has a significant influence in the correct management of technical, hydraulic and economic efficiency of water companies. Since the hydraulic circuits have, normally, two flowmeters, a water balance is possible. These balances are important tools to detect leaks throughout the supply and distribution processes. If the measurement is not accurate enough, the balances do not match and, subsequently, these tools loss their importance.
The procedure used to analyze the associated errors, revealed to be enough showing good results for the experiments and the case study. Nevertheless, more scenarios need to be studied in order to assess if the procedure developed can be applied for every case.
Regarding the simulation results, the model presented an error very similar to the one verified in the experimental tests developed by [30]. According to the results achieved, the errors calculated are very significant for an equipment with high accuracy. Consequentially, errors associated to the installation and the geometry are very important with relevant issues that are not always taken into account by engineers, responsible for the design, nor by teams responsible for the installation of this equipment. If these factors are not addressed properly, the flow measurement is not accurate.
Regarding the proposed solution, the geometry to minimize the installation errors is not feasible, since the facility is already built according to manufacturer’s conditions. This could be overcome if well-defined automatic tools were applied to estimate the uncertainty of flow measurements. Using CFD models, a faster error approximation from a certain type of geometry, volume flow rate, and pressure could be obtained.
Moreover, this research intends to assess that the installation requirements proposed by the manufactures are not sufficient to dissipate such uncertainties. Thus, it is reasonable to emphasize the importance of flow measurement for water companies, regarding more efficient and rational water use and management.

Author Contributions

The author H.M.R. has contributed with the idea, in the revision of the document and in supervising the whole research. M.S. and M.B. developed the experimental tests and the CFD modelling and the analysis of the results between CFD and experiments. H.M.R. and A.C. revised the final document.

Funding

This research was funded by REDAWN, EAPA_198/2016.

Acknowledgments

The authors wish to thank to the project REDAWN (Reducing Energy Dependency in Atlantic Area Water Networks) EAPA_198/2016 from INTERREG ATLANTIC AREA PROGRAMME 2014–2020 and CERIS-IST and the Hydraulic Laboratory, for the support in the conceptual developments and experiments.

Conflicts of Interest

The authors declare no conflict of interest.

References

  1. Frenzel, F.; Grothey, H.; Habersetzer, C.; Hiatt, M.; Hogrefe, W.; Kirchner, M.; Lütkepohl, G.; Marchewka, W.; Mecke, U.; Ohm, M.; et al. Industrial Flow Measurement Basics and Practice; ABB Automation Products GmbH: Gottingen, Germany, 2011. [Google Scholar]
  2. Sheng, H.; Lihui, P.; Nakazato, H. Computational fluid dynamics based sound path optimization for ultrasonic flow meter. Chin. J. Sci. Instrum. 2009, 30, 852–856. [Google Scholar]
  3. Cardoso, A.H. Hidráulica Geral I—Apontamentos Complementares das Aulas Teóricas; IST: Lisboa, Portugal, 2009. [Google Scholar]
  4. Lysak, P.D.; Jenkins, D.M.; Capone, D.E.; Brown, W.L. Analytical model of an ultrasonic cross-correlation flow meter, part 1: Stochastic modeling of turbulence. Flow Meas. Instrum. 2008, 19, 41–46. [Google Scholar] [CrossRef]
  5. Pope, S.B. Turbulent Flows; Cambridge University Press: Cambridge, UK, 2000. [Google Scholar]
  6. Quintela, A.C. Hidráulica; Fundação Calouste Gulbenkian: Lisboa, Portugal, 2002. [Google Scholar]
  7. Matas, R.; Cibera, V.; Syka, T. Modelling of flow in pipes and ultrasonic flowmeter bodies. EPJ Web Conf. 2014, 67, 02073. [Google Scholar] [CrossRef] [Green Version]
  8. EN 14154-2. Water Meters—Part 2: Installation and Conditions of Use; NSAI: Dublin, Ireland, 2005. [Google Scholar]
  9. EN 14154-3. Water Meters—Part 3: Test Methods and Equipment; NSAI: Dublin, Ireland, 2005. [Google Scholar]
  10. Fletcher, C.A.J. Computational Techniques for Fluid Dynamics; Springer: Berlin, Germany, 1991. [Google Scholar]
  11. Brunone, B.; Berni, A. Wall shear stress in transient turbulent pipe flow by local velocity measurement. J. Hydraul. Eng. ASCE 2010, 136, 716–726. [Google Scholar] [CrossRef]
  12. UVP Monitor –User’s Guide” Model UVP-DUO with Software Version 3, Met-Flow. 2014.
  13. Hammoudia, M.; Legrand, J.; Si-Ahmeda, E.K.; Salem, A. Flow analysis by pulsed ultrasonic velocimetry technique in Sulzer SMX static mixer. Chem. Eng. J. 2008, 139, 562–574. [Google Scholar] [CrossRef]
  14. Haavisto, S.; Syrjnen, J.; Koponen, A.; Mannien, M. UDV Measurements and CFD Simulation of Two-Phase Flow in a Stirred Vessel. In Proceedings of the 6th International Conference on CFD in Oil & Gas, Metallurgical and Process Industries, Trondheim, Norway, 10–12 June 2008. [Google Scholar]
  15. Georgescu, A.; Bernad, S.; Georgescu, S.-C.; CoSoiu, I. COMSOL Multiphysics versus FLUENT: 2D numerical simulation of the stationary flow arround a blade of the achard turbine. In Proceedings of the 3rd Workshop on Vortex Dominated Flows, Timisoara, Romania, 1–2 June 2007. [Google Scholar]
  16. COMSOL 4.3. COMSOL Multiphysics Reference Guide; COMSOL AB: Stockholm, Sweden, 2012. [Google Scholar]
  17. Speziale, C.G. On nonlinear k-l and k-ε models of turbulence. J. Fluid Mech. 1987, 178, 459–475. [Google Scholar] [CrossRef]
  18. Simão, M. Fluid-Structure Interaction in Pressurized Systems. Ph.D. Thesis, Insituto Superior Técnico, Universidade de Lisboa, Lisboa, Portugal, 2017. [Google Scholar]
  19. Gresho, P.M. Incompressible Fluid Dynamics: Some Fundamental Formulation Issues. Ann. Rev. Fluid Mech. 1991, 23, 413–453. [Google Scholar] [CrossRef]
  20. Prandtl, L. Guide à Traves de la Méchanique dês Fluides; Dunod: Paris, France, 1952. [Google Scholar]
  21. Lumley, J.L. Computational modelling of turbulent flows. Adv. Appl. Mech. 1978, 18, 123–176. [Google Scholar]
  22. Lumley, J.L. Some comments on turbulence. Phys. Fluids A 1992, 4, 203–211. [Google Scholar] [CrossRef]
  23. COMSOL 4.3. COMSOL Multiphysics User’s Guide; COMSOL AB: Stockholm, Sweden, 2012. [Google Scholar]
  24. Bakewell, H.P.; Lumley, J.L. Viscous sublayer and adjacent wall region in the turbulent pipe flow. Phys. Fluids 1967, 10, 1880–1889. [Google Scholar] [CrossRef]
  25. Versteeg, H.K.; Malalasekera, W. An Introduction to Computational Fluid Dynamics: The Finite Volume Method; Pearson Education Limited: London, UK, 2007. [Google Scholar]
  26. Çengel, Y.A.; Cimbala, J.M. Fluid Mechanics—Fundamentals and Applications; McGraw-Hill: New York, NY, USA, 2006. [Google Scholar]
  27. Batchelor, G.K. An Introduction to Fluid Dynamics; Cambridge University Press: Cambridge, UK, 1967. [Google Scholar]
  28. Abbott, M.B.; Basco, D.R. Computational Fluid Dynamics—An Introduction of Engineers; Longman Scientific & Technical: Harlow, UK, 1989. [Google Scholar]
  29. Wosnik, M.; Castillo, L.; George, W.K. A theory for turbulent pipe and channel flows. J. Fluid Mech. 2000, 421, 115–145. [Google Scholar] [CrossRef]
  30. Braga, F.; Fernandes, M. Analise de Eventuais Perdas na rede de Adução da EPAL: Casos de Estudo; EPAL: Lisboa, Portugal, 2009. [Google Scholar]
Figure 1. Electromagnetic flowmeters components: (a) primary element; (b) convertor (adapted from [1]).
Water 10 01807 g001
Figure 2. Electromagnetic flowmeter accuracy curve [1].
Water 10 01807 g002
Figure 3. Operating principle of an electromagnetic flow meter [1].
Water 10 01807 g003
Figure 4. Weighting factor distribution W in the electrode plane [1].
Water 10 01807 g004
Figure 5. Installation requirements for different pipe layouts.
Water 10 01807 g005aWater 10 01807 g005b
Figure 6. Ultrasonic Doppler velocimetry (UDV) operating principle (adapted from [12]).
Water 10 01807 g006
Figure 7. System layouts 1 and 2: (a) facility scheme; (b) lab installation, with flow direction identified by the blue arrow.
Water 10 01807 g007aWater 10 01807 g007b
Figure 8. UDV profiles related to geometries 1 and 2: (a) for 100 m3/h; (b) for 12 m3/h.
Water 10 01807 g008aWater 10 01807 g008b
Figure 9. Computational domain starts a distance δ w from the wall [13].
Water 10 01807 g009
Figure 10. Physics-controlled mesh used: (a) Boundary layer mesh; (b) Refinement near a curve.
Water 10 01807 g010
Figure 11. Convergence solution.
Water 10 01807 g011
Figure 12. Model configuration: (a) geometry 1; (b) geometry 2.
Water 10 01807 g012
Figure 13. Comparison of velocity distribution profiles obtained through CFD model and experiments: (a) for 100 m3/h; (b) for 12 m3/h.
Water 10 01807 g013
Figure 14. Velocity contours in the pipe cross section: (a) for 100 m3/h; (b) for 12 m3/h.
Water 10 01807 g014
Figure 15. Weighting function distribution of uniform magnetic field point electrode electromagnetic flowmeter. Calculated limits (black continuous lines) analogous to Figure 4. Data provided by the model represented by the blue ticks.
Water 10 01807 g015
Figure 16. The best function for the calculus of the factor for the region near the electrodes to fit the experiments (blue marks represent the experimental data used).
Water 10 01807 g016
Figure 17. Pumping station layout (a); photographs of the different parts of the hydraulic system (b); modelling geometry—pump location identified by the green pipe section, flowmeter identified by the red line, flow direction identified by the blue arrow (plan view on the left and 3D view on the right) (c).
Water 10 01807 g017
Figure 18. System layout modelling geometry—with the flowmeter section identified by the red arrow and flow direction identified by the blue arrow.
Water 10 01807 g018
Figure 19. Streamlines simulation along the hydraulic circuit for the pipe branch system layout (flowmeter section identified by the red arrow), in m/s (a); Velocity distribution in the cross section of the flow meter (b).
Water 10 01807 g019
Figure 20. System layout proposed modelling geometry—the flowmeter section represented by the red arrow; flow direction identified by the blue arrow (added pipe in red).
Water 10 01807 g020
Figure 21. Streamlines simulation along the hydraulic circuit for the proposed system layout (flowmeter section identified by the red arrow), in m/s (a); velocity distribution in the electrodes cross section for the proposed geometry (b).
Water 10 01807 g021
Table 1. Test results: experiments and relative errors achieved in section A, for different volume flow rates.
GeometryQtheoretical (m³/h)Tests ResultsError
VND100 (L)Vreference (L)ttheoretical (s)treal (s)Qreference (m3/h)ND100 (%)Re (-)
110049805000180173104−0.40%365,631
121006101830528513−1.18%45,704
2100502650001801721050.52%369,147
1210351020306295121.47%42,188
Table 2. Boundary, mesh and study conditions.
Characteristics100 m3/h12 m3/h
Inlet5.6 bar5.8 bar
Outlet0.59 m/s0.07 m/s
WallNo-slip
MeshPhysics-controlled
Flow conditionsSteady state
Table 3. Summary of the errors calculated with the volumetric method for both geometries.
GeometryQ = 100 m3/hQ = 12 m3/h
ErrorError
ExperimentalModelExperimentalModel
1−0.40%−0.48%−1.18%−1.27%
20.52%1.11%1.47%1.61%
Table 4. Characteristic of the main pipe and flowmeter.
MaterialSteel
ExpansionND700 to ND800
Remaining pipesND800
FlowmeterND800
Table 5. System layout existing situation: simulation input values and characteristics.
Inlet9.5 bar
Outlet1.5 m/s
WallNo-slip
MeshPhysics-controlled
Flow conditionsSteady state