Communication

Tools for Communicating Agricultural Drought over the Brazilian Semiarid Using the Soil Moisture Index

by
Marcelo Zeri
1,*,
Regina Célia S. Alvalá
1,
Rogério Carneiro
1,
Gisleine Cunha-Zeri
2,
José Maria Costa
1,
Luciana Rossato Spatafora
3,
Domingos Urbano
1,
Mercè Vall-Llossera
3 and
José Marengo
1
1
National Center for Monitoring and Early Warning of Natural Disasters (Cemaden), Estrada Dr. Altino Bondensan, 500, Parque Tecnológico, São José dos Campos, SP 12247-016, Brazil
2
National Institute for Space Research (INPE), São José dos Campos, SP 12227-010, Brazil
3
Signal Theory and Communications Department, Universitat Politècnica de Catalunya, 08034 Barcelona, Spain
*
Author to whom correspondence should be addressed.
Water 2018, 10(10), 1421; https://doi.org/10.3390/w10101421
Submission received: 2 August 2018 / Revised: 12 September 2018 / Accepted: 13 September 2018 / Published: 11 October 2018
(This article belongs to the Special Issue Monitoring and Predicting Soil Moisture and Drought Conditions)

Abstract

:
Soil moisture over the Brazilian semiarid region is presented in different visualizations that highlight spatial, temporal and short-term agricultural risk. The analysis used the Soil Moisture Index (SMI), which is based on a normalization of soil moisture by field capacity and wilting point. The index was used to characterize the actual soil moisture conditions into categories from severe drought to very wet. In addition, the temporal evolution of SMI was implemented to visualize recent trends in short-term drought and response to rainfall events at daily time steps, as new data are available. Finally, a visualization of drought risk was developed by considering a critical value of SMI (assumed as 0.4), below which water stress is expected to be triggered in plants. A novel index based on continuous exposure to critical SMI was developed to help bring awareness of real time risk of water stress over the region: the Index of Stress in Agriculture (ISA). The index was tested during a drought over the region and successfully identified locations under water stress for periods of three days or more. The monitoring tools presented here help to describe the real time conditions of drought over the region using daily observations. The information from those tools support decisions on agricultural management such as planting dates, triggering of irrigation, or harvesting.

1. Introduction

Soil moisture (SM) plays an important role in the water, carbon and energy cycles. The amount of moisture in soil is an important variable to understand the coupling of the surface and the atmosphere. Assimilation of soil moisture into land surface models has resulted in increased understanding of processes controlling the energy exchange at the land–atmosphere interface. The spatial distribution and temporal evolution of SM is of central importance to different societal sectors and activities, such as weather forecasting, management of water reservoirs, food security, watershed management, development of climate models, drought monitoring, land slide prediction, flood forecasting and others [1,2,3,4,5,6,7,8,9]. Of particular importance is the use of SM to monitor drought conditions over forest and agricultural sites, either using soil moisture only or in combination with other parameters, such as air temperature, solar radiation and rainfall [10,11,12,13]. Soil moisture can be estimated using in-situ measurements, satellite observations [14] or from water budgets, which take into account rainfall as input, and evaporation from the soil and plants as outputs [15,16,17].
Soil moisture information can be used directly or integrated with other variables to calculate drought indices, such as the Soil Moisture Anomaly (SMA) or the Soil Moisture Index (SMI), among others [18]. The SMI, also referred to as the Relative Extractable Water (REW) or Available Water Fraction (AWF), is a measure of the water available to plants and can be used to classify drought conditions into categories ranging from severe drought to very wet conditions [13,19,20]. When prolonged periods of drought contribute to reduce SMI below a critical value (typically 0.4 or less), water stress is triggered in plants, i.e., transpiration is greatly reduced, affecting photosynthesis and consequently plant development and growth [11,21,22,23,24,25]. In agro-ecosystems, water stress can affect plants during different stages, e.g., causing damage during leaf formation, during the flowering stage or affecting roots and grain yield. Water stress during the flowering stage was reported to increase the susceptibility of plants to diseases such as powdery mildew and grey mold [26]. Thus, monitoring of environmental variables, especially soil water, is crucial for early-warning and rapid-response systems of drought conditions and agricultural risk.
From 2014 to 2015, a network of soil moisture sensors was established by Cemaden (National Center for Monitoring and Early Warning of Natural Disasters) over the Brazilian semiarid region, which is the driest and poorest in the country. Soil moisture is currently being monitored over 595 locations, in depths ranging from 10 to 40 cm. The stations are also equipped with rain gauges, and a subset of locations has measurements of other variables, such as air temperature, relative humidity and solar radiation, among other sensors. Thus, the objective of Cemaden in establishing the network was to develop tools to characterize and quantify the risk associated with drought conditions, and to communicate the information to end-users, as well as to external actors (federal and state agricultural agencies, non-governmental organizations, decision makers, etc.). Currently, data can be visualized and downloaded at www.cemaden.gov.br/mapainterativo.
Drought over the Brazilian semiarid is a long-term problem, as noted by several authors [27,28,29,30,31,32,33]. Historically, during periods of extreme drought, food security for the most vulnerable communities in the drylands of Northeast Brazil is under risk due to reduced subsistence production, reduced income and increased pricing of agricultural products. The recent drought events in the region continue to highlight the vulnerability of this region, and confirm the risk of major impacts due to climate change [34]. The region has a high concentration of family owned rural properties where the main activity is rainfed agriculture. The combination of drought frequency and low-income families increases the vulnerability of the region to adverse effects of the climate. Soil moisture measurements over the region are rare and limited to short-lived experiments [35], and the only assessment of soil water comes from modeling of the water budget [15,16].
Drought conditions can be monitored in a multitude of platforms and websites nowadays, including satellites, weather stations, and methodologies that make use of the weather forecast, water budget and analysis of time series. Among them, we can mention the drought products using VHI (Vegetation Health Index) from Cemaden [29], the Monitor de Secas (drought monitor) produced by the National Water Authority (ANA) (http://monitordesecas.ana.gov.br), and the rainfall derived products (based on SPI, the Standardized Precipitation Index) produced by Brazilian National Space Research Institute (INPE) (http://www.cptec.inpe.br) and National Institute of Meteorology (INMET) (http://www.inmet.gov.br). Each approach has its limitations of spatial or temporal coverage, and costs can vary greatly. While some satellite products are free to use, installing and maintaining a network of stations requires frequent expenses and planning. Regardless of the method chosen, the communication of results is of fundamental importance. Different users of products of monitoring networks might have different necessities of information in both temporal and spatial domains. The drought risk information should also be shown in platforms that are easily customized, to address specific needs of users.
The objective of this study was to describe soil moisture products developed using the network of sensors established by Cemaden. These tools are especially timely, considering the drought affecting the Brazilian semiarid region for the past five years. These products will help to bring awareness of drought conditions and agricultural risk over the region. Soil moisture data were combined with soil characteristics from soil samples, and displayed in different formats to highlight spatial or temporal features. This approach helps to bring the information to users of different technical background, such as farmers, field technicians, journalists, decision makers, and others. All the scripts used in the analysis will later be implemented to run automatically on a daily basis, to have real-time information of soil moisture status over the region.

2. Site and Data

The analysis was based on data measured over the Brazilian semiarid region, delimited in orange in Figure 1. The semiarid area covers a large extension of land on the Brazilian Northeast (NEB), with a latitudinal gradient resulting in differences in the rainy season between the northern and southern parts [36]. Rainy season over the southern part occurs from October to February, influenced by the passage of cold fronts from the south. Over the northern region, rainfall starts in February, peaks in April–May, and is highly influenced by the position and meridional migration of the Intertropical Convergence Zone (ITCZ). In addition, rainy season over the coastal areas is observed from April to August, influenced by sea and mountain breezes. On the large scale, rainfall over the region is also influenced by El Niño—Southern Oscillation (ENSO), and patterns of sea surface temperature over the tropical Atlantic Ocean [37,38,39,40,41,42].
Two types of weather stations were used: Acqua (500 units) and Agro (95 units), both defined next. The location of each station was determined by considering regions with high density of family-owned rural properties (FORP), according to data from IBGE (Brazilian Institute of Geography and Statistics). FORP agriculture is characterized by management of farm activities by family members, ownership of the land, and long-term history and ancestry in the area, among other characteristics. According to a 2006 agronomic census, 84.4% of rural properties in Brazil are classified as FORP, with half being located over the Brazilian semiarid [43]. The criteria for selecting a location included also the absence of weather stations from other networks, especially from INMET and ANA. The result is a unique network with measurements on rural sites, within private properties of small-scale agriculture. The stations were installed mostly in 2014 and 2015, and have undergone maintenance in 2018.
The station Acqua is composed of a rain gauge (model PluvDB, DualBase, Santa Catarina, Brazil) and volumetric water content sensors (model EC-5, Decagon Devices, Pullman, WA, USA) installed at depths of 10 and 20 cm. The station Agro had a different rain gauge model (TB-6, Hydrological Services Pty Ltd., Sydney, Australia) and volumetric water content sensors, installed at depths of 10, 20, 30 and 40 cm. This type of station has additional sensors for monitoring air temperature, relative humidity, solar radiation and wind speed, which were not considered in this study. Soil moisture probes were installed using the default calibration, which results in a precision of ±0.03 m3 m−3.
Correlation between stations was done to test whether the spatial distribution is homogeneous and representative of soil moisture over the domain. Soil moisture at 20 cm for each station was correlated with neighboring stations in a radius of 50 km, using data from 1 December 2015 to 31 March 2016. On average, each station had six neighbors, with a maximum of 14. For each station, a significant link was counted only if the Pearson correlation was higher than 0.5 and statistically significant at the 5% level. Overall, 70% of stations were correlated with at least one neighbor. This test suggests that the network is mostly homogeneous and represents well the spatial variability of soil moisture.
The soil moisture at 20 cm depth was chosen for the analysis in this work since it is common in both kinds of stations (Acqua and Agro) and has a higher spatial coverage. This level is important during the first stages after planting, including emergence and the first leaf stages. Soils in the Brazilian semiarid are predominantly sandy and shallow. Cactus pear (Opuntia ficus-indica (L.) Mill) is an important forage resource for livestock farming in the semiarid. According to Oliveira [44], the maximum root zone of cactus pear is reached at 30 cm of soil depth. Loiola Edvan et al. [45] found that more than 76% of cactus pear root distribution was concentrated in the upper 20 cm of soil depth. In addition, a species of forage bean called “feijão caupi” (Vigna unguiculata (L.) Walp), mostly planted over the Brazilian semiarid, has 80% of roots within the first 20 cm of soil [46]. To investigate whether measurements at 20 cm represented the soil water at deeper layers, data at depths of 20 cm and 40 cm were compared from a sample of Agro stations. The depth of 40 cm is especially important for maize (Zea mays), which is commonly planted over the region and has roots at this level. The sample contained stations with records from 1 December 2015 to 31 March 2016, the period considered in this analysis. Only stations with at least 60 days of data were considered and quality control was used to remove unrealistic values, i.e., values outside the typical range of 0 to 0.6 m3 m−3. The level at 20 cm had a median value of 0.083 m3 m−3, while the depth of 40 cm had a median of 0.092 m3 m−3. According to a boxplot of both datasets, the interquartile range for both depths was of 0.08 m3 m−3. This range was due to large values of soil moisture recorded just after rainfall events. According to a t-test with 5% threshold, the means of both depths are not statistically different (t = 0.63, p-value = 0.54). In addition, the difference between medians is lower than the instrument uncertainty, reported before as 0.03 m3 m−3.
Characterization of the soil water content variability presented here was conducted in the period from 1 December 2015 to 31 March 2016. This period included most of the rainy season over the southern half of the domain, below latitude 10° S, and the start of the rainy season for regions close to the Equator, which goes from February to May. This period was chosen since it was closest to the end of sensors setup in December and included months with unusual patterns of rainfall when compared to the climatology. It should be noted that, for a detailed analysis of the seasonality of soil moisture over the region, a longer period of data should be used, which goes beyond the scope of this work.
From 2015 to 2016 corresponded to a strong El Nino event, where rainfall in FMAM 2016 was about 60% below the 1981–2010 mean. At the decadal time scale, the recent five years (2011–2016) have been drier as compared to the previous decades. From the middle 1990s to 2016, 16 out of 25 years experienced rainfall below normal [34]. Figure 2 shows that the transition 2015/2016 was characterized by dry months and months exceeding the climatological average, which provided a valuable case study of an unusual rainy season and its impact on drought conditions. January 2016 was wetter than normal while FMAM was drier than normal, as above indicated.

3. Methodology

SMI was calculated considering the water available to roots according to the following equation:
S M I = θ W P F C W P
where θ is the volumetric soil moisture at 20 cm, measured in m3 m−3, and WP and FC refer to the wilting point and field capacity, respectively [10,19]. The wilting point is the value at which water droplets are strongly attached to soil particles and cannot be retrieved from roots anymore. The field capacity represents the maximum water holding capacity of soil before saturation and is typically reached 2–3 days following a rainfall event. The index represents a normalization of the available soil water and sometimes the equation is modified to have values reported with a scale ranging from −5 to 5, or from −5 to 0 [10]. Values of FC and WP for each station were obtained following granulometric analysis of soil samples collected during fieldwork.
A representative soil sample of each site (0.5 kg) was derived from a composite mixture of five samplings taken at 0–20 cm depth, in an area of 3 m × 3 m, and placed in a plastic soil sample bag, identified by location and date of collection. The samples were further transported to the Department of Soil Science from University of São Paulo (Piracicaba, Brazil) for soil physical and chemical analysis. The determination of soil texture was based on Buyoucos method, according to Dane et al. [47]. The size limits for different fractions according to USDA (United States Department of Agriculture) are as follows: coarse sand, from 2.0 to 0.25 mm; fine sand, from 0.25 to 0.05 mm; silt, from 0.05 to 0.002 mm; and clay, less than 0.002 mm.
Values of FC and WP were reported in gravimetric units, i.e., g g−1, and converted to volumetric units (m3 m−3) considering the water density ( ρ w ) and soil bulk density ( ρ b ) according to Equation (2). While water density has the value of 1, typical values of the soil bulk density were considered for each soil texture class, as presented in Table 1 [48].
θ v o l = ρ b ρ w θ g
The typical soil texture for the locations used in this study can be seen in Figure 3, where the color scale refers to the wilting point. Sandy soils are prevalent in the region, although other textures are also common. SMI was calculated using individual values of wilting point and field capacity for each station. In addition, the dataset was used to calculate the typical values of FC and WP for different textures of soil in the region (Figure 4), according to USDA classes.
SMI uncertainty was estimated by combining the errors of soil moisture, field capacity and wilting point. The errors were combined as the square root of the sum of squares of each error, according to the following equation:
e S M I = e S M 2 + e F C 2 + e W P 2
where the subscripts denote the respective errors of soil moisture, field capacity and wilting point. The error for soil moisture was considered as the sensor uncertainty (0.03 m3 m−3), and the errors for FC and WP were calculated as the standard deviation of values from the soil sample analysis ( e F C = 0.12   m 3   m 3 ;   e W P = 0.05   m 3   m 3 ). Overall, the error for SMI was of ±0.1 (unitless).
SMI was used to derive a metric to evaluate the crop risk to water stress: the Index of Stress in Agriculture (ISA). This index represents graphically the status of high risk for crops under water stress during a continuous period. The calculation of ISA status was based on two conditions: red color, SMI < 0.4 during seven consecutive days; and, orange color, SMI < 0.4 during three consecutive days. The number of consecutive days was chosen as an example for this study, based on a typical time frame associated with physiological changes in plants under stress [49,50], but it can be easily changed when the system is implemented in an interactive platform.
All data processing, statistics and maps were done using Python (version 3.5, Python Software Foundation, Wilmington, DE, USA), specifically the scientific and data analysis packages such as numpy, scipy and pandas, which are freely available and highly documented over the Internet. The processing steps were programmed, enabling the whole system to be implemented to run automatically on a daily basis, as soon as new data are available.

4. Results and Discussion

The dataset chosen in this analysis included a rainy season over the region during the transition from 2015 to 2016 (Figure 2). December 2015 and February 2016 were characterized by lower than average sums, while rainfall in January exceeded the climatological average in all bands of latitude. The period was very appropriate to illustrate different ways of visualizing short-term drought information, considering the following approaches: a spatial representation using SMI, a spatiotemporal visualization with time series of the previous 30 days, and a measure of exposure to water stress during several days.

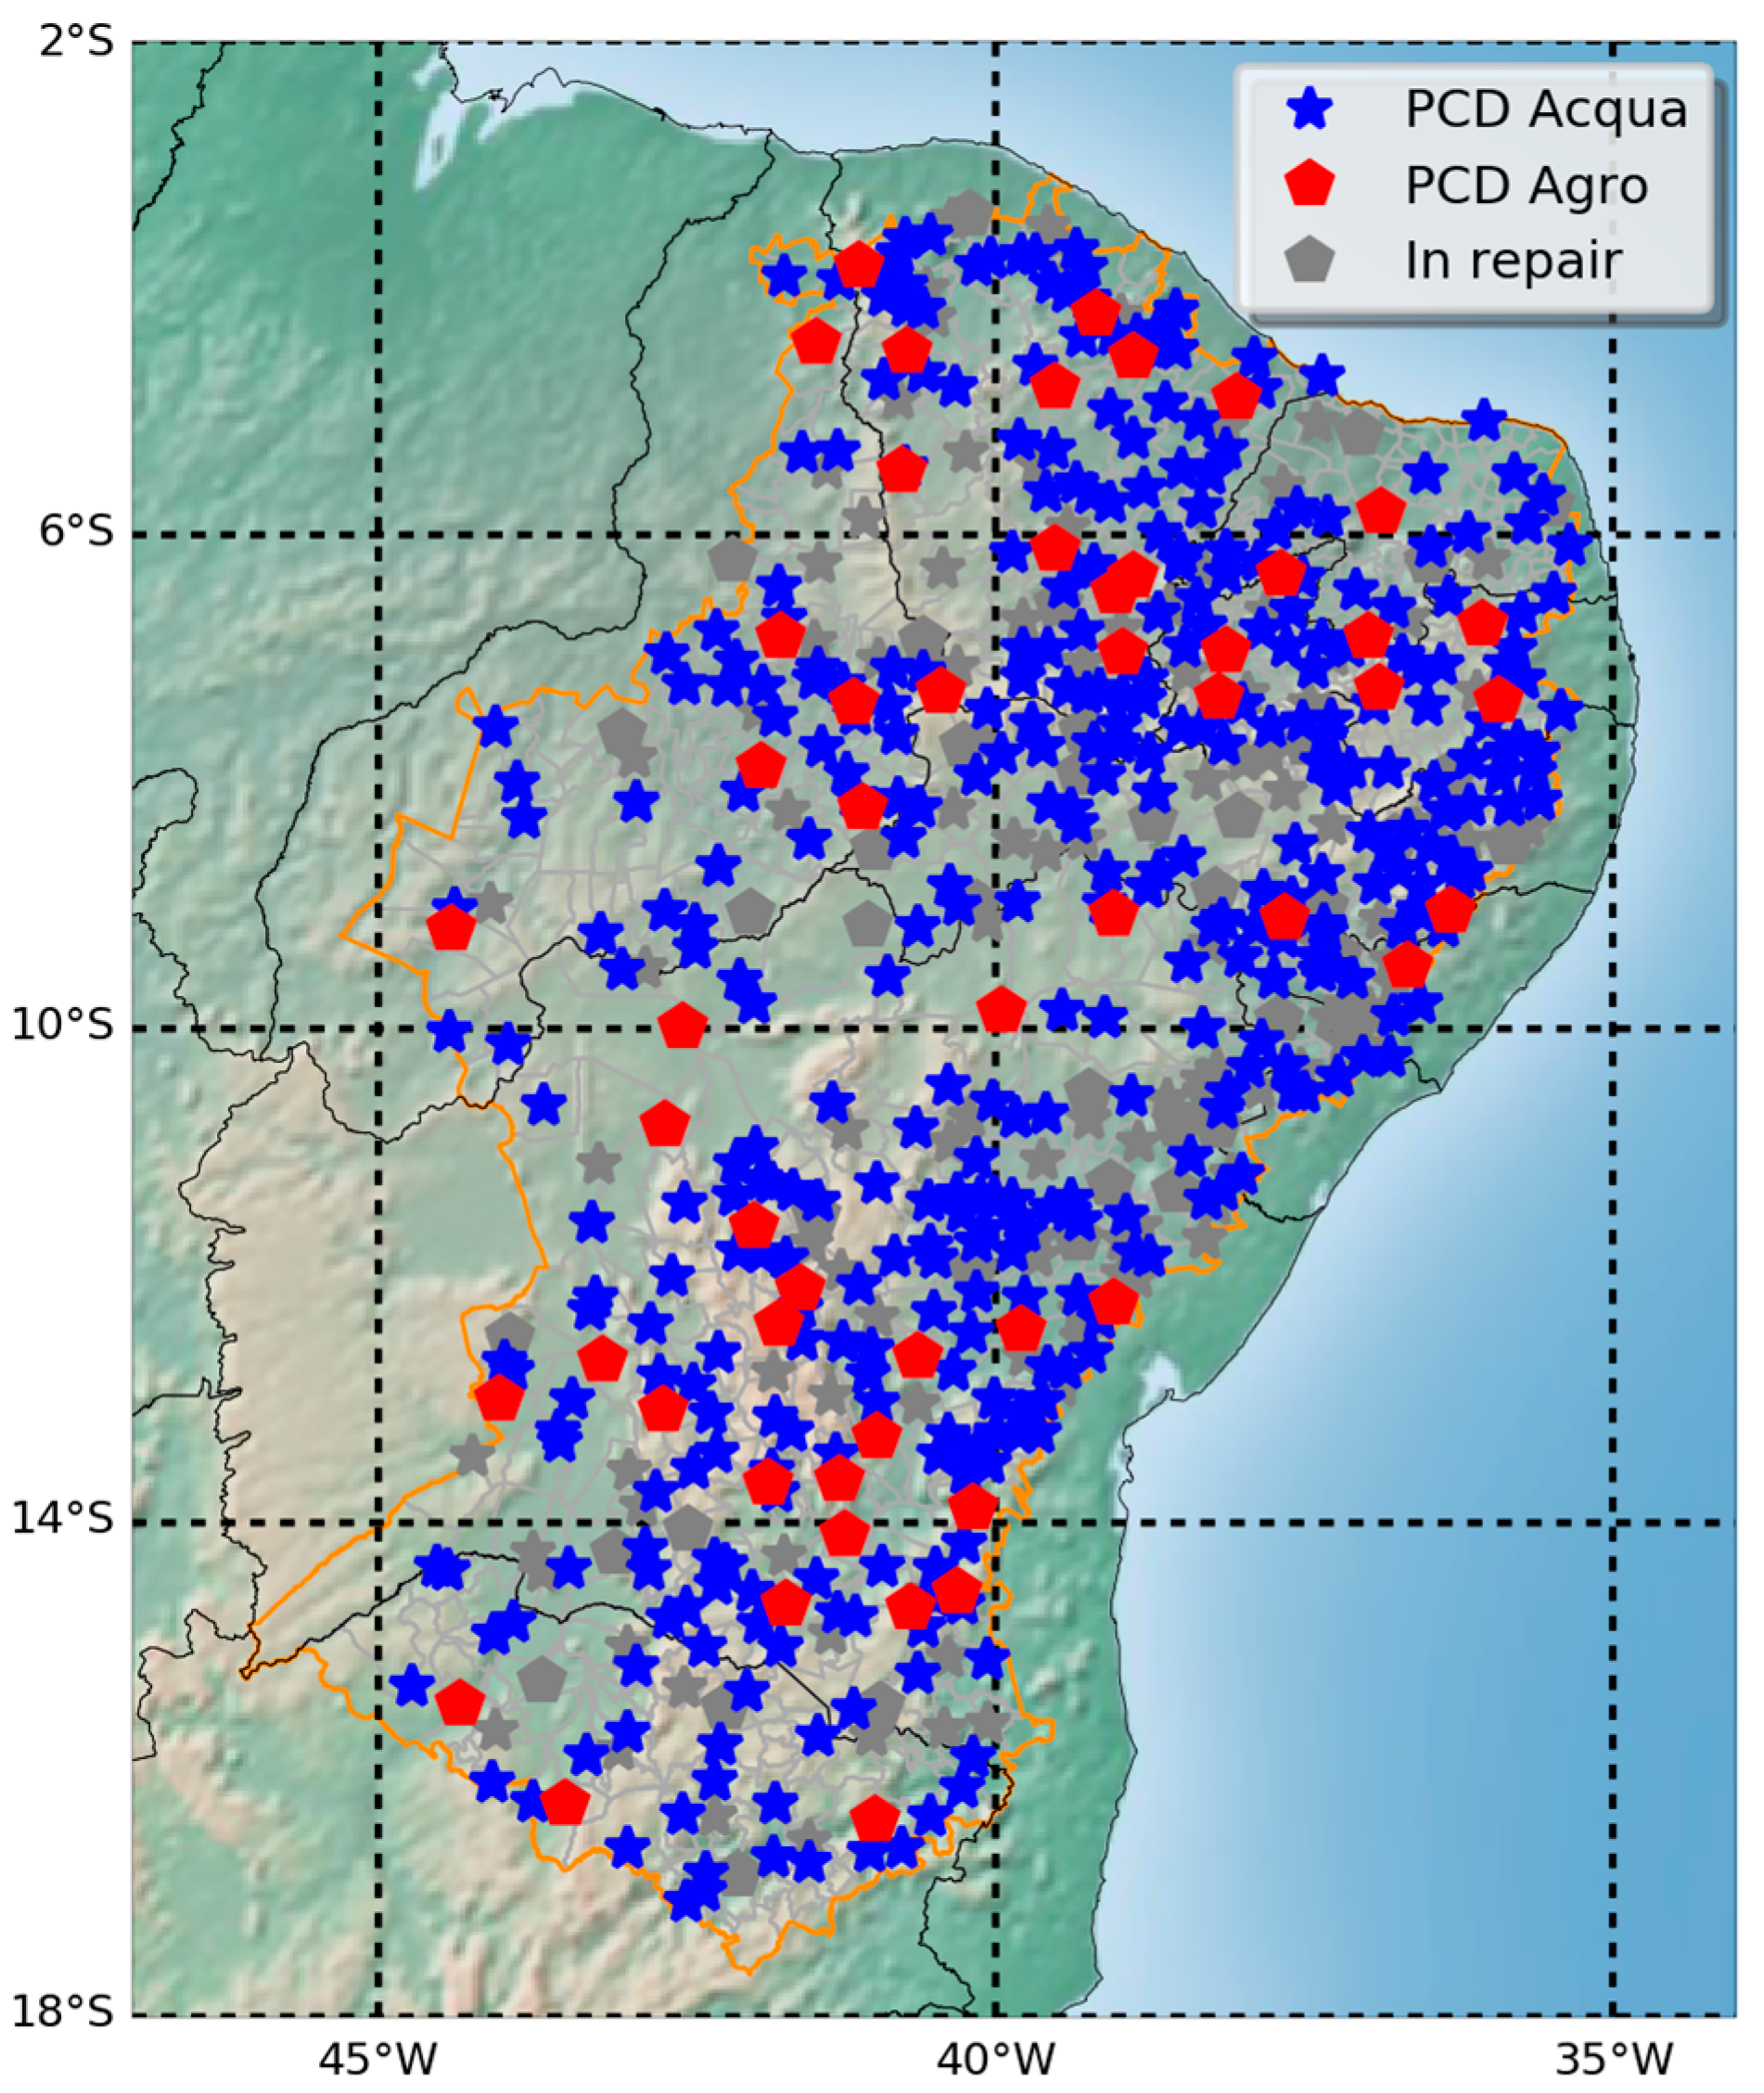
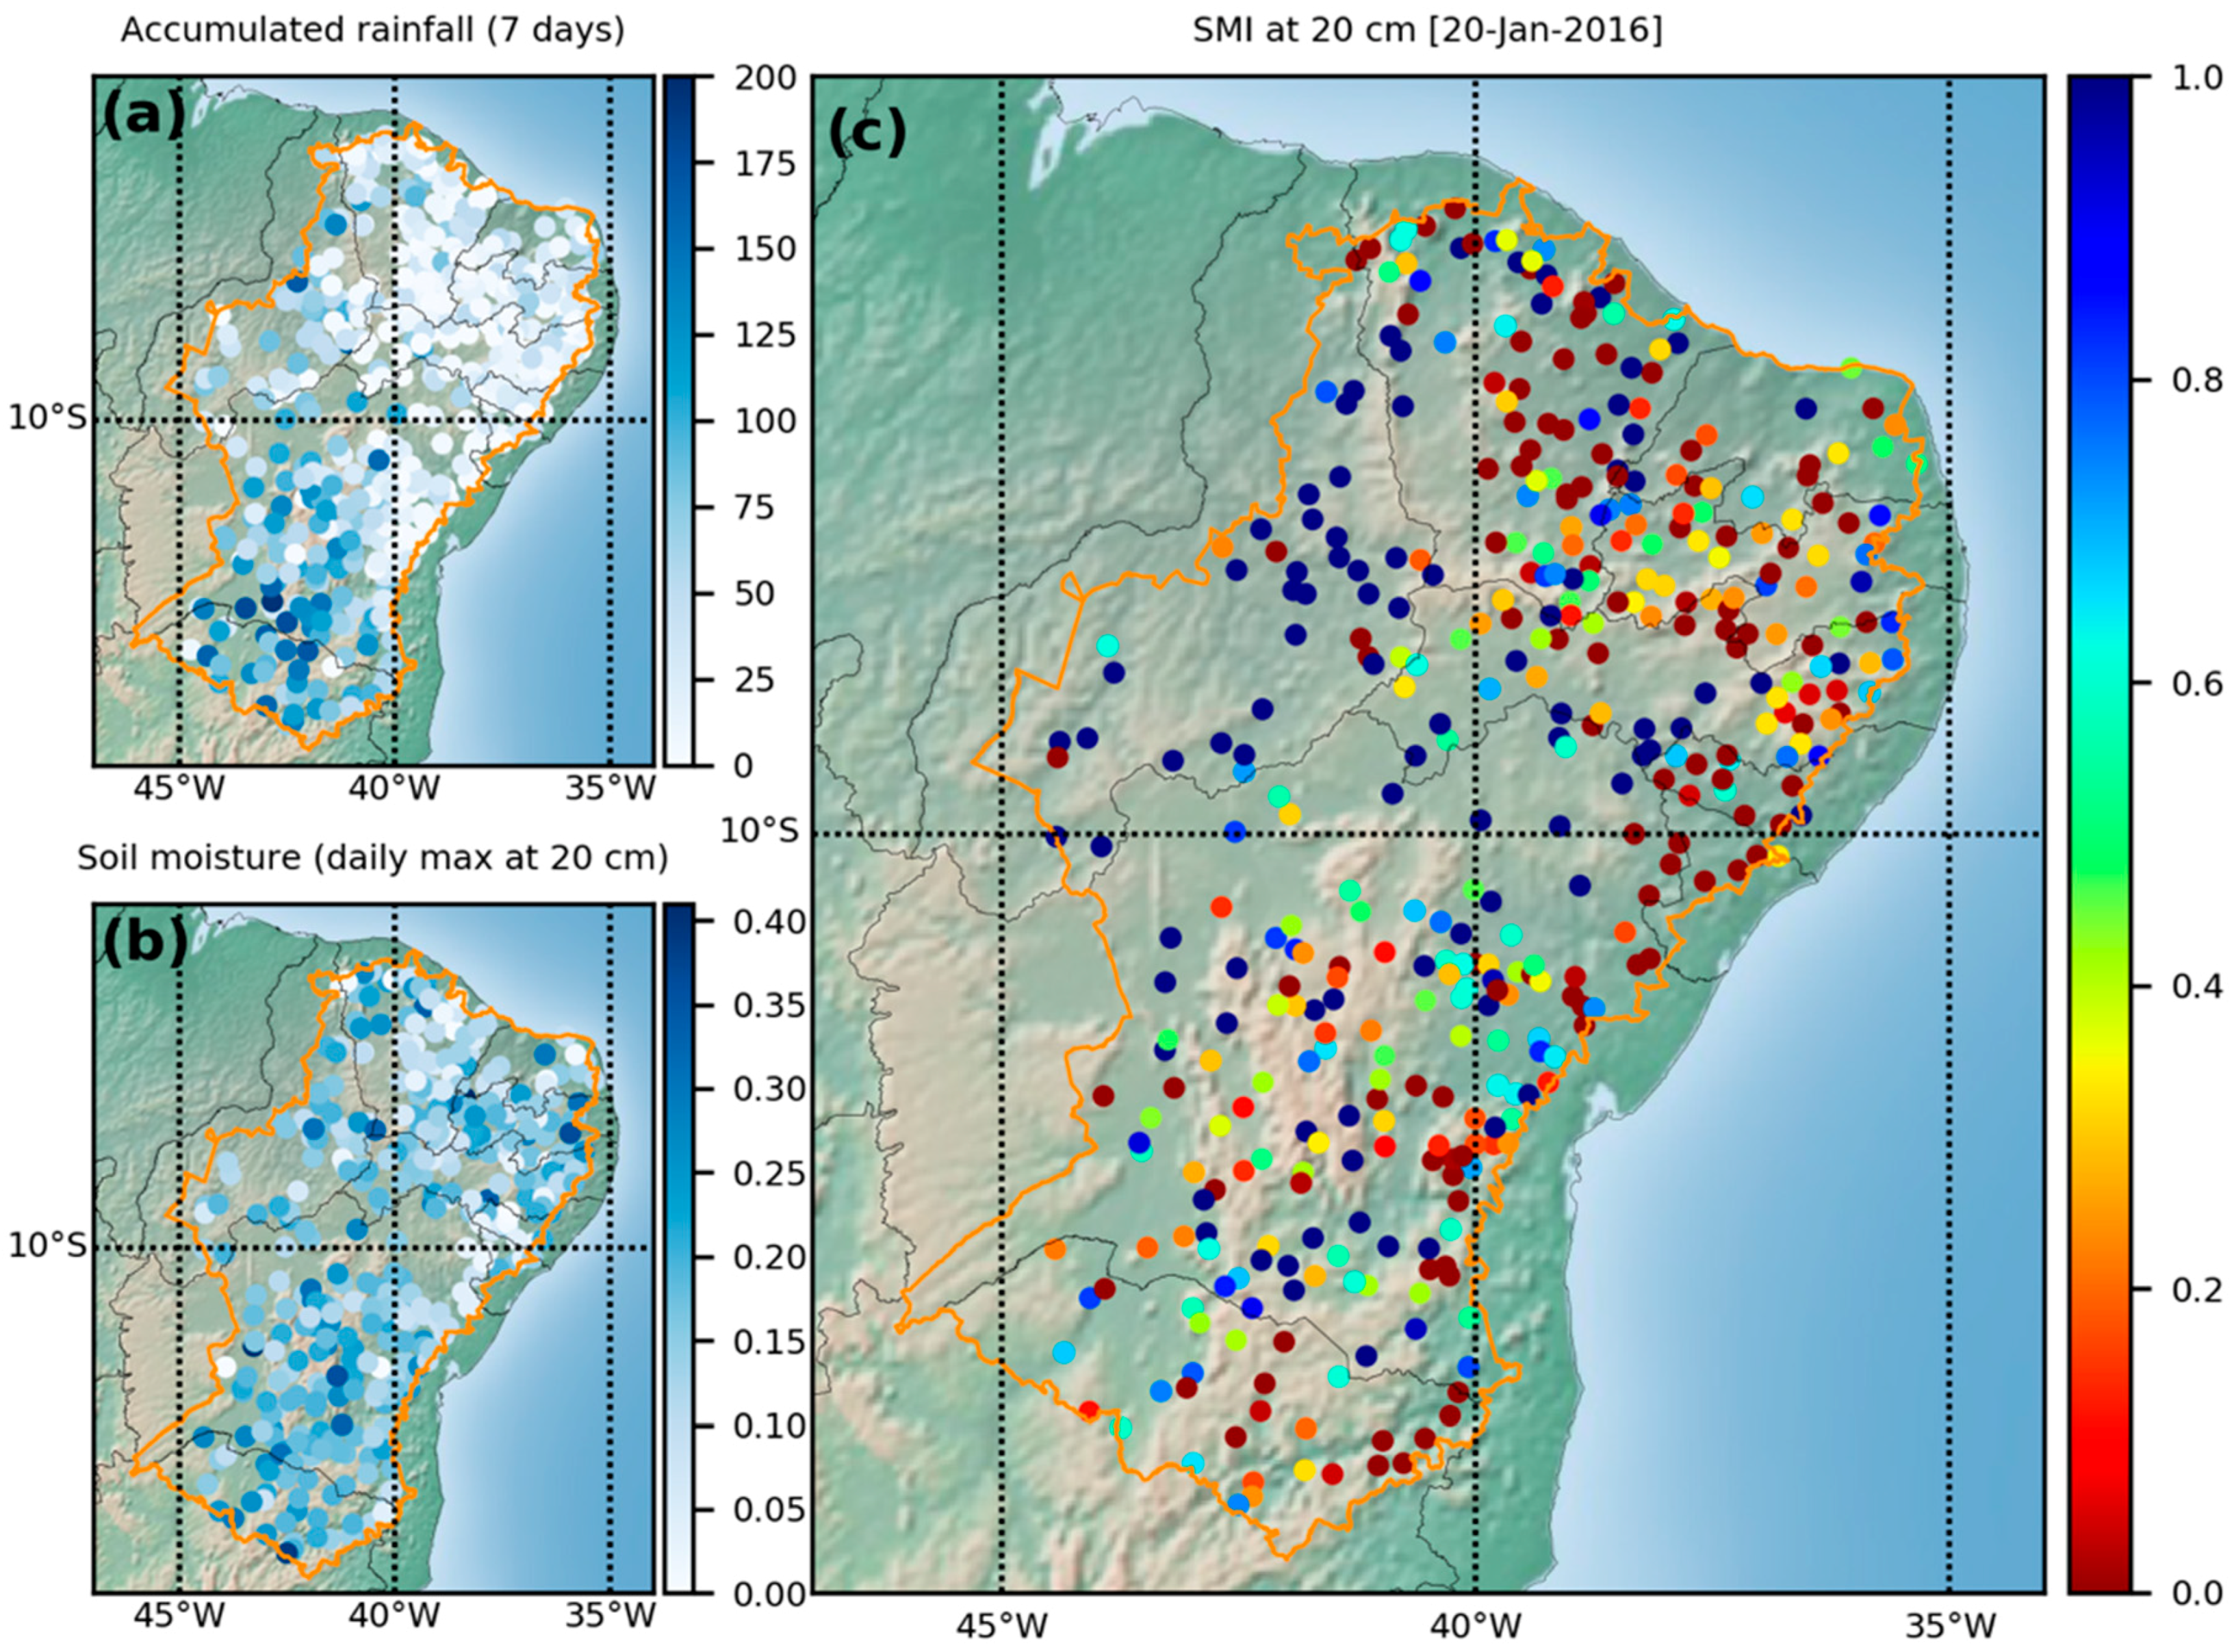
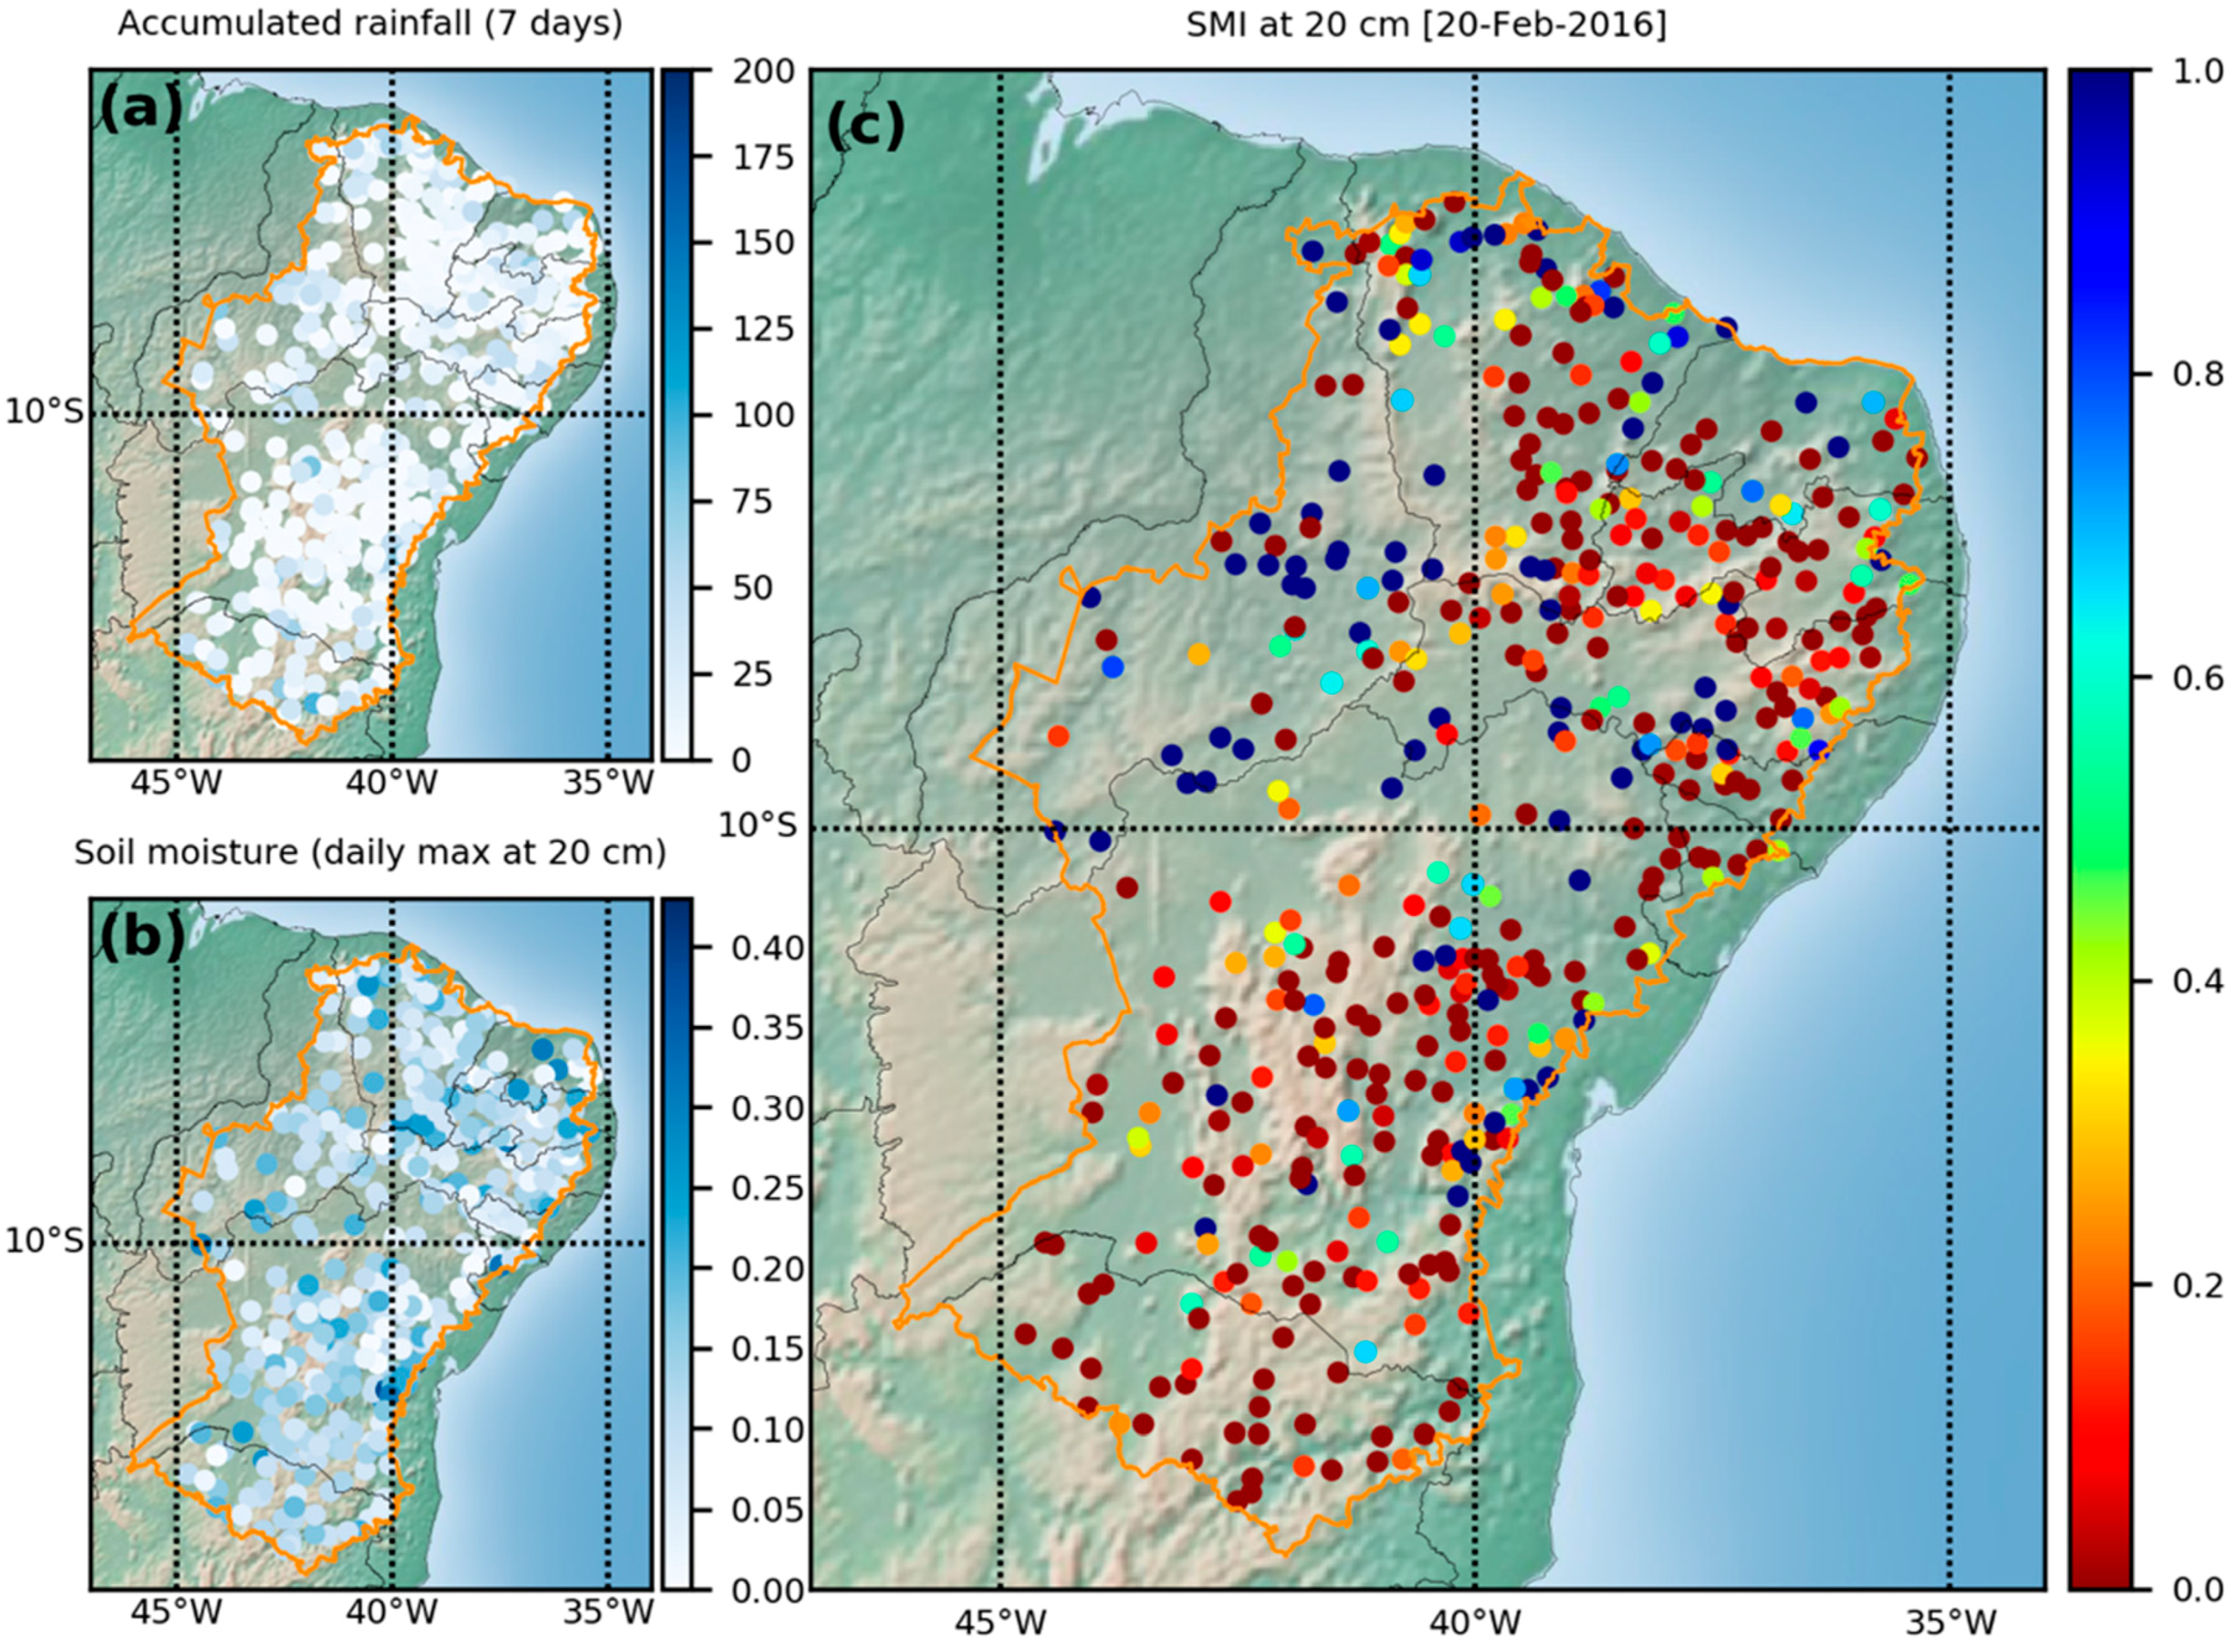
4.1. Spatial Representation

Rainfall, soil moisture and SMI were chosen for the spatial representation of drought (Figure 5 and Figure 6). Figure 5a and Figure 6a show the accumulated rainfall seven days prior to the date on top of the figure; the actual soil moisture is shown in Figure 5b and Figure 6b. SMI is shown in Figure 5c and Figure 6c for each station. Spatial interpolation was not used to avoid distortions over areas without measurements. Displaying accumulated rainfall helps to explain the patterns of soil moisture and SMI. The value of soil moisture in Figure 5b and Figure 6b is also important to users that are familiar with field measurements and typical values expected or close to important thresholds. Finally, higher visibility was given to SMI since the normalization in its calculation makes it easily comparable among regions, as opposed to the actual soil moisture, which is associated with different saturation and critical values depending on the soil texture class.
The dates chosen for SMI in Figure 5 and Figure 6 represent two contrasting states of the soil water in the evaluated period. While January was very wet in most of the region (Figure 5), one month later the conditions were of severe drought (Figure 6). It should be noted that the visualization of drought conditions shown in Figure 5 and Figure 6 could be updated as new information is available. To show the temporal evolution of SMI, the spatiotemporal approach was also considered, as described in Section 4.2.

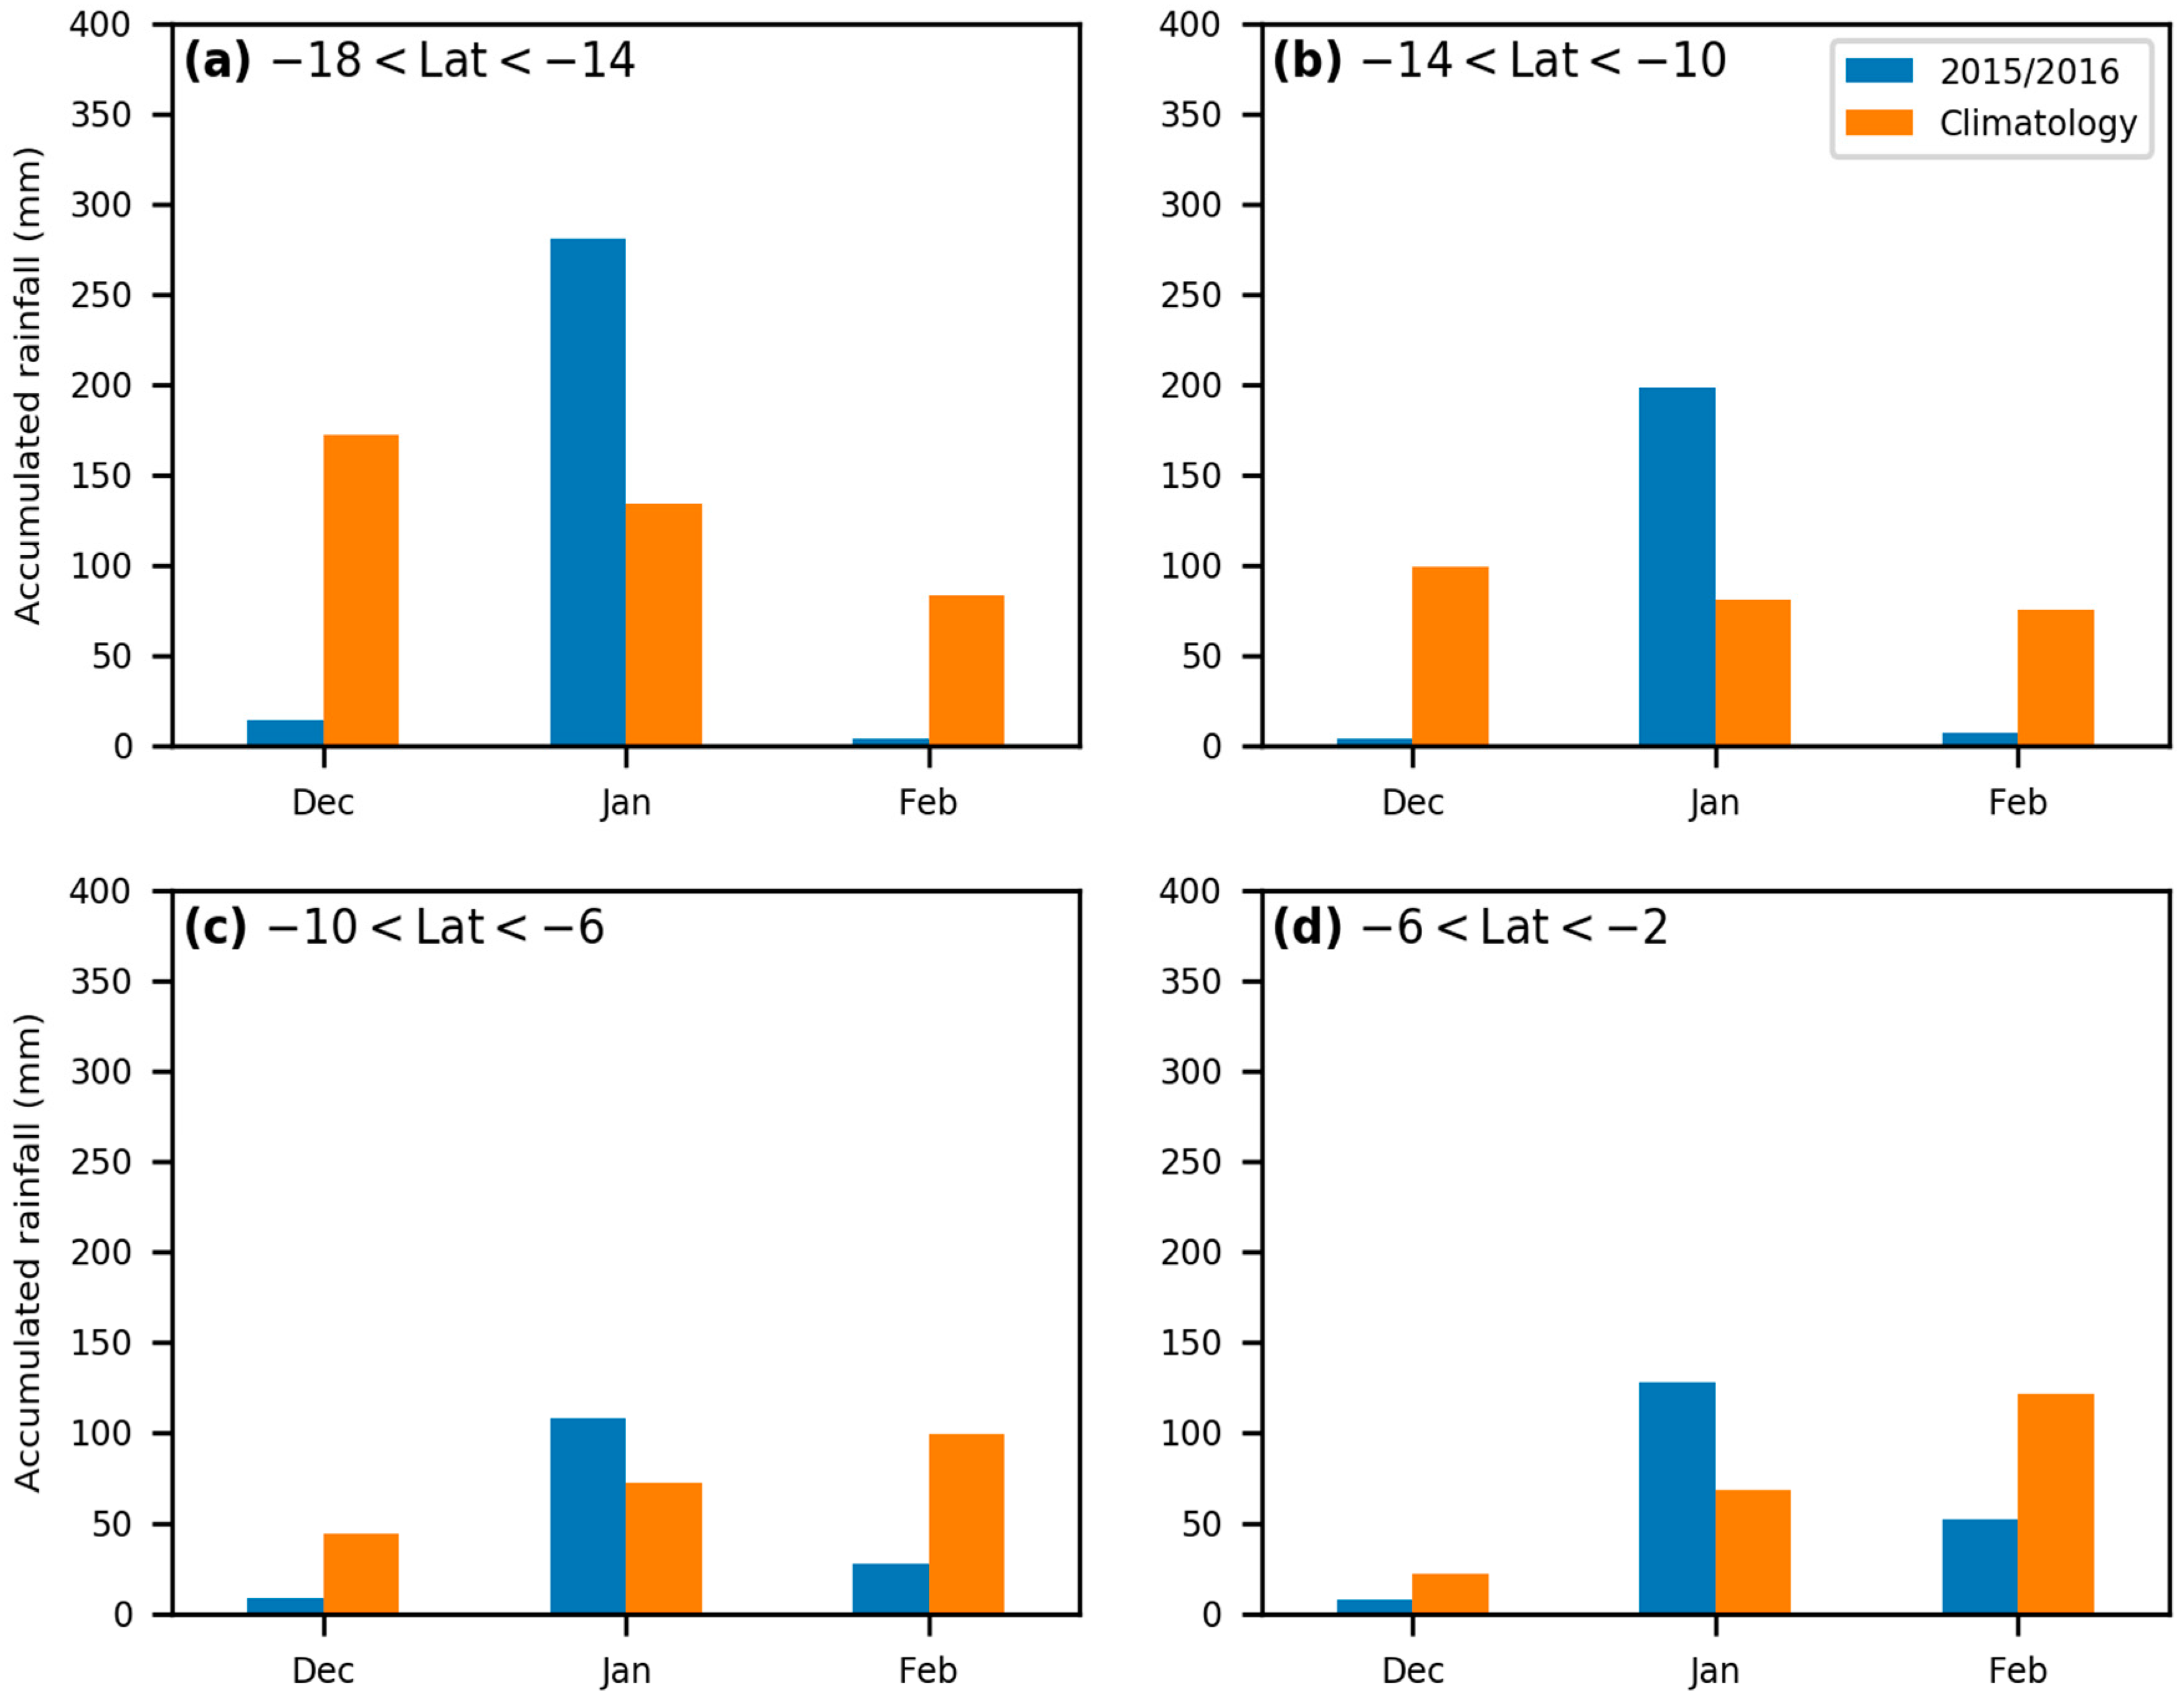
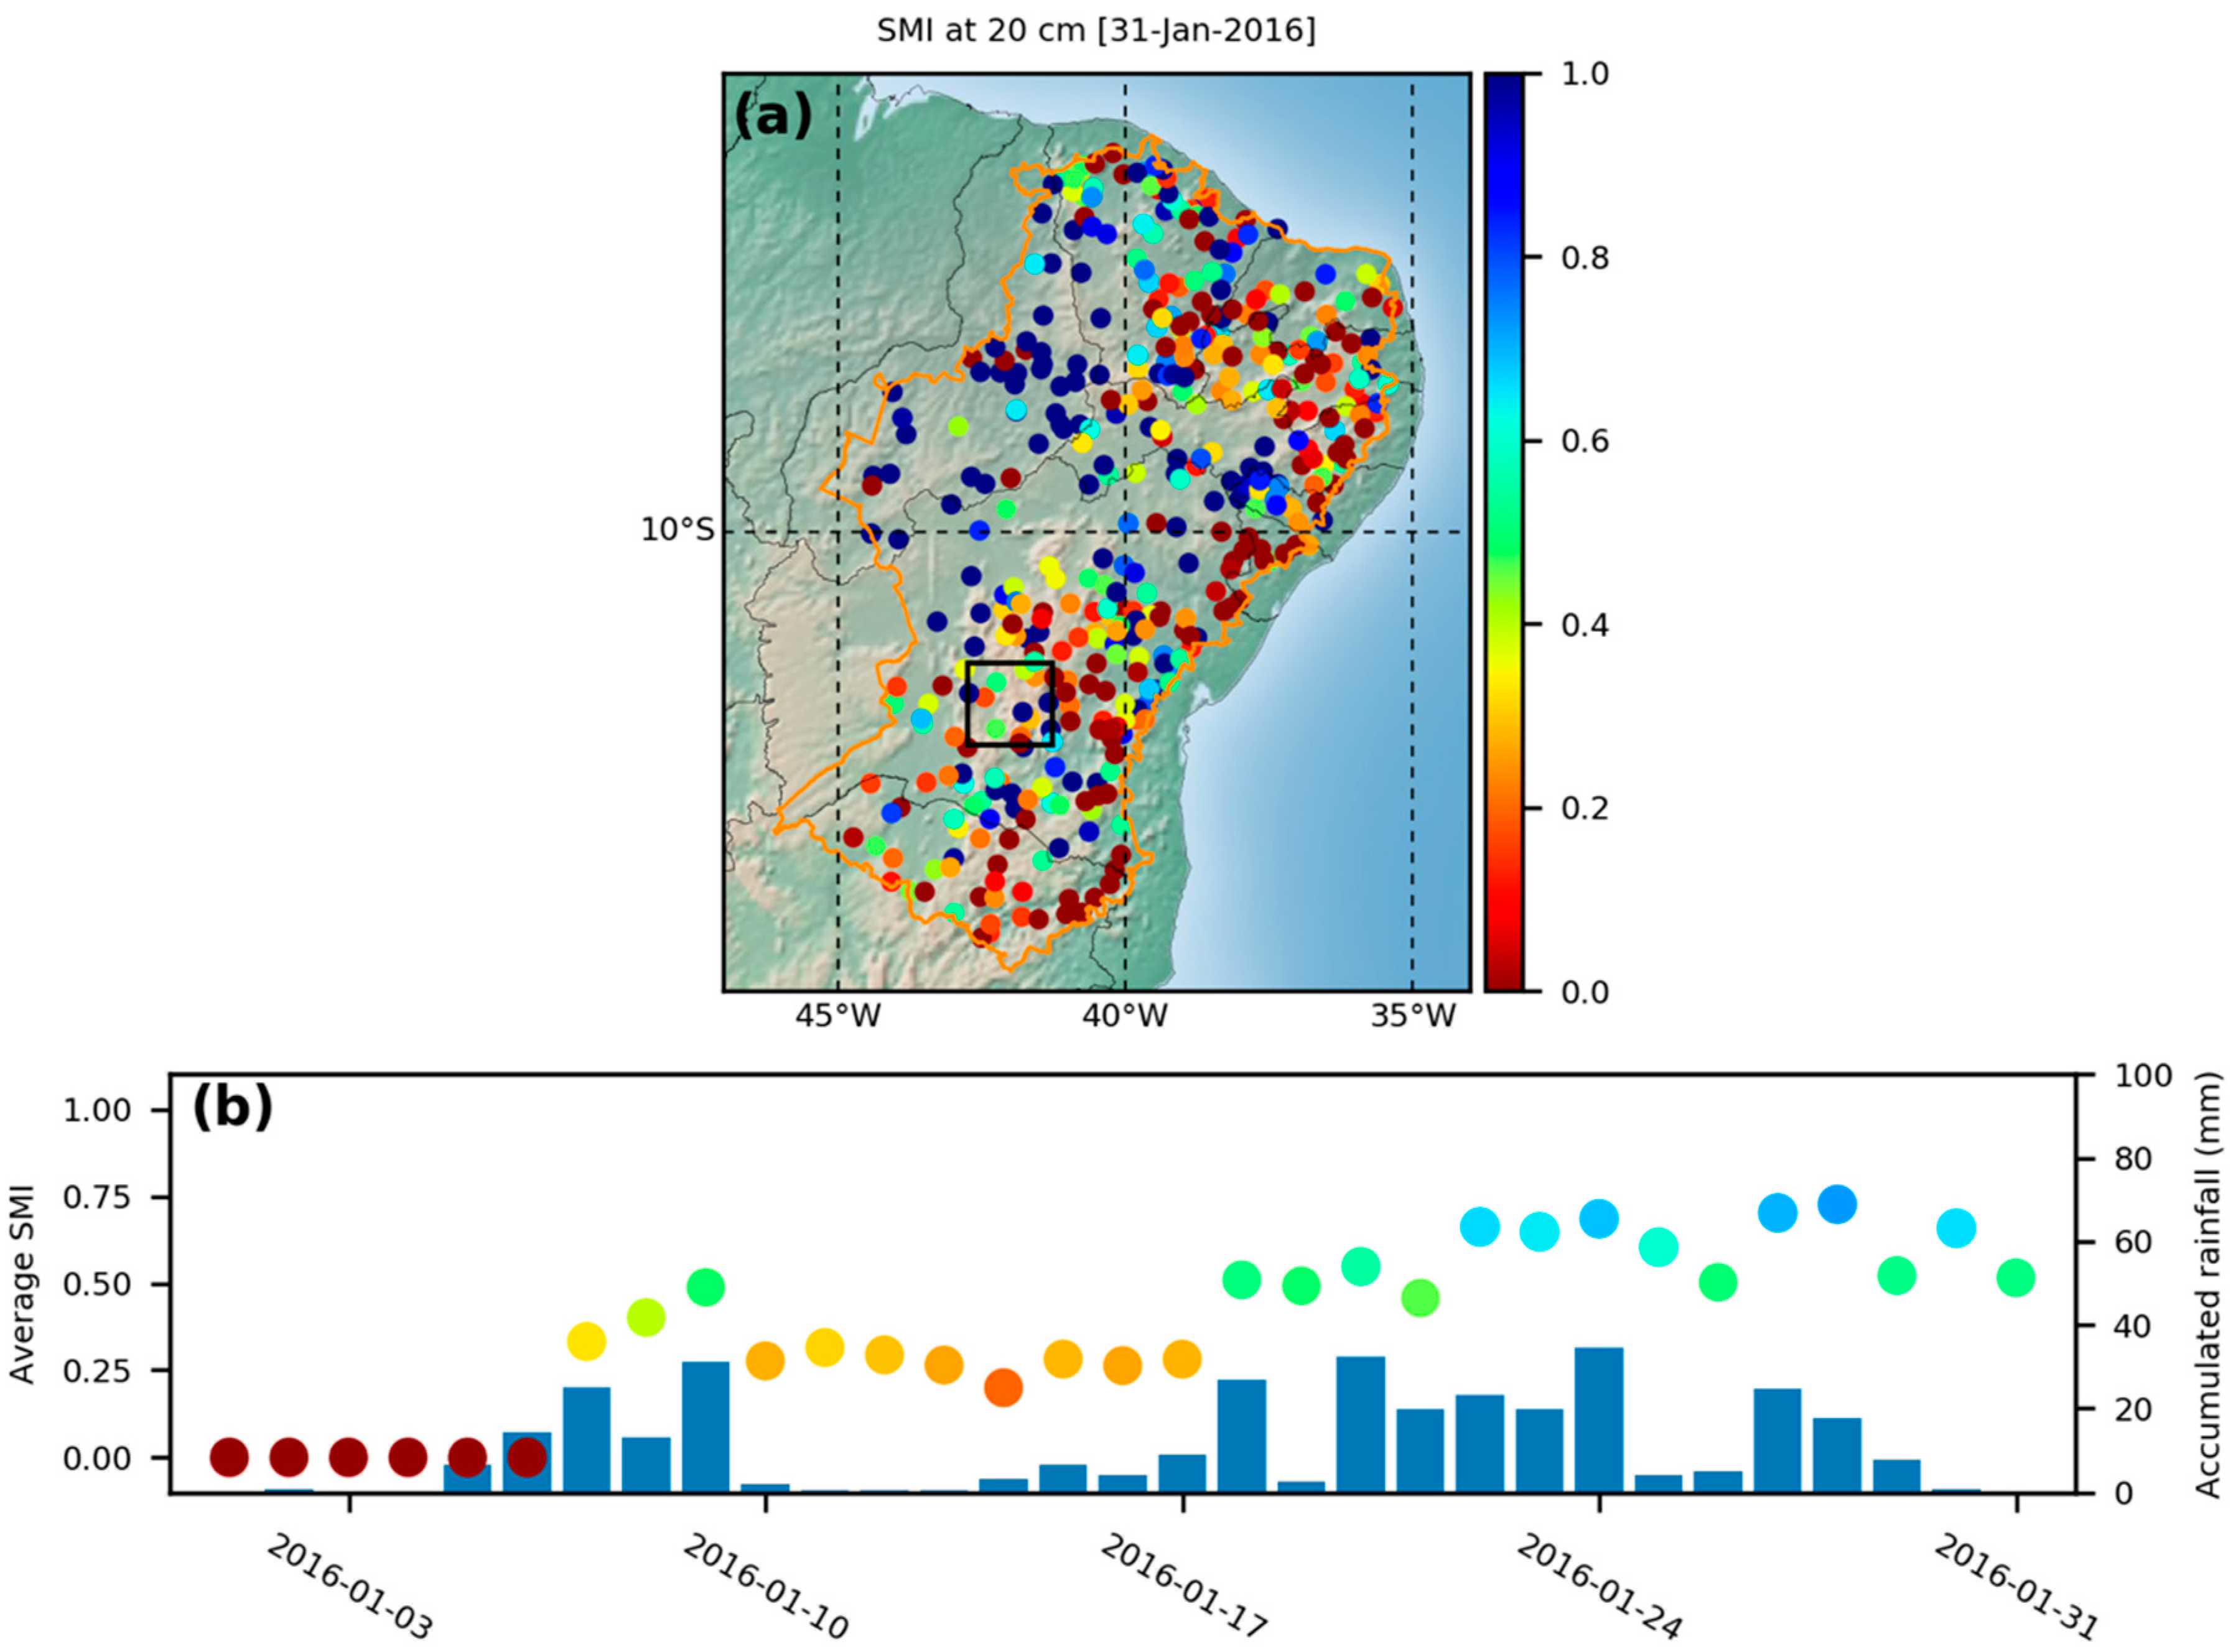
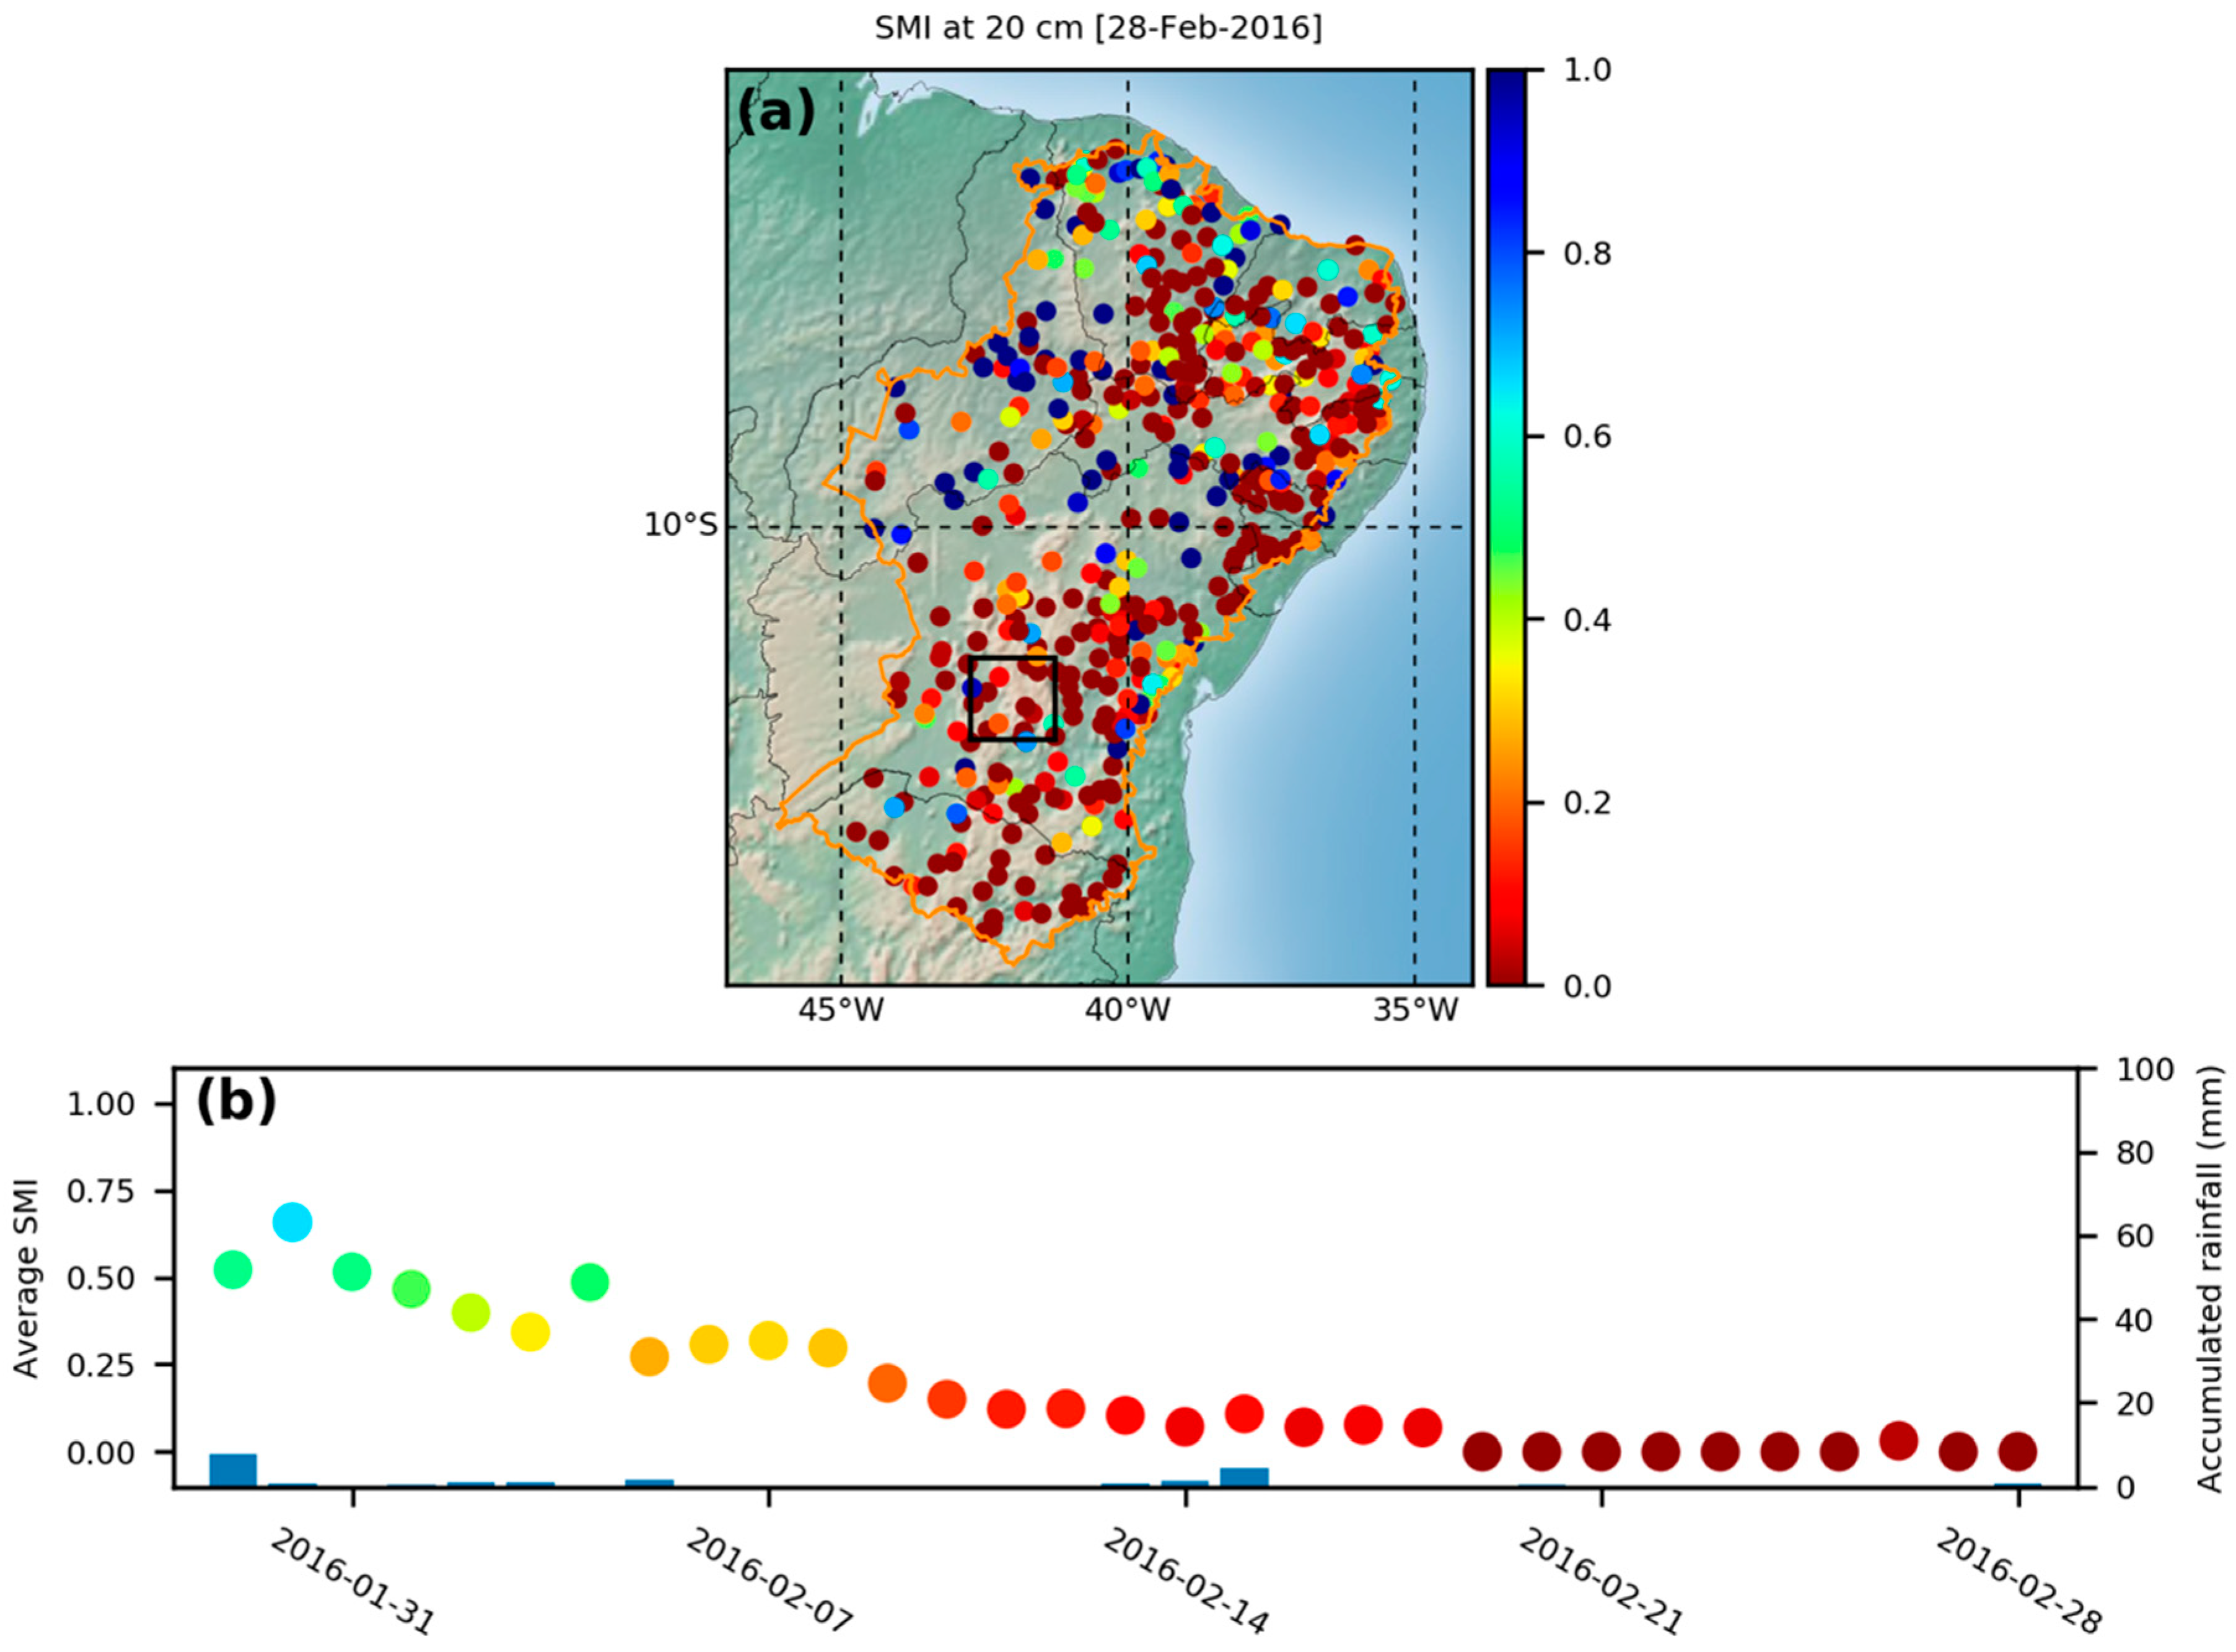
4.2. Spatiotemporal Representation

Soil moisture has a slow evolution between rainfall events, usually decreasing continually as water is lost due to evapotranspiration. Conversely, values increase fast after a rainfall event, consequently changing also the value of SMI. The time series of SMI offer valuable information of how short-term drought is affecting a given location. For this reason, the spatiotemporal representation of SMI (Figure 7 and Figure 8) shows time series for an arbitrarily selected area, represented by the black rectangle in Figure 7a and Figure 8a. Figure 7b and Figure 8b show the average time series of SMI, calculated considering all the stations within the selected rectangle. The sudden change of SMI is evident on 7 January (Figure 7b) after rainfall events. The same region was selected in Figure 8 for 28 February, illustrating in Figure 8b the previous 30 days when rainfall stopped at the end of January and SMI started to decrease. While the spatial visualization of SMI (Figure 5 and Figure 6) is useful for the real time state of soil water, time series inform users of trends in SMI. The integration of weather forecast for each location would make it possible to show an upward or downward trend for days or weeks in the future. Such integration is under development and will be discussed in a future work. The last representation of short-time drought conditions considers the time series for each station and long exposure to water stress.

4.3. Index of Stress in Agriculture

ISA was based on the continuous exposure of crops to water stress, derived from the time series of SMI and a critical value (Figure 9). The motivation for this alert was to raise awareness of immediate increase in the risk of crop failure. Usually, water stress is triggered in plants when SMI is under the value of 0.4. It should be noted that this value is an approximation of typical thresholds observed in experimental studies for maize and can be different for other crops and drought resistant varieties. During water stress conditions, the ratio of transpiration to potential evapotranspiration (T/PET) starts to decrease linearly in response to decreasing values of SMI [22,23,25,51]. Water becomes a limiting factor to plant transpiration, affecting several aspects of plant growth depending on its stage, including leaf formation and grain yield [52,53].
Figure 9 illustrates the evolution of the number of stations with critical ISA over several dates between January and March. The period was characterized by below-average rainfall in December, higher than average in January, and lower than average in February. Several episodes of rainfall during the second half of January contributed to few or none red alerts up until the beginning of February (Figure 9b,c). Rainfall stopped in February and contributed to an increase in the number of locations with red alerts (Figure 9d–f). The transition during 2015/2016 had a high impact on the agricultural sector of several states in the region, reporting losses of 65% (Piauí) and 80% (Sergipe) of annual yields for soybean and beans, respectively, the worst scenario since 2011 [54]. In the state of Ceará, the period from February to May was the eighth driest, when considering the average between 1981 and 2010 [55]. Overall, grain yields (rice, beans, maize, among others) had an average reduction of approximately 29.9% over NEB [56].
When determining the color scale for the alerts of ISA, the number of consecutive days was chosen as an example, and it can be easily changed when the system is implemented in an interactive platform. Different users might change the criteria based on the sensitivity of the crops in a given area, based on empirical evidence and common practices. The exact tolerance of soil drying is highly dependent on the growth stage and species. For instance, experiments of water stress and soil drying has shown significant physiological changes 3–5 days after withholding irrigation, especially in stomatal closure and leaf and stem extension rates [49,50].
The objective of developing ISA was to quantify the short-term risk associated with the exposure of crops to adverse environmental conditions, in this case, water stress. It should be noted that water stress is not always associated with a single environmental variable and can be simultaneously influenced by soil water conditions, extremes of air temperature, air humidity, salinity, etc. The short-term risk shown in Figure 9 is only a fraction of the environmental threats to crops. Future work should aim at validating the risk with feedback from users, both local people and external actors, to calibrate the system with critical thresholds of soil moisture and consequent impact on drought and crop productivity.
Another goal of ISA is to support the implementation of rapid-response actions and measures. The easiness of utilization and reliability of ISA can support the formulation of effective drought risk communication to diverse stakeholder groups, especially those vulnerable to such situation. The idea is to provide proactive early-warning information instead of practices based on crisis management approach, which can be reactive and ineffective [57].

5. Conclusions

Short-term drought information from soil water using three approaches highlighting spatial, temporal and agricultural risk aspects were presented in this work. The analysis was supported by a unique network of soil moisture sensors installed over rural sites in the Brazilian semiarid region. The period of analysis was characterized by months with rainfall well below the average, leading to reports of low productivity of maize, soybean and beans in several states. A new index (ISA) was proposed to identify stations under water stress during continuous days, which can lead to permanent damage to plants and impacts on yields. The index is based on SMI and depends on continuous measurements and fast reporting of results in maps and time series.
Soil moisture communication was tested using spatial and temporal approaches, with the support of local information on soil characteristics. The spatial approach, with integrated visualization of rainfall, soil moisture and SMI helps to bring awareness of the real time conditions over an area of interest. The normalization provided by SMI makes it possible to compare the actual soil moisture status in neighboring stations and regions. The temporal visualization with time series of SMI informs on the memory of soil moisture in previous days and weeks, and the response to rainfall events. The time series help to characterize the occurrence of dry spells and possible impacts during critical phenological stages of crops. Finally, continuous exposure to water deficit, based on critical SMI, was used to inform on increasing risk for crops. These tools contribute to the real time monitoring of soil moisture and support actions and planning aimed at reducing the risk of crop failure.
The efficient communication of drought risk can engage citizens, communities and government agencies to act on drought mitigation and preparedness plans to assist the vulnerable farmers. In addition, the system can be used to monitor periods requiring irrigation, when it is available. The indicators of water stress and short-term drought presented in this study will be implemented through an online platform. Each of the data visualizations has a degree of customization and interaction, enabling users to interact and access values of soil water for specific depths, areas or periods of the recent past.
Due to the recent implementation of the network, it was not possible to develop studies of long-term trends in soil moisture over the region. However, the network can already be used to monitor the agricultural risk over the area. The effective communication of results can lead to more users and improvements based on feedbacks. In addition, municipalities not yet covered by the network might be interested in joining the effort by installing sensors and helping with the maintenance.

Author Contributions

Conceptualization, M.Z. and J.M.C.; Methodology, M.Z., R.C., L.R.S., M.V.-L. and D.U.; Data Curation, M.Z., D.U., L.R.S. and M.V.-L.; Formal Analysis, M.Z., R.C. and J.M.C.; Writing-Original Draft Preparation, M.Z., G.C.-Z., J.M. and J.M.C.; and Writing-Review and Editing, J.M., G.C.-Z. and R.C.S.A.

Funding

This research received no external funding.

Acknowledgments

The authors are grateful to UNESCO (United Nations Educational, Scientific and Cultural Organization) for the support with consultants for visiting of potential locations for monitoring stations. The work of the following consultants is acknowledged: Adilson Rodrigues Soares, Alexandra Coraça de Freitas, Antonio Bandeira de Almeida, Claudio Rogerio Pontes, Erico Fernando Lopes Pereira da Silva, Katiane Pelicioni Rodrigues, and Sander Renato Lara Ferreira.

Conflicts of Interest

The authors declare no conflict of interest.

References

  1. Seneviratne, S.I.; Corti, T.; Davin, E.L.; Hirschi, M.; Jaeger, E.B.; Lehner, I.; Orlowsky, B.; Teuling, A.J. Investigating soil moisture–climate interactions in a changing climate: A review. Earth Sci. Rev. 2010, 99, 125–161. [Google Scholar] [CrossRef]
  2. Rossato, L.; Marengo, J.A.; Angelis, C.F.; de Pires, L.B.M.; Mendiondo, E.M. Impact of soil moisture over Palmer Drought Severity Index and its future projections in Brazil. RBRH 2017, 22. [Google Scholar] [CrossRef] [Green Version]
  3. Mishra, V.; Shah, R.; Thrasher, B. Soil moisture droughts under the retrospective and projected climate in India. J. Hydrometeorol. 2014, 15, 2267–2292. [Google Scholar] [CrossRef]
  4. McColl, K.A.; Alemohammad, S.H.; Akbar, R.; Konings, A.G.; Yueh, S.; Entekhabi, D. The global distribution and dynamics of surface soil moisture. Nat. Geosci. 2017. [Google Scholar] [CrossRef]
  5. Ionita, M.; Dima, M.; Lohmann, G.; Scholz, P.; Rimbu, N. Predicting the June 2013 European flooding based on precipitation, soil moisture, and sea level pressure. J. Hydrometeorol. 2015, 16, 598–614. [Google Scholar] [CrossRef]
  6. Dorigo, W.; van Oevelen, P.; Wagner, W.; Drusch, M.; Mecklenburg, S.; Robock, A.; Jackson, T. A new international network for in situ soil moisture data. Eos Trans. Am. Geophys. Union 2011, 92, 141. [Google Scholar] [CrossRef]
  7. Champagne, C.; Rowlandson, T.; Berg, A.; Burns, T.; L’Heureux, J.; Tetlock, E.; Adams, J.R.; McNairn, H.; Toth, B.; Itenfisu, D. Satellite surface soil moisture from SMOS and Aquarius: Assessment for applications in agricultural landscapes. Int. J. Appl. Earth Obs. Geoinf. 2016, 45, 143–154. [Google Scholar] [CrossRef]
  8. Cammalleri, C.; Micale, F.; Vogt, J. On the value of combining different modelled soil moisture products for European drought monitoring. J. Hydrol. 2015, 525, 547–558. [Google Scholar] [CrossRef]
  9. Adegoke, J.O.; Carleton, A.M. Relations between soil moisture and satellite vegetation indices in the U.S. Corn Belt. J. Hydrometeorol. 2002, 3, 395–405. [Google Scholar] [CrossRef]
  10. Sridhar, V.; Hubbard, K.G.; You, J.; Hunt, E.D. Development of the soil moisture index to quantify agricultural drought and its “user friendliness” in severity-area-duration assessment. J. Hydrometeorol. 2008, 9, 660–676. [Google Scholar] [CrossRef]
  11. Hunt, E.D.; Svoboda, M.; Wardlow, B.; Hubbard, K.; Hayes, M.; Arkebauer, T. Monitoring the effects of rapid onset of drought on non-irrigated maize with agronomic data and climate-based drought indices. Agric. For. Meteorol. 2014, 191, 1–11. [Google Scholar] [CrossRef]
  12. Carrão, H.; Naumann, G.; Barbosa, P. Mapping global patterns of drought risk: An empirical framework based on sub-national estimates of hazard, exposure and vulnerability. Glob. Environ. Chang. 2016, 39, 108–124. [Google Scholar] [CrossRef]
  13. Gao, Y.; Markkanen, T.; Thum, T.; Aurela, M.; Lohila, A.; Mammarella, I.; Kämäräinen, M.; Hagemann, S.; Aalto, T. Assessing various drought indicators in representing summer drought in boreal forests in Finland. Hydrol. Earth Syst. Sci. 2016, 20, 175–191. [Google Scholar] [CrossRef]
  14. Albergel, C.; Dorigo, W.; Reichle, R.H.; Balsamo, G.; de Rosnay, P.; Muñoz-Sabater, J.; Isaksen, L.; de Jeu, R.; Wagner, W. Skill and global trend analysis of soil moisture from reanalyses and microwave remote sensing. J. Hydrometeorol. 2013, 14, 1259–1277. [Google Scholar] [CrossRef]
  15. Tomasella, J.; Hodnett, M.G.; Rossato, L. Pedotransfer functions for the estimation of soil water retention in Brazilian soils. Soil Sci. Soc. Am. J. 2000, 64, 327. [Google Scholar] [CrossRef]
  16. Rossato, L.; Alvala, R.C.S.; Tomasella, J. Variação espaço-temporal da umidade do solo no Brasil: Análise das condições médias para o período de 1971–1990. Rev. Bras. Meteorol. 2004, 19, 113–122. [Google Scholar]
  17. Rossato, L.; Alvalá, R.C.D.S.; Marengo, J.A.; Zeri, M.; Cunha, A.P.M.D.A.; Pires, L.B.M.; Barbosa, H.A. Impact of soil moisture on crop yields over Brazilian semiarid. Front. Environ. Sci. 2017, 5, 73. [Google Scholar] [CrossRef]
  18. Svoboda, M.; Fuchs, B.A. Handbook of Drought Indicators and Indices; World Meteorological Organization (WMO) and Global Water Partnership (GWP): Geneva, Switzerland, 2016; ISBN 978-92-63-11173-9. [Google Scholar]
  19. Hunt, E.D.; Hubbard, K.G.; Wilhite, D.A.; Arkebauer, T.J.; Dutcher, A.L. The development and evaluation of a soil moisture index. Int. J. Climatol. 2009, 29, 747–759. [Google Scholar] [CrossRef] [Green Version]
  20. Gao, Y.; Markkanen, T.; Aurela, M.; Mammarella, I.; Thum, T.; Tsuruta, A.; Yang, H.; Aalto, T. Response of water use efficiency to summer drought in boreal Scots pine forests in Finland. Biogeosci. Discuss. 2016, 2016, 1–18. [Google Scholar] [CrossRef]
  21. Bradford, K.J.; Hsiao, T.C. Physiological responses to moderate water stress. In Physiological Plant Ecology II. Water Relations and Carbon Assimilation; Lange, O.R., Ed.; Springer-Verlag: Berlin, Germany, 1982; Volume 12B, pp. 263–324. [Google Scholar]
  22. Bréda, N.; Granier, A. Intra- and interannual variations of transpiration, leaf area index and radial growth of a sessile oak stand (Quercus petraea). Ann. For. Sci. 1996, 53, 521–536. [Google Scholar] [CrossRef] [Green Version]
  23. Granier, A.; Bréda, N.; Biron, P.; Villette, S. A lumped water balance model to evaluate duration and intensity of drought constraints in forest stands. Ecol. Model. 1999, 116, 269–283. [Google Scholar] [CrossRef]
  24. Pataki, D.E.; Oren, R. Species differences in stomatal control of water loss at the canopy scale in a mature bottomland deciduous forest. Adv. Water Resour. 2003, 26, 1267–1278. [Google Scholar] [CrossRef]
  25. Akuraju, V.R.; Ryu, D.; George, B.; Ryu, Y.; Dassanayake, K. Seasonal and inter-annual variability of soil moisture stress function in dryland wheat field, Australia. Agric. For. Meteorol. 2017, 232, 489–499. [Google Scholar] [CrossRef]
  26. Guilpart, N.; Roux, S.; Gary, C.; Metay, A. The trade-off between grape yield and grapevine susceptibility to powdery mildew and grey mould depends on inter-annual variations in water stress. Agric. For. Meteorol. 2017, 234–235, 203–211. [Google Scholar] [CrossRef]
  27. Moura, A.D.; Shukla, J. On the dynamics of droughts in Northeast Brazil—Observations, theory and numerical experiments with a general-circulation model. J. Atmos. Sci. 1981, 38, 2653–2675. [Google Scholar] [CrossRef]
  28. Hastenrath, S. Exploring the climate problems of Brazil’s Nordeste: A review. Clim. Chang. 2012, 112, 243–251. [Google Scholar] [CrossRef]
  29. Cunha, A.P.M.; Alvalá, R.C.; Nobre, C.A.; Carvalho, M.A. Monitoring vegetative drought dynamics in the Brazilian semiarid region. Agric. For. Meteorol. 2015, 214–215, 494–505. [Google Scholar] [CrossRef]
  30. Marengo, J.A.; Bernasconi, M. Regional differences in aridity/drought conditions over Northeast Brazil: Present state and future projections. Clim. Chang. 2015, 129, 103–115. [Google Scholar] [CrossRef]
  31. Alvalá, R.C.S.; Cunha, A.P.M.A.; Brito, S.S.B.; Seluchi, M.E.; Marengo, J.A.; Moraes, O.L.L.; Carvalho, M.A. Drought monitoring in the Brazilian Semiarid region. Anais da Academia Brasileira de Ciências 2017. [Google Scholar] [CrossRef] [Green Version]
  32. Brito, S.S.B.; Cunha, A.P.M.A.; Cunningham, C.C.; Alvalá, R.C.; Marengo, J.A.; Carvalho, M.A. Frequency, duration and severity of drought in the Semiarid Northeast Brazil region. Int. J. Climatol. 2017, 38, 517–529. [Google Scholar] [CrossRef]
  33. Marengo, J.A.; Alves, L.M.; Alvala, R.C.S.; Cunha, A.P.; Brito, S.; Moraes, O.L.L. Climatic characteristics of the 2010–2016 drought in the semiarid Northeast Brazil region. Anais da Academia Brasileira de Ciências 2017. [Google Scholar] [CrossRef] [PubMed]
  34. Marengo, J.A.; Torres, R.R.; Alves, L.M. Drought in Northeast Brazil—Past, present, and future. Theor. Appl. Climatol. 2017, 129, 1189–1200. [Google Scholar] [CrossRef]
  35. Menezes, J.A.L.; Santos, T.E.M.; Montenegro, A.A.D.A.; Silva, J.R.L. Temporal behavior of soil water under ‘Caatinga’ and bare soil in Experimental Basin of Jatobá, Pernambuco. Water Resour. Irrig. Manag. 2013, 2, 45–51. [Google Scholar]
  36. Alvares, C.A.; Stape, J.L.; Sentelhas, P.C.; de Moraes Gonçalves, J.L.; Sparovek, G. Köppen’s climate classification map for Brazil. Meteorol. Z. 2013, 22, 711–728. [Google Scholar] [CrossRef]
  37. Kousky, V.E. Frontal influences on Northeast Brazil. Mon. Weather Rev. 1979, 107, 1140–1153. [Google Scholar] [CrossRef]
  38. Chaves, R.R.; Cavalcanti, I.F.A. Atmospheric circulation features associated with rainfall variability over southern northeast Brazil. Mon. Weather Rev. 2001, 129, 2614–2626. [Google Scholar] [CrossRef]
  39. Nobre, P.; Marengo, J.A.; Cavalcanti, I.F.A.; Obregon, G.; Barros, V.; Camilloni, I.; Campos, N.; Ferreira, A.G. Seasonal-to-decadal predictability and prediction of South American climate. J. Clim. 2006, 19, 5988–6004. [Google Scholar] [CrossRef]
  40. Cavalcanti, I.F.A. Large scale and synoptic features associated with extreme precipitation over South America: A review and case studies for the first decade of the 21st century. Atmos. Res. 2012, 118, 27–40. [Google Scholar] [CrossRef]
  41. Kayano, M.T.; Andreoli, R.V.; Ferreira de Souza, R.A. Relations between ENSO and the South Atlantic SST modes and their effects on the South American rainfall. Int. J. Climatol. 2013, 33, 2008–2023. [Google Scholar] [CrossRef]
  42. Lyra, G.B.; Oliveira-Júnior, J.F.; Gois, G.; Cunha-Zeri, G.; Zeri, M. Rainfall variability over Alagoas under the influences of SST anomalies. Meteorol. Atmos. Phys. 2017, 129. [Google Scholar] [CrossRef]
  43. IBGE Instituto Brasileiro de Geografia e Estatística, Censo Agropecuário 2006. Available online: https://ww2.ibge.gov.br/home/estatistica/economia/agropecuaria/censoagro/default.shtm (accessed on 14 September 2018).
  44. Oliveira, F.T. Root System’s Growth of the Opuntia fícus-indica (L.) Mill (cactus pear) on the Basis of Population Managements and Phosphate Fertilization; Federal University of Campina Grande: Campina Grande, Brazil, 2008. [Google Scholar]
  45. Loiola Edvan, R.; Dantas Fernades, P.; de Souza Carneiro, M.S.; Gonçalves Neder, D.; Silva Araujo, J.; de Andrade, A.P.; Souto Filho, L.T. Biomass accumulation and root growth of cactus pear in different harvest periods. Rev. Acadêmica Ciência Anim. 2013. [Google Scholar] [CrossRef]
  46. Bastos, E.A.; Andrade Júnior, A.S.; Nogueira, C.C.P. Cultivo de Feijão-Caupi; Empresa Brasileira de Pesquisa Agropecuária: Brasília, Brazil, 2017. [Google Scholar]
  47. Dane, J.H.; Topp, G.C. Methods of Soil Analysis, Part 4; Soil Science Society of America: Madison, WI, USA, 2002. [Google Scholar]
  48. USDA General Guide for Estimating Moist Bulk Density. Available online: https://www.nrcs.usda.gov/wps/portal/nrcs/detail/soils/survey/office/ssr10/tr/?cid=nrcs144p2_074844 (accessed on 14 September 2018).
  49. Zhang, J.; Davies, W.J. Sequential response of whole plant water relations to prolonged soil drying and the involvement of xylem sap ABA in the regulation of stomatal behaviour of sunflower plants. New Phytol. 1989, 113, 167–174. [Google Scholar] [CrossRef]
  50. Ali, M.; Jensen, C.R.; Mogensen, V.O. Early signals in field grown wheat in response to shallow soil drying. Funct. Plant Biol. 1999, 25, 871–882. [Google Scholar] [CrossRef]
  51. Braatne, J.H.; Hinckley, T.M.; Stettler, R.F. Influence of soil water on the physiological and morphological components of plant water balance in Populus trichocarpa, Populus deltoides and their F1 hybrids. Tree Physiol. 1992, 11, 325–339. [Google Scholar] [CrossRef] [PubMed]
  52. Hsiao, T.C. Plant responses to water stress. Annu. Rev. Plant Physiol. 1973, 24, 519–570. [Google Scholar] [CrossRef]
  53. Chaves, M.M.; Pereira, J.S.; Maroco, J.; Rodrigues, M.L.; Ricardo, C.P.P.; OsÓRio, M.L.; Carvalho, I.; Faria, T.; Pinheiro, C. How plants cope with water stress in the field? Photosynthesis and growth. Ann. Bot. 2002, 89, 907–916. [Google Scholar] [CrossRef] [PubMed]
  54. G1 Seca no Nordeste Bate Recorde e afeta a Produção Agrícola. Available online: http://g1.globo.com/bom-dia-brasil/noticia/2016/10/seca-no-nordeste-bate-recorde-e-afeta-producao-agricola.html (accessed on 14 September 2018).
  55. Diário_do_Nordeste Seca de 2016 no Ceará Está Entre as Piores da História; Veja a Lista. Available online: http://diariodonordeste.verdesmares.com.br/cadernos/regional/online/seca-de-2016-no-ceara-esta-entre-as-piores-da-historia-veja-a-lista-1.1565486 (accessed on 14 September 2018).
  56. CONAB. Acompanhamento da Safra Brasileira de Grãos—Safra 2015/2016; Companhia Nacional de Abastecimento: Brasília, Brazil, 2016; Volume 3.
  57. Wilhite, D.A.; Sivakumar, M.V.K.; Pulwarty, R. Managing drought risk in a changing climate: The role of national drought policy. Weather Clim. Extrem. 2014, 3, 4–13. [Google Scholar] [CrossRef]
Figure 1. Data collection platforms over the Brazilian semiarid region as of 31 March 2016. Gray symbols (stars and pentagons) denote offline stations at the time.
Water 10 01421 g001
Figure 2. Accumulated rainfall for bands of latitude. Climatological means calculated considering data from each municipality where a station was located: (a) −18 < Lat < −14, (b) −14 < Lat < −10, (c) −10 < Lat < −6 and (d) −6 < Lat < −2.
Water 10 01421 g002
Figure 3. Soil texture triangle for samples collected at each station. The color scale refers to the wilting point.
Water 10 01421 g003
Figure 4. Average wilting point and field capacity for each soil texture over the region. Vertical bars denote the standard deviation.
Water 10 01421 g004
Figure 5. (a) Accumulated rainfall (seven days); (b) daily maximum of soil moisture at 20 cm (m3 m−3); and (c) Soil Moisture Index (SMI) for 20 January 2016.
Water 10 01421 g005
Figure 6. (a) Accumulated rainfall (seven days); (b) daily maximum of soil moisture at 20 cm (m3 m−3); and (c) Soil Moisture Index (SMI) for 20 February 2016.
Water 10 01421 g006
Figure 7. (a) SMI for 31 January 2016; and (b) left axis: average SMI over the stations inside the square during the last 30 days; and right axis: daily accumulated rainfall.
Water 10 01421 g007
Figure 8. (a) SMI for 28 February 2016; and (b) left axis: average SMI over the stations inside the square during the last 30 days; and right axis: daily accumulated rainfall.
Water 10 01421 g008
Figure 9. Index of Stress in Agriculture (ISA) for different dates. Red symbols denote seven consecutive days of SMI < 0.4, while orange symbols mark where SMI < 0.4 for three days. Current stations marked in blue.
Water 10 01421 g009
Table 1. Typical values of the bulk density for soil texture classes.
Texture ClassBulk Density (g cm−3)
Sand1.65
Loamy sand1.6
Sandy loam1.55
Loam1.5
Sandy clay loam1.5
Silty clay loam1.5
Silty loam1.5
Clay loam1.45
Silty clay1.45
Sandy clay1.4
Clay1.35

