Article

Characterizing Hydrological Connectivity of Artificial Ditches in Zoige Peatlands of Qinghai-Tibet Plateau

1
State Key Laboratory of Plateau Ecology and Agriculture, Qinghai University, Xining 810016, China
2
School of Hydraulic Engineering, Changsha University of Science & Technology, Changsha 410114, China
3
Key Laboratory of Water-Sediment Sciences and Water Disaster Prevention of Hunan Province, Changsha 410114, China
4
Department of Geography, Syracuse University, Syracuse, NY 13244, USA
*
Author to whom correspondence should be addressed.
Water 2018, 10(10), 1364; https://doi.org/10.3390/w10101364
Submission received: 6 September 2018 / Revised: 26 September 2018 / Accepted: 28 September 2018 / Published: 30 September 2018
(This article belongs to the Special Issue Applications of Remote Sensing and GIS in Hydrology)

Abstract

:
Peats have the unique ability of effectively storing water and carbon. Unfortunately, this ability has been undermined by worldwide peatland degradation. In the Zoige Basin, located in the northeastern Qinghai-Tibet Plateau, China, peatland degradation is particularly severe. Although climate change and (natural and artificial) drainage systems have been well-recognized as the main factors catalyzing this problem, little is known about the impact of the latter on peatland hydrology at larger spatial scales. To fill this gap, we examined the hydrological connectivity of artificial ditch networks using Google Earth imagery and recorded hydrological data in the Zoige Basin. After delineating from the images of 1392 ditches and 160 peatland patches in which these ditches were clustered, we calculated their lengths, widths, areas, and slopes, as well as two morphological parameters, ditch density (Dd) and drainage ability (Pa). The subsequent statistical analysis and examination of an index defined as the product Dd and Pa showed that structural hydrological connectivity, which was quantitatively represented by the value of this index, decreased when peatland patch areas increased, suggesting that ditches in small patches have higher degrees of hydrological connectivity. Using daily discharge data from three local gauging stations and Manning’s equation, we back-calculated the mean ditch water depths (Dm) during raining days of a year and estimated based on Dm the total water volume drained from ditches in each patch (V) during annual raining days. We then demonstrated that functional hydrological connectivity, which may be represented by V, generally decreased when patch areas increased, more sensitive to changes of ditch number and length in larger peatland patches. Furthermore, we found that the total water volume drained from all ditches during annual raining days only took a very small proportion of the total volume of stream flow out of the entire watershed (0.0012%) and this nature remained similar for the past 30 years, suggesting that during annual rainfall events, water drained from connected ditches is negligible. This revealed that the role of connected artificial ditches in draining peatland water mainly takes effect during the prolonged dry season of a year in the Zoige Basin.

1. Introduction

Peats are very sensitive to changes in their hydrological conditions. One of the most common drivers altering peat hydrology is drainage by artificial ditches [1,2,3,4,5]. Ditches lower the water table, causing possible peat desiccation and, finally, leading to peat decomposition and peatland subsidence [2,6,7]. Artificial ditches may also facilitate subsurface flow, which can increase both baseflow and storm flow [8,9,10]. The combination of these changes could result in peatland degradation [7]. Although the definition of peats in different studies may be inconsistent [11], physical properties of peats in many regions of the world demonstrated comparable characteristics [12,13,14,15]. Therefore, a similar impact of artificial ditches in the Zoige Basin of the Qinghai-Tibet Plateau, China on its peatland is expected. In other words, the well-known peatland degradation in the Zoige Basin may be partially attributed to the construction of artificial ditches from the 1950s to 1970s, though climate change has also been recognized as a main cause [16,17,18,19,20,21]. Thus, understanding the impact of artificial ditches on peat hydrology is essential for determining the role of these ditches in peatland degradation.
However, previous studies [22,23] provided no solid evidence on whether artificial ditches truly contribute to the degradation of peatlands in the Zoige Basin. The loophole may be attributed to the highly variable nature of peat hydrological properties (e.g., water table), such that even within a small area (less than 2500 m2), characterizing the spatial variations of these properties requires high-resolution topographic data and high-density samples [24,25]. As the spatial scale increases, the cumulative effect of these highly variable properties becomes more complex [6,26]. Furthermore, at larger spatial scales, artificial ditches could form drainage networks with a variety of spatial patterns. Their impact on peat hydrology is spatially correlated and thus more difficult to characterize, which may explain the limited ability of using a topographic index to predict spatially distributed water table levels [27,28]. Another challenge at larger spatial scales are the inevitable logistical constraints of collecting in situ data for describing spatially distributed peat hydrological properties affected by artificial ditches. Thus the impact of ditch drainage on peatland hydrology at larger spatial scales should be examined using more cost-effective approaches.
One of the possible approaches might be relevant to the framework of hydrological connectivity. The concept of hydrological connectivity originally arose from Ecology where it is referred to as “water-mediated transfer of matter, energy, and/or organisms within or between elements of the hydrological cycle” [29]. Hydrological connectivity can be divided into structure and functional connectivity. The former mainly refers to the landscape connection between adjacent elements [22]. The later explicitly points out to ecological perspectives, a large body of work has been done to reveal different functionally hydrological connectivity of ecological functions and services or organisms among different landscape units, such as rivers-floodplain [30,31,32], rivers-riparian/oxbow lake [33], rivers-wetlands [34], and isolated wetlands-navigable surface water [35]. The possible effect of artificial ditches on degradation of the Zoige peatlands is more relevant to longitudinal hydrological connectivity of ditch flows and lateral connectivity (i.e., the connection between uplands and their connected stream network) of hydrological and geomorphologic components within a watershed [36], rather than that of biochemical materials [37], and ecological functions [38]. Specifically, hydrological connectivity of artificial ditches should focus on the physical structure of ditch systems and efficiency of flows moving through them. Borrowing a concept proposed previously [39] and referencing other connectivity metrics [40,41,42], we define the (1) structural hydrological connectivity of the Zoige artificial ditches as the degree of physical connection (i) among individual ditches and (ii) between ditches and natural gullies and streams, and (2) their functional hydrological connectivity as the total volume of water that flows out of ditches.
In this study, we investigate hydrological connectivity of the artificial ditches in the Zoige Basin. First, we delineated plane morphology of the Zoige ditches using Google Earth imagery and determined using GIS techniques peatland patches that include spatially clustered ditches. Second, we developed an index based on ditch density and proportion of ditches within each peatland area that are directly connected to natural gullies and streams. The degree of structural connectivity of each ditch cluster is quantified by the value of this index. Third, we estimated the total annual volume of water that may be transferred through ditches of each peatland patch during storm events of one year and for eight years. By comparing these values with those from the connected streams, we calculated the proportion of water coming from artificial ditches. The study was closed by discussing possible ecological influence of the hydrological connectivity of these artificial ditches on peat health in the Zoige Basin.

2. Materials and Methods
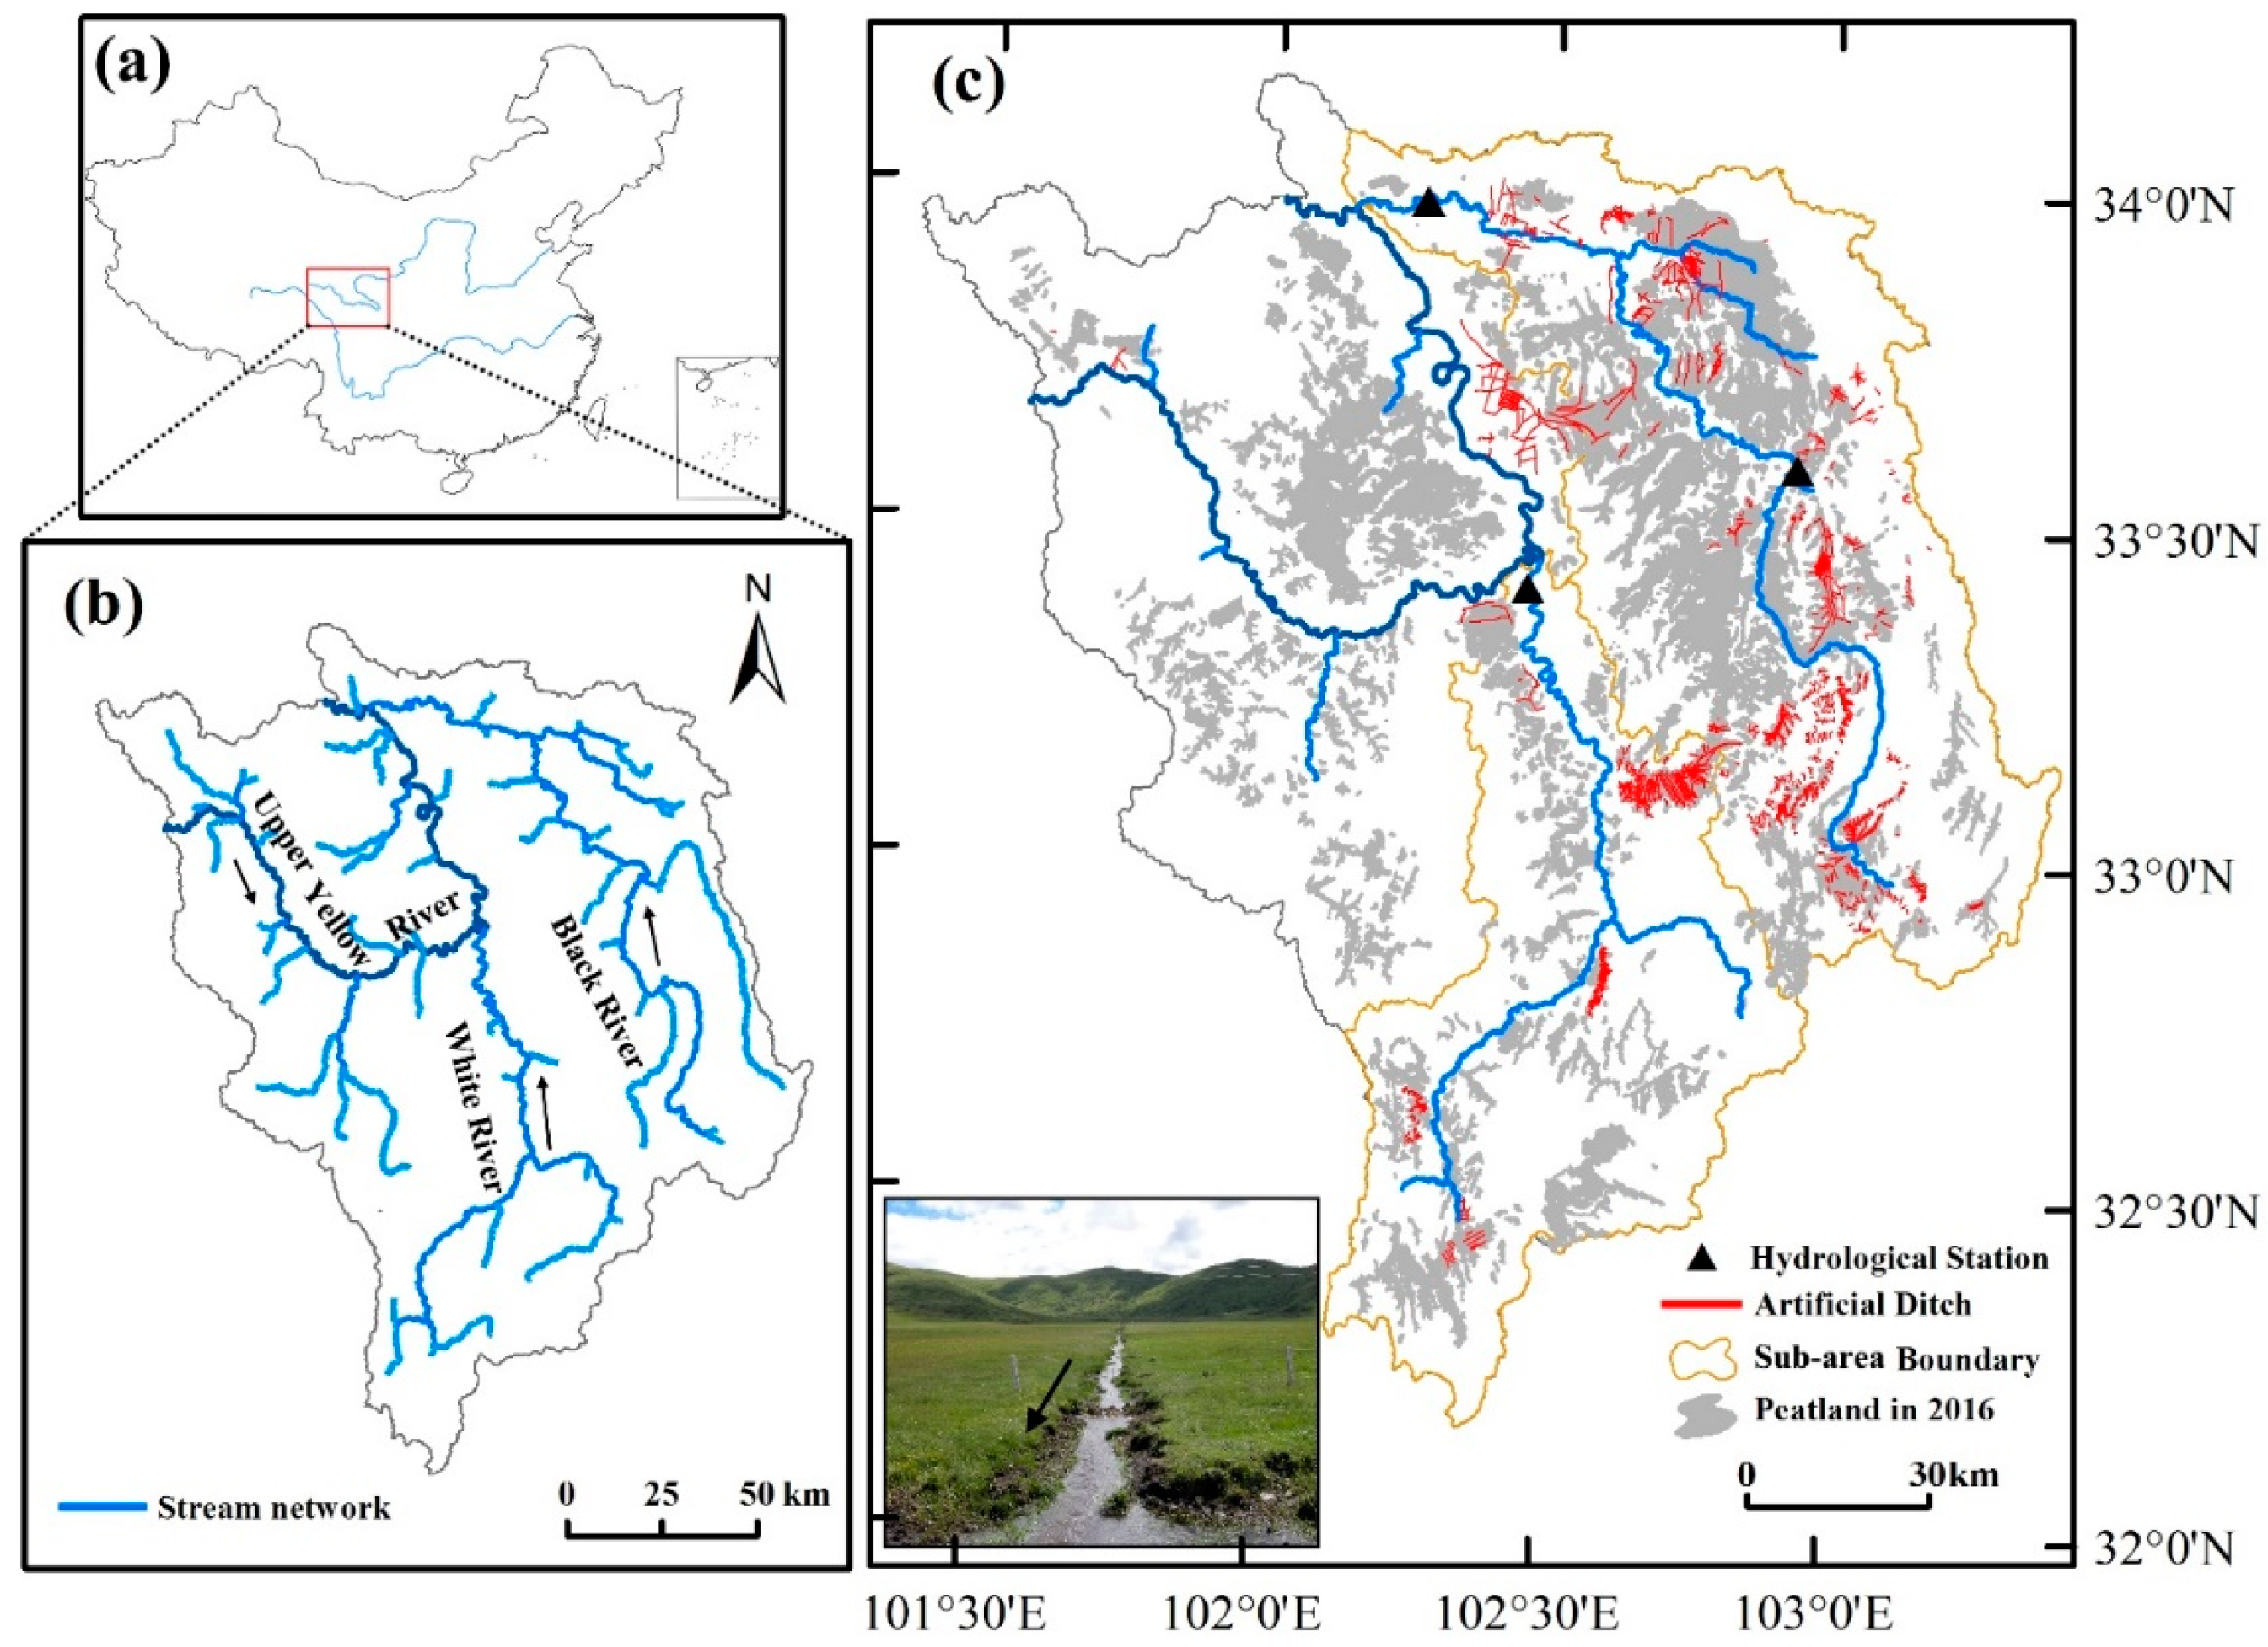
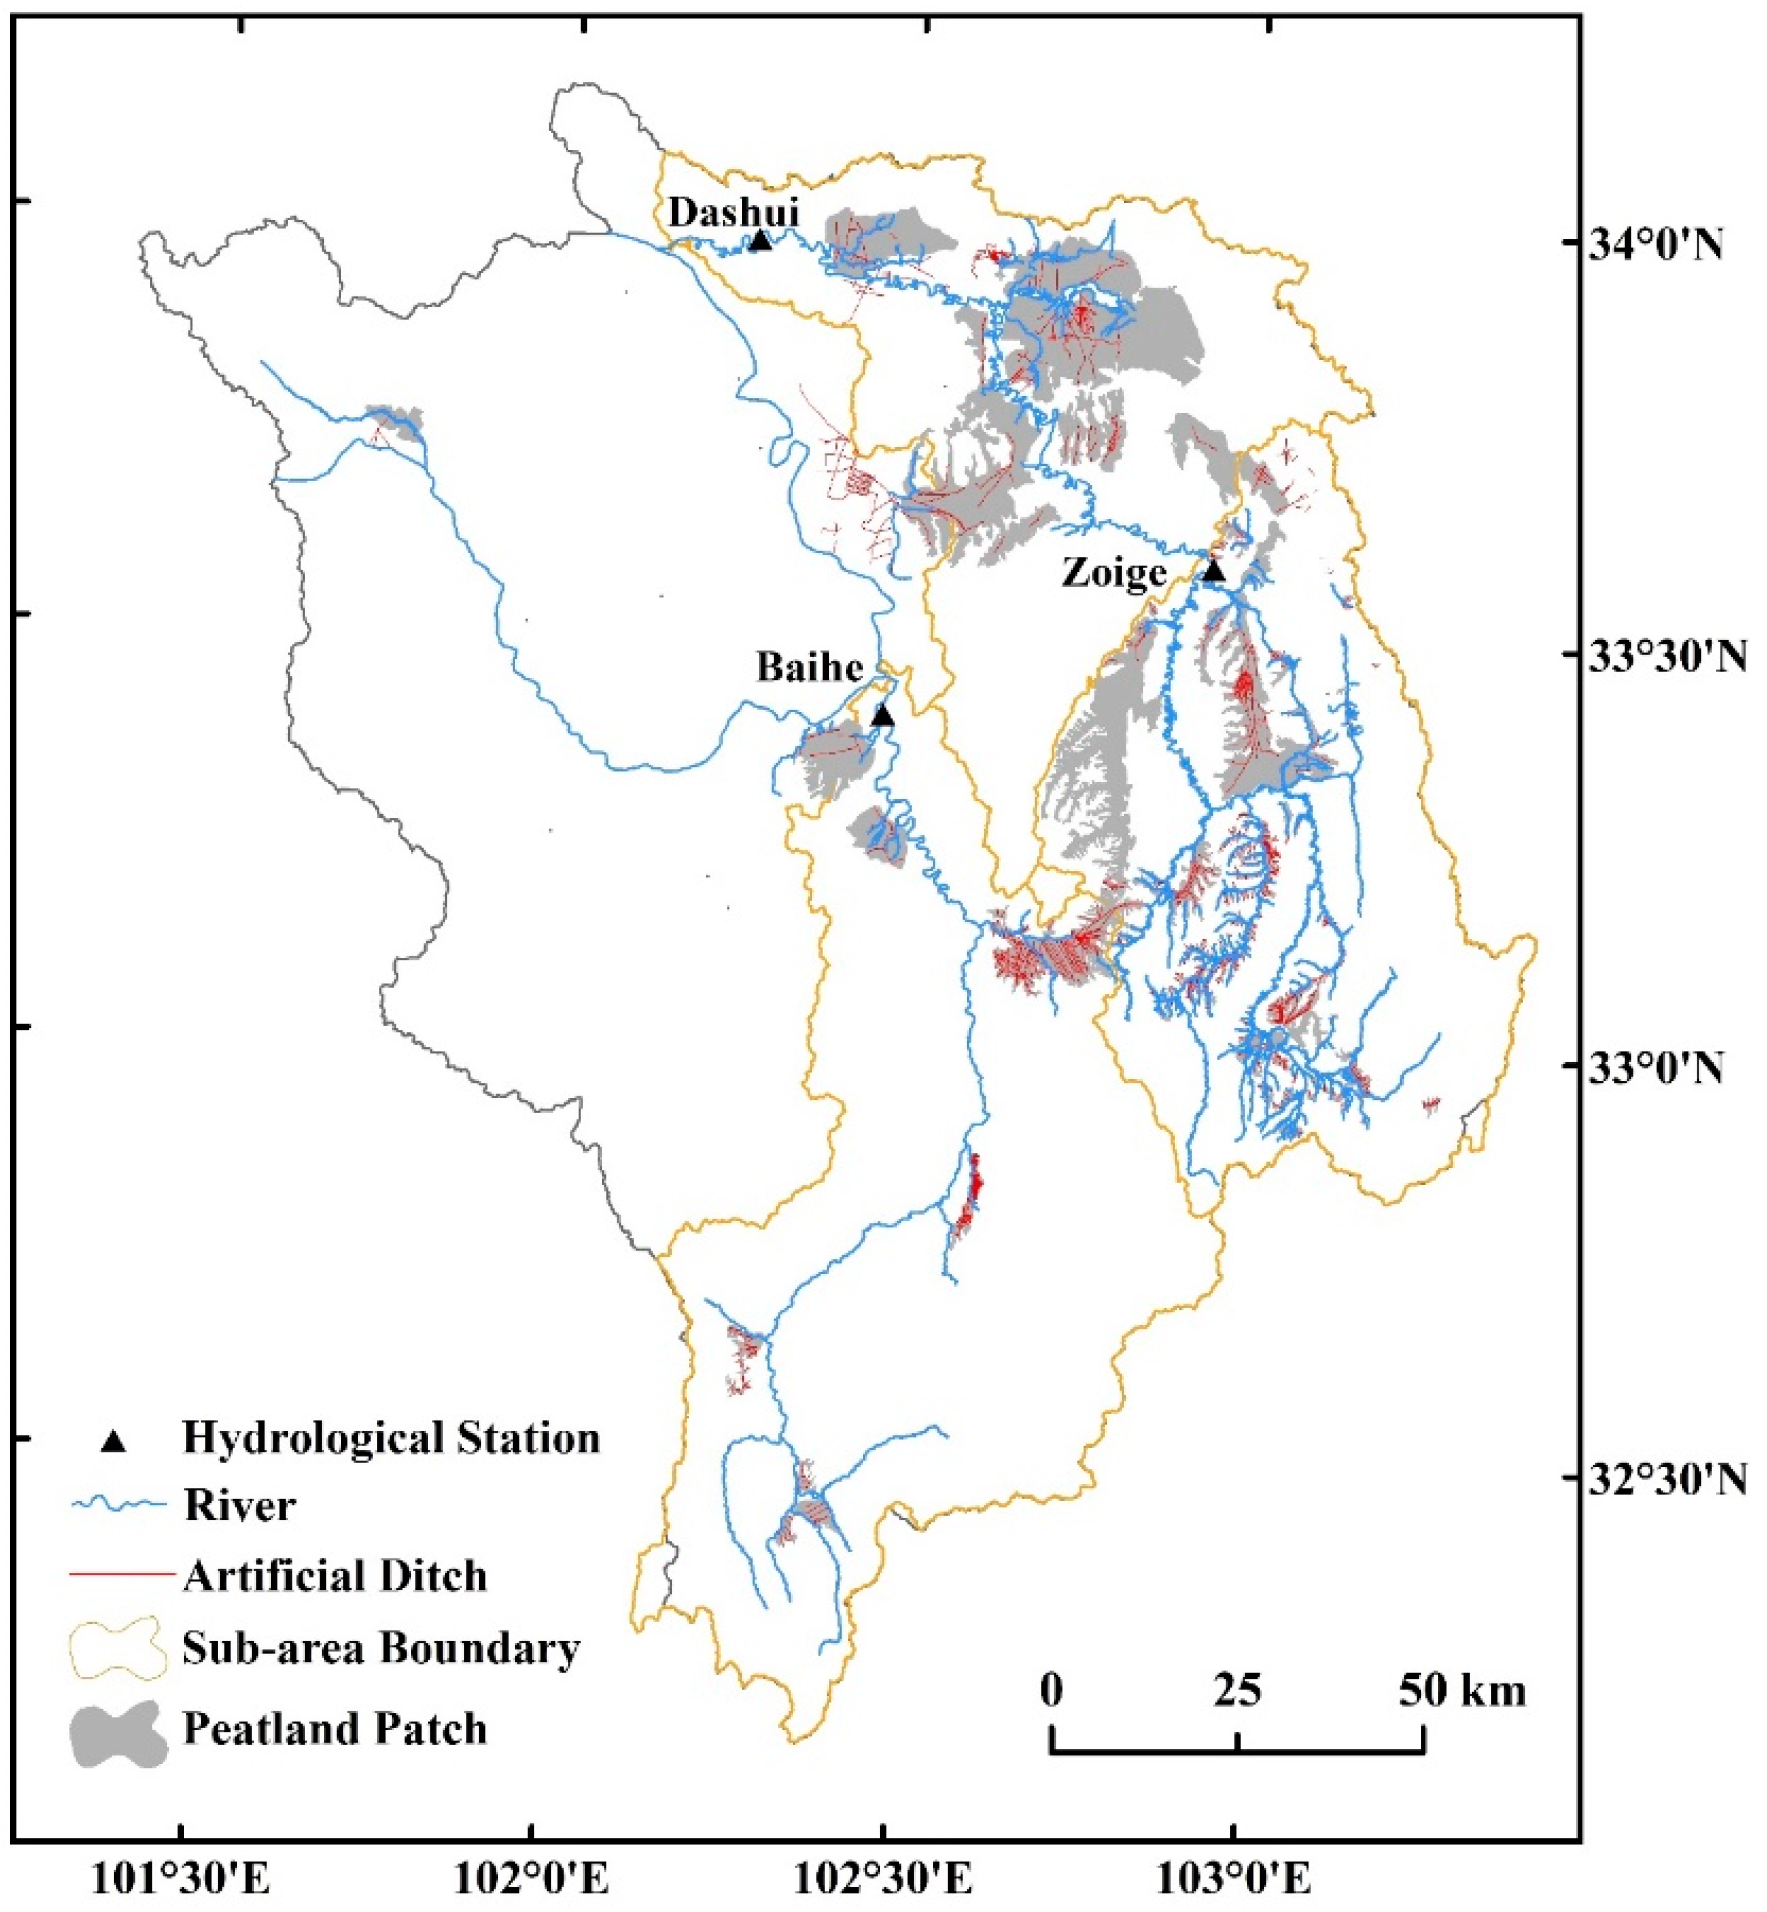
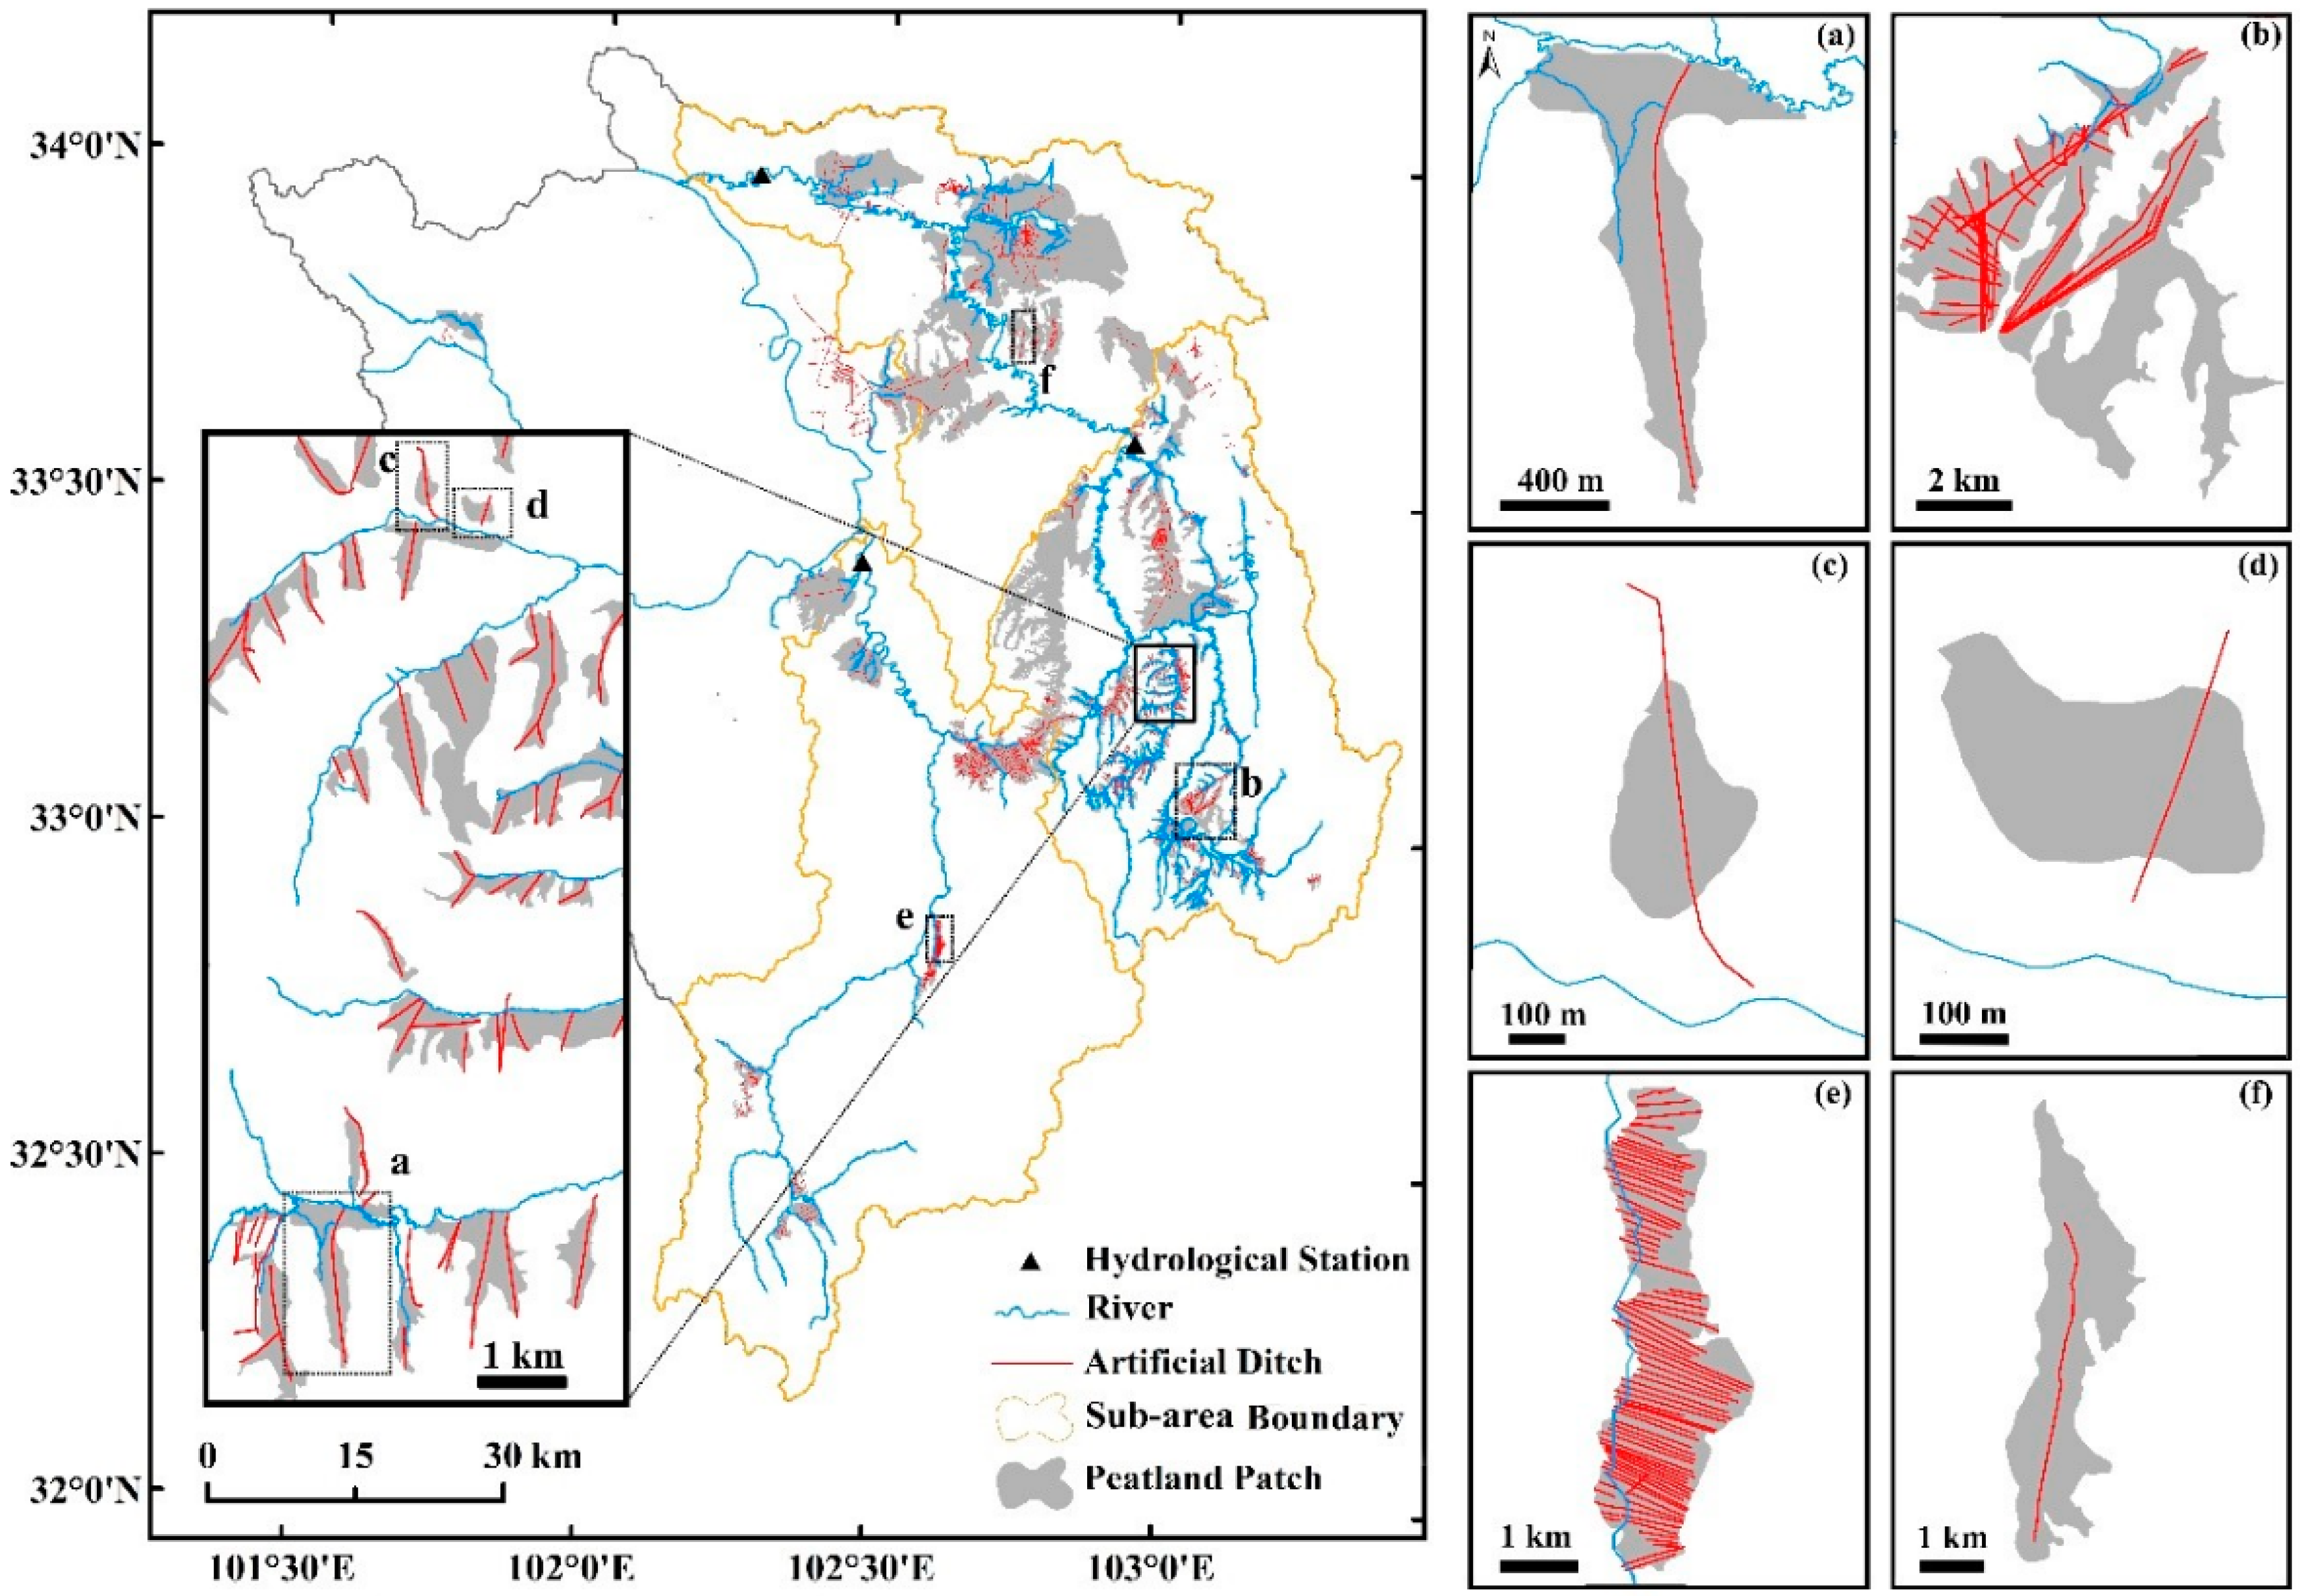
2.1. Study Area

The Zoige Basin contributes to the Upper Yellow River, which is situated on the northeast edge of the Qinghai-Tibet Plateau, China (Figure 1a,b). Two main tributaries, White and Black Rivers, merge into the Upper Yellow River. They, together with their tributaries and connected upstream natural gullies, stand for the main stream networks in the Zoige Basin. Its annual mean temperature and potential evaporation are 0.6–1.2 °C and 1100–1274 mm, respectively. The mean annual precipitation ranges between 560 and 860 mm. Rainfall primarily occurs in summer, accounting for approximately 60% to 80% of the total annual precipitation. Land cover in the Zoige Basin is dominated by grassland and peatland with the latter accounting for approximately 17% of the total area. The Zoige peatlands formed between the early Holocene and approximately 3000 BP. Currently, they are distributed unevenly throughout the entire Zoige Basin with the clustered groups mostly concentrated in the Black River watershed (Figure 1c).
Within peatland areas, many artificial ditches are easily identifiable (Figure 1c). Before 1950, these areas were primarily pristine peatlands. With continuous population increase, escalated demands for grazing catalyzed government-led mass construction of ditches from 1955 to 1980 to transform peatland swamp to grassland for pasturing. This anthropogenic activity resulted in more than 1600 ditches passing through a large proportion of the Zoige peatlands. For example, between 1972 and 1974, the total length of excavated ditches reached about 1000 km and the total area drained by these ditches was 2000 km2, which covered approximately 57.7% of the total Zoige peatlands area (based on the value in 2015). These ditches are normally straight and shallow with their banks covered by local vegetation (see the inset picture in Figure 1c). Some ditches have already incised through the full peat layer due to long-term fluvial erosion. Geomorphologically, many of these ditches are connected to each other, natural gullies, small meandering tributaries, or the main stems of the Black and White Rivers (Figure 1c). Although field observations from 2011 to 2018 indicated that many of them may drain water effectively, the magnitude of drained water cannot be well-understood without systematically examining these ditches.

2.2. Data Acquisition

Daily rainfall data were sourced from the Dataset of China Earth Surface Weather of the Meteorological Data Center of China Meteorological Administration (http://data.cma.cn). Daily water discharges in eight years between 1986, 1987, 1989, and 2007–2011 were obtained from the Baihe Station at the outlet of the White River watershed, Dashui Station at the outlet of the Black River watershed, and Zoige Station at the middle of the Black River watershed (Figure 1c).
Artificial ditches are clearly discernable in the latest Google Earth imagery that has a spatial resolution of 0.6 m. The length of each individual ditch was represented by its centerline and digitized in Google Earth as a kmz file, which was subsequently converted into a GIS shapefile. The width of each ditch was measured as the mean of many individual widths at different locations along a ditch and was recorded in an Excel file. For each ditch, elevations of its starting and ending points were also recorded along with its length. These values were used to calculate the mean slope of each ditch. A total of 1392 ditches were identified in this study. This number was less than that recorded in previous studies (i.e., 1600) because since their construction (1) some ditches were damaged by bank collapse and vegetation encroachment and thus were treated as gullies, (2) some were manually filled for restoration, and (3) others are currently in grassland, which were excluded in this study. These ditches were clustered spatially over the study area. A patch is defined as an area that includes an isolated ditch cluster with variable number of ditches (Figure 2). There were 160 different peatland patches with different shapes and sizes in the study area. The boundaries of these patches were delineated in ArcGIS (ESRI, 10.2, Redlands, CA, USA) and their areas and mean slopes were calculated subsequently.

2.3. Determination of Structural and Functional Hydrological Connectivity

The structural hydrological connectivity was quantified in two ways. First, statistical properties of all individual artificial ditches were calculated and summarized. Ditch clusters and the associated peatland patches (Figure 2) were also described statistically. Second, two parameters characterizing physical structure of clustered ditches in the associated peatland patches were developed, ditch density (Dd) and ditch drainage ability (Pa), for each patch. The former was calculated as the ratio of the total length of ditches within each peatland patch to the associated patch area. It described the degree of spatial cluster of all ditches within a peatland patch. The latter was represented by the proportion of ditches that are directly connected to their neighboring natural gullies and streams to the total ditches within each peatland patch.
D d = i = 1 m L i / A p
where Li is the length of the ith ditch, m is the number of ditches within the patch, Ap is the patch area.
P a = N p / N T
where Np is the number of ditches directly connected to their neighboring natural gullies and/or streams, and NT is the total ditches number.
Based on these two parameters, an index (I) that is defined as the product of the two parameters was calculated for all peatland patches to quantify the comprehensive degree of structural connectivity for each patch. If Pa = 1, then, all ditches are directly connected to a gully or channel, which allows flow in ditches to move out most efficiently. If Pa = 0, then no flow would get out of the patch. Therefore, a value of I reflects the degree of efficiency of water moving out of the ditches with a given Dd. Characteristics of structural hydrological connectivity for ditch clusters in all patches were then examined based on the relationship between the calculated index value and the associated patch area.
Functional hydrological connectivity was not easy to determine in practice [40,41,42]. In the study area, no field-measured hydrological data for ditches were available due to logistic difficulties and harsh weather. Alternatively, we chose the total volume of water (V) that flowed out of these ditch clusters during raining days of the year to approximately quantify functional hydrological connectivity. The value of V does not characterize how the flow in ditches passes through the ditch network, rather, it roughly represents the lumped effect of the complex hydrological processes controlling flows transporting into gullies and channels. This definition is under an assumption that all water drained into ditches during rainfall events finally flowed out of the ditches. Specifically, V is defined as follows.
V = 24 × 3600 × d × i = 1 m q i
where V (m3) is the total volume of water drained from a peatland patch for raining days in a given year, d is the rainfall days of the same year, m is the number of ditches within the patch, and qi is the average water discharge in a single ditch within the patch, which may be estimated using.
q i = 1 n w i D R i 2 / 3 S i 1 / 2
where n is the roughness coefficient, whose value was determined as 0.035 based on field observation and a list of values of n for rivers in China [43], subscript i represents the ith ditch within a peatland patch, wi is the mean water width (m), represented as the ditch width, D is the mean water depth (m), Ri is the hydraulic radius (m), and Si is the mean slope of the ditch i. Equation (4) is based on the assumption that a ditch cross section has a rectangular shape (see inset in Figure 1) and thus the product of wi and D represented the cross-section area of a ditch with the mean flow width the same as the ditch width and the mean depth of D. Values of D vary with ditches and thus are impossible to measure directly from each individual ditch. We determined it as follow:
First we divided peatland patches in the study area into three subareas, each one of which was related to one of the gauging stations where daily water discharges were obtained (i.e., Dashui, Zoige, and Baihe) (Figure 2). Second, we calculated the total volume of water passing through each station in raining days within a given year. This volume (v) represented the total amount of storm flow from each subarea during the year. Third, we identified in each subarea five patches with variable sizes and numbers of ditches. Fourth, we determined the volume of water from each patch (vi) in each subarea by vi = v (Ai/As), where Ai is the area of each selected patch and As is the area of the associated subarea. Fifth, using the value of vi and the number of raining days, we calculated the mean water discharge (Qi) from each selected patch. The mean water depth, Di, in ditches within each selected patch was then determined using Equations (3) and (4). These five values of Di in each subarea reflected possible variations of mean water depth in all ditches within each subarea. Performing descriptive statistics would lead to three final representative water depths for all ditches within the patches of the same subarea: the mean of these five, Dm, the mean plus the standard deviation, Dh, and the mean minus one standard deviation, Dl. The variation of these three values roughly reflected the possible range of uncertainty in determining the D value.
Based on the determined Dm, the total volume of water (V) from ditches in each nonselected patch may be calculated using Equations (3) and (4). Values of V from all patches in each subarea and V per unit patch area were examined regarding to their patch areas in 1986 and 2011, to illustrate functional hydrological connectivity of ditches in these two sample years. Furthermore, the sum of V values in all patches within each zone (Vtm) may be calculated to represent the degree of functional hydrological connectivity in this zone. Its high and low boundaries (Vth and Vtl) may also be determined using Dh and Dl values. These three values divided by the total water volume from each zone gave rise to the proportion of ditch drained water in the total volume of the storm flow for a given year (P) and its variation in each zone. Calculation of these proportions for all eight years allowed us to reveal temporal changes of functional hydrological connectivity.

3. Results and Analysis

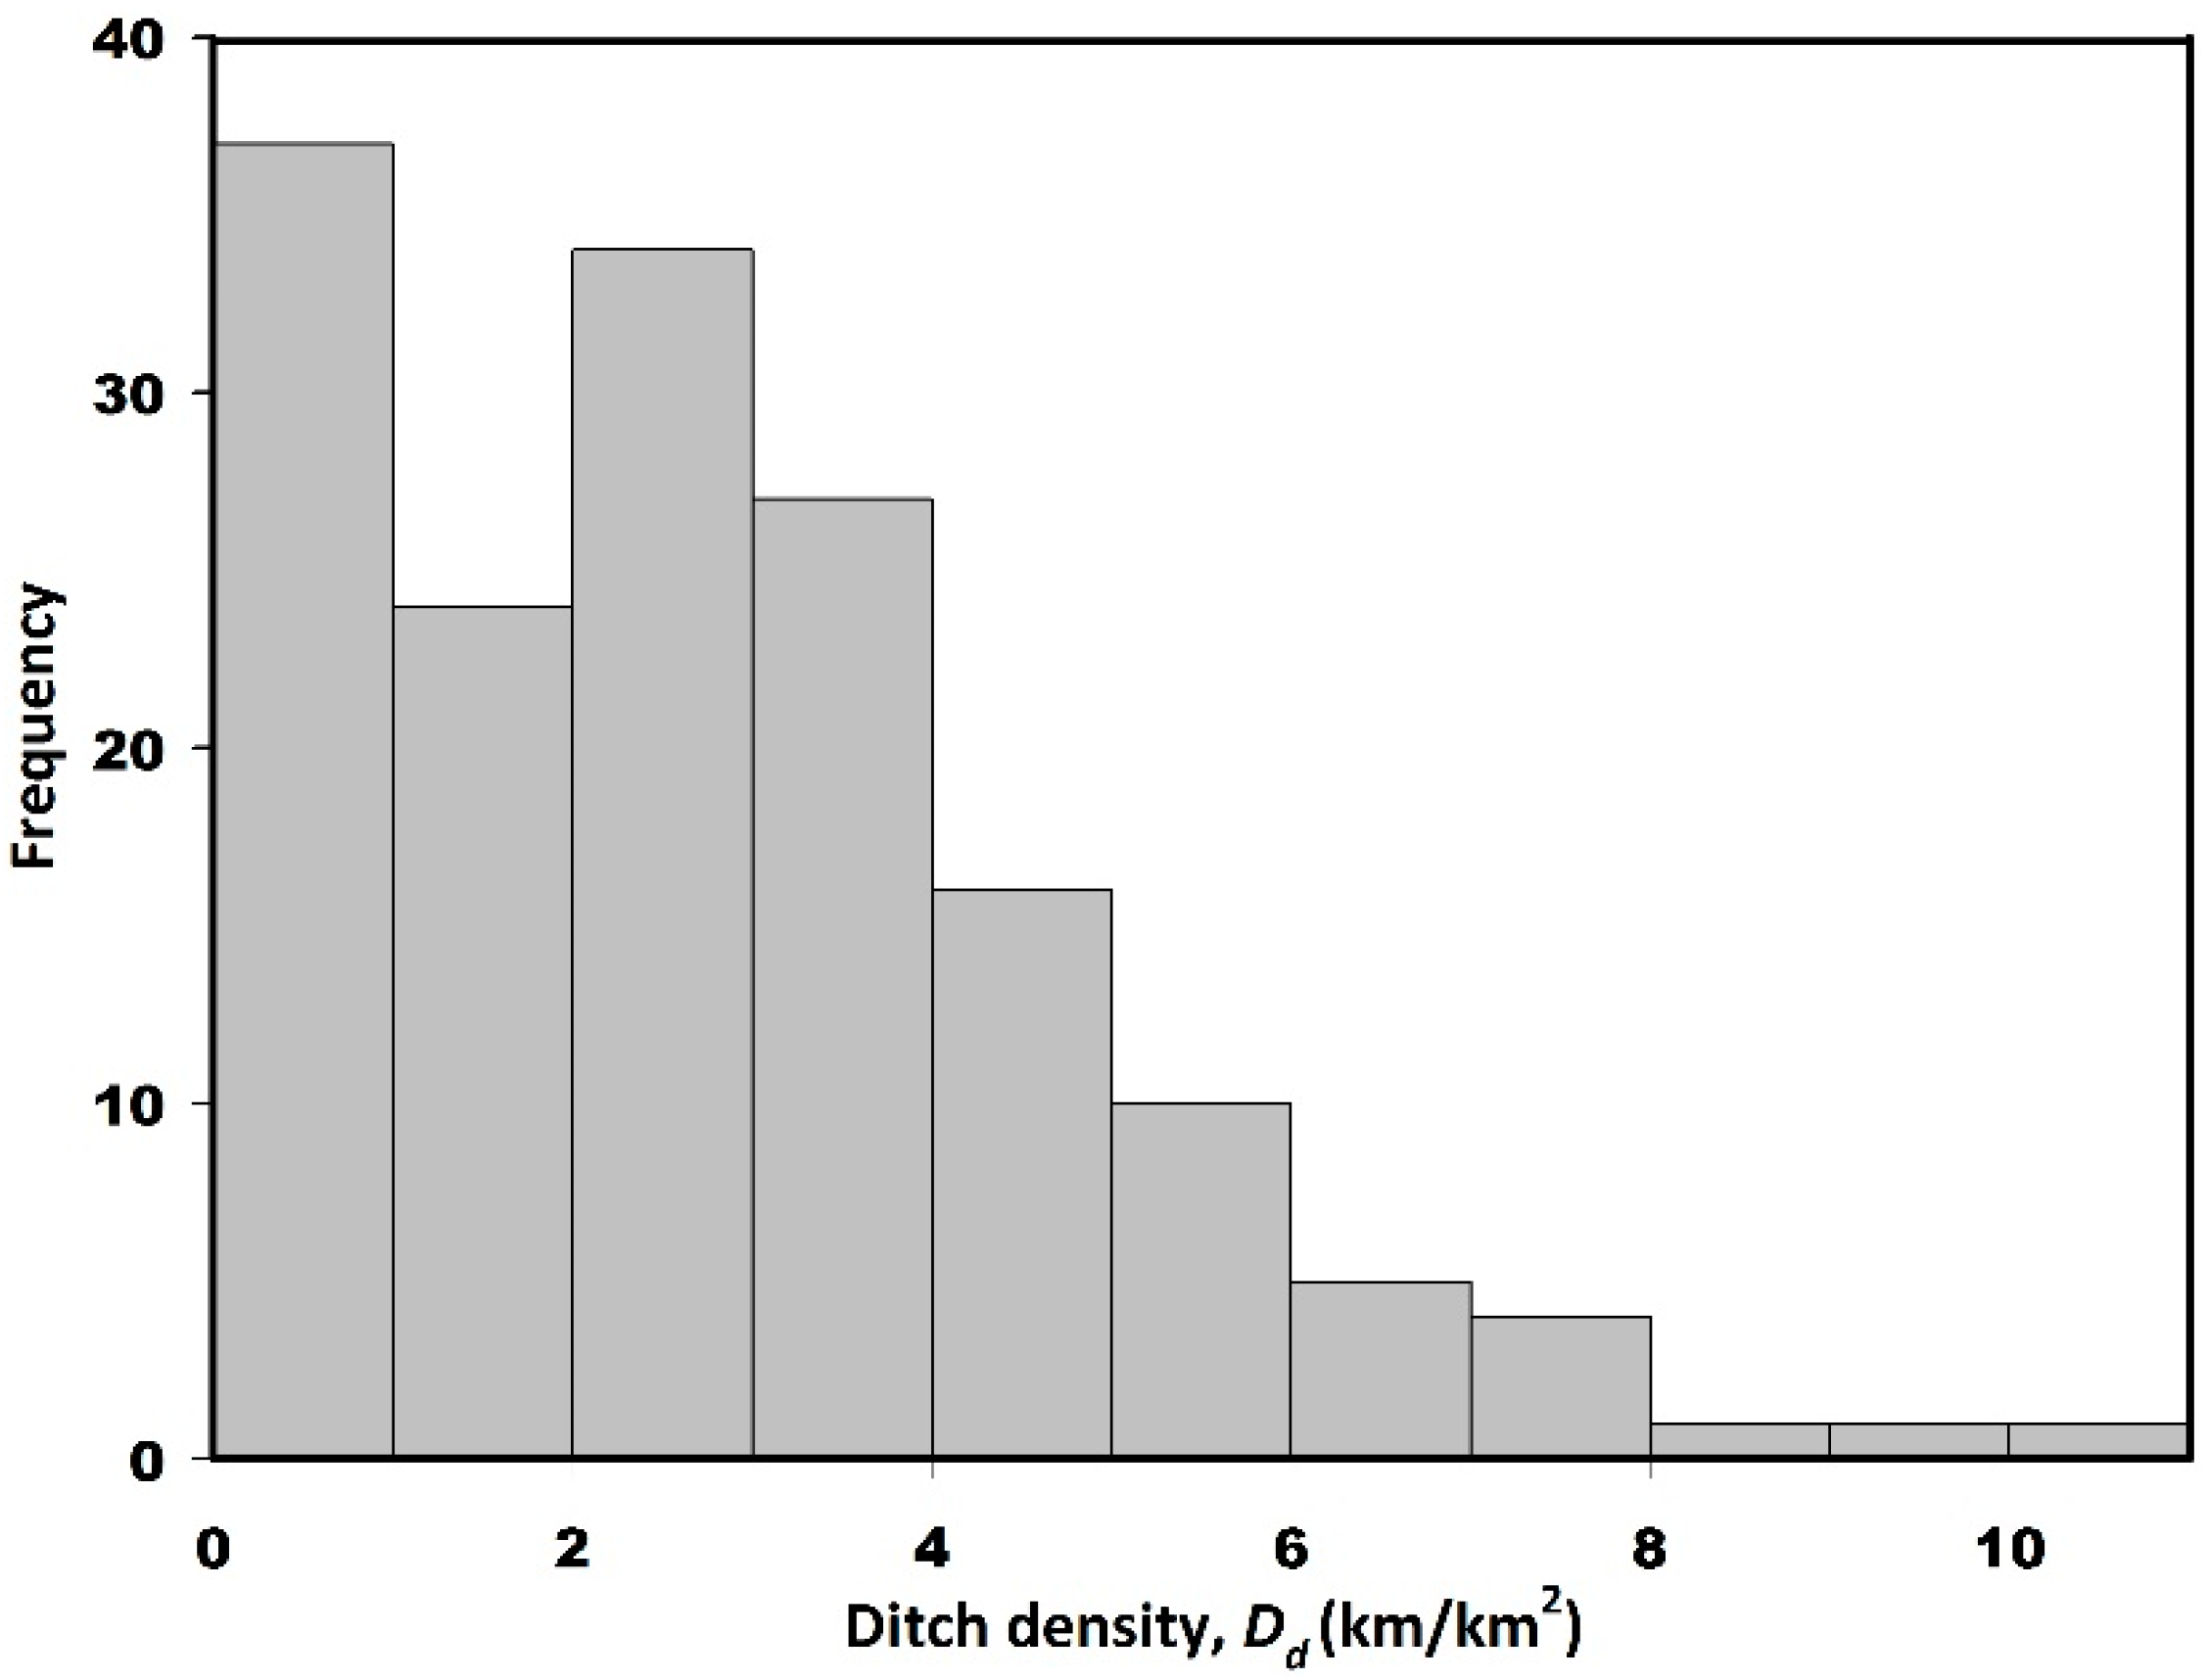
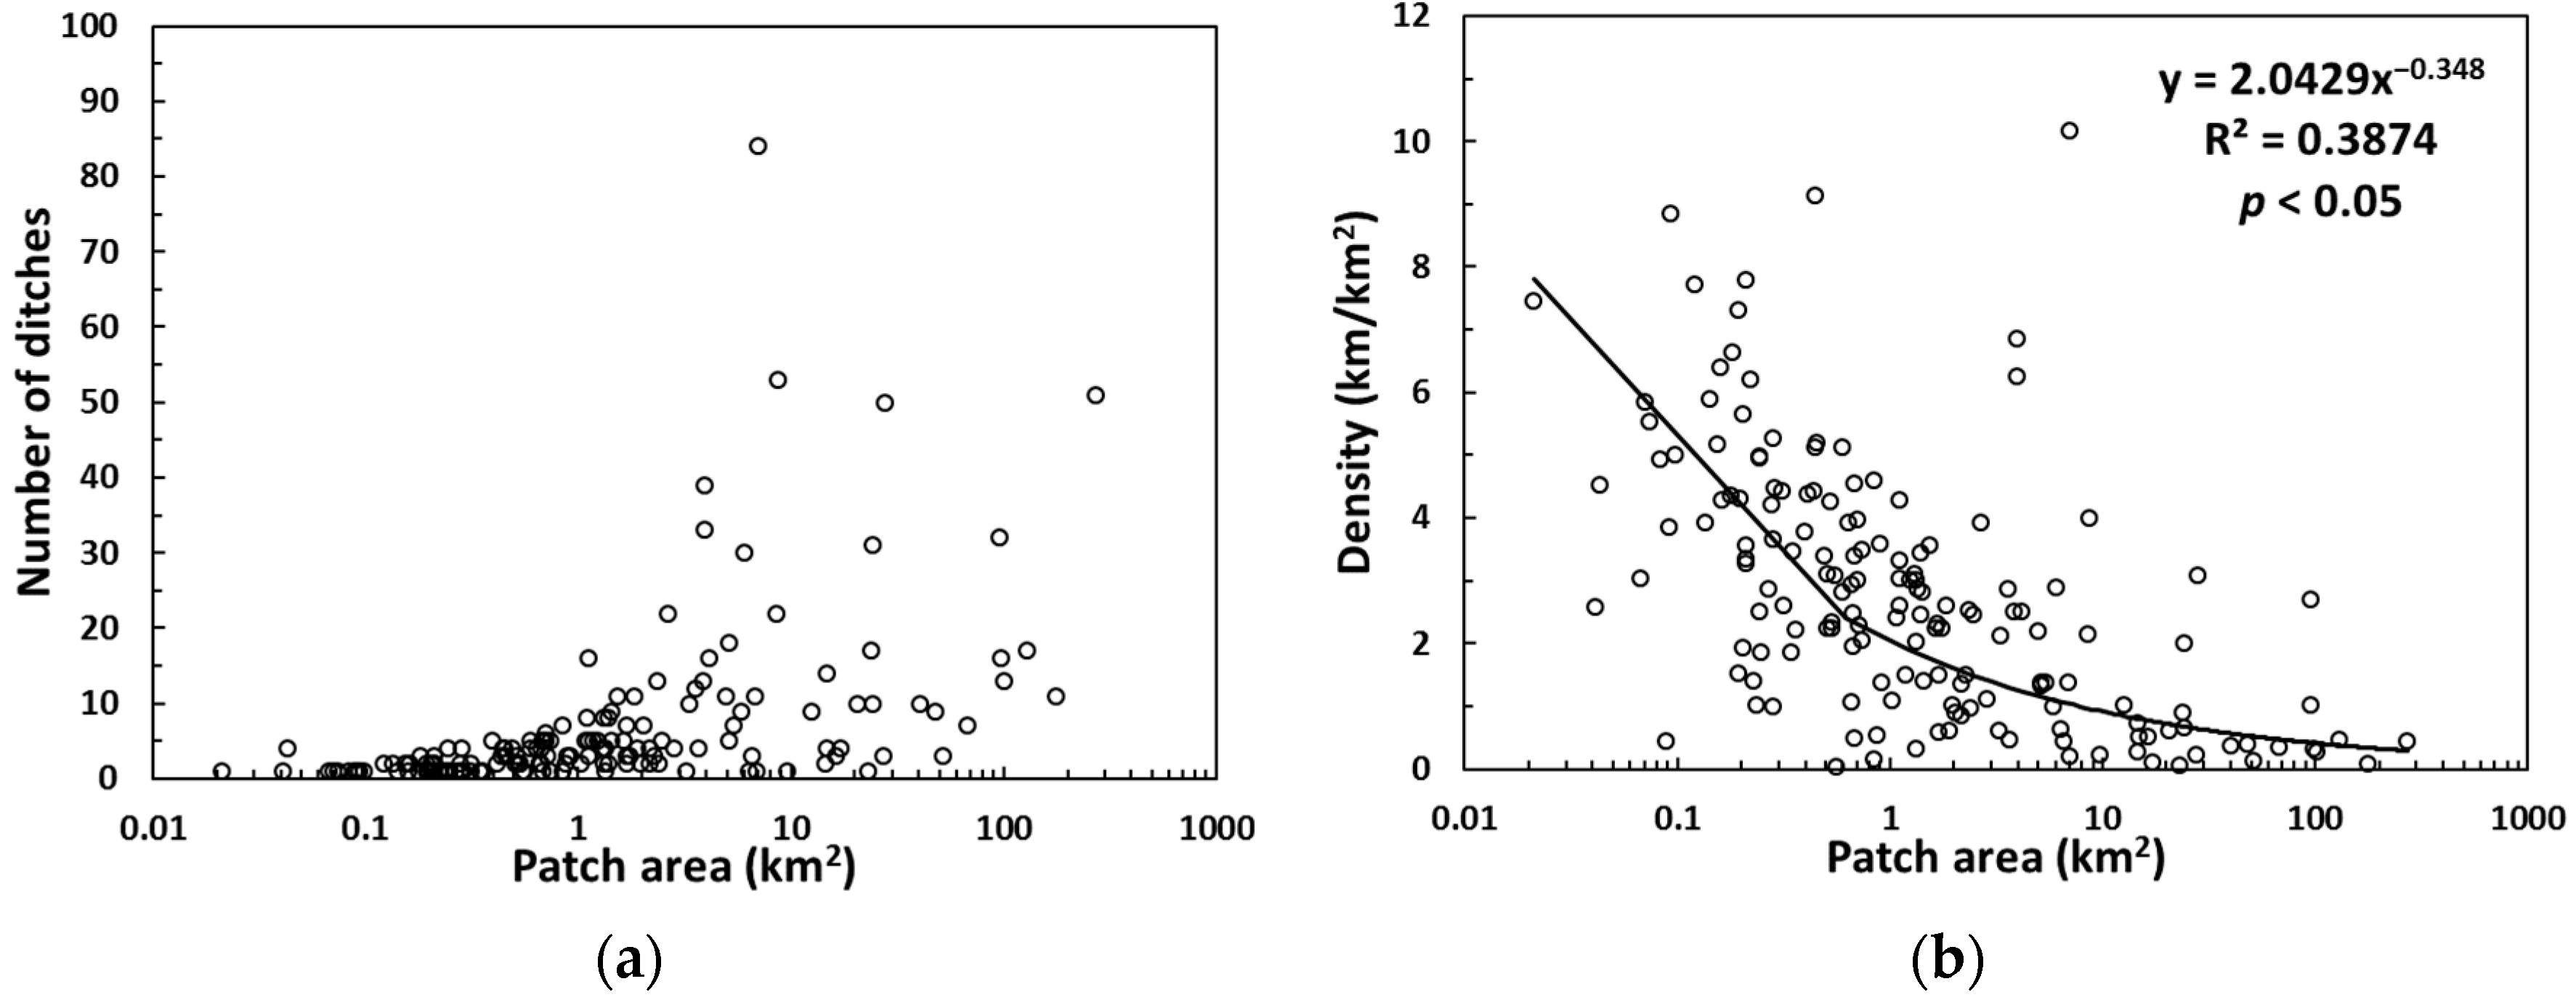
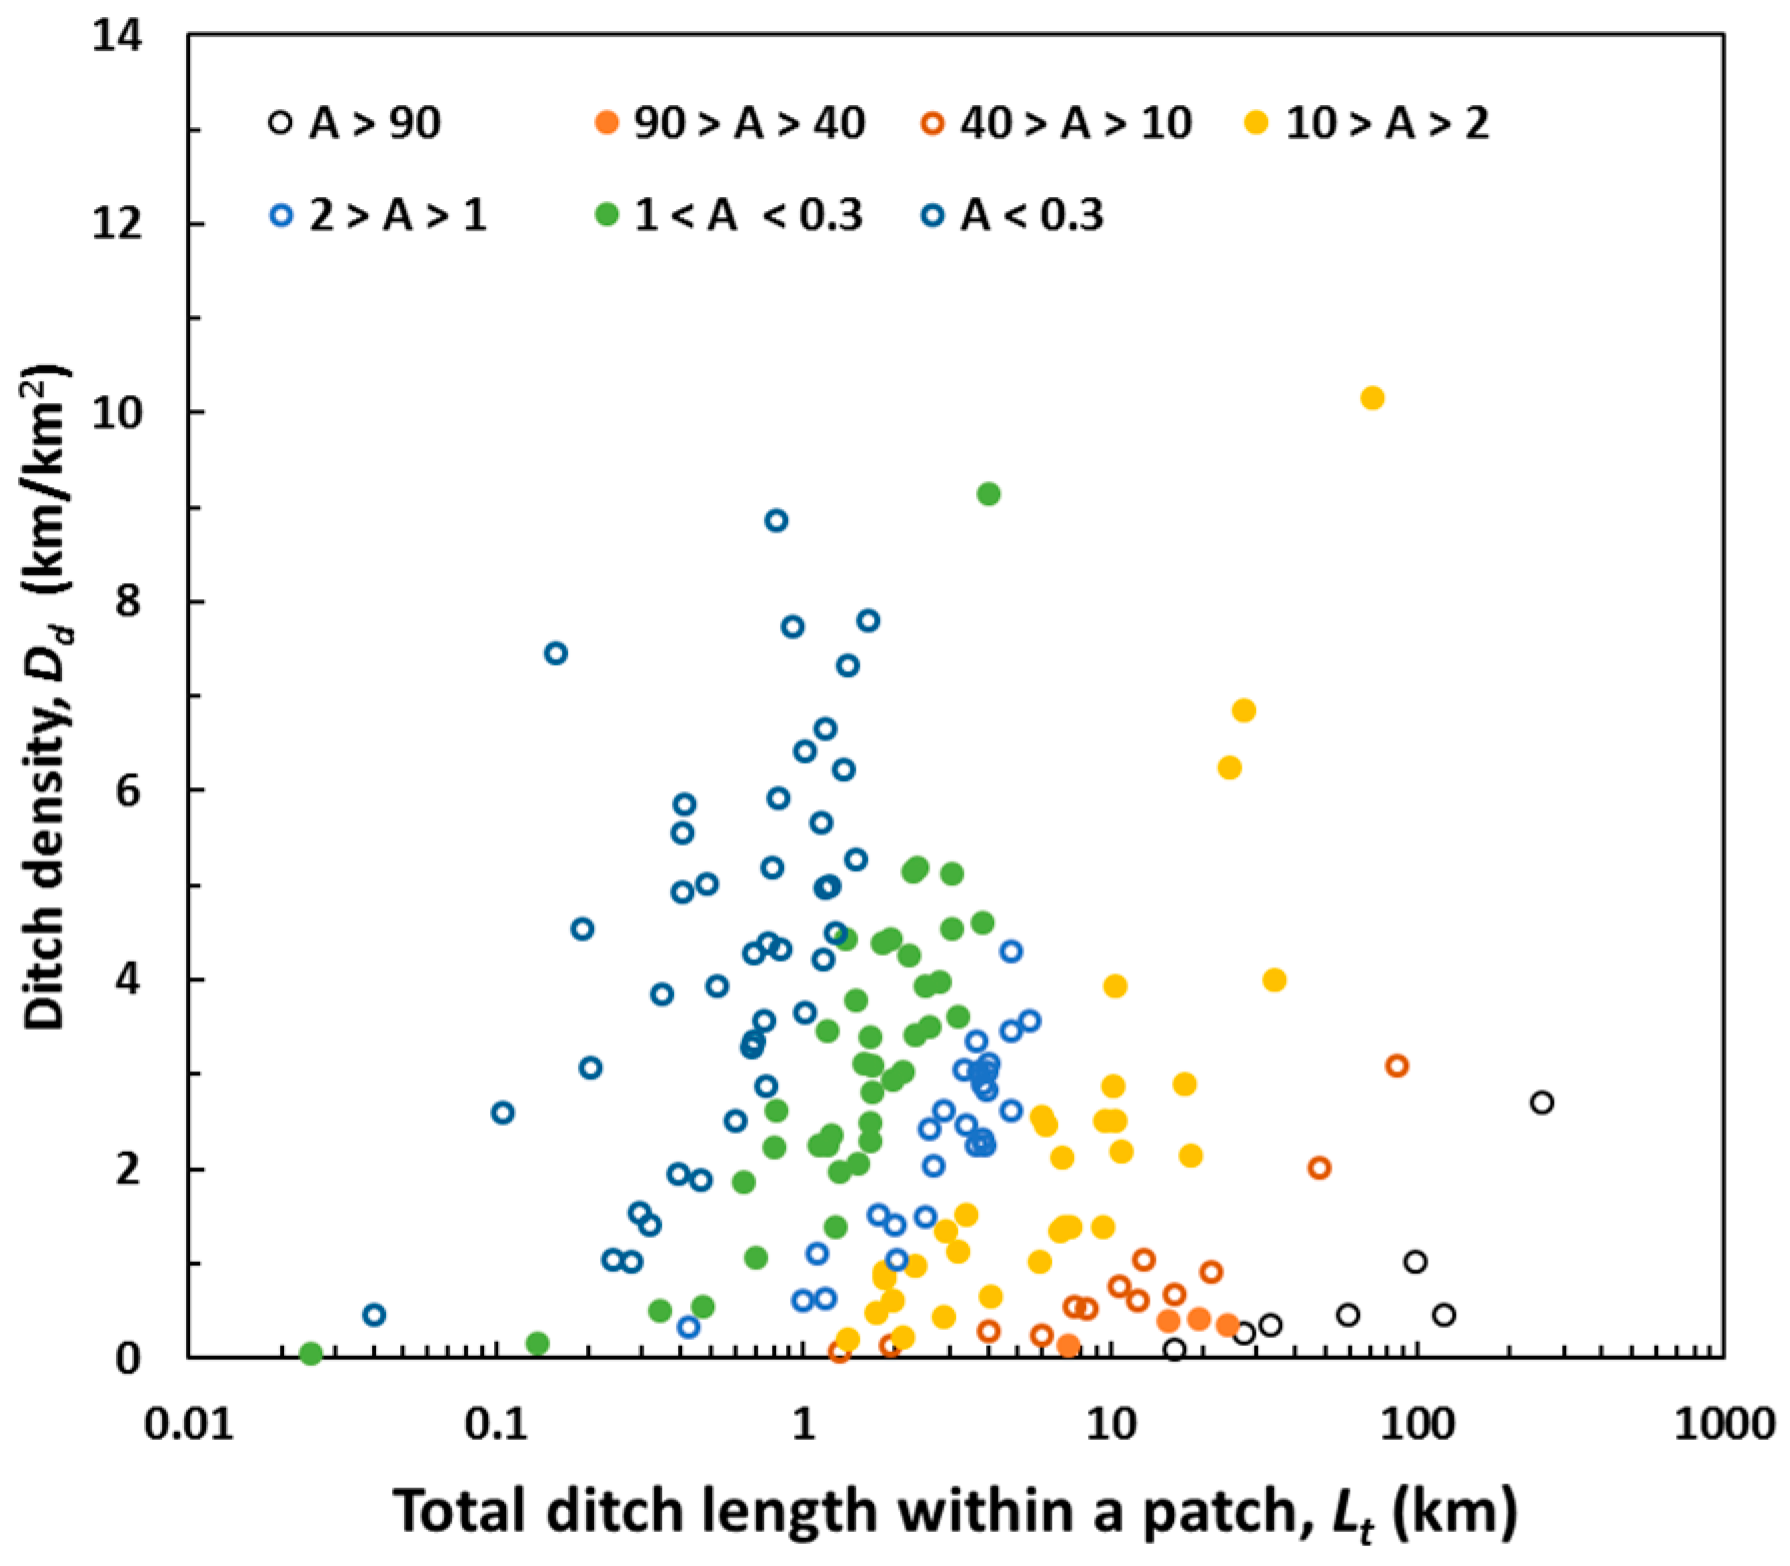
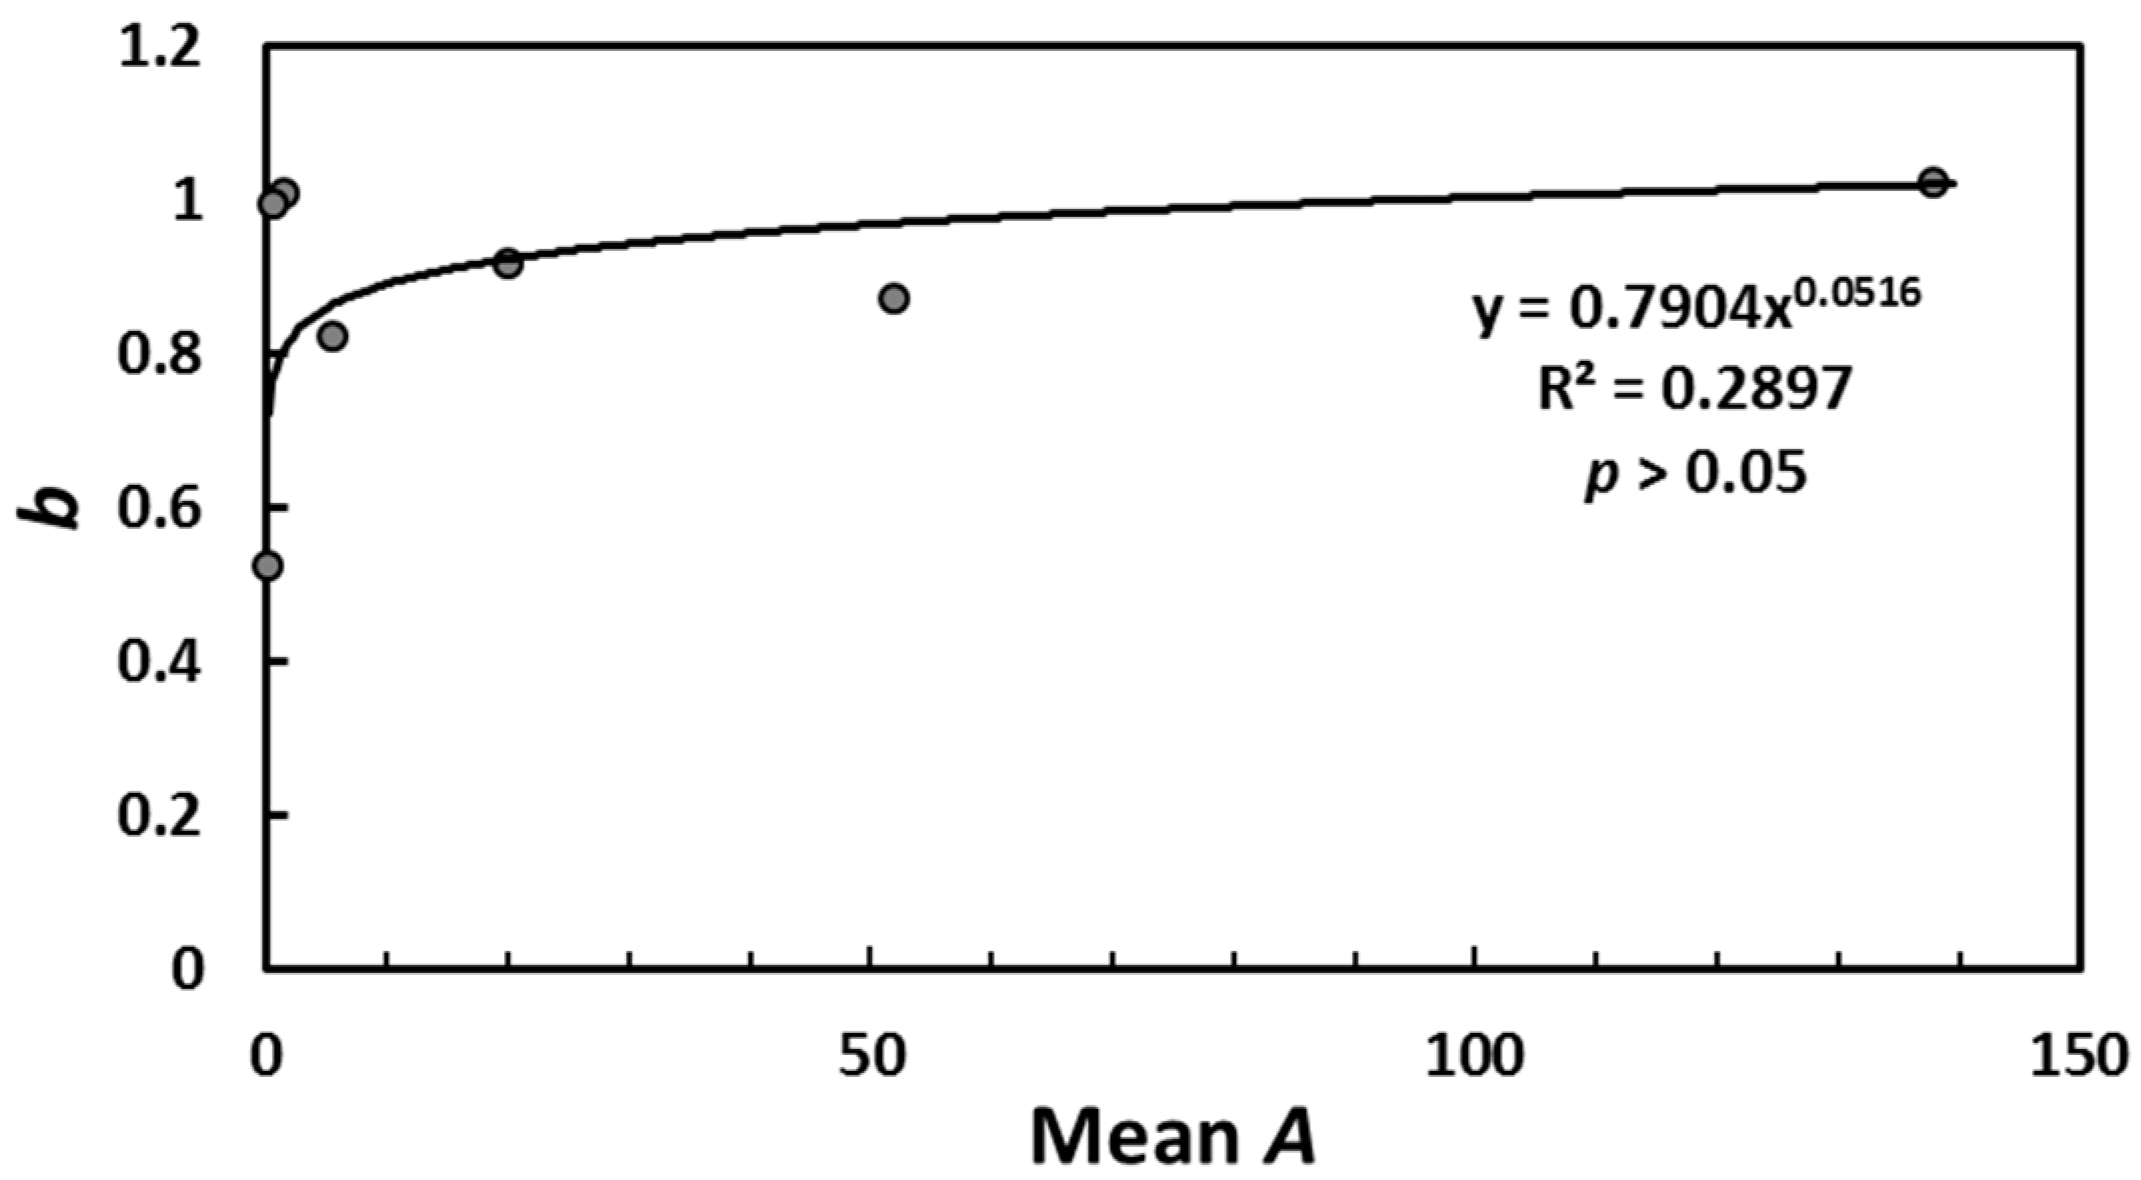
3.1. Statistical Characteristics of the Artificial Ditches

Ditch length varied greatly from 62 to about 18,008 m with the mean of 1294 m (Table 1). The high variation was reflected by the relatively high CV (coefficient of variance) value (1.112). Although the maximum ditch width was 4.5 m, most of them were between 1 and 2 m, which explained their low CV value (0.457). Mean slopes of the ditches varied from almost zero to 0.224 with a higher CV of 1.434. The descriptive statistics displayed that these ditches had very diverse morphology. Therefore, though the total length of artificial ditches was up to 1798.7 km, which gave rise to a mean ditch density of 1.094 km/km2, statistical characteristics of individual ditches were insufficient to reflect their structural hydrological connectivity, which may be different among ditches within different patches.
Spatially, the artificial ditches were arranged in groups clustered within 160 peatland patches whose areas vary from 0.02 to 271.9 km2 (Figure 2). The mean slopes of these patches ranged from 3.68 to 15.5° with about 80% of them falling between 8 and 10°. These three parameters showed different statistical variations and thus were hard to use together to characterize structural hydrological connectivity of these ditches. Ditch density (Dd) might be such a parameter describing physical structure of ditches within a peatland patch. It varied from 0.045 to 10.17 km/km2 for all patches. Most of Dd values were concentrated in the ranges of 0 to 1 and 2 to 3 km/km2 (Figure 3), which may lead to a diplotemic standard with a threshold of 2 km/km2. Peatland patches that had Dd values less than the threshold could be regarded having low structural hydrological connectivity, while those with Dd higher than it could have high structural hydrological connectivity.
Unfortunately, this standard oversimplified the complexity of ditch densities in all patches. For example, two patches with significantly different areas (i.e., 0.55 and 27.89 km2) could have a similar Dd value (i.e., 3.08) (patches a and b in Figure 4), suggesting that the ditch density failed to fully capture the potential impact of the patch area on structural hydrological connectivity. The structural impact of areas on ditches may be demonstrated in two aspects. First, both the number of individual ditches and increasing trend of this number increased with the patch area (Figure 5a). Also, in patches with larger areas, the ditch number varied to a much higher degree. Second, ditch density tended to decrease with the increase of the ditch area (Figure 5b). Although the trend followed a power function with the statistical significance, distinct scatter extended over the full range of the data, which was also consistent with the relatively low R2 value. This suggested that Dd alone was insufficient to characterize the impact of patch areas on ditch structures within patches. Indeed, the decreasing rate of Dd was different for patches with Dd greater and less than 2 km/km2 (Figure 5b), which was the threshold displayed in Figure 3. This consistency further demonstrated the limitation of Dd described previously. A possible missing component was the proportion of ditches that are directly connected to natural gullies and streams in each peatland patch (i.e., ditch drainage ability, Pa). The index, I, which incorporated the contributions of both factors to structural hydrological connectivity, showed an improved correlation with the patch area (Figure 6). This index displayed a relatively strong and statistically significant nonlinear relationship with the patch area. The relationship signified that I generally decreased with the patch area and the decrease rate was higher when A was less than 0.6 km2, while lower when A > 0.6 km2 (Figure 6). These results revealed that in small patches, the number of ditches was small, but structural hydrological connectivity was high, whereas large patches typically had more ditches with lower structural hydrological connectivity.
The still significant scatter data in Figure 6 reflected internal complexity of ditch structure in patches with similar areas. For instance, in two relatively small patches with the areas around 0.07 km2, the one with the long sideline of a patch contour along the vertical direction had a higher I index and thus higher structural hydrological connectivity than the one whose long sideline was in the horizontal direction (Figure 4, patches c and d). Additionally, in two relatively large patches with area of approximately 7 km2, the patch with ditches arranged in a parallel pattern had a higher value of I index and, thus, higher structural hydrological connectivity than that in the patch having a single ditch (Figure 4, patches e and f).

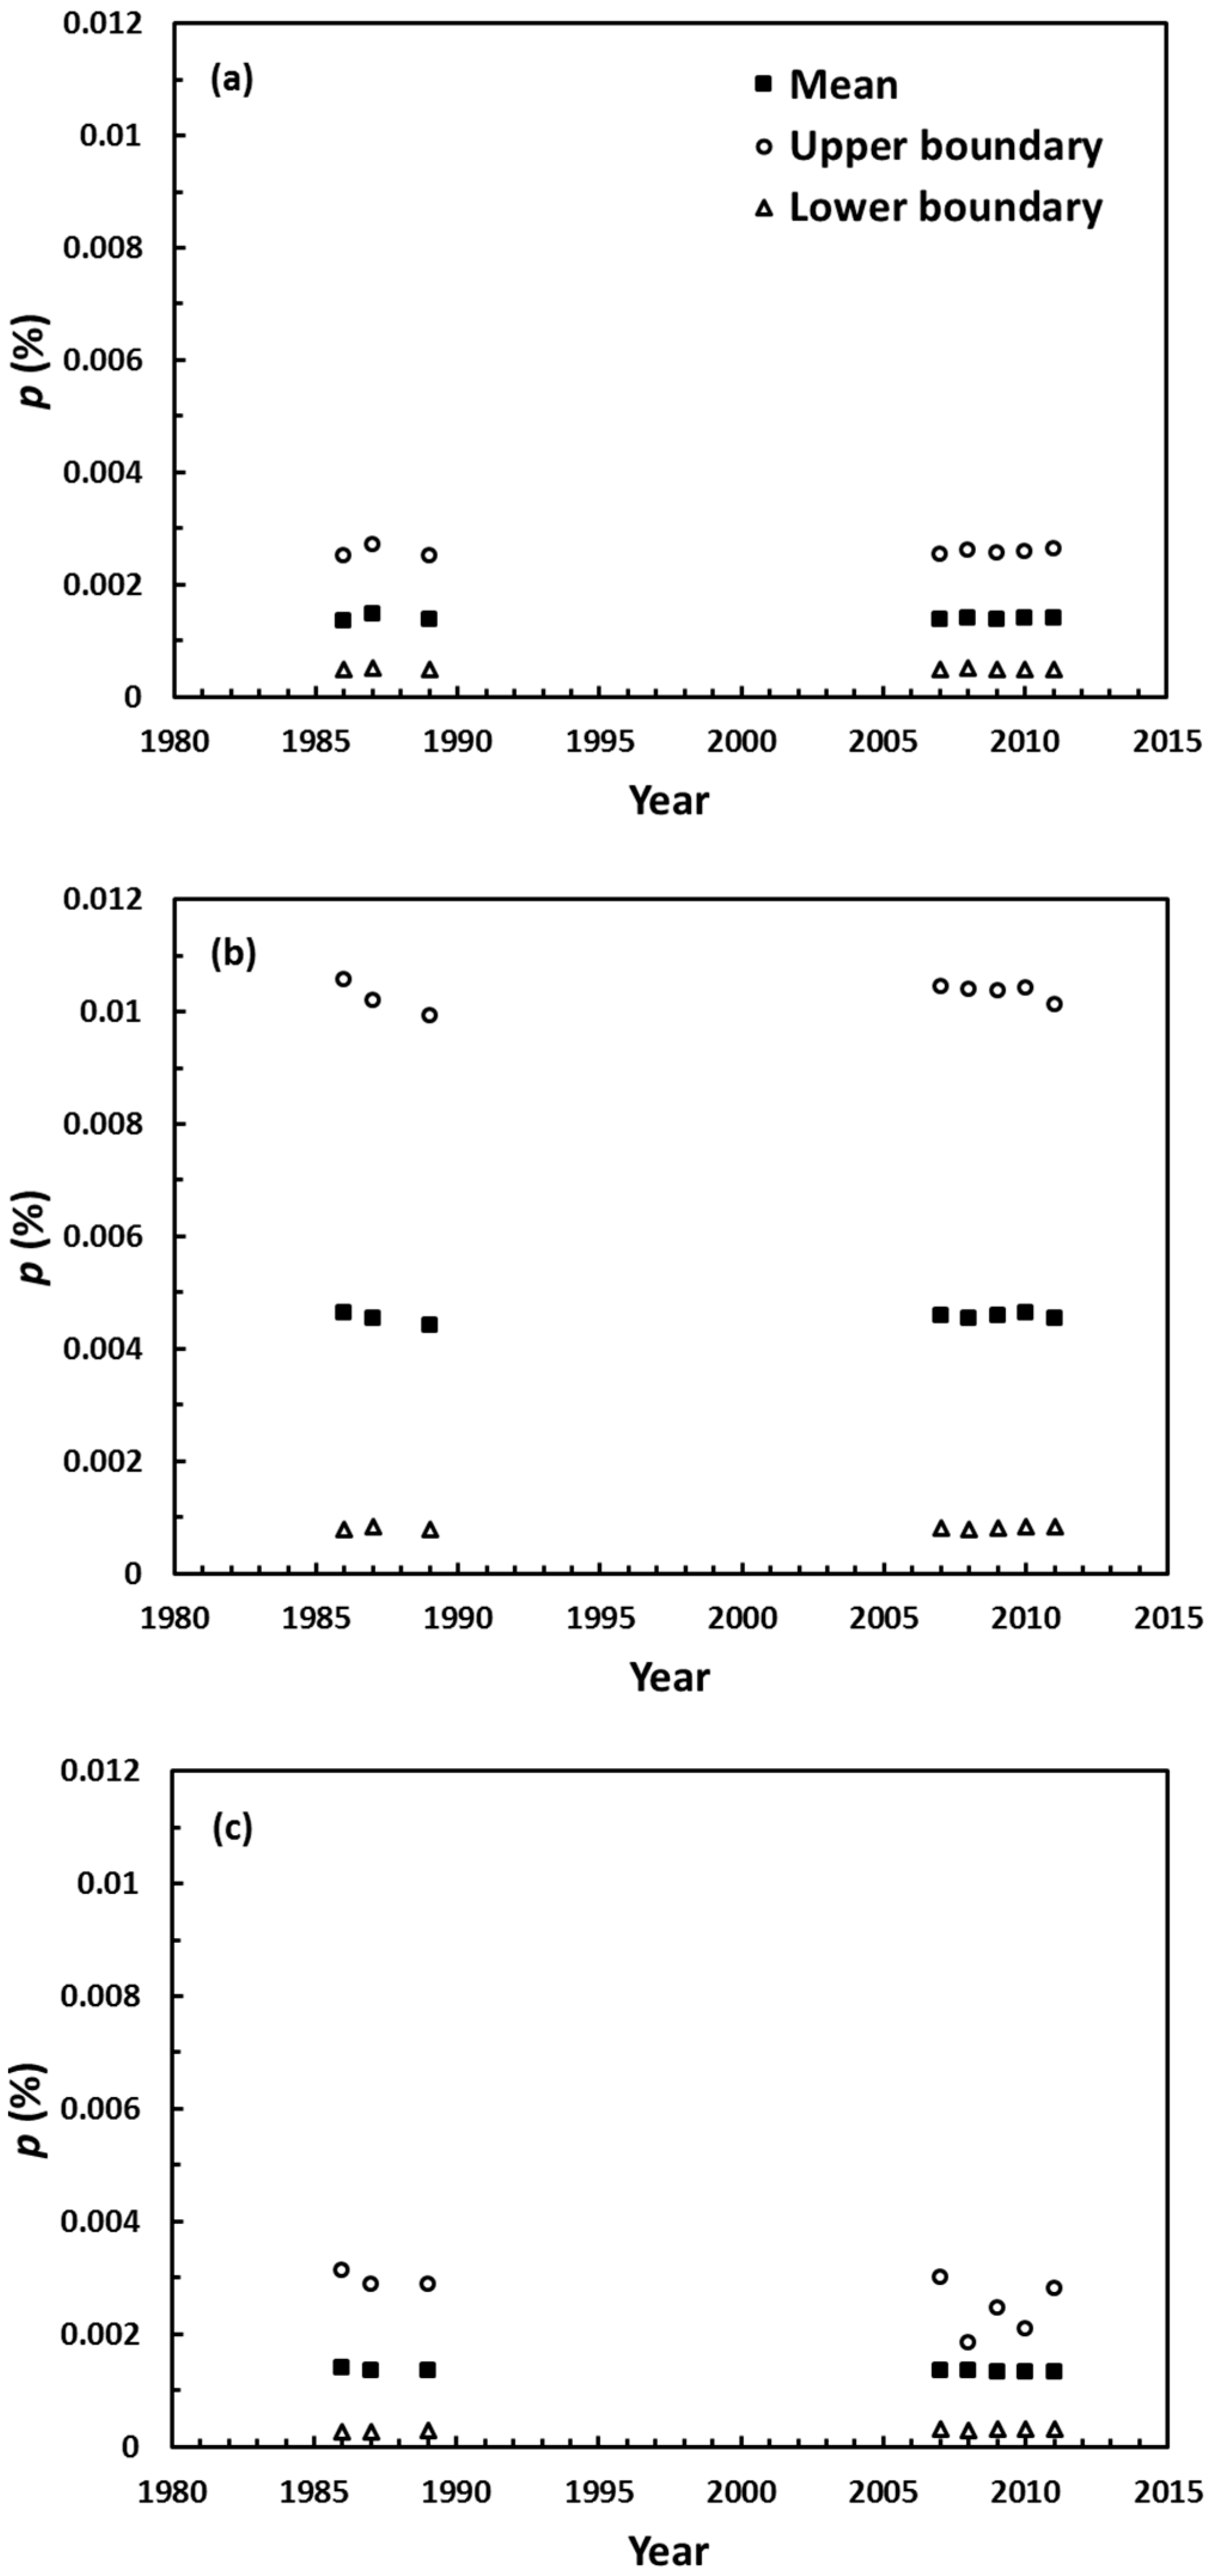
3.2. Spatial and Temporal Changes of Annual Volume of Water Drained Out of Patches

In 1986, as patch area (A) in each zone increased, the water volume drained from ditches in all patches, V, generally increased, though for the same area, values of A both within each zone and among all zones may vary greatly (Figure 7a). This general trend indicated that ditches in patches with larger areas can drain more water. Yet, the efficiency of draining water, which may be quantitatively described as the water volume drained per unit patch area, discernibly decreased with the patch area (Figure 7b). Again, the relatively large variations of the unit water volumes for patches with similar areas strongly suggested that their highly variable internal physical structures of ditches controlled their efficiencies of functional hydrological connectivity. In 2011, values of V and those per unit patch area remained similar patterns to those in 1986, though magnitudes of V reduced marginally from 3.5986 to 3.844 m3. These similar patterns, but different total volumes of water essentially reflected that the difference of functional hydrological connectivity among all peatland patches during the two years was mainly caused by the differences of rainfall events (including the number of raining days and magnitudes of these rainfall events) in these two years. The cumulative effect of functional hydrological connectivity at the patch level can be reflected by precipitation (i.e., p values) in the three different subareas.
Over the period of 1986 to 2011, p-values in each zone (i.e., Dashui, Zoige, and Baihe subarea) changed little with the mean of 0.0014%, 0.0046%, and 0.0013%, respectively (Figure 8). In the same period, raining days, however, varied in the ranges of 13 to 22, 10 to 30, and 15 to 27 days for the three zones, respectively. Thus, though the specific water volume drained from ditches in each zone may change with rainfall characteristics from year to year, the proportion of drain water in the total water flowing out of each zone remained almost unchanged over years, suggesting functional hydrological connectivity of these clustered ditches was mainly controlled by their structural hydrological connectivity, which has changed very little since their construction (those being blocked in the past decades were not included). Regardless of the upper-boundary, mean, or lower-boundary cases, p-values were significantly higher in the Zoige Zone than those in the other two zones (Figure 8). These differences in p-values were consistent with the mean ditch density in the three zones, which were 0.687, 3.067, and 2.506, which again reflected the dominant effect of structural hydrological connectivity on functional hydrological connectivity.

4. Discussions

4.1. Significance of Hydrological Connectivity in Peatland Management

When Dd was plotted against the total ditch length, Lt (km) for peatland patches was classified into seven different groups of patch areas; Dd demonstrated a monographic and positive relationship with Lt consistently in all groups (Figure 9). Since there was essentially no overlay among the data in each area class, the area classification appropriately separated different relationships in terms of patch areas. Nonlinear regression analysis in each area class showed that a power function between Dd and Lt had a R2 value greater than 0.77 for all except the smallest area class (i.e., class 7), indicating the strong relationship between the two variables (Table 2). Although the R2 value was not high, the power function for class 7 was still statistically significant. The function with b = 1 signified that for peatland patches within the associated area classes, increase of ditch length would proportionally increase the associated ditch density. The one with b < 1 indicated that ditch density will increase at the rate less than the increasing rate of ditch length for patches in the associated area classes. Statistically, the plot of b values against patch areas for all seven classes (Figure 10) showed that as the patch mean area increased, b tended to increase and approach 1 for patches with larger areas, though this relationship was not statistically significant. Thus, ditch densities in patches with larger areas tended to be more sensitive to changes of their ditch lengths. So, the degree of structural hydrological connectivity in patches with larger areas was generally higher than that in smaller patches given that their ditch densities were the same. Since functional hydrological connectivity was mainly controlled by internal structures of ditches in each patch, adding or blocking ditches in patches with larger areas could increase or decrease functional hydrological connectivity more than in smaller patches. This implies that in practice, it will be more efficient to manage large peatland patches than smaller ones.
The determined annual total volume drained from ditches in each patch essentially reflected the functional hydrological connectivity of ditches under storm flow conditions. In a cycle of one year, ditch flow, most of time (more than 300 days), contributed to base flow of natural gullies and streams. Unfortunately, water depths of ditches during these periods varied greatly, some of which may be even zero (i.e., ephemeral ditches). Estimation of the total drained volume from all ditches is thus very difficult. Nonetheless, the estimated very low percentages of drained water to the total storm flows of the entire watershed (i.e., p < 0.02%) suggested that the effect of artificial ditches on peatland is predominantly existed in the prolonged baseflow period of a year during which water in peatland is mainly drained via groundwater and slower subsurface flows.

4.2. Uncertainties in Calculations

Three types of sources of errors in this study are worth mentioning. First, the error arising from identifying ditch morphology in the Google Earth imagery. Ditch widths were generally easy to extract because most artificial ditches were straight with similar widths along ditches (see inset in Figure 1c). Yet, for those passing through saturated peatland patches, their widths could be hard to identify, leading to some uncertainties in the extracted values of widths. Given that ditch widths were merely used as a part of statistical results and the degree of their variation was relatively small (Table 1), this type of error had little effect on our quantitative analyses. For ditches that were not directly connected to natural gullies and/or streams, their ending points may be unclear in the images, which could cause error in calculating the ditch length. Considering that the resolution of the Google Earth imagery was 0.6 m, this type of error should not be over 1 m and probably had more impact on calculation of ditch densities in smaller patches than in larger ones. Thus, these errors may have had limited influence on the data of small patch areas in Figure 5a, but may not affect trends of the developed statistical results. Second, uncertainties in determining values of Pa for all peatland patches. When a ditch is connected to several natural gullies and/or streams, it could only be counted as one ditch to satisfy the definition of Pa; though its structural hydrological connectivity should be logically higher. This physical complexity would introduce certain errors in the calculated values of Pa and hence be passed to those of I, which may be contributed to scatter of the data in Figure 6. However, these errors did not affect the statistical significance of the IA relationship because the influence of Dd on I should be higher than that of Pa. Third, error in determining mean flow depths in ditch channels of all peatland patches. There is no measured hydrological data available in any ditch within these peatland patches. Therefore, assuming that back-calculated mean water depths were the same in all ditches was an approximation, which explained why, for each peatland patch in each year, we calculated a range of drained water volume using five different peatland patches. We think such uncertainty would mainly cause systematic errors that did not affect spatial and temporal patterns of their drained water volumes. Indeed, the consistent trends among the upper-boundary, mean, and lower-boundary cases of calculated p-values (i.e., Figure 8) suggested that though uncertainties in calculating the mean ditch water depth may affect the numerical values of p, they did not affect their patterns and hence the nature of functional hydrological connectivity.

5. Conclusions

This study revealed the nature of hydrological connectivity of artificial ditches in the Zoige peatlands, located on the northeastern side of the Qinghai-Tibet Plateau, China. The morphological and topographic details of 1392 ditches clustered within 160 peatland patches and daily water discharges in eight years were obtained from Google Earth imagery and three hydrological stations, respectively. Using these data, we examined the structural and functional hydrological connectivity of these artificial ditches that may be summarized here.
Although the physical structure of individual ditches varied greatly, the clustered ditches within peatland patches may be characterized quantitatively using an index that was a product of two structural parameters: ditch density and drainage ability defined as the proportion of ditches directly connected to natural gullies and streams within each peatland patch. Using this index, we showed that the degree of structural hydrological connectivity decreased as the patch area increased and was more sensitive to the changes of ditches in larger peatland patches. Larger peatland patches are more sensitive to changes of ditches, implying that ditch management should be more focused on ditches in larger peatland patches.
The total volume of water drained from the artificial ditches had a tendency of increasing with the patch area, but the efficiency of draining water, which was represented as the total drained water from ditches per unit patch area, reduced with the increase of patch area. Functional hydrological connectivity of the artificial ditches is essentially controlled by their structural hydrological connectivity. Such connectivity during rainfall periods of a given year was very low because the total amount of drained water only took about 0.01% of the total amount of storm flows in the study area. These results suggested that ditches during rainfall periods do not affect hydrological connectivity of the entire Zoige Basin because rain water can be effectively transferred through the system by moving as overland flow from contributing lands directly to natural gullies and streams. They also implied that these artificial ditches played an important role of draining groundwater and slow subsurface flow during the non-rainfall periods because, though flows during these periods were significantly lower than those during the rainfall periods, these dry periods are much longer than the latter and hence can generate significant cumulative effect of draining water from peatland. Therefore, more attention should be paid to hydrological processes of groundwater draining during the dry season in the Zoige Basin.

Author Contributions

Conceptualization and Methodology, Z.L., P.G., and Y.Y.; Acquisition, Analysis, and Interpretation of the data, Z.L., P.G., and Y.Y.; Writing-Original Draft Preparation, P.G. and Z.L.; Writing-Review & Editing, P.G. and Z.L.; Funding Acquisition, Z.L.

Funding

This study was supported by the Open Project of State Key Laboratory of Plateau Ecology and Agriculture, Qinghai University (2017-KF-01), National Natural Science Foundation of China (91547112, 91647204, 91647118, 51709020), Project of Qinghai Science & Technology Department (2016-ZJ-Y01, 2017-HZ-802), the Project of Changsha Science & Technology Bureau (kq1701075), and the Project of Hunan Science & Technology Plan (2018SK1010).

Acknowledgments

We appreciate two anonymous reviewers for their constructive comments and valuable suggestions in the original manuscript.

Conflicts of Interest

The authors declare no conflicts of interest.

References

  1. Armstrong, A.; Holden, J.; Kay, P.; Francis, B.; Foulger, M.; Gledhill, S.; McDonald, A.T.; Walker, A. The impact of peatland drain-blocking on dissolved organic carbon loss and discolouration of water; results from a national survey. J. Hydrol. 2010, 381, 112–120. [Google Scholar] [CrossRef]
  2. Holden, J.; Chapman, P.J.; Labadz, J.C. Artificial drainage of peatlands: Hydrological and hydrochemical process and wetland restoration. Prog. Phys. Geogr. 2004, 28, 95–123. [Google Scholar] [CrossRef]
  3. Labadz, J.; Allott, T.; Evans, M.; Butcher, D.; Billett, M.; Stainer, S.; Yallop, A.; Jones, P.; Innerdale, M.; Harmon, N.; et al. Peatland Hydrology. Draft Scientific Review; IUCN UK Peatland Programme’s Commission of Inquiry on Peatlands: Edinburgh, UK, 2010; p. 52. [Google Scholar]
  4. Price, J.S.; Heathwaite, A.L.; Baird, A.J. Hydrological processes in abandoned and restored peatlands: An overview of management approaches. Wetl. Ecol. Manag. 2003, 11, 65–83. [Google Scholar] [CrossRef]
  5. Stenberg, L.; Finer, L.; Nieminen, M.; Sarkkola, S.; Koivusalo, H. Quantification of ditch bank erosion in a drained forested catchment. Boreal Environ. Res. 2015, 20, 1–18. [Google Scholar]
  6. Holden, J.; Chapman, P.J.; Lane, S.N.; Brookes, C. Impacts of artificial drainage of peatlands on runoff production and water quality. In Peatlands: Evolution and Records of Environmental and Climate Changes; Martini, L.P., Martınez, C.A., Chesworth, W., Eds.; Elsevier: Amsterdam, The Netherlands, 2006; pp. 501–528. [Google Scholar]
  7. Ramchunder, S.J.; Brown, L.E.; Holden, J. Environmental effects of drainage, drain-blocking and prescribed vegetation burning in UK upland peatlands. Progr. Phys. Geogr. 2009, 33, 49–79. [Google Scholar] [CrossRef]
  8. Daniels, S.M.; Agnew, C.T.; Allott, T.E.H.; Evans, M.G. Water table variability and runoff generation in an eroded peatland, South Pennines, UK. J. Hydrol. 2008, 361, 214–226. [Google Scholar] [CrossRef]
  9. Holden, J. Upland hydrology. In Drivers of Change in Upland Environments; Bonn, A., Allott, T.E.H., Hubacek, K., Stewart, J., Eds.; Routledge: Oxon, UK, 2009; pp. 113–134. [Google Scholar]
  10. Rossi, P.M.; Ala-aho, P.; Ronkanen, A.K.; Klove, B. Groundwater-surface water interaction between an esker aquifer and a drained fen. J. Hydrol. 2012, 432, 52–60. [Google Scholar] [CrossRef]
  11. Xu, J.R.; Morris, P.J.; Liu, J.G.; Holden, J. PEATMAP: Refining estimates of global peatland distribution based on a meta-analysis. Catena 2018, 160, 134–140. [Google Scholar] [CrossRef]
  12. Ballard, C.E.; McIntyre, N.; Wheater, H.S. Effects of peatland drainage management on peak flows. Hydrol. Earth Syst. Sci. 2012, 16, 2299–2310. [Google Scholar] [CrossRef] [Green Version]
  13. Joosten, H.; Schumann, M. Hydrogenetic aspects of peatland restoration in Tibet and Kalimantan. Glob. Environ. Res. 2007, 11, 195–204. [Google Scholar]
  14. Letts, M.G.; Roulet, N.T.; Comer, N.T.; Skarupa, M.R.; Verseghy, D.L. Parametrization of peatland hydraulic properties for the Canadian Land Surface Scheme. Atmos.-Ocean 2000, 38, 141–160. [Google Scholar] [CrossRef]
  15. Ronkanen, A.K.; Klove, B. Hydraulic soil properties of peatlands treating municipal wastewater and peat harvesting runoff. Suo 2005, 56, 43–56. [Google Scholar]
  16. Cui, M.; Ma, A.; Qi, H.; Zhuang, X.; Zhuang, G.; Zhao, G. Warmer temperature accelerates methane emissions from the Zoige wetland on the Tibetan Plateau without changing methanogenic community composition. Sci. Rep. 2015, 5, 11616. [Google Scholar] [CrossRef] [PubMed] [Green Version]
  17. Li, Z.; Liu, X.; Ma, T.; De, K.; Zhou, Q.; Yao, B.; Niu, T. Retrieval of the surface evapotranspiration patterns in the alpine grassland–wetland ecosystem applying SEBAL model in the source region of the Yellow River, China. Ecol. Modell. 2013, 270, 64–75. [Google Scholar] [CrossRef]
  18. Li, B.; Yu, Z.; Liang, Z.; Song, K.; Li, H.; Wang, Y.; Zhang, W.; Acharya, K. Effects of climate variations and human activities on runoff in the Zoige alpine wetland in the Eastern Edge of the Tibetan Plateau. J. Hydrol. Eng. 2014, 19, 1026–1035. [Google Scholar] [CrossRef]
  19. Sprenger, M.; Tetazlaff, D.; Tunaley, C.; Dick, J.; Soulsby, C. Evaporation fractionation in a peatland drainage network affects stream water isotope composition. Water Resour. Res. 2017, 53, 851–866. [Google Scholar] [CrossRef] [Green Version]
  20. Sun, Z.; Wei, B.; Su, W.; Shen, W.; Wang, C.; You, D.; Liu, Z. Evapotranspiration estimation based on the SEBAL model in the Nansi Lake Wetland of China. Math. Comput. Modell. 2011, 54, 1086–1092. [Google Scholar] [CrossRef]
  21. Yao, W.; Han, M.; Xu, S. Estimating the regional evapotranspiration in Zhalong wetland with the Two-Source Energy Balance (TSEB) model and Landsat7/ETM+ images. Ecol. Inform. 2010, 5, 348–358. [Google Scholar] [CrossRef]
  22. Li, Z.; Wang, Z.; Brierley, G.; Nicoll, T.; Pan, B.; Li, Y. Shrinkage of the Ruoergai Swamp and changes to landscape connectivity, Qinghai-Tibet Plateau. Catena 2015, 126, 155–163. [Google Scholar] [CrossRef]
  23. Zhang, W.; Lu, Q.; Song, K.; Qin, G.; Wang, Y.; Wang, X.; Li, H.; Li, J.; Liu, G.; Li, H. Remotely sensing the ecological influences of ditches in Zoige Peatland, Eastern Tibetan Plateau. Int. J. Remote. Sens. 2014, 35, 5186–5197. [Google Scholar] [CrossRef]
  24. Holden, J.; Burt, T.P. Runoff production in blanket peat covered catchments. Water Resour. Res. 2003, 39, 1191. [Google Scholar] [CrossRef]
  25. Holden, J.; Evans, M.G.; Burt, T.P.; Horton, M. Impact of land drainage on peatland hydrology. J. Environ. Qual. 2006, 35, 1764–1778. [Google Scholar] [CrossRef] [PubMed]
  26. Luscombe, D.J.; Anderson, K.; Grand-Clement, E.; Gatis, N.; Ashe, J.; Benaud, P.; Smith, D.; Brazier, R.E. How does drainage alter the hydrology of shallow degraded peatlands across multiple spatial scales? J. Hydrol. 2016, 541, 1329–1339. [Google Scholar] [CrossRef]
  27. Allott, T.E.H.; Evans, M.G.; Lindsay, J.B.; Agnew, C.T.; Freer, J.E.; Jones, A.; Parnel, M. Water Tables in Peak District Blanket Peatlands; Moors for the Future Report No. 17; Hydrological Benefits of Moorland Restoration; Moors for the Future: Edale, UK, 2009; p. 49. [Google Scholar]
  28. Lane, S.N.; Brookes, C.J.; Kirkby, M.J.; Holden, J. A network-index-based version of TOPMODEL for use with high-resolution digital topographic data. Hydrol. Proc. 2004, 18, 191–201. [Google Scholar] [CrossRef] [Green Version]
  29. Pringle, C.M. Hydrologic connectivity and the management of biological reserves: A global perspective. Ecol. Appl. 2001, 11, 981–998. [Google Scholar] [CrossRef]
  30. Gallardo, B.; Garcia, M.; Cabezas, A.; Gonzalez, E.; Gonzalez, M.; Ciancarelli, C.; Comin, F.A. Macroinvertebrate patterns along environmental gradients and hydrological connectivity within a regulated river-floodplain. Aquat. Sci. 2008, 70, 248–258. [Google Scholar] [CrossRef]
  31. Jackson, C.R.; Pringle, C.M. Ecological Benefits of Reduced Hydrologic Connectivity in Intensively Developed Landscapes. BioScience 2010, 60, 37–46. [Google Scholar] [CrossRef] [Green Version]
  32. Opperman, J.J.; Luster, R.; McKenney, B.A.; Roberts, M.; Meadows, A.W. Ecologically Functional Floodplains: Connectivity, Flow Regime, and Scale. J. Am.Water Resour. Assoc. 2000, 46, 211–226. [Google Scholar] [CrossRef]
  33. Cabezas, A.; Gonzalez, E.; Gallardo, B.; Garcia, M.; Gonzalez, M.; Comin, F.A. Effects of hydrological connectivity on the substrate and understory structure of riparian wetlands in the Middle Ebro River (NE Spain): Implications for restoration and management. Aquat. Sci. 2008, 70, 361–376. [Google Scholar] [CrossRef]
  34. Lang, M.; McDonough, O.; McCarty, G.; Oesterling, R.; Wilen, B. Enhanced detection of wetland-stream connectivity using Lidar. Wetlands 2012, 32, 461–473. [Google Scholar] [CrossRef]
  35. Golden, H.E.; Lane, C.R.; Amatya, D.M.; Bandilla, K.W.; Kiperwas, H.R.; Knightes, C.D.; Ssegane, H. Hydrologic connectivity between geographically isolated wetlands and surface water systems: A review of select modeling methods. Environ. Modell. Softw. 2014, 53, 190–206. [Google Scholar] [CrossRef]
  36. Bracken, L.J.; Croke, J. The concept of hydrological connectivity and its contribution to understanding runoff-dominated geomorphic systems. Hydrol. Proc. 2007, 21, 1749–1763. [Google Scholar] [CrossRef]
  37. Racchetti, E.; Bartoli, M.; Soana, E.; Longhi, D.; Christian, R.R.; Pinardi, M.; Viaroli, P. Influence of hydrological connectivity of riverine wetlands on nitrogen removal via denitrification. Biogeochemistry 2011, 103, 335–354. [Google Scholar] [CrossRef]
  38. Freeman, M.C.; Pringle, C.M.; Jackson, C.R. Hydrologic connectivity and the contribution of stream headwaters to ecological integrity at regional scales. J. Am. Water Resour. Assoc. 2007, 43, 5–14. [Google Scholar] [CrossRef]
  39. Bracken, L.J.; Wainwright, J.; Ali, G.A.; Tetzlaff, D.; Smith, M.W.; Reaney, S.M.; Roy, A.G. Concepts of hydrological connectivity: Research approaches, pathways and future agendas. Earth-Sci. Rev. 2013, 119, 17–34. [Google Scholar] [CrossRef] [Green Version]
  40. Tockner, K.; Pennetzdorfer, D.; Reiner, N.; Schiemer, F.; Ward, J.V. Hydrological connectivity, and the exchange of organic matter and nutrients in a dynamic river-floodplain system (Danube, Austria). Feshwater Biol. 1999, 41, 521–535. [Google Scholar] [CrossRef]
  41. Lexartze-Artza, I.; Wainwright, J. Hydrological connectivity: Linking concepts with pratical implications. Catena 2009, 79, 146–152. [Google Scholar] [CrossRef]
  42. Wohl, E. Connectivity in rivers. Progr. Phys. Geogr. 2017, 41, 345–362. [Google Scholar] [CrossRef]
  43. Li, W. Manual of Hydraulic Computation, 2nd ed.; China Water & Power Press: Beijing, China, 2006; p. 676. (In Chinese) [Google Scholar]
Figure 1. Location of the Zoige Basin and geographic characteristics of the artificial ditches. (a) Geographic position of the Zoige Basin in China. (b) The Upper Yellow River and its two main tributaries within the Zoige Basin, White and Black Rivers. (c) Spatial distribution of Zoige peatlands and artificial ditches that are mainly concentrated in White and Black River watersheds. Dashui at the lower section, Zoige at Zoige County, and Baihe at Tangke Town are three hydrological stations recording water discharges from their contributing areas.
Water 10 01364 g001
Figure 2. Spatial patterns of the clustered artificial ditches in the associated peatland patches and three zones (Dashui, Zoige, and Baihe) in which rainfall water drains to the locations where the three hydrological stations are located. Each peatland patch was connected through ditches to natural gullies, tributaries, and the main river stems (Note: a few ditches located in grasslands were not included).
Water 10 01364 g002
Figure 3. Histogram of ditch densities (Dd) in peatland patches; two modes existed in the 0 to 1 and 2 to 3 km/km2 ranges.
Water 10 01364 g003
Figure 4. Examples of peatland patches that had specifically different structures: (a,b) had different patch areas with similar ditch densities; (c,d) had similar larger patch areas with different values of I index; and (e,f) had similar smaller patch areas with different values of I index.
Water 10 01364 g004
Figure 5. Structural characteristics of artificial ditches. (a) Ditch number in each patch vs. patch area; (b) ditch density within each patch vs. patch area.
Water 10 01364 g005
Figure 6. Values of index I for all patches vs. patch areas.
Water 10 01364 g006
Figure 7. Patterns of drained ditch water in all peatland patches grouped into three zones (subareas) with regard to their areas in 1986. (a) Volume of the total drained water and (b) volume of the total drained water per unit area of each patch.
Water 10 01364 g007
Figure 8. Temporal changes of p-values over the 1986 to 2012 period. (a) Dashui; (b) Zoige; and (c) Baihe. Data labeled upper boundary represent the possible high p-values in the same year, while data labeled lower boundary represent the possible low p-values in the same year.
Water 10 01364 g008
Figure 9. Relationships between ditch density (Dd) and total ditch length within a peatland patch for all patches (Lt) that were classified into seven groups based on patch areas (A).
Water 10 01364 g009
Figure 10. Relationship between the exponent b of the power function between Dd and Lt for each of the seven patch groups (Table 2) and patch area.
Water 10 01364 g010
Table 1. Descriptive statistics of individual ditches.
MeanSt DevMaximumMinimumCV *
Length (m)129414391800862.41.112
Width (m)1.5610.7144.50.60.457
Slope (m/m)0.0190.0280.2240.01.434
* CV is coefficient of variance, defined as the ratio of standard deviation to the associated mean.
Table 2. Results of nonlinear regression analysis between Dd and Lt for seven classes of patch areas.
ClassRange of AreaabR2p-Value
Class 1A > 900.00721.0210.8577<0.05
Class 240 < A < 900.02780.8730.8314<0.05
Class 310 < A < 400.06200.9170.9449<0.05
Class 42 < A < 100.33260.8220.7791<0.05
Class 51 < A < 20.71221.0080.9088<0.05
Class 60.3 < A < 11.77800.9930.907<0.05
Class 7A < 0.35.04890.5230.4335<0.05

