Article

Simulation of Trinitrogen Migration and Transformation in the Unsaturated Zone at a Desert Contaminant Site (NW China) Using HYDRUS-2D

1
Engineering Research Center for Groundwater Pollution Control and Remediation of Ministry of Education of China, College of Water Sciences, Beijing Normal University, Beijing 100875, China
2
State Key Laboratory of Geohazard Prevention and Geoenvironment Protection, Chengdu University of Technology, Chengdu 610059, China
*
Authors to whom correspondence should be addressed.
Water 2018, 10(10), 1363; https://doi.org/10.3390/w10101363
Submission received: 20 August 2018 / Revised: 5 September 2018 / Accepted: 27 September 2018 / Published: 30 September 2018

Abstract

:
The protection of an unsaturated zone is essential for groundwater-quality security. Neglecting pollutant changes in the saturated zone can affect the accuracy of groundwater-quality assessments. Unlike water sampling, the nonreproducibility of soil sampling complicates the observation of contaminant changes at different times in the same location. The HYDRUS-2D model, coupled with the Richards equation and the convection-dispersion equation, was applied to simulate the migration and transformation of high ammonia concentrations in wastewater in an unsaturated zone. Long-term field observations were carried out for trinitrogen (NH4+, NO2, and NO3) from 2015 to 2018 at a wastewater discharge site located in a desert area in northwest China. Samples were collected twice a month. The model was calibrated and validated using statistics and observation data. Variations in trinitrogen concentrations were simulated using the model and fitted well with the measured values. Simulation results for trinitrogen migration and transformation demonstrated that there was no enrichment on the ground surface. Contaminants attenuated rapidly in the unsaturated zone after wastewater discharge stopped. NH4+ was oxidized to NO2 and NO3 under nitrification, except in the anoxic subclay lenses. Subclay lenses were not considered in previous research. These lenses had high enrichment with contaminants and prevented secondary nitrification, which might have led to extremely low NO3 concentrations. The removal rate of contaminants by the unsaturated zone in natural conditions is as high as 76%, and contaminants could be degraded to acceptable levels within 10 years (3650 days) without artificial interventions. This indicates that the unsaturated zone can delay migration and degrade contaminants, and should be taken into consideration in groundwater-quality assessments.

1. Introduction

Contamination at wastewater-discharge sites is a growing threat and can have a major impact on social development [1]. This is of particular concern in developing countries. Contamination disrupts the ecosystem balance, and results in economic losses and human health issues [2,3]. Contaminated sites can be formed at various spatial scales because of direct sewage discharge [4,5]. Among the various categories of contaminants, trinitrogen, consisting of NH4+, NO2, and NO3, is one of the most common pollutants [6], and has received much research attention in recent decades [7,8]. Nitrogen-containing pollutants can be absorbed by the body and cause health problems such as methemoglobinemia and cancers of the digestive system [9]. In addition, nitrogen oxide dissolved in water can destroy host defense systems and accelerate the progression of heart disease [10,11]. Nitrogen is an important pollution indicator in groundwater assessment [12].
Groundwater simulation and vulnerability assessment can be applied for assessing groundwater quality. Vulnerability assessments take more unsaturated-zone factors into account than groundwater simulations. For example, DRASTIC, which is widely used in groundwater-vulnerability assessment, consists of seven parameters (Depth to the water table, net Recharge, Aquifer media, Soil type, Topography, Impact of vadose zone, and hydraulic Conductivity) [13,14], and addresses both the unsaturated zone and the aquifer. In contrast to vulnerability assessments, groundwater simulation usually considers the aquifer as a unique medium of water flow and solute transport. In the establishment of the simulation model, two main categories of characteristics are generally considered. The first category is concerned with the properties of the saturated aquifer medium. These are usually determined by collecting and compiling relevant raw hydrogeological data regarding the aquifer [15]. The second category of characteristics is concerned with flow and solute transport, such as solute concentration, length of migration, and physical or chemical reactions that occur during transformation. In generalizing the aquifer, several layers are produced according to different hydrogeological conditions, and the water table is treated as the upper boundary of the model [16]. In contrast, when generalizing the flow solute transport model, the emission concentration of pollutants is directly used as the initial concentration in the model. Unlike DRASTIC, the objective of groundwater simulation is limited to the aquifer and requires input data. These data can be directly and easily obtained through field surveys or laboratory tests of pollutants, which are widely used in groundwater simulation, especially in the study of the hydrogeochemical processes of groundwater.
Pollutant transport in rock occurs at two levels: in the unsaturated zone and in the aquifer. The unsaturated zone, which is critical in DRASTIC, plays an important role in groundwater simulations. Most groundwater simulations directly input surface pollutants to the aquifer [17]. However, this may lead to the erroneous selection of characteristic pollutants or errors in the simulation results.
Almost all aquifers are covered with unsaturated zones, although these zones may vary considerably in thickness. Many laboratory tests have proven that pollutants can be adsorbed and degraded to a certain degree by physical and chemical processes in the unsaturated zone [18,19,20]. For example, the dilution and nitrification of nitrogen in the unsaturated zone can effectively reduce the pollution of aquifers by wastewater [21]. In arid regions, groundwater receives little or no recharge, and there is limited precipitation infiltration in the unsaturated zone. Thus, the unsaturated zones have important delaying and degradation effects on pollutants entering the aquifer, and provide significant groundwater protection [22]. Lima et al. [23] argued that the soil conditions of the unsaturated zone should be considered when constructing a decision system for groundwater-pollution management. Rebolledo et al. [24] reported that soil texture above aquifers plays an important role in the attenuation of nitrogen. Shrestha et al. [25] were of the opinion that, in groundwater vulnerability and risk assessment, the unsaturated zone as well as aquifers should be considered. It seems reasonable to conclude, therefore, that the simulation of pollutants in the unsaturated zone is necessary.
With the development of computer technology, the use of numerical models for soil-moisture simulation and underground solute transport has become more prevalent [26]. These models include HYDRUS for the unsaturated zone and MODFLOW for the saturated zone. HYDRUS-2D is suitable for the two-dimensional finite-element modeling of motion and can be used to simulate the process of aqueous nitrogen transformation under different soil conditions [27]. Many researchers have used HYDRUS-2D to analyze the migration of moisture solute. Li et al. [28] used HYDRUS-2D to simulate surface-pollutant transport in the unsaturated zone, and then analyzed the effect of nitrates on riverwater quality. Their results showed that HYDRUS-2D provided a good description of solute transport in complex conditions. Morrissey et al. [29] used HYDRUS-2D to simulate the attenuation of contaminants through the unsaturated zone, and the results were subsequently used as inputs to MODFLOW. Their final verified simulation values provided good fits with field observations, indicating that HYDRUS-2D can provide accurate initial values for groundwater assessment. Baram et al. [30] combined the spatial variations in soil profiles within an almond orchard in California, and created a HYDRUS model to estimate large spatial and temporal variability in water flow and nitrate transport. Their results clearly showed the nitrogen decay process. Thus, it can be seen that the HYDRUS-2D model has been widely verified and used. The model was therefore adopted for performing the solute-migration simulations in this study.
Ensuring the accuracy of models of complex trinitrogen migration in soil can be difficult [31]. Further complexities can arise from the existence of lenses, which can cause local pollutant states to differ from the general situation and may lead to incorrect interpretations. The role of lenses has received little research attention.
The purpose of our study was to investigate the importance of the role of the unsaturated zone in groundwater-assessment work. We explored the migration and attenuation processes of nitrogen compounds in the unsaturated zone, evaluated the role of the protection provided by the unsaturated zone to aquifers, and studied pollution in the subclay lenses. The Richards equation and the convection dispersion equation were used in HYDRUS-2D for describing moisture and solute migration. The model was calibrated using long-term field observations. From the long-term (three years) observation-data verification, the effects of the lenses in the model were characterized, and the accuracy of the model was improved.

2. Materials and Methodology

2.1. Study-Area Setting and Model Generalizations

2.1.1. Study-Area Setting

The study area is a wastewater-discharge site located in a desert in northwest China. The region has a continental climate, which is arid and superarid. Precipitation is low and most of the year is dry. The annual precipitation from 1997 to 2014 ranged from 52 to 185 mm. Most precipitation occurs between June and September. The elevation of the study area varies from 1400 to 2500 m a.s.l. The terrain is generally flat, and is inclined from the southeast to the low-lying northwest with a slope of 3 to 6‰. There is no surface water in the region, and almost no vegetation or human activity.
Before the present research, there were no wells at the discharge site. Subsequently, three monitoring wells were established to identify pollutants and to determine the strata. The drilling logs revealed that the lithology is mainly comprised of silt and fine silt sand, which has relatively high permeability (6 to 13 m/day). In addition, subclay lenses are present in the east of the area. The thickness of the unsaturated zone is 13 m, with unconfined aquifers below.
A pollution incident occurred between May 2014 and March 2015. An enterprise continuously discharged 27,700 m3 of untreated production wastewater to the desert over a period of 270 days, forming a contaminated site with an area of about 100,000 m2. Sampling of the wastewater showed that ammonia nitrogen was the major pollutant with concentrations of 1730 mg/L. Before the pollution incident, groundwater was essentially in a natural state. Therefore, the impact of this incident on groundwater quality has become a focus of attention.

2.1.2. Study-Area Generalization

Based on local geological conditions, the hydrogeological conditions were generalized in the groundwater flow model as follows. Vertically, the surface was the upper boundary, and the saturated–unsaturated zone was the lower boundary. Horizontally, 3 km east and west of the wastewater pit were designated as zero-flux boundaries. Groundwater flow was assumed to be heterogeneous, isotropic, two-dimensional, and unstable along the profile. Both atmospheric precipitation and surface-water infiltration were generalized to zero, and soil-water evaporation and discharge to the river were also generalized to zero.
The solute transport model was generalized as follows. The pollution incident discharged a total of 27,700 m3 of wastewater to the research area in 270 days. The flow was assumed to be at a constant rate and continuous. Because of the complexity of pollutants, nitrogen concentrations are often used as indicators of groundwater quality risk [23,32,33]. The compounds NH4+, NO2, and NO3 can be adsorbed by the medium and are capable of undergoing transformation, and were therefore selected in the present study as characteristic pollutants. The concentration of NH4+ in wastewater was 1730 mg/L, while the background value of NH4+ in soil was 0 mg/L. Soil is a complex multiphase system. NH4+ in the pores of the soil is simultaneously subject to a variety of physical and chemical reactions. The migration and transformation processes are complex and changeable and cannot be quantitatively described [4]. To determine the macroscopic migration characteristics of pollutants more accurately and conveniently, the present study treated the migration of NH4+ in soil pores as a random process.

2.2. Mathematical Model and Numerical Modeling

2.2.1. Soil-Moisture Model

The influence of gas and the effect of temperature gradient were not considered during the movement of water. The two-dimensional flow motion in an unsaturated medium can be described by the Richards equation [24]:
θ ( h ) t = X i [ K ( h ) ( K i j A h X j + K i z A ) ] S * ( h )
where θ is the soil-volume moisture (L3/L3); h is the water head (m); K is the unsaturated hydraulic conductivity (L/T); Xi are spatial coordinates; t is time (day); and S* represents source and sink items.
The HYDRUS-2D software provides five models for the description of the hydraulic characteristics of soil. The van Genuchten–Mualem model [33] was used to calculate θ and K. The effect of hysteresis on water flow was not considered:
{ θ ( h ) = { θ r + θ s θ r ( 1 + | α h | n ) m θ s h > 0 , m = 1 1 n , n > 1 K ( h ) = K s S e l [ l ( 1 S e 1 / m ) n ] 2 S e = θ θ r θ s θ r
where θr is the residual moisture content (L3/L3) of the soil; θs is the saturated moisture content of the soil; α is the reciprocal of the intake value and the shape parameter of the water characteristic curve (cm−1); m is the water characteristic curve parameter; n is the pore-size distribution index, m = 1/n; l is the pore connectivity performance parameter of the soil mediums (generally taken as 0.5); and Se is effective saturation.

2.2.2. Soil Solute Transport Model

It was assumed that the attenuation of nitrogen conforms to the first-order decay and second-order attenuation-kinetics equations. The chain decay response is shown in Figure 1 [34].
The model assumes that the two processes of trinitrogen conversion occur independently: NH4+ is converted to NO2 by nitrosation, and NO2 is converted to NO3 by nitration. Then, the denitrification process produces gaseous nitrogen without generating NH4+ and NO2. The conversion process [35] is:
NH4+ ➝ NO2 ➝ NO3
To take into account the adsorption, nitrification, and denitrification of the nitrogen species studied (irrespective of root water absorption), the convection dispersion equation [36] was used:
{ ( θ c 1 ) t = z ( θ D L c 1 z ) z ( q c 1 ) ρ b ( ρ s k e c 1 ) t k 1 θ c 1 U 1 c 1 ( z , 0 ) = c 10 ( z ) 0 z L , t > 0 ( θ D L c z q c 1 ) = ε ( t ) c 0 z = 0 , t > 0 c 1 ( L , t ) = c 1 L z = L , t > 0
{ ( θ c i ) t = z ( θ D L c i z ) z ( q c i ) k i θ c i + k i 1 θ c i 1 U i i = 2 , 3 c i ( z , 0 ) = 0 0 z L , t = 0 c i ( 0 , t ) = c i 0 ( t ) z = 0 , t > 0 c i ( L , t ) = c i L z = L , t > 0
where θ is the unsaturated soil-volume moisture content (cm3/cm3); Cl is the NH4+ concentration in the aqueous solution of the unsaturated zone (mg/L); DL is the longitudinal dispersion coefficient (cm/day); ρb is soil-bulk density (mg/cm3); ρs is weight (mg/cm3); q is the Darcy flow rate (cm/day) of the soil moisture; ke is the adsorption and partition coefficient of NH4+ in soil (cm3/g); k1 and k2 are the nitration reaction rate constants of NH4+ and NO2, respectively (day−1); Ul is the crop absorption of NH4+ and Ui is the crop absorption of NO2 and NO3; C10(z) is the initial NH4+ concentration (mg/L) of the soil; C0 is the NH4+ concentration (mg/L) of the infiltration solution; C1L is the NH4+ concentration in the unconfined aquifer (mg/L); C2 and C3 are NO2 and NO3 concentrations (mg/L), respectively; k3 is the denitrification rate constant (d−1); C20(z) and C30(z) are the initial NO2 and NO3 concentrations, respectively, in soil (mg/L); and C2L and C3L are the NO2 and NO3 concentrations, respectively, in the unconfined aquifer (mg/L).
The strata in the study area are unsaturated and have high permeability. The significant characteristics of two-dimensional migration of the water flow and solute in the soil were generalized by a finite-element, two-dimensional, numerical model using HYDRUS-2D 2.04 [37,38,39]. Before the simulation, time and space must be discretized, and initial boundary conditions and parameters need to be verified.

2.2.3. Spatial and Temporal Discretizing

The Galerkin finite-element method [40] was applied to discretize the spatial–temporal model. Based on the boundary conditions and hydrodynamic conditions of the study area, the model was divided into 2490 nodes and 4806 triangular meshes throughout the simulation area (X: 300 m, Y: 13 m). The implicit-difference method was used to select the optimal step size for the model. The initial time step was 1 × 10⁻⁴ days, the minimum time step was 1 × 10⁻⁵ days, and the maximum time step was 5 days. Based on known nitrogen attenuation processes [41,42], the total time period for the simulation was set at 3650 days (10 years). The first 270 days were set as the sewage-discharge period. Three monitoring lines (AA’, BB’, CC’) were selected for observation. Grids and monitoring line locations are shown in Figure 2.

2.2.4. Initial Conditions and Boundary Conditions

Moisture movement is mainly in the vertical direction in the unsaturated zone. Therefore, a zero-flux boundary was selected as the lateral boundary of moisture movement. Because discharge had stopped, the pressure head boundary was selected as the upper boundary, and was set at –100 cm in the first 270 days, and –50 cm in the later period. The lower boundary of the model was generalized to a free-drainage boundary.
The lateral boundary of solute transport was consistent with the lateral boundary of water movement. The vertical boundary of solute transport was set as the third type of boundary (a concentration boundary). The concentration value was set to an average value obtained from the leaching test results of the soil samples. The concentration of NH4+ was 1730 mg/L. The lower boundary selected was the zero-concentration gradient boundary.
Based on the actual situation, the model assumed that the temperature, structure, and pore condition in media were constant during the wastewater-discharge period. The initial contents of NH4+, NO2, and NO3 in the unsaturated zone were all zero; the study area had not received any nitrogen source recharge before contamination.

2.3. Initial Setting of Parameters

The establishment of the model involved two categories of parameters: soil hydraulics and solute transport. Of the hydraulic parameters of the soil (θr, θs, α, n, Ks, and l), Ks was a measured value, and the other parameters were estimated using the Rosetta model and measured soil particle size ratio. The soil particle size ratio was obtained using a Rise-2008 Laser Particle Size Analyzer. The Ks values were measured using field tests [43,44].
The adsorption of trinitrogen is mainly linear. When the Kd value of the distribution coefficient is large, adsorption is facilitated and migration is made more difficult. The adsorption and distribution coefficients of NH4+ in silty soil were obtained from the literature [34,45]. A fine-grained sand map was calculated using the formula for the NH4+ adsorption-partition coefficient:
Kd = 1.34 + 0.083 CL
where Kd is the NH4+ adsorption-partition coefficient (cm3/mg); and CL is the clay content (%), which was determined based on loose-sediment classification nomenclature for the Quaternary.
Hydrodynamic dispersion is divided into mechanical dispersion and molecular diffusion. Under hydrodynamic dispersion groundwater-flow conditions, molecular diffusion is extremely weak. Therefore, mechanical diffusion dominates. Dispersion values used in the present study were obtained from previous research [24,46]. The soil-bulk density was determined by empirical values of different lithological soil densities. The isothermal adsorption coefficient and reaction-rate constant were taken from previous studies [47,48,49]. The software’s inversion procedures were used to determine the input values at different times and soil depths. The initial values of the parameters are shown in Table 1 and Table 2.
To ensure the accuracy of the model, calibration and validation of parameters is necessary.

2.4. Model Calibration and Validation

2.4.1. Data Sources

The trinitrogen concentrations in the groundwater at the interface between the saturated zone and unsaturated zone were selected to calibrate and verify the model for different times. Groundwater samples were sampled and measured twice a month from 15 June 2015 to 1 June 2018. There were two monitoring wells on the site, numbered #1 and #2. The measured pollutants were NH4+, NO2, and NO3. Three measuring methods were used: NH4+ was measured using Nessler’s reagent photometric method; NO2 was measured using UV spectrophotometry; and NO3 was measured using the N-(1-naphthyl)-diethylamine photometric method.

2.4.2. Calibration and Validation

Parameter adjustment was based on whether the simulated measured values fitted well. The data from Well #1 were used to calibrate the model, and the data from Well #2 were used to validate the model. Statistical methods were used to evaluate the applicability of the model. The adjusted parameters based on Well #1 data are shown in Table 1 and Table 2.
Using the adjusted parameters, we compared simulated values with Well #2 data for validation (Figure 3). The degree of fit was tested using mean absolute error (MAE), root mean square error (RMSE), deviation percentage (PBIAS), and Nash–Sutcliffe efficiency coefficient (NSE) [50]. In these tests,
MAE = i = 1 n | M i S i | n
RMSE = 1 n i = 1 n ( M i S i ) 2
PBIAS = i = 1 n ( M i S i ) × 100 i = 1 n M i
NSE = i = 1 n ( M i M i ¯ ) 2 i = 1 n ( M i S i ) 2 i = 1 n ( M i M i ¯ ) 2
Mi is the ith measured value; Si is the ith simulate value; M i ¯ is the mean measured value; and n is the total number of data. Good fits are given by PBIAS < ±10, MAE and RMSE far smaller than the measured average values, and an NSE close to 1.
The calculation results (Table 3) demonstrated that MAE and RMSE were smaller than the measured average values, PBIAS < ±10, and NSE was close to 1. Thus, the simulation results fitted well with the measured data. Therefore, the model can satisfactorily reflect the migration of trinitrogen in the unsaturated zone and can be used for further simulation.

3. Simulation Results

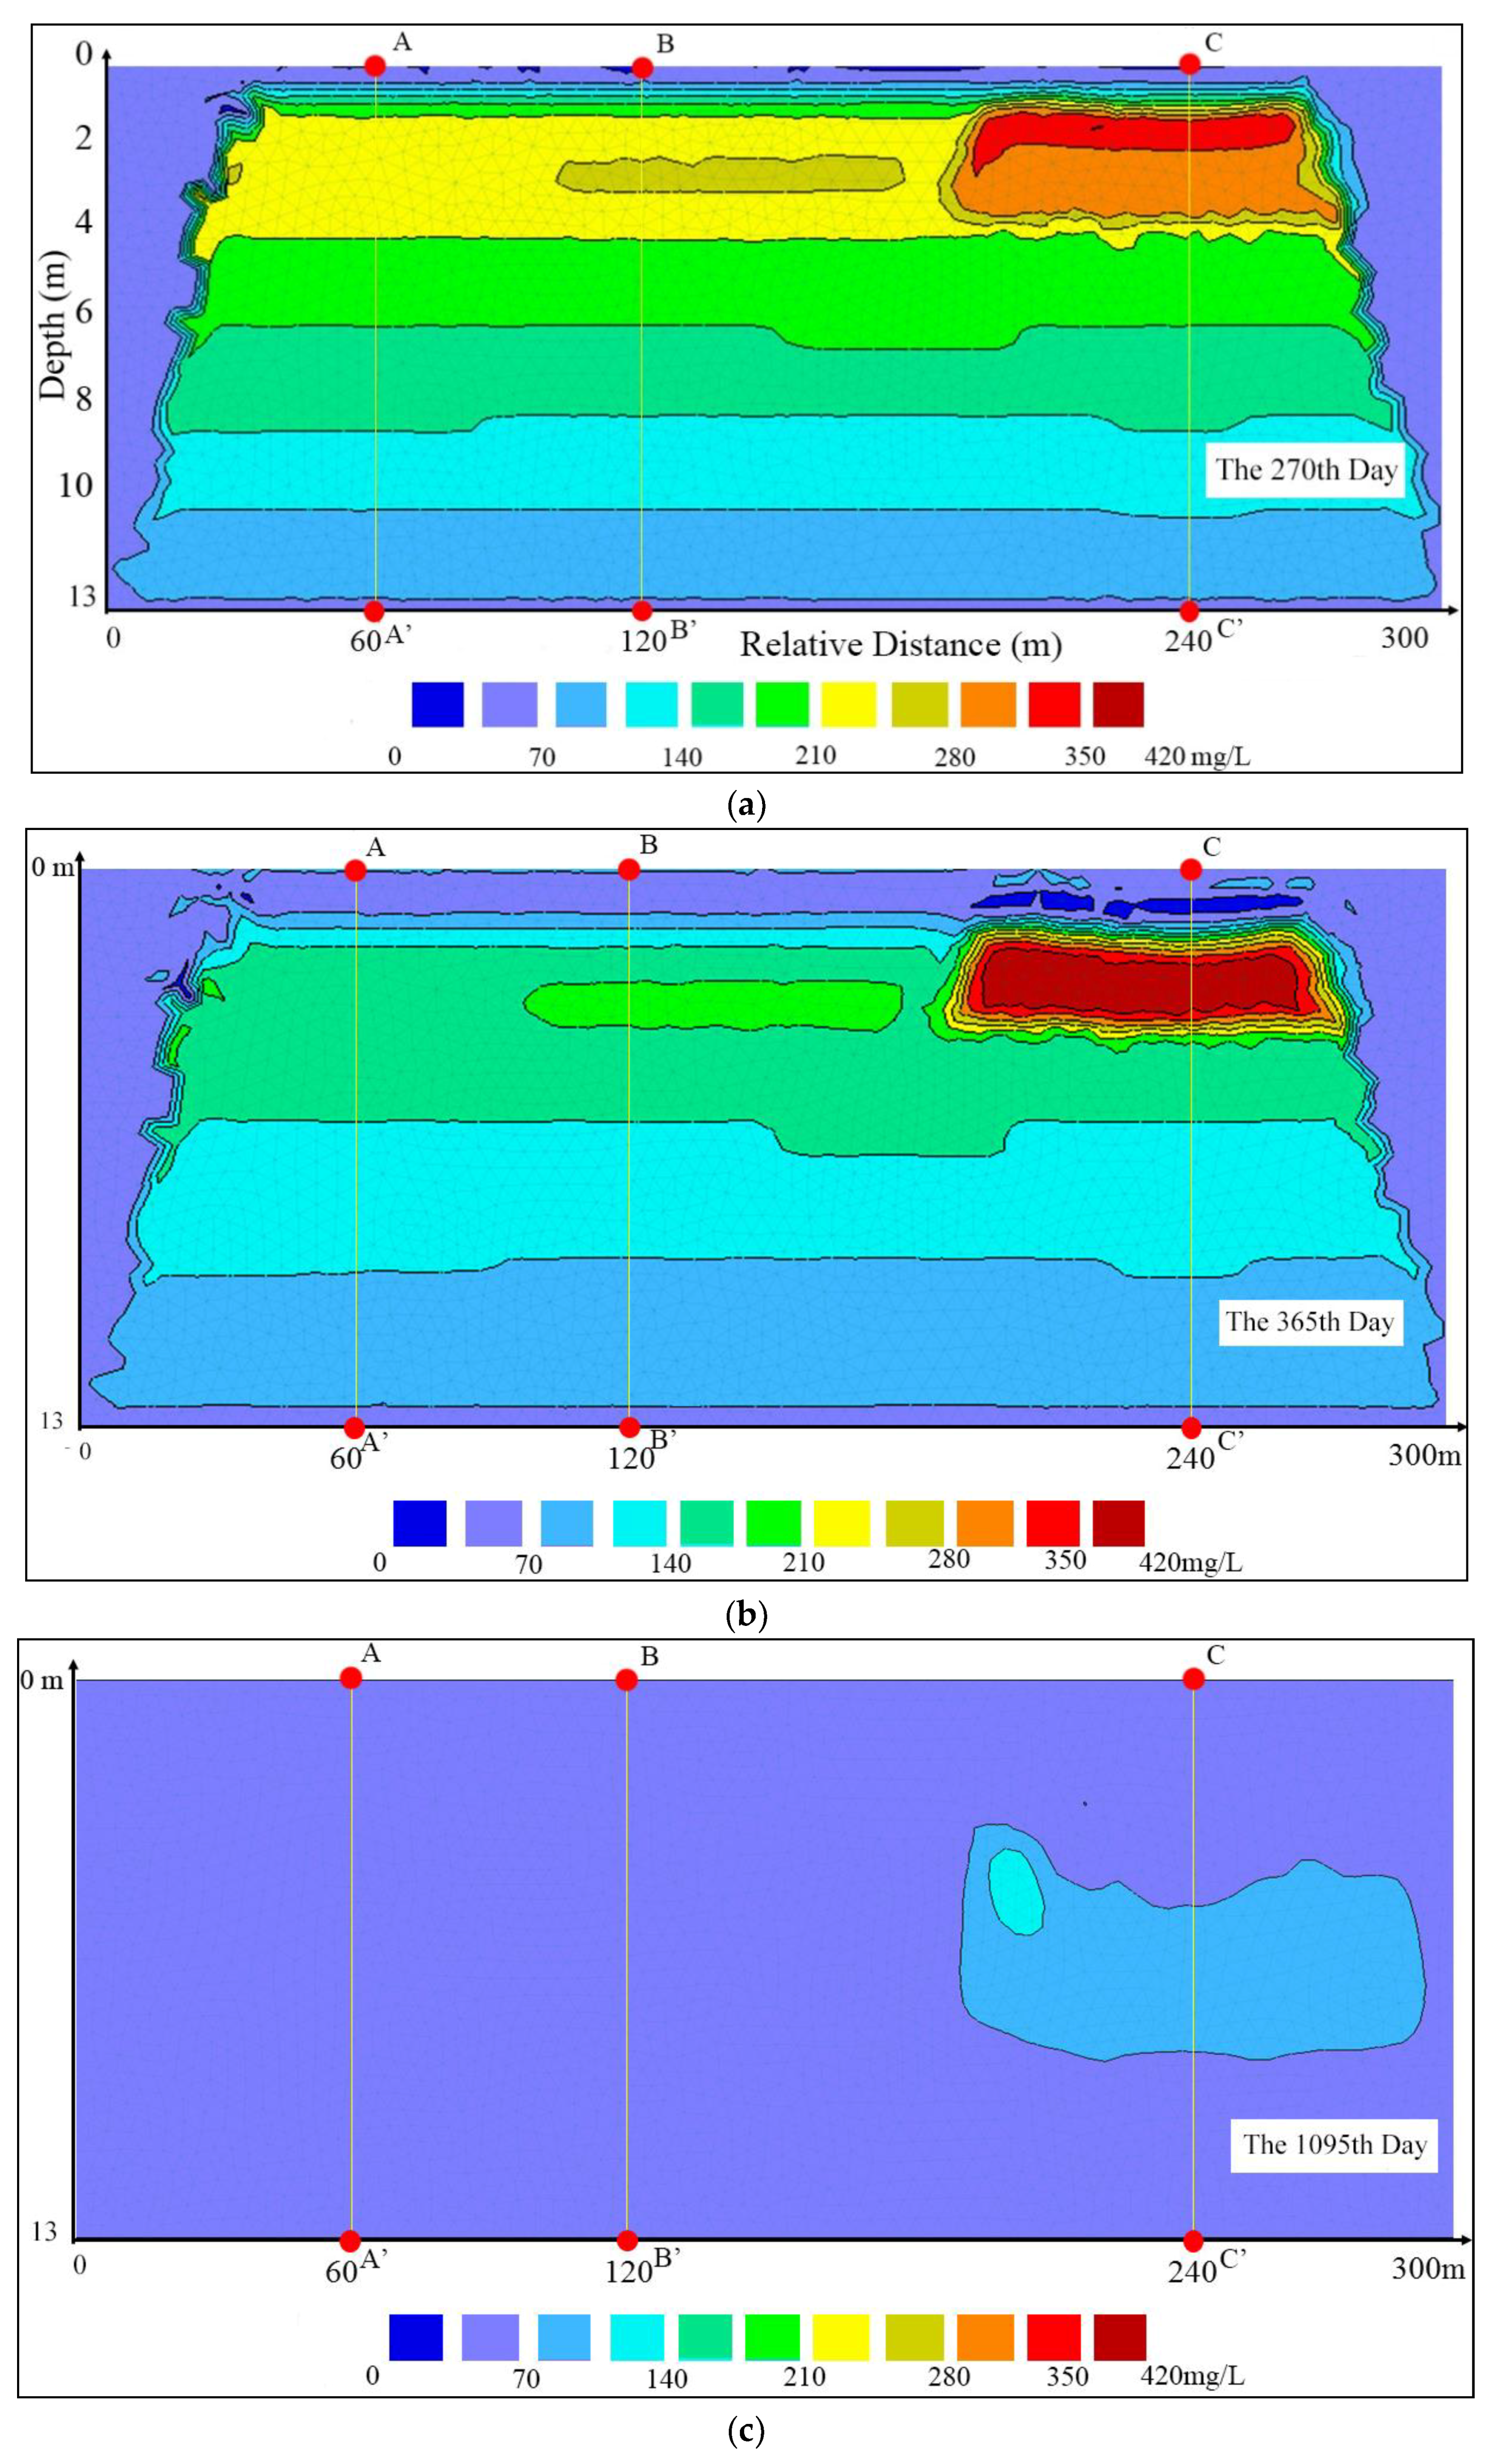
3.1. Vertical Changes in the Profile

Changes of NH4+ in the unsaturated zone profile are shown in Figure 4. In the horizontal direction, NH4+ concentrations were similar to the surrounding area where no subclay existed, and significantly higher than the surrounding area when subclay was present. In the vertical direction, the concentration of surface NH4+ was low after the sewage stopped (270 days), and no enrichment occurred. NH4+ concentration gradually decreased from top to bottom from 2.42 to 13 m where no subclay existed. NH4+ concentrations in the vertical profile were less than 300 mg/L after 1095 days.
Changes in NO2 are shown in Figure 5. In the horizontal direction, the concentration distribution was similar to that of NH4+ when subclay was not present. When subclay was present, the concentration of NO2 first increased and then decreased after 365 days. In the vertical direction, no enrichment occurred after discharge stopped (270 days). In the depth ranges of 2.5 to 13 m on the 270th day and 3.24 to 13 m on the 365th day, the concentration of NO2 gradually decreased with increasing depth, and was close to 9 mg/L at the bottom. At the same time, NO2 accumulated in, and passed through, the subclay layer. After 1095 days, the NO2 concentration was less than 70 mg/L throughout the profile.
The spatial–temporal changes in NO3 are shown in Figure 6. In the horizontal direction, concentration distribution was consistent throughout, rose rapidly before the 365th day, and then gradually decreased when subclay was not present. When subclay was present, NO3 concentrations remained at a relatively low level. There was no enrichment in the vertical direction, surface concentration was low, and distribution from the ground surface to the bottom was from high to low. After 1095 days, NO3 was mainly present at the bottom of the unsaturated zone, while concentration in other locations was less than 360 mg/L.

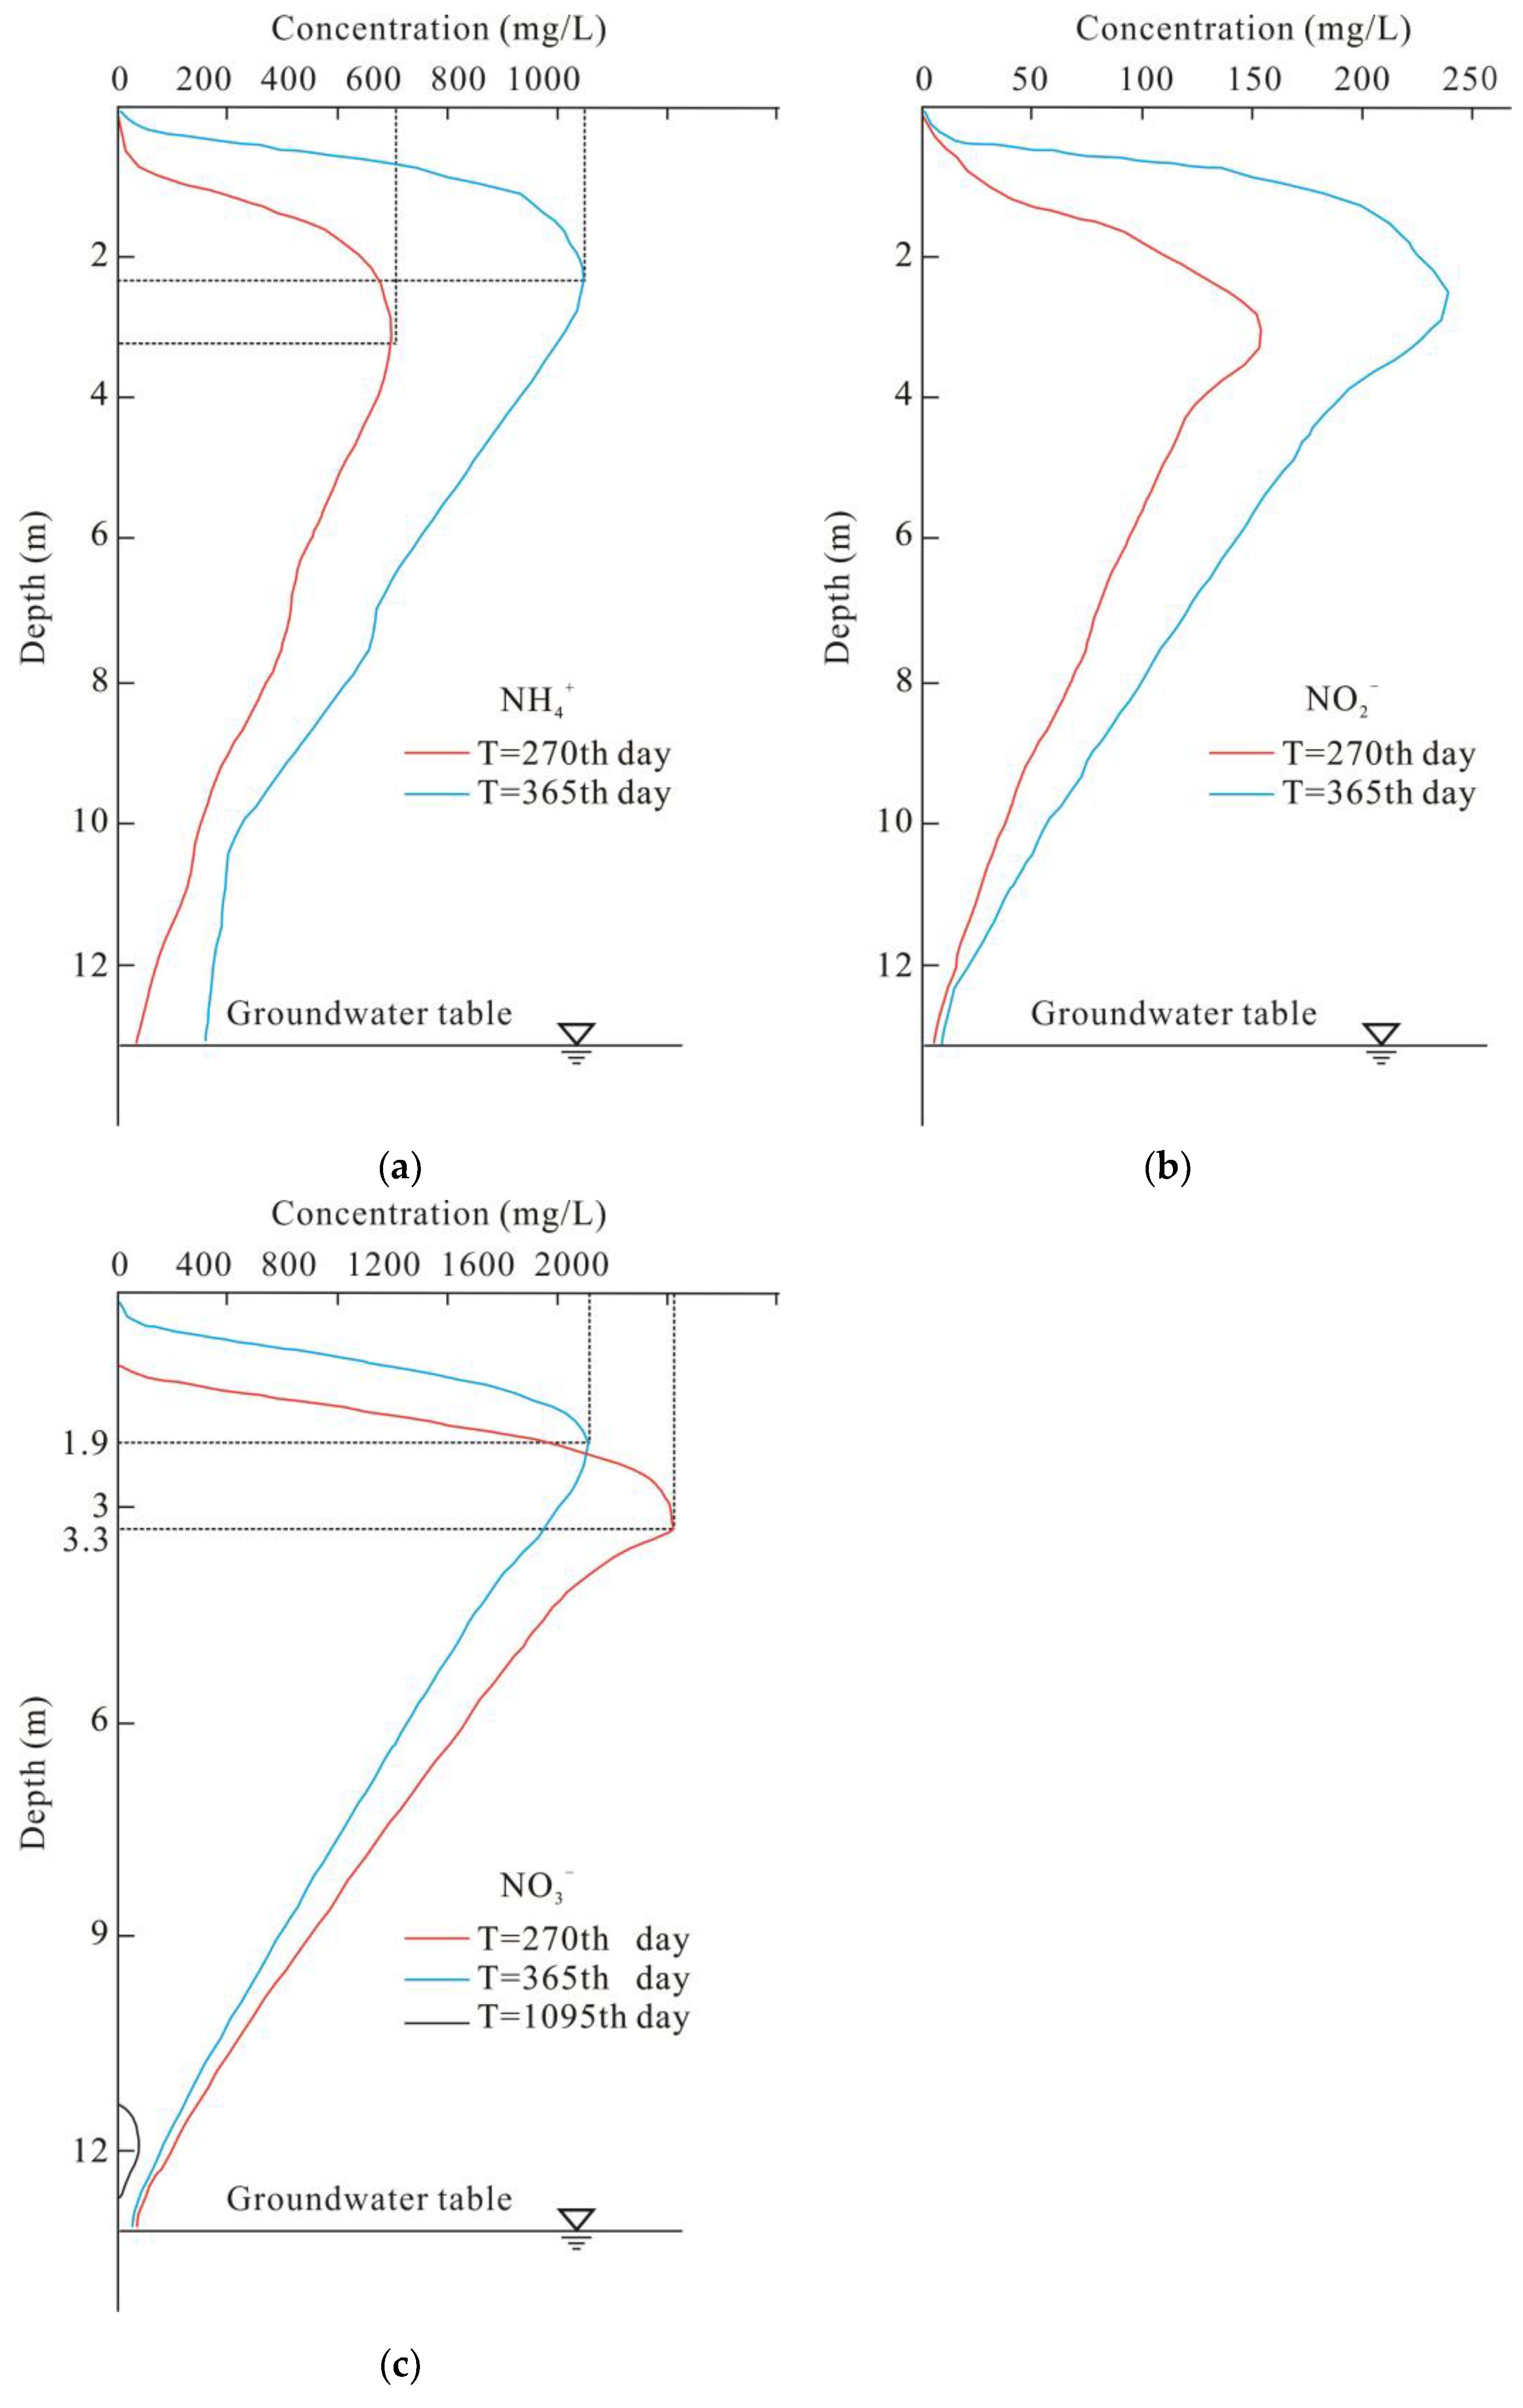
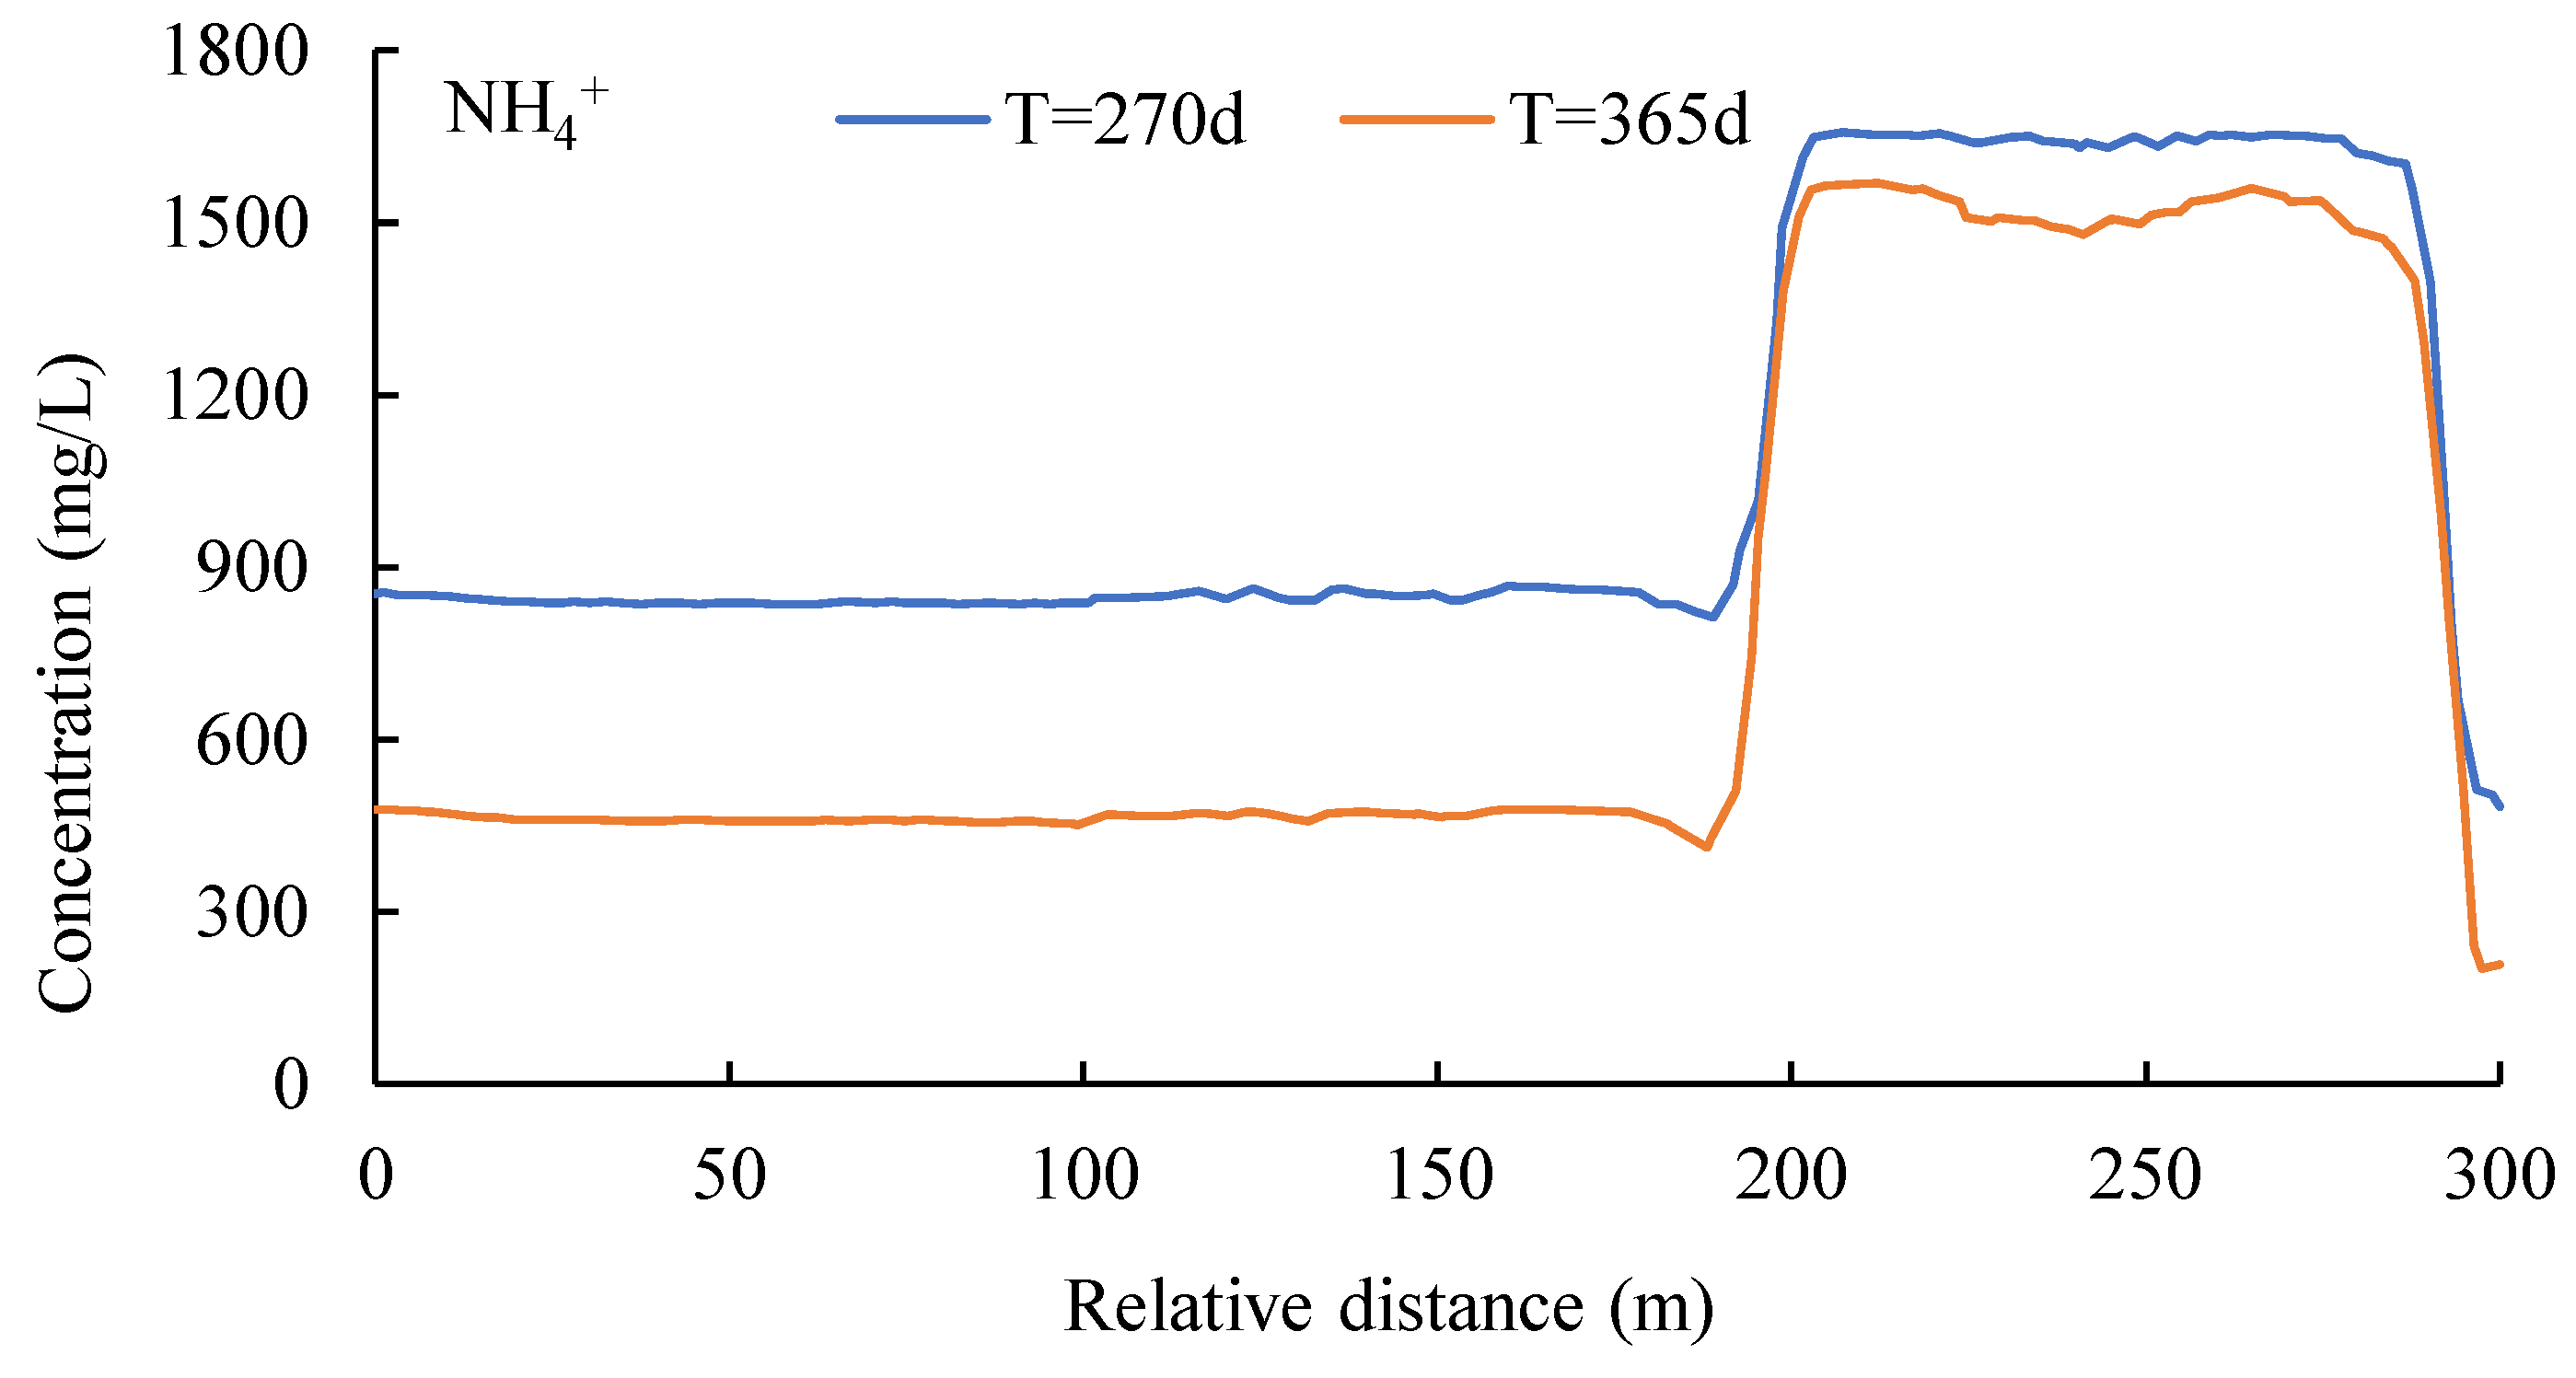
3.2. Detailed Vertical Changes

To simulate the vertical change of the pollutants in more detail, this model simulated trinitrogen concentrations at AA’, BB’, and CC’. Line CC’ passes through subclay lenses and will be discussed later. Similar simulation results were obtained for line AA’ and BB’, and representative conclusions could be drawn from either line. Because line AA’ was closer to the wastewater outlet, it was selected as the representative line for analysis. The results (Figure 7) show that there was a significant difference in the concentration of pollutants with depth. In the areas with no subclay, the concentration of pollutants rapidly increased with depth initially, and then slowly decreased. Over time, the NH4+ and NO2 concentrations gradually decreased at a given location, and peak concentrations continuously shifted downward. The peak concentration of NH4+ was 840 mg/L at a depth of 2.42 m on the 270th day, and 480 mg/L at a depth of 2.42 m on the 365th day. The peak concentration of NO2 was 240 mg/L at a depth of 2.5 m on the 270th day, and 160 mg/L at a depth of 3.24 m on the 365th day. In contrast, the concentration of NO3 on the 270th day was lower than that on the 365th day, with a concentration of 1700 mg/L at a depth of 1.9 m and 2010 mg/L at 3.3 m.

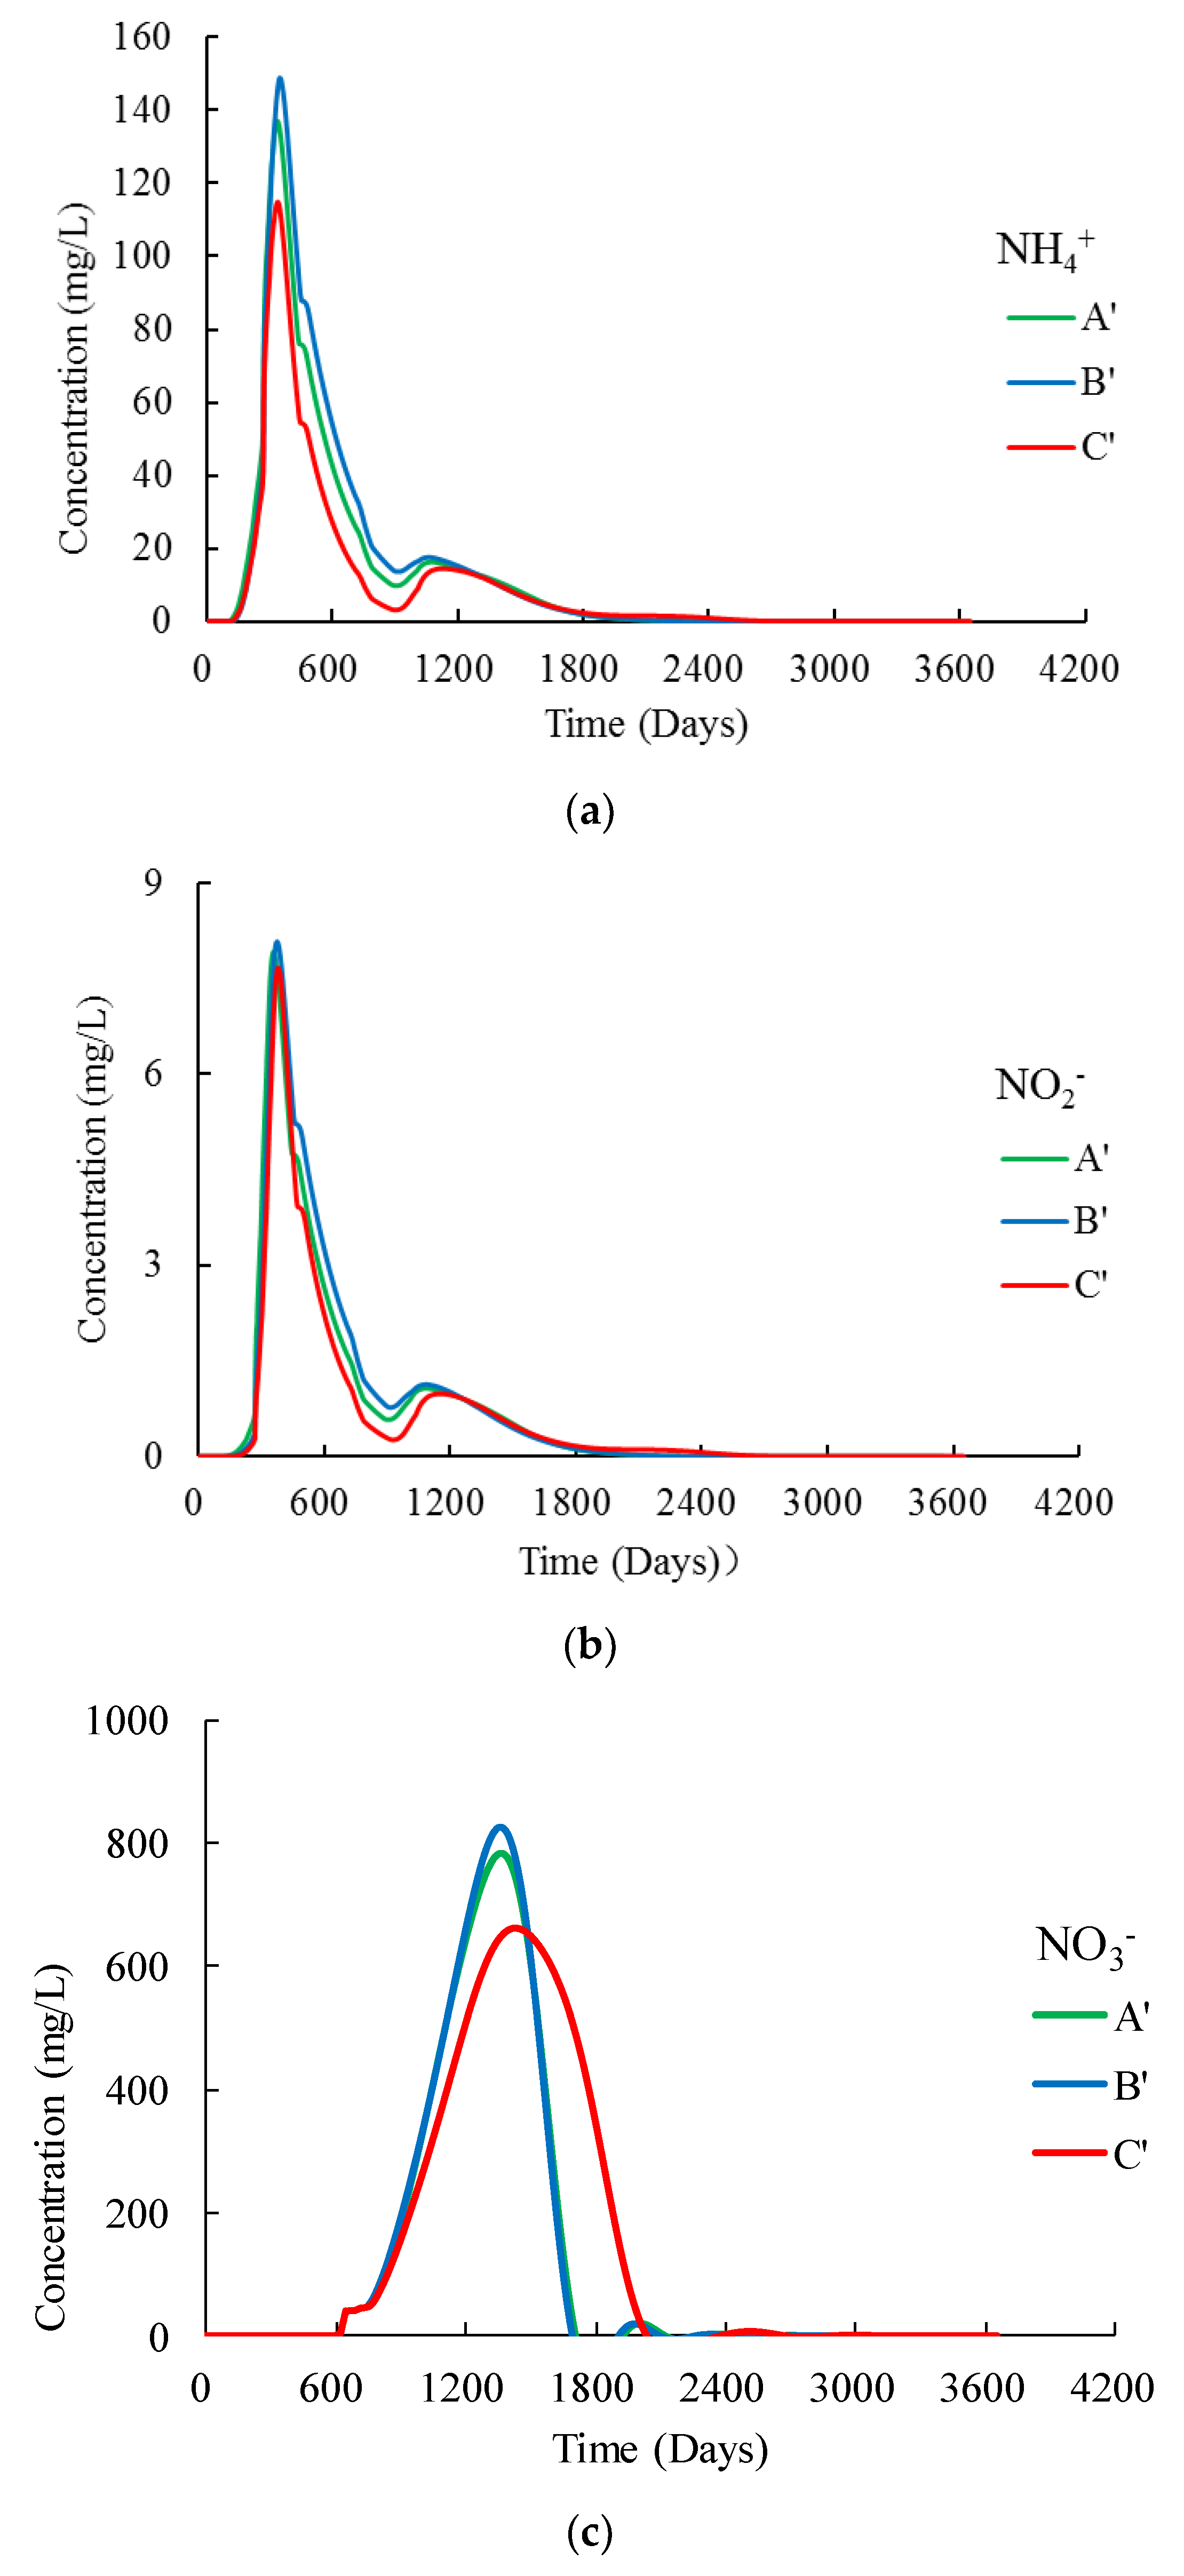
3.3. Nitrogen Concentrations at the Water Table

To estimate the transport of contaminants to the aquifer, contaminant concentrations at the water table were also simulated. The results (Figure 8) indicated that during the simulation period, the three trinitrogen species had a rising trend and then decreased. The highest NH4+, NO2, and NO3 concentrations in the aquifer were 148, 8.2, and 816 mg/L, respectively. The initial and peak occurrence of NO3+ was later than for the other two nitrogen species.

4. Discussion

4.1. Hysteresis of the Infiltration Process

The migration of pollutants is driven by a combination of water flow and solute concentration gradients [51]. During the first 270 days of pollutant discharge, the migration of pollutants was greatly affected by the head pressure, and the solute rapidly moved downward with the water flow. As a result, there was no enrichment on the surface, and a large amount of contaminants quickly accumulated in the shallow areas of the subsurface. When sewage discharge stopped, the migration of pollutants gradually changed from being driven by the head pressure to being driven by the solute concentration gradient. Because the driving force of the latter is much smaller than the former, pollutant migration is slow, leading to a slow decrease in concentration. At the beginning of the discharge period, because of the large pore spaces and the looseness of the unsaturated-zone media, pollutants spread rapidly. This resulted in significant increases in pollutant concentrations. The occurrence of peak concentration reflects the adsorption of pollutants by the soil, after which pollutant levels reached a steady state. After the discharge was stopped, the nitrogen source was cut off, and the concentration of pollutants gradually decreased.
Contaminants are attenuated without human intervention. The effects of microorganisms on pollutants play an important role during the adsorption processes [52]. Figure 8 shows that, for the water table, NO3 concentrations became very noticeable after 600 days and then continued rising, but lagged far behind NH4+ and NO2. An explanation of these trends is that nitrification under microbial catalysis requires a relatively long time period [53]. After NH4+ stopped being input to the unsaturated zone, nitrification also stopped because of insufficient reactants, and NO3 concentrations declined through natural degradation. However, changes in NO3 concentrations lagged behind changes in NH4+ and NO2.

4.2. Impacts of the Subclay Lenses

Mass transfer and reaction rates during transportation of solutes in porous media strongly depend on dispersion and diffusion [54]. This indicates that the extent of dispersion and diffusion processes may determine the behavior of pollutants. These processes are controlled by media characteristics such as soil type and hydraulic conductivity, which are important in the DRASTIC model. Unsaturated zones can control solute transport by affecting the size and structure of the media [55]. In the horizontal direction, at a depth of 2.34 m below the subsurface where sub-lay lenses were present, NH4+ concentrations increased rapidly (Figure 9). This implies that the fine subclay particles in the subclay lens promoted NH4+ enrichment [56]. The surface contained more soil colloids; the more negative charge the soil had, the stronger the adsorption was. The enrichment of NO2 was similar to that of NH4+. The NH4+ species had more time to undergo nitrification during the adsorption process in the subclay. At the same time, the second stage of the nitrification reaction was constrained because of the tight texture of the subclay and its low oxygen content. [57]. Consequently, NO2 could not be oxidized to NO3. Therefore, NO2 was enriched, whereas the concentration of NO3 was low. The enrichment of the subclay was significant. The peak concentration of the contaminant at point C’ was slightly lower than at A’ and B’, and the time to reach peak concentration was slightly delayed. However, this enrichment only occurred in the early stages (before the 365th day) of the simulation. In the long term, the contaminant is not prevented from passing through the lenses. After 1095 days, the amount of pollutants in the subclay lenses was essentially the same as in the surrounding medium.

4.3. Effectiveness of the Unsaturated Zone for Groundwater Protection

At the water table, the highest NH4+, NO2, and NO3 concentrations were 148, 8.2, and 816 mg/L, respectively. Because of the conservation of nitrogen [58] in ions, the peak concentration of pollutants at the groundwater surface was reduced by about 76% compared to that of the wastewater. NH4+ concentrations at the groundwater table did not form a stable infiltration value during the discharge of wastewater. One hundred days after the wastewater discharge was stopped, the NH4+ concentration in the groundwater reached a peak concentration of 148 mg/L. The unsaturated zone clearly plays a significant role in retarding pollution. Figure 8 shows that pollutant concentrations at the water table were close to 0 mg/L 3650 days after the wastewater discharge was stopped.
The simulation data for the water table show that the concentration of pollutants entering the aquifer was much lower than that of the original wastewater, and there were large differences in the types of pollutants. Moreover, there was a clear time lag, which proves that the unsaturated zone provides good protection for the aquifer. The results also indicated that contaminants changed with depth to the water table (Figure 7), soil type, and hydraulic conductivity (Figure 8), which are all important parameters in the DRASTIC model. Overall, the effects on the aquifer of wastewater discharge containing nitrogen are controllable. It is therefore feasible to use natural decay methods to rehabilitate groundwater.

5. Conclusions

(1) HYDRUS-2D is suitable for the simulation of pollutant transport in unsaturated zones. The model was successfully used to simulate trinitrogen migration and conversion in a relatively ideal geological unit at a contaminated site located in northwest China. Three years of field experiments (2015–2018) were conducted to obtain contaminant-concentration data (NH4+, NO2, and NO3). The model was well-calibrated and validated using long-term field-monitoring data and statistical methods. The model provided simulated results for moisture migration, solute transport, and trinitrogen conversion that were in good agreement with the observation data from Wells #1 and #2 for 2015–2018. The model simulations were a good fit with the monitored values. The HYDRUS-2D model was used to assess the risks of trinitrogen pollution to the underlying aquifer.
(2) Contaminants underwent nitrification in the unsaturated zone and were degraded to some extent. Simulated results indicated that concentration of pollutants dropped rapidly overall after wastewater discharge was stopped, and decreased to a low level after 1095 days. Under conditions of large surface pressure, wastewater infiltration was rapid, and the high hydraulic gradient prevented enrichment in the subsurface. NH4+ and NO2 concentrations peaked in the 270th day with maximum concentrations of 840 and 480 mg/L, respectively. The concentration of NO3 peaked on the 365th day with a maximum concentration of 2010 mg/L. Because of the nitrification process, the NO3 peak concentration appeared later than those for NH4+ and NO2.
(3) Differences in pollutant concentrations inside and outside the subclay lenses indicate that the DRASTIC parameters (such as soil type and hydraulic conductivity) have substantial impact on the migration and conversion of pollutants. The subclay lenses play an important role in the enrichment of pollutants. However, the lenses cannot prevent the passage of the pollutants. In the subclay lenses, the NH4+ and NO2 concentrations were significantly higher than elsewhere, while NO3 concentration was significantly lower. Because of the lack of oxygen inside the lenses, the second stage of the nitrification reaction is limited, and NO2 oxidization to NO3 is limited.
(4) The unsaturated zone provides good protection for groundwater. In general, pollutant concentrations at the water table peaked 100 days after the discharge stopped, and nitrogen concentration was reduced by 76% compared with the pollution source. The existence of the unsaturated zone contributes to delaying contaminants entering the aquifer by hysteresis and degradation. Thus, the unsaturated zone should be considered in the assessment of groundwater-pollution risk.

Author Contributions

Conceptualization, Y.Z. and M.X.; methodology; Y.Z.; software, Z.Y.; validation, X.X., Q.D., and R.Z.; formal analysis, J.W.; investigation, Y.T.; resources, M.X.; data curation, F.Z.; writing—original draft preparation, F.Z.; writing—review and editing, Y.Z.; visualization, Y.Z.; supervision, Y.Z.; project administration, M.X.; funding acquisition, Y.Z.

Funding

This work was supported by the Opening Fund of State Key Laboratory of Geohazard Prevention and Geoenvironment Protection (Chengdu University of Technology) (SKLGP2017K024), and the National Natural Science Foundation of China (No. 41877174).

Acknowledgments

The authors thank J.Z., X.Z., and T.G. for their assistance with the field work. In addition, we thank Paul Seward, PhD, from Liwen Bianji, Edanz Group China (www.liwenbianji.cn/ac), for editing the English text of a draft of this manuscript.

Conflicts of Interest

The authors declare no conflict of interest.

References

  1. Duan, W.; Takara, K.; He, B.; Luo, P.; Nover, D.; Yamashiki, Y. Spatial and temporal trends in estimates of nutrient and suspended sediment loads in the Ishikari River, Japan, 1985 to 2010. Sci. Total Environ. 2013, 461, 499–508. [Google Scholar] [CrossRef] [PubMed]
  2. Duan, W.; He, B.; Nover, D.; Yang, G.; Chen, W.; Meng, H.; Zou, S.; Liu, C. Water quality assessment and pollution source identification of the eastern Poyang Lake basin using multivariate statistical methods. Sustainability 2016, 8, 133. [Google Scholar] [CrossRef]
  3. Mao, X.; Jiang, R.; Xiao, W.; Yu, J. Use of surfactants for the remediation of contaminated soils: A review. J. Hazard. Mater. 2015, 285, 419–435. [Google Scholar] [CrossRef] [PubMed]
  4. Du, Q.; Yin, Z.; Zuo, R.; Wang, J.; Yang, J.; Teng, Y.; Zhai, Y. Migration process simulation of ammonia nitrogen in contaminated site. Chin. Environ. Sci. 2017, 37, 4585–4595. [Google Scholar]
  5. Lai, L.; Zhou, H.; Lai, B. Heterogeneous degradation of bisphenol A by peroxymonosulfate activated with vanadium-titanium magnetite: Performance, transformation pathways and mechanism. Chem. Eng. J. 2018, 349, 633–645. [Google Scholar] [CrossRef]
  6. Li, J.; Xu, M.; Yao, G.; Bo, L. Enhancement of the degradation of atrazine through CoFe2O4 activated peroxymonosulfate (PMS) process: Kinetic, degradation intermediates, and toxicity evaluation. Chem. Eng. J. 2018, 348, 1012–1024. [Google Scholar] [CrossRef]
  7. Azizian, M.; Boano, F.; Cook, P.L.M.; Detwiler, R.L.; Rippy, M.A.; Grant, S.B. Ambient groundwater flow diminishes nitrate processing in the hyporheic zone of streams. Water Resour. Res. 2017, 53, 3941–3967. [Google Scholar] [CrossRef]
  8. Du, Y.; Ma, T.; Deng, Y.M.; Shen, S.; Lu, Z.J. Sources and fate of high levels of ammonium in surface water and shallow groundwater of the Jianghan Plain, Central China. Environ. Sci.-Process. Impacts 2017, 19, 161–172. [Google Scholar] [CrossRef] [PubMed]
  9. Pasten-Zapata, E.; Ledesma-Ruiz, R.; Harter, T.; Ramirez, A.I.; Mahlknecht, J. Assessment of sources and fate of nitrate in shallow groundwater of an agricultural area by using a multi-tracer approach. Sci. Total Environ. 2014, 470, 855–864. [Google Scholar] [CrossRef] [PubMed]
  10. Boningari, T.; Smirniotis, P.G. Impact of nitrogen oxides on the environment and human health: Mn-based materials for the NOx abatement. Curr. Opin. Chem. Eng. 2016, 13, 133–141. [Google Scholar] [CrossRef]
  11. Cao, S.J.; Kong, X.R.; Li, L.Y.; Zhang, W.R.; Ye, Z.P.; Deng, Y.L. An investigation of the PM2.5 and NO2 concentrations and their human health impacts in the metro subway system of Suzhou, China. Environ. Sci.-Process. Impacts 2017, 19, 666–675. [Google Scholar] [CrossRef] [PubMed]
  12. Boufekane, A.; Saighi, O. Application of Groundwater Vulnerability Overlay and Index Methods to the Jijel Plain Area (Algeria). Groundwater 2018, 56, 143–156. [Google Scholar] [CrossRef] [PubMed]
  13. Khosravi, K.; Sartaj, M.; Tsai, F.T.C.; Singh, V.P.; Kazakis, N.; Melesse, A.M.; Prakash, I.; Bui, D.T.; Binh, T.P. A comparison study of DRASTIC methods with various objective methods for groundwater vulnerability assessment. Sci. Total Environ. 2018, 642, 1032–1049. [Google Scholar] [CrossRef] [PubMed]
  14. Coban, O.; Kuschk, P.; Kappelmeyer, U.; Spott, O.; Martienssen, M.; Jetten, M.S.M.; Knoeller, K. Nitrogen transforming community in a horizontal subsurface-flow constructed wetland. Water Res. 2015, 74, 203–212. [Google Scholar] [CrossRef] [PubMed]
  15. Yao, Y.Y.; Zheng, C.M.; Liu, J.; Cao, G.L.; Xiao, H.L.; Li, H.T.; Li, W.P. Conceptual and numerical models for groundwater flow in an arid inland river basin. Hydrol. Process. 2015, 29, 1480–1492. [Google Scholar] [CrossRef]
  16. Zhang, C.; Ma, L.; Zhang, S.; Li, Z.; Yin, M.; Zang, Y. The Application of Visual Modflow to the Simulation of Groundwater Nitrate Contamination in Shijiazhuang. Acta Geosci. Sin. 2007, 28, 561–566. [Google Scholar]
  17. Twarakavi, N.K.C.; Simunek, J.; Seo, S. Evaluating interactions between groundwater and vadose zone using the HYDRUS-based flow package for MODFLOW. Vadose Zone J. 2008, 7, 757–768. [Google Scholar] [CrossRef]
  18. Ding, Y.; Liu, Y.X.; Wu, W.X.; Shi, D.Z.; Yang, M.; Zhong, Z.K. Evaluation of biochar effects on nitrogen retention and leaching in multi-layered soil columns. Water Air Soil Pollut. 2010, 213, 47–55. [Google Scholar] [CrossRef]
  19. Rochette, P.; Angers, D.A.; Chantigny, M.H.; Gasser, M.O.; MacDonald, J.D.; Pelster, D.E.; Bertrand, N. Ammonia volatilization and nitrogen retention: How deep to incorporate urea? J. Environ. Qual. 2013, 42, 1635–1642. [Google Scholar] [CrossRef] [PubMed]
  20. Vijayaraghavan, K.; Yun, Y.S. Bacterial biosorbents and biosorption. Biotechnol. Adv. 2008, 26, 266–291. [Google Scholar] [CrossRef] [PubMed]
  21. Pavlidis, G.; Tsihrintzis, V.A. Environmental Benefits and Control of Pollution to Surface Water and Groundwater by Agroforestry Systems: A. Review. Water Resour. Manag. 2018, 32, 1–29. [Google Scholar] [CrossRef]
  22. Izbicki, J.A.; Flint, A.L.; O’Leary, D.R.; Nishikawa, T.; Martin, P.; Johnson, R.D.; Clark, D.A. Storage and mobilization of natural and septic nitrate in thick unsaturated zones, California. J. Hydrol. 2015, 524, 147–165. [Google Scholar] [CrossRef]
  23. Lima, M.L.; Romanelli, A.; Massone, H.E. Assessing groundwater pollution hazard changes under different socio-economic and environmental scenarios in an agricultural watershed. Sci. Total Environ. 2015, 530, 333–346. [Google Scholar] [CrossRef] [PubMed]
  24. Rebolledo, B.; Gil, A.; Flotats, X.; Sanchez, J.A. Assessment of groundwater vulnerability to nitrates from agricultural sources using a GIS-compatible logic multicriteria model. J. Environ. Manag. 2016, 171, 70–80. [Google Scholar] [CrossRef] [PubMed] [Green Version]
  25. Shrestha, S.; Semkuyu, D.J.; Pandey, V.P. Assessment of groundwater vulnerability and risk to pollution in Kathmandu Valley, Nepal. Sci. Total Environ. 2016, 556, 23–35. [Google Scholar] [CrossRef] [PubMed]
  26. Yin, Z.; Du, Q.; Zhai, Y.; Yang, J.; Guo, Y.; Zuo, R. Simulation and prediction of leakage incident on migration and transformation of three nitrogens based on HYDRUS-2D software. Environ. Pollut. Control 2017, 39, 1071–1076. [Google Scholar]
  27. Simunek, J.; van Genuchten, M.T.; Sejna, M. Recent developments and applications of the Hydrus computer software packages. Vadose Zone J. 2016, 15. [Google Scholar] [CrossRef]
  28. Li, Y.; Simunek, J.; Zhang, Z.; Huang, M.; Ni, L.; Zhu, L.; Hua, J.; Chen, Y. Water flow and nitrate transport through a lakeshore with different revetment materials. J. Hydrol. 2015, 520, 123–133. [Google Scholar] [CrossRef] [Green Version]
  29. Morrissey, P.J.; Johnston, P.M.; Gill, L.W. The impact of on-site wastewater from high density cluster developments on groundwater quality. J. Contam. Hydrol. 2015, 182, 36–50. [Google Scholar] [CrossRef] [PubMed]
  30. Baram, S.; Couvreur, V.; Harter, T.; Read, M.; Brown, P.H.; Kandelous, M.; Smart, D.R.; Hopmans, J.W. Estimating Nitrate Leaching to Groundwater from Orchards: Comparing Crop Nitrogen Excess, Deep Vadose Zone Data-Driven Estimates, and HYDRUS Modeling. Vadose Zone J. 2016, 15, 13. [Google Scholar] [CrossRef]
  31. Kazakis, N.; Voudouris, K.S. Groundwater vulnerability and pollution risk assessment of porous aquifers to nitrate: Modifying the DRASTIC method using quantitative parameters. J. Hydrol. 2015, 525, 13–25. [Google Scholar] [CrossRef]
  32. Tran, N.H.; Gin, K.Y.-H.; Ngo, H.H. Fecal pollution source tracking toolbox for identification, evaluation and characterization of fecal contamination in receiving urban surface waters and groundwater. Sci. Total Environ. 2015, 538, 38–57. [Google Scholar] [CrossRef] [PubMed]
  33. Van Genuchten, M.T. A closed-form equation for predicting the hydraulic conductivity of unsaturated soils. Soil Sci. Soc. Am. J. 1980, 44, 892–898. [Google Scholar] [CrossRef]
  34. Hanson, B.R.; Simunek, J.; Hopmans, J.W. Evaluation of urea-ammonium-nitrate fertigation with drip irrigation using numerical modeling. Agric. Water Manag. 2006, 86, 102–113. [Google Scholar] [CrossRef]
  35. Sopilniak, A.; Elkayam, R.; Lev, O. Nitrification in a soil-aquifer treatment system: Comparison of potential nitrification and concentration profiles in the vadose zone. Environ. Sci.-Process. Impacts 2017, 19, 1571–1582. [Google Scholar] [CrossRef] [PubMed]
  36. Guo, R.; Feng, Q.; Si, J.H.; Chang, Z.Q.; Xi, H.Y.; Liu, W. Progress in the study of models for water and salinity transport in soils. J. Glaciol. Geocryol. 2008, 30, 527–534. [Google Scholar]
  37. Elmaloglou, S.; Soulis, K.X.; Dercas, N. Simulation of Soil Water Dynamics under Surface Drip Irrigation from Equidistant Line Sources. Water Resour. Manag. 2013, 27, 4131–4148. [Google Scholar] [CrossRef]
  38. Phogat, V.; Potter, N.J.; Cox, J.W.; Simunek, J. Long-Term Quantification of Stream-Aquifer Exchange in a Variably-Saturated Heterogeneous Environment. Water Resour. Manag. 2017, 31, 4353–4366. [Google Scholar] [CrossRef] [Green Version]
  39. Mo’allim, A.A.; Kamal, M.R.; Muhammed, H.H.; Yahaya, N.K.E.M.; Zawawe, M.A.B.M.; Man, H.B.C.; Wayayok, A. An Assessment of the Vertical Movement of Water in a Flooded Paddy Rice Field Experiment Using Hydrus-1D. Water 2018, 10, 783. [Google Scholar] [CrossRef]
  40. De Maet, T.; Hanert, E.; Vanclooster, M. A fully-explicit discontinuous Galerkin hydrodynamic model for variably-saturated porous media. J. Hydrodyn. 2014, 26, 594–607. [Google Scholar] [CrossRef]
  41. Li, J.; Zhao, R.; Li, Y. Simulation of water and solute transport characteristics in different bioretention tanks using HYDRUS-1D model. Acta Sci. Circums. 2017, 37, 4150–4159. [Google Scholar]
  42. Li, J.; Zhao, R.; Li, Y.; Chen, L. Modeling the effects of parameter optimization on three bioretention tanks using the HYDRUS-1D model. J. Environ. Manag. 2018, 217, 38–46. [Google Scholar] [CrossRef] [PubMed]
  43. Chapuis, R.P.; Chenaf, D. Effects of monitoring and pumping well pipe capacities during pumping tests in confined aquifers. Can. Geotech. J. 2003, 40, 1093–1103. [Google Scholar] [CrossRef]
  44. Ou, C.-Y.; Chen, S.-H. Performance and analysis of pumping tests in a gravel formation. Bull. Eng. Geol. Environ. 2010, 69, 1–12. [Google Scholar] [CrossRef]
  45. Salazar, O.; Wesstrom, I.; Youssef, M.A.; Skaggs, R.W.; Joel, A. Evaluation of the DRAINMOD-N II model for predicting nitrogen losses in a loamy sand under cultivation in south-east Sweden. Agric. Water Manag. 2009, 96, 267–281. [Google Scholar] [CrossRef]
  46. Pickens, J.F.; Grisak, G.E. Scale-dependent dispersion in a stratified granular aquifer. Water Resour. Res. 1981, 17, 1191–1211. [Google Scholar] [CrossRef]
  47. Chen, J.; Chen, X.; Wang, T. Isotopes tracer research of wet sand layer water sources in Alxa Desert. Adv. Water Sci. 2014, 25, 196–206. [Google Scholar]
  48. Ma, J.; Li, X.; Huang, T.; Edmunds, W.M. Chemical evolution and recharge characteristics of water resources in the Shiyang River Basin. Resour. Sci. 2005, 27, 117–122. [Google Scholar]
  49. Ding, Z.; Ma, J.; Zhang, B.; Zhao, X. Analysis on the climate change in the Shiyang River basin since resent 50 years. Arid Zone Res. 2007, 24, 779–784. [Google Scholar]
  50. Fan, Y.; Zhao, T.; Bai, G.; Liu, W. HYDRUS-2D simulation of soil wetting pattern with horizontal moistube-irrigation and analysis of its influencing factors. Trans. Chin. Soc. Agric. Eng. 2018, 34, 115–124. [Google Scholar]
  51. Luo, Y.; Xu, L.; Rysz, M.; Wang, Y.; Zhang, H.; Alvarez, P.J.J. Occurrence and transport of tetracycline, sulfonamide, quinolone, and macrolide antibiotics in the Haihe River Basin, China. Environ. Sci. Technol. 2011, 45, 1827–1833. [Google Scholar] [CrossRef] [PubMed]
  52. Hilscher, A.; Knicker, H. Carbon and nitrogen degradation on molecular scale of grass-derived pyrogenic organic material during 28 months of incubation in soil. Soil Biol. Biochem. 2011, 43, 261–270. [Google Scholar] [CrossRef] [Green Version]
  53. Zuo, R.; Jin, S.; Chen, M.; Guan, X.; Wang, J.; Zhai, Y.; Teng, Y.; Guo, X. In-situ study of migration and transformation of nitrogen in groundwater based on continuous observations at a contaminated desert site. J. Contam. Hydrol. 2018. [Google Scholar] [CrossRef] [PubMed]
  54. Chiogna, G.; Eberhardt, C.; Grathwohl, P.; Cirpka, O.A.; Rolle, M. Evidence of Compound-Dependent Hydrodynamic and Mechanical Transverse Dispersion by Multitracer Laboratory Experiments. Environ. Sci. Technol. 2010, 44, 688–693. [Google Scholar] [CrossRef] [PubMed]
  55. Bhatnagar, A.; Kumar, E.; Sillanpaa, M. Fluoride removal from water by adsorption—A review. Chem. Eng. J. 2011, 171, 811–840. [Google Scholar] [CrossRef]
  56. Sprenger, M.; Seeger, S.; Blume, T.; Weiler, M. Travel times in the vadose zone: Variability in space and time. Water Resour. Res. 2016, 52, 5727–5754. [Google Scholar] [CrossRef] [Green Version]
  57. Van Hulle, S.W.H.; Vandeweyer, H.J.P.; Meesschaert, B.D.; Vanrolleghem, P.A.; Dejans, P.; Dumoulin, A. Engineering aspects and practical application of autotrophic nitrogen removal from nitrogen rich streams. Chem. Eng. J. 2010, 162, 1–20. [Google Scholar] [CrossRef]
  58. Djaman, K.; Mel, V.C.; Diop, L.; Sow, A.; El-Namaky, R.; Manneh, B.; Saito, K.; Futakuchi, K.; Irmak, S. Effects of Alternate Wetting and Drying Irrigation Regime and Nitrogen Fertilizer on Yield and Nitrogen Use Efficiency of Irrigated Rice in the Sahel. Water 2018, 10, 711. [Google Scholar] [CrossRef]
Figure 1. Expression of trinitrogen chain reaction.
Water 10 01363 g001
Figure 2. Profile of lithology, grids, and monitoring lines.
Water 10 01363 g002
Figure 3. Model validation: simulated versus monitored values for (a) NH4+; (b) NO2; and (c) NO3.
Water 10 01363 g003
Figure 4. NH4+ distribution after (a) 270 days; (b) 365 days; and (c) 1095 days.
Water 10 01363 g004aWater 10 01363 g004b
Figure 5. NO2 distribution after (a) 270 days; (b) 365 days; and (c) 1095 days.
Water 10 01363 g005
Figure 6. NO3 distribution after (a) 270 days; (b) 365 days; and (c) 1095 days.
Water 10 01363 g006aWater 10 01363 g006b
Figure 7. Vertical changes along line AA’ of (a) NH4+; (b) NO2; and (c) NO3.
Water 10 01363 g007
Figure 8. Temporal changes after the termination of sewage discharge for (a) NH4+; (b) NO2; and (c) NO3.
Water 10 01363 g008
Figure 9. Horizontal distribution of NH4+ at the 2.34 m depth below ground surface.
Water 10 01363 g009
Table 1. Soil-moisture parameters.
Parameterθr θ s αnKsl
Unitcm3/cm3cm3/cm3m−1/cm/day/
Initial values
Silt0.0760.470.0161.613000.5
Fine powder sand0.00890.440.011.2412000.5
Subclay0.0340.450.021.46000.5
Calibrated values
Silt0.0760.450.021.4113000.5
Fine powder sand0.00890.430.011.2312000.5
Subclay0.0340.460.0161.376000.5
Notes: θs is the saturated moisture content; θr is the residual moisture content; α and n are dimensionless empirical parameters of the soil characteristic curve; m is the coefficient of experience (m = 1 − 1/n (n > 1)); and K is the saturated hydraulic conductivity.
Table 2. Solute transport parameters.
ParameterBulk.dDisp.LDisp.TKdDwK1K2K3
Unitmg/cm3cmcmcm3/mgcm2/dayday−1day−1day−1
Initial values
Silt136020.418.20.09840.00100.02000.00005
Fine powder sand13501.450.140.18240.00820.02000.00005
Subclay13000.60.060.20040.00080.00020.0006
Calibrated values
Silt136020.617.50.09840.00120.02000.00005
Fine powder sand13501.470.180.18240.00840.02000.00005
Subclay13000.540.060.50040.00070.00160.0006
Notes: Bulk.d is the soil bulk density (mg/cm3); Disp.L. and Disp.T. are the vertical and horizontal dispersion coefficients (cm), respectively; Kd is the adsorption-partition coefficient (cm3/mg); Dw is the diffusion coefficient of nitrogen in pure water (cm2/day); K1 and K2 are the nitrification coefficients of NH4+ and NO2, respectively: and K3 is the denitrification coefficient of NO3 (day−1).
Table 3. Correlation analysis between simulated and monitoring values.
Indicator NameMAERMSEPBAIS (%)NSE
NH4+4.7416.8030.650.71
NO20.3320.386−1.010.82
NO356.91675.3153.350.91
Notes: MAE is the mean absolute error; RMSE is the root mean square error; PBIAS (%) is the deviation percentage; and NSE is the Nash–Sutcliffe efficiency coefficient.

