Threshold Values of Extreme Hydrometeorological Events on the Polish Baltic Coast


Abstract
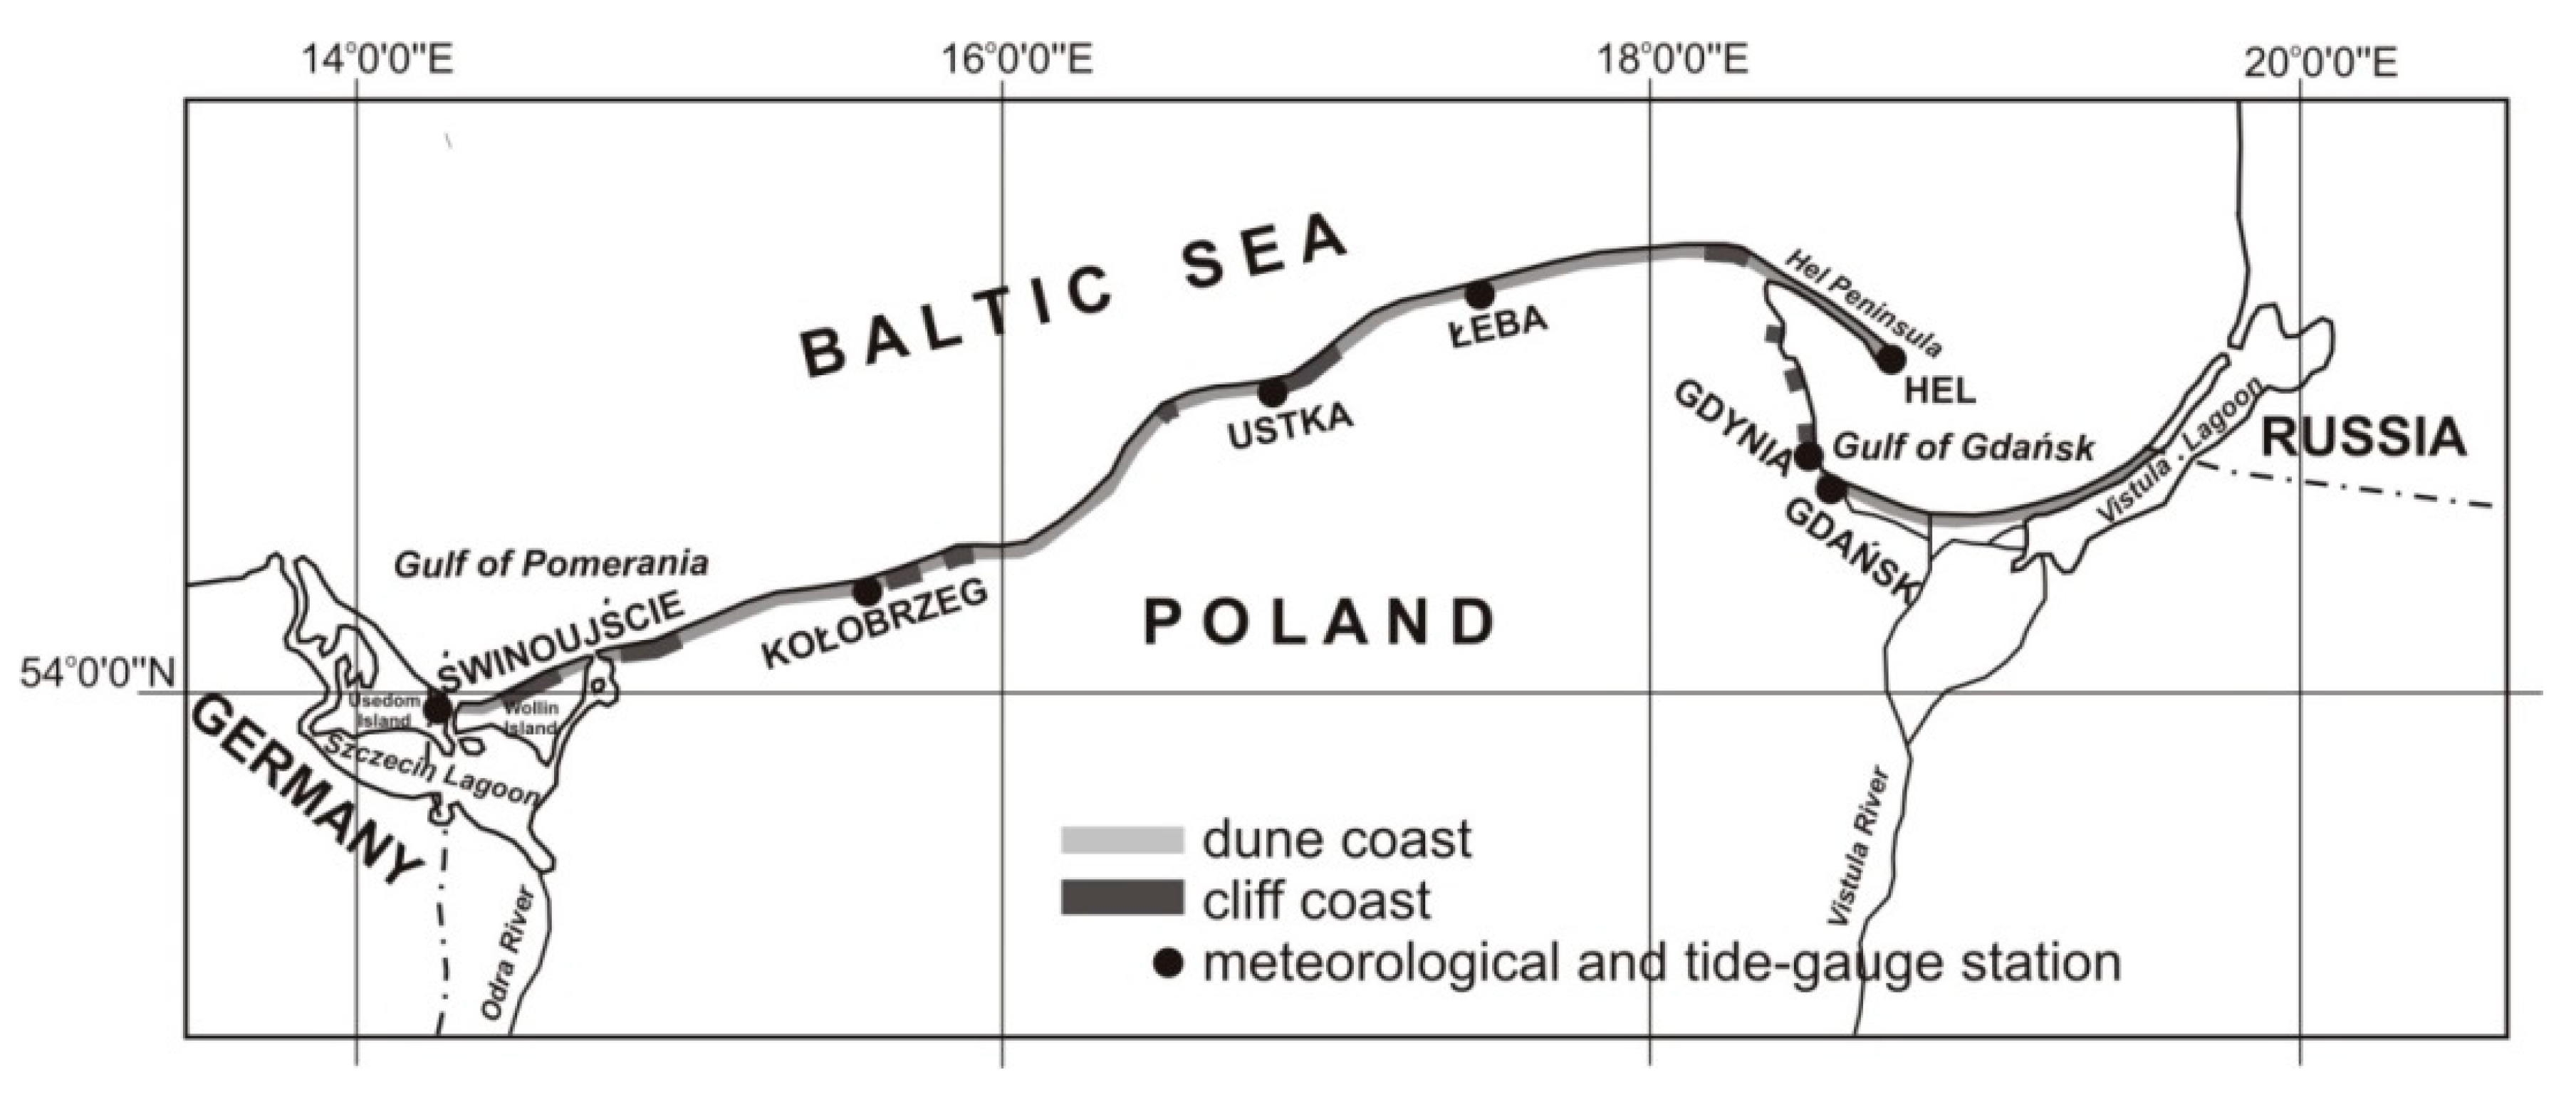
:1. Introduction
2. Materials and Methods
- -
- Absolute extreme. The highest or lowest value that has been empirically evidenced for a given meteorological and hydrological event.
- -
- Extreme event. Values close to the absolute extremes for a given meteorological and hydrological event, whose probability of being exceeded is lower than 10%, i.e., the chances of their occurrence (or “return period”) is at most once every ten years. In quantile terms, extreme threshold values were designated using percentiles 5/100 and 95/100.
- -
- Exceptionally extreme event. Values close to the absolute extremes for a given meteorological and hydrological event, whose probability of being exceeded is lower than 1%, i.e., the chances of their occurrence (or “return period”) is at most once every hundred years. In quantile terms, exceptionally extreme threshold values were designated using percentiles 1/100 and 99/100.
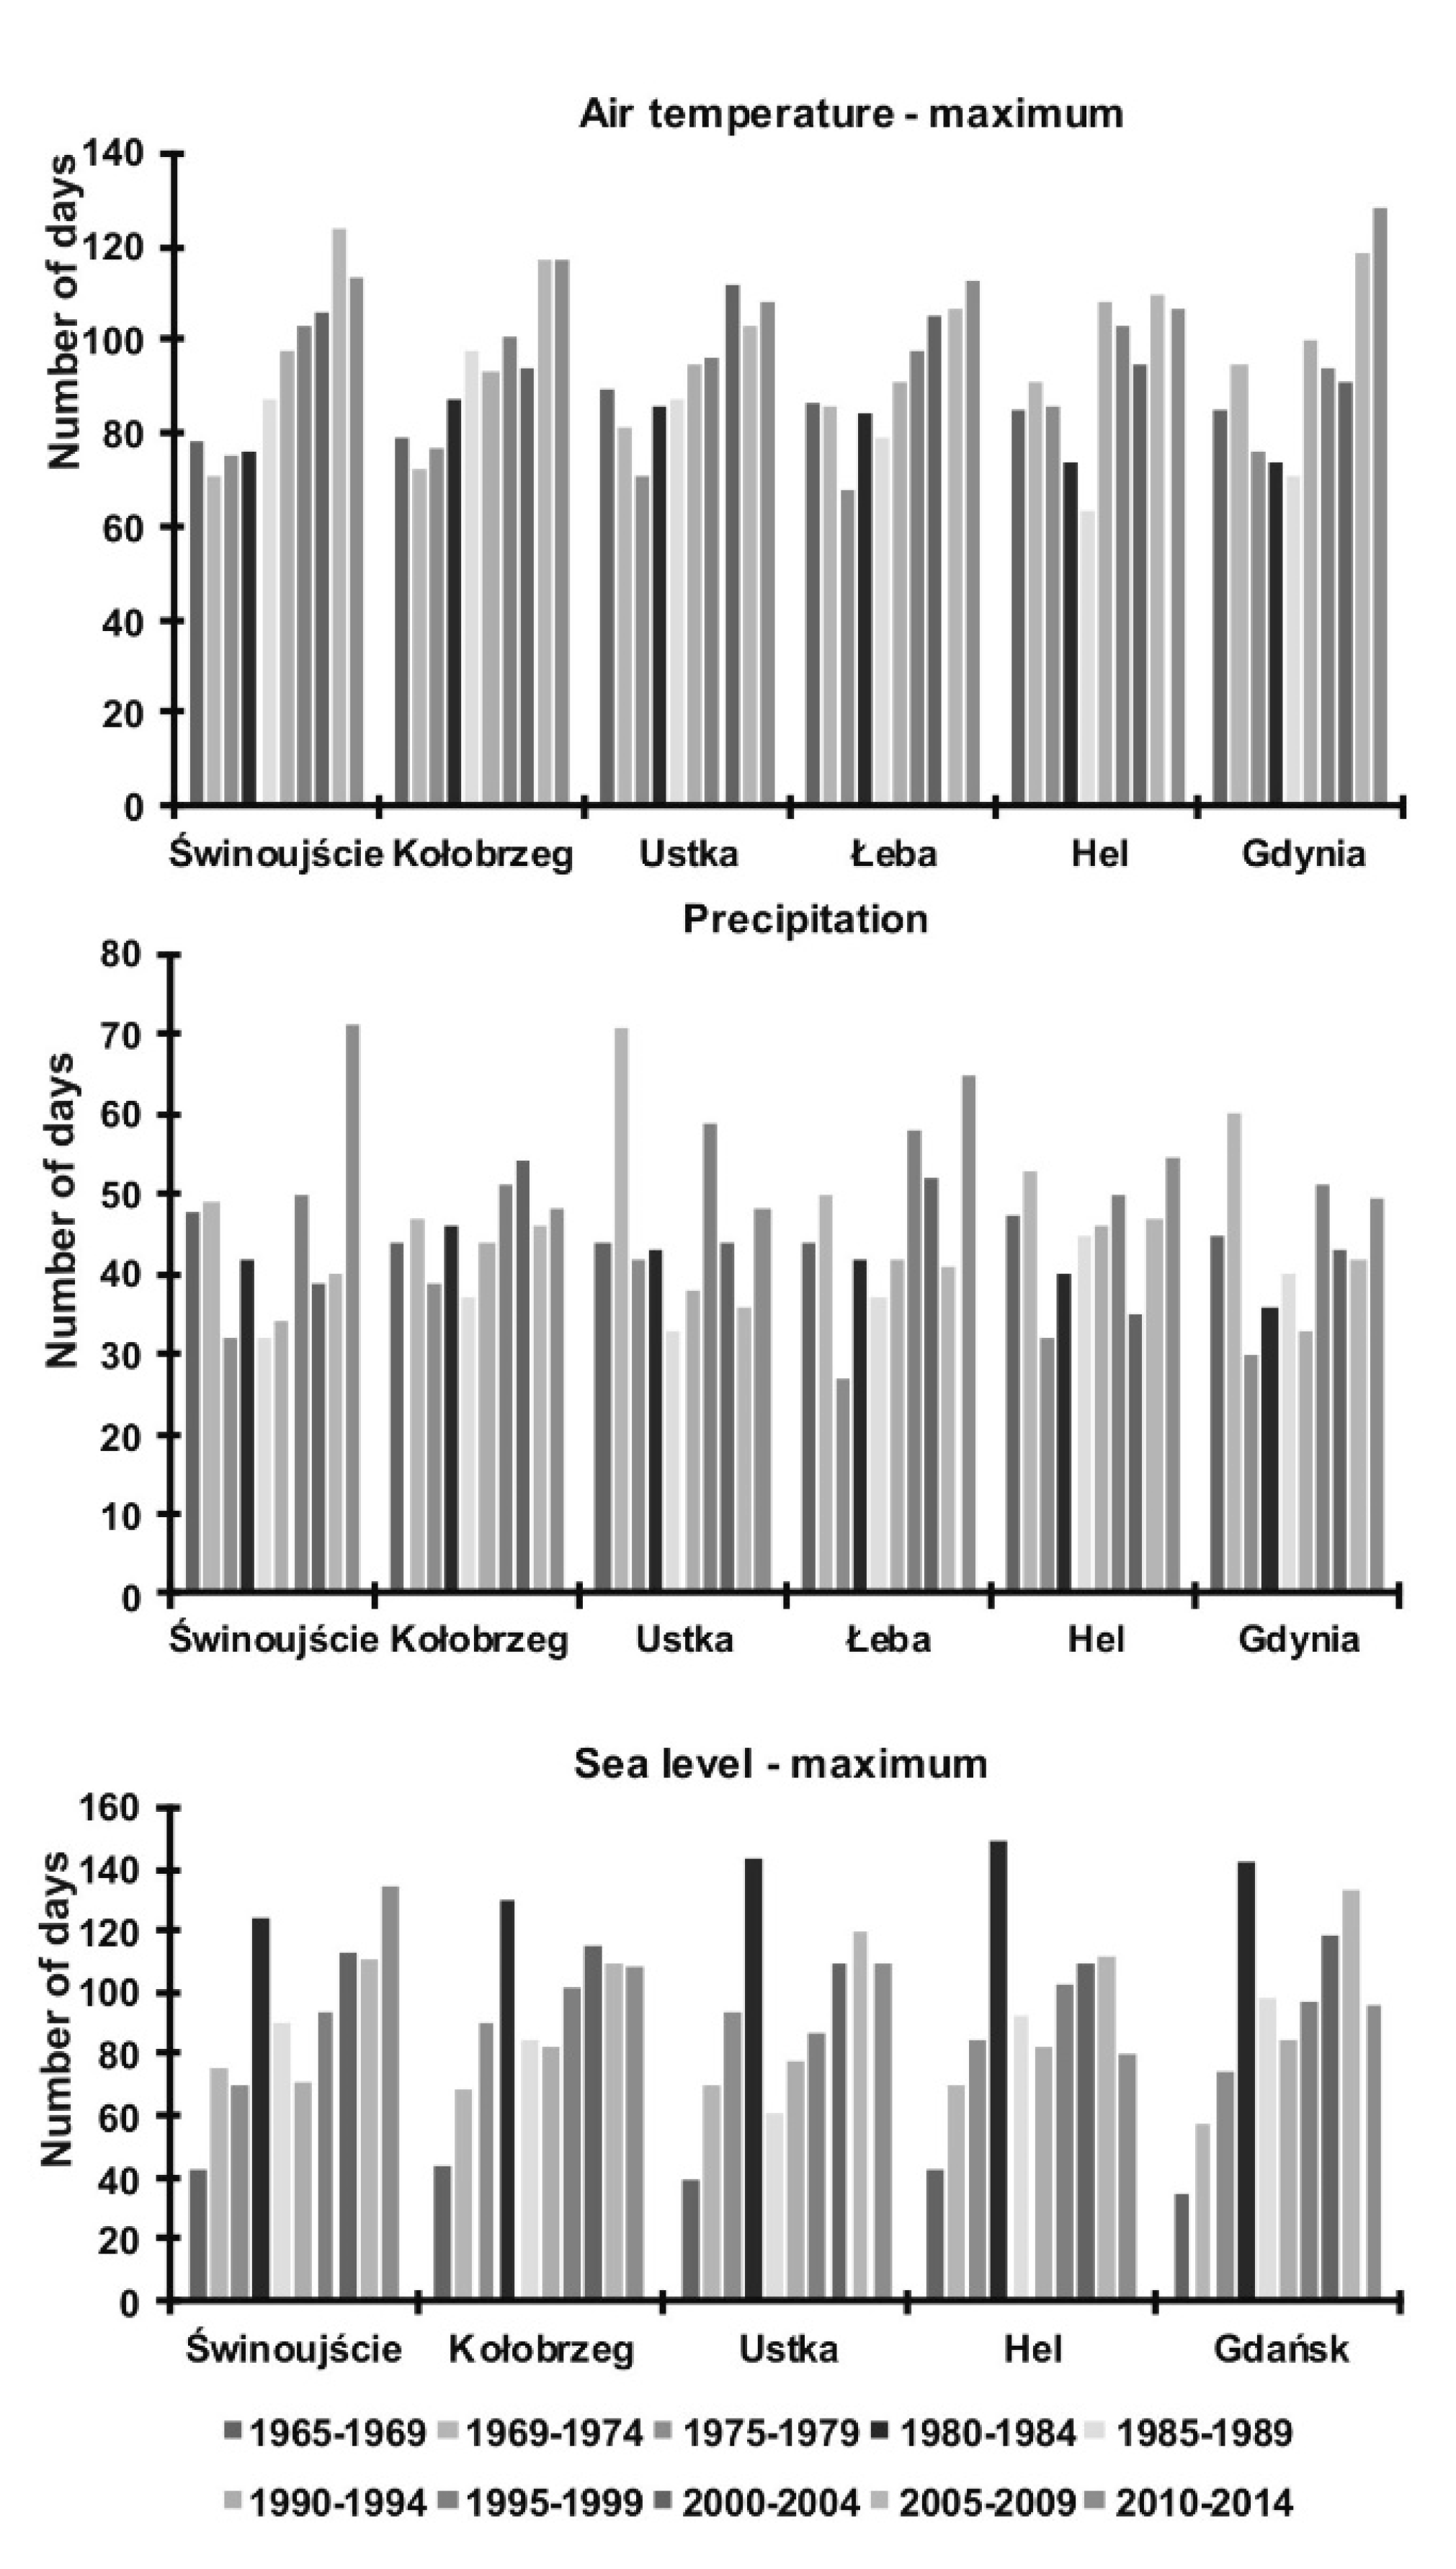
3. Results
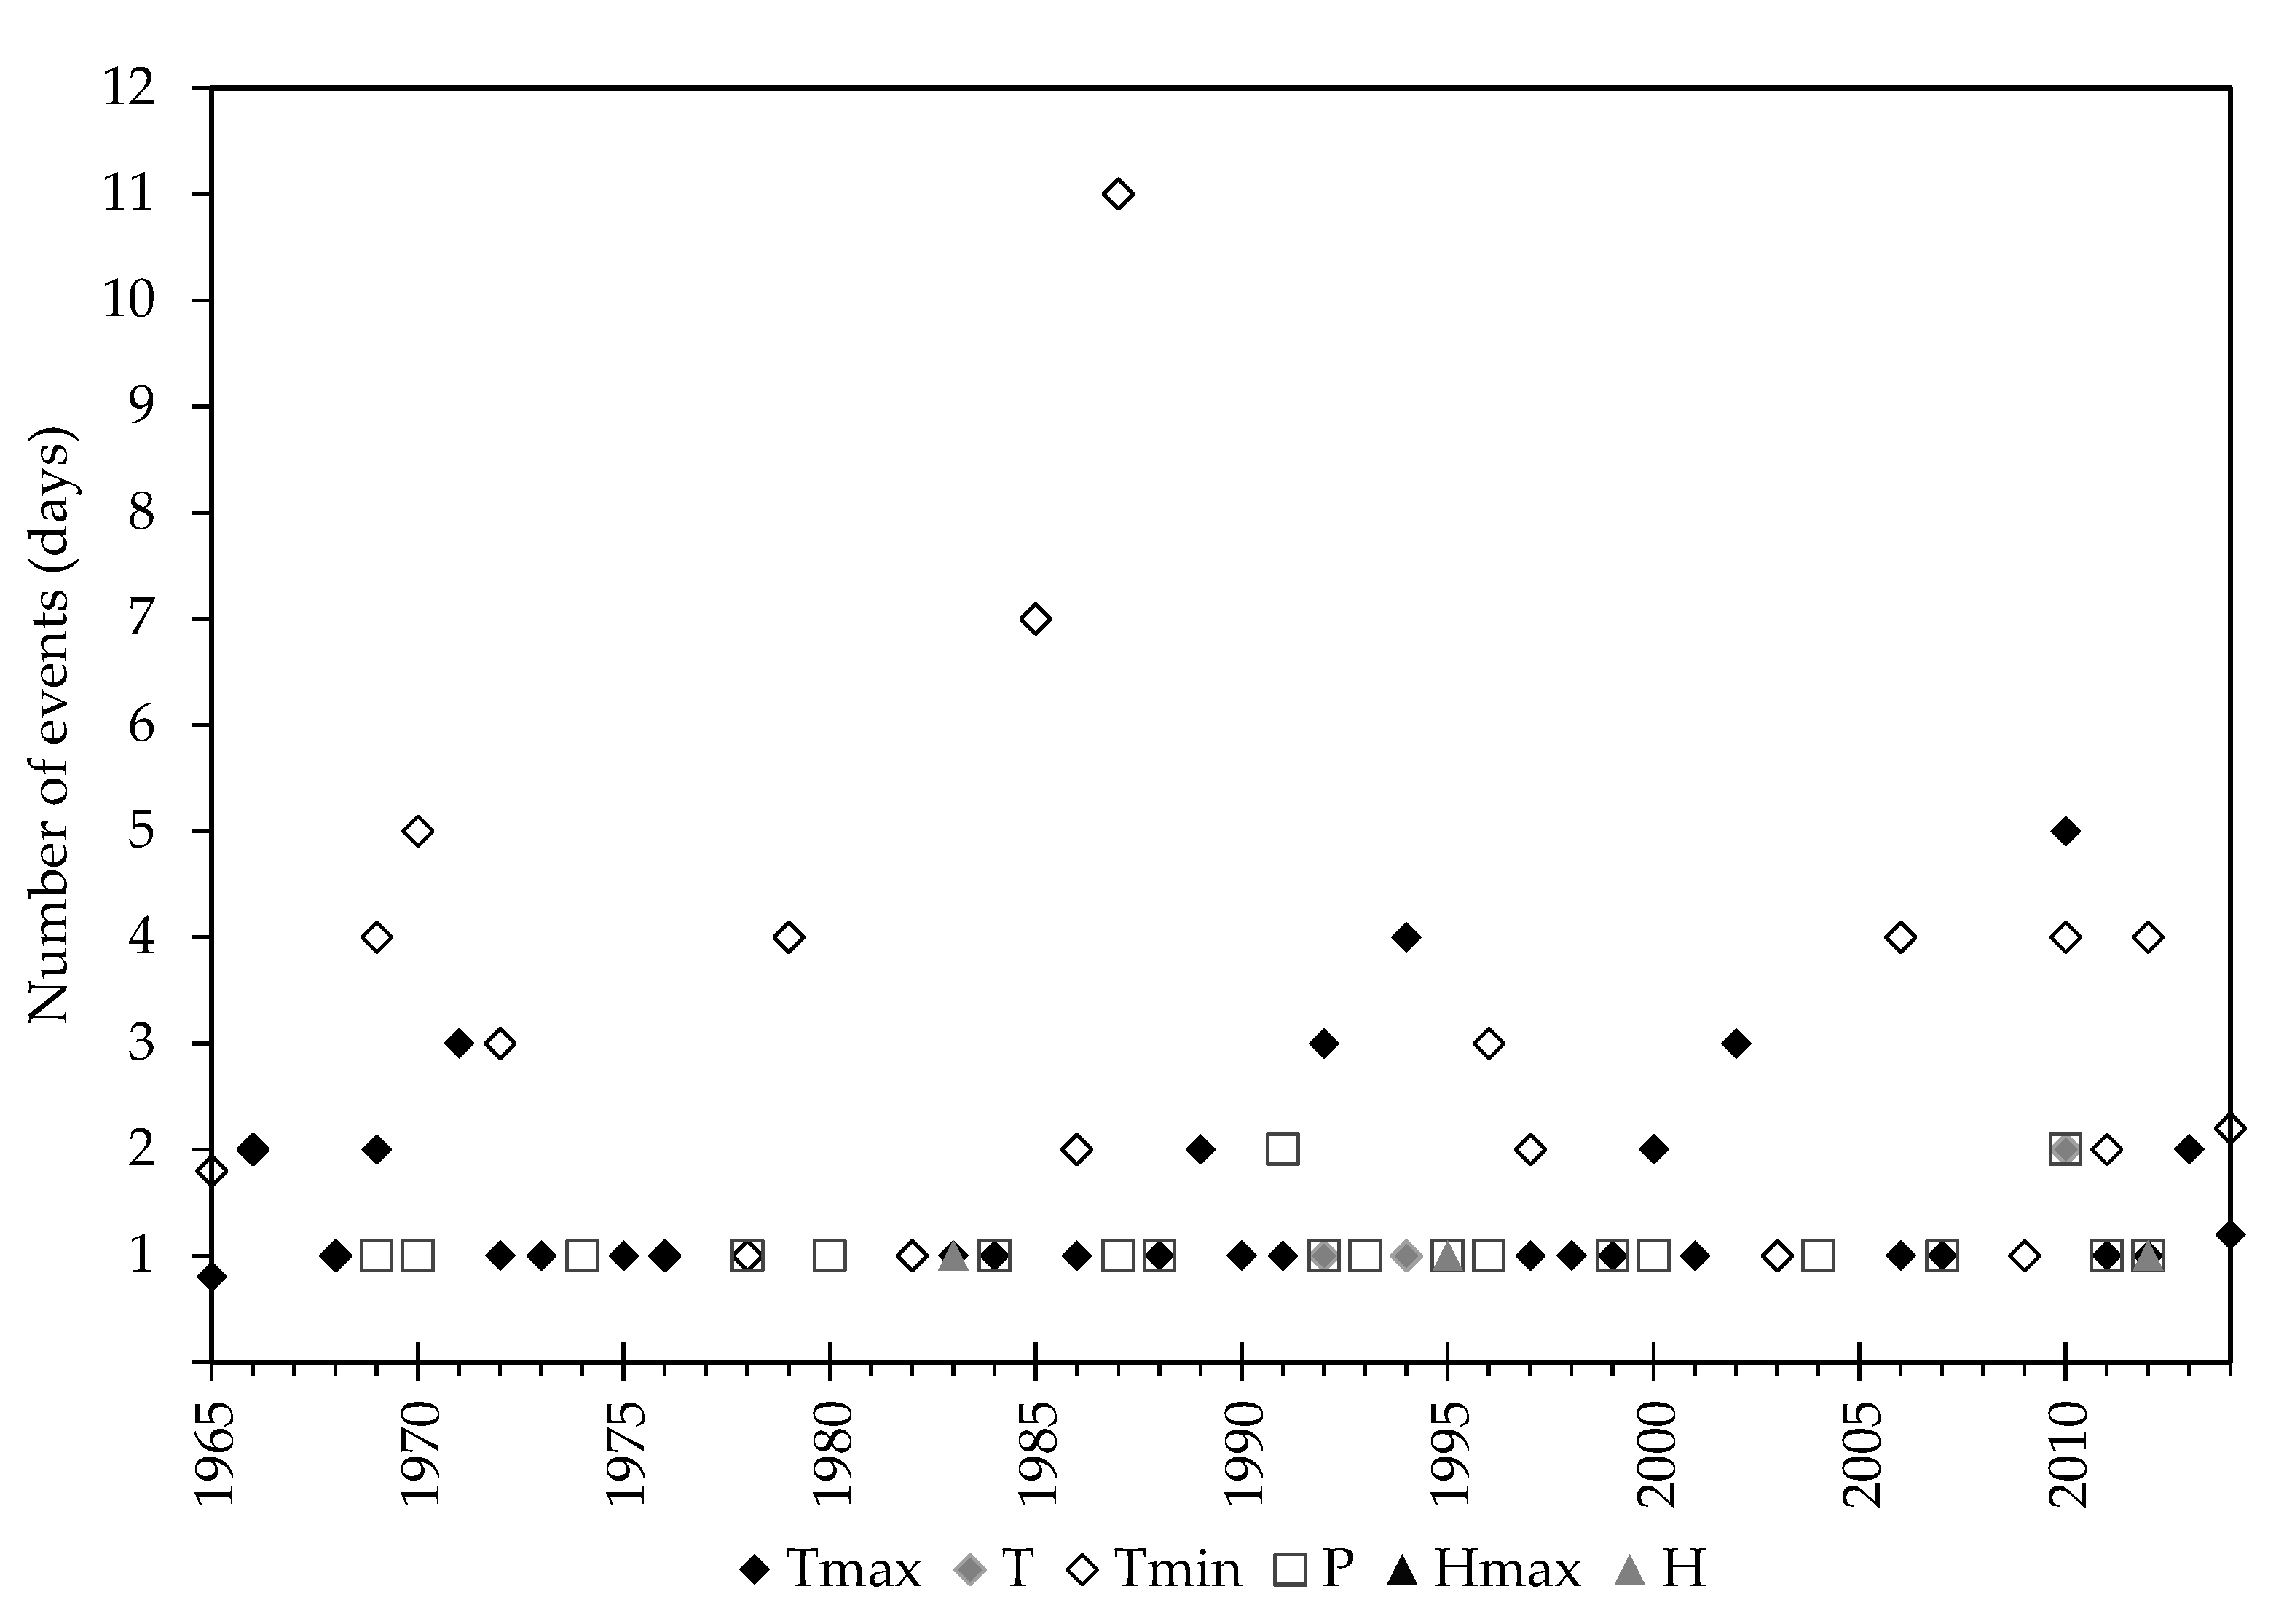
3.1. Absolute Extreme
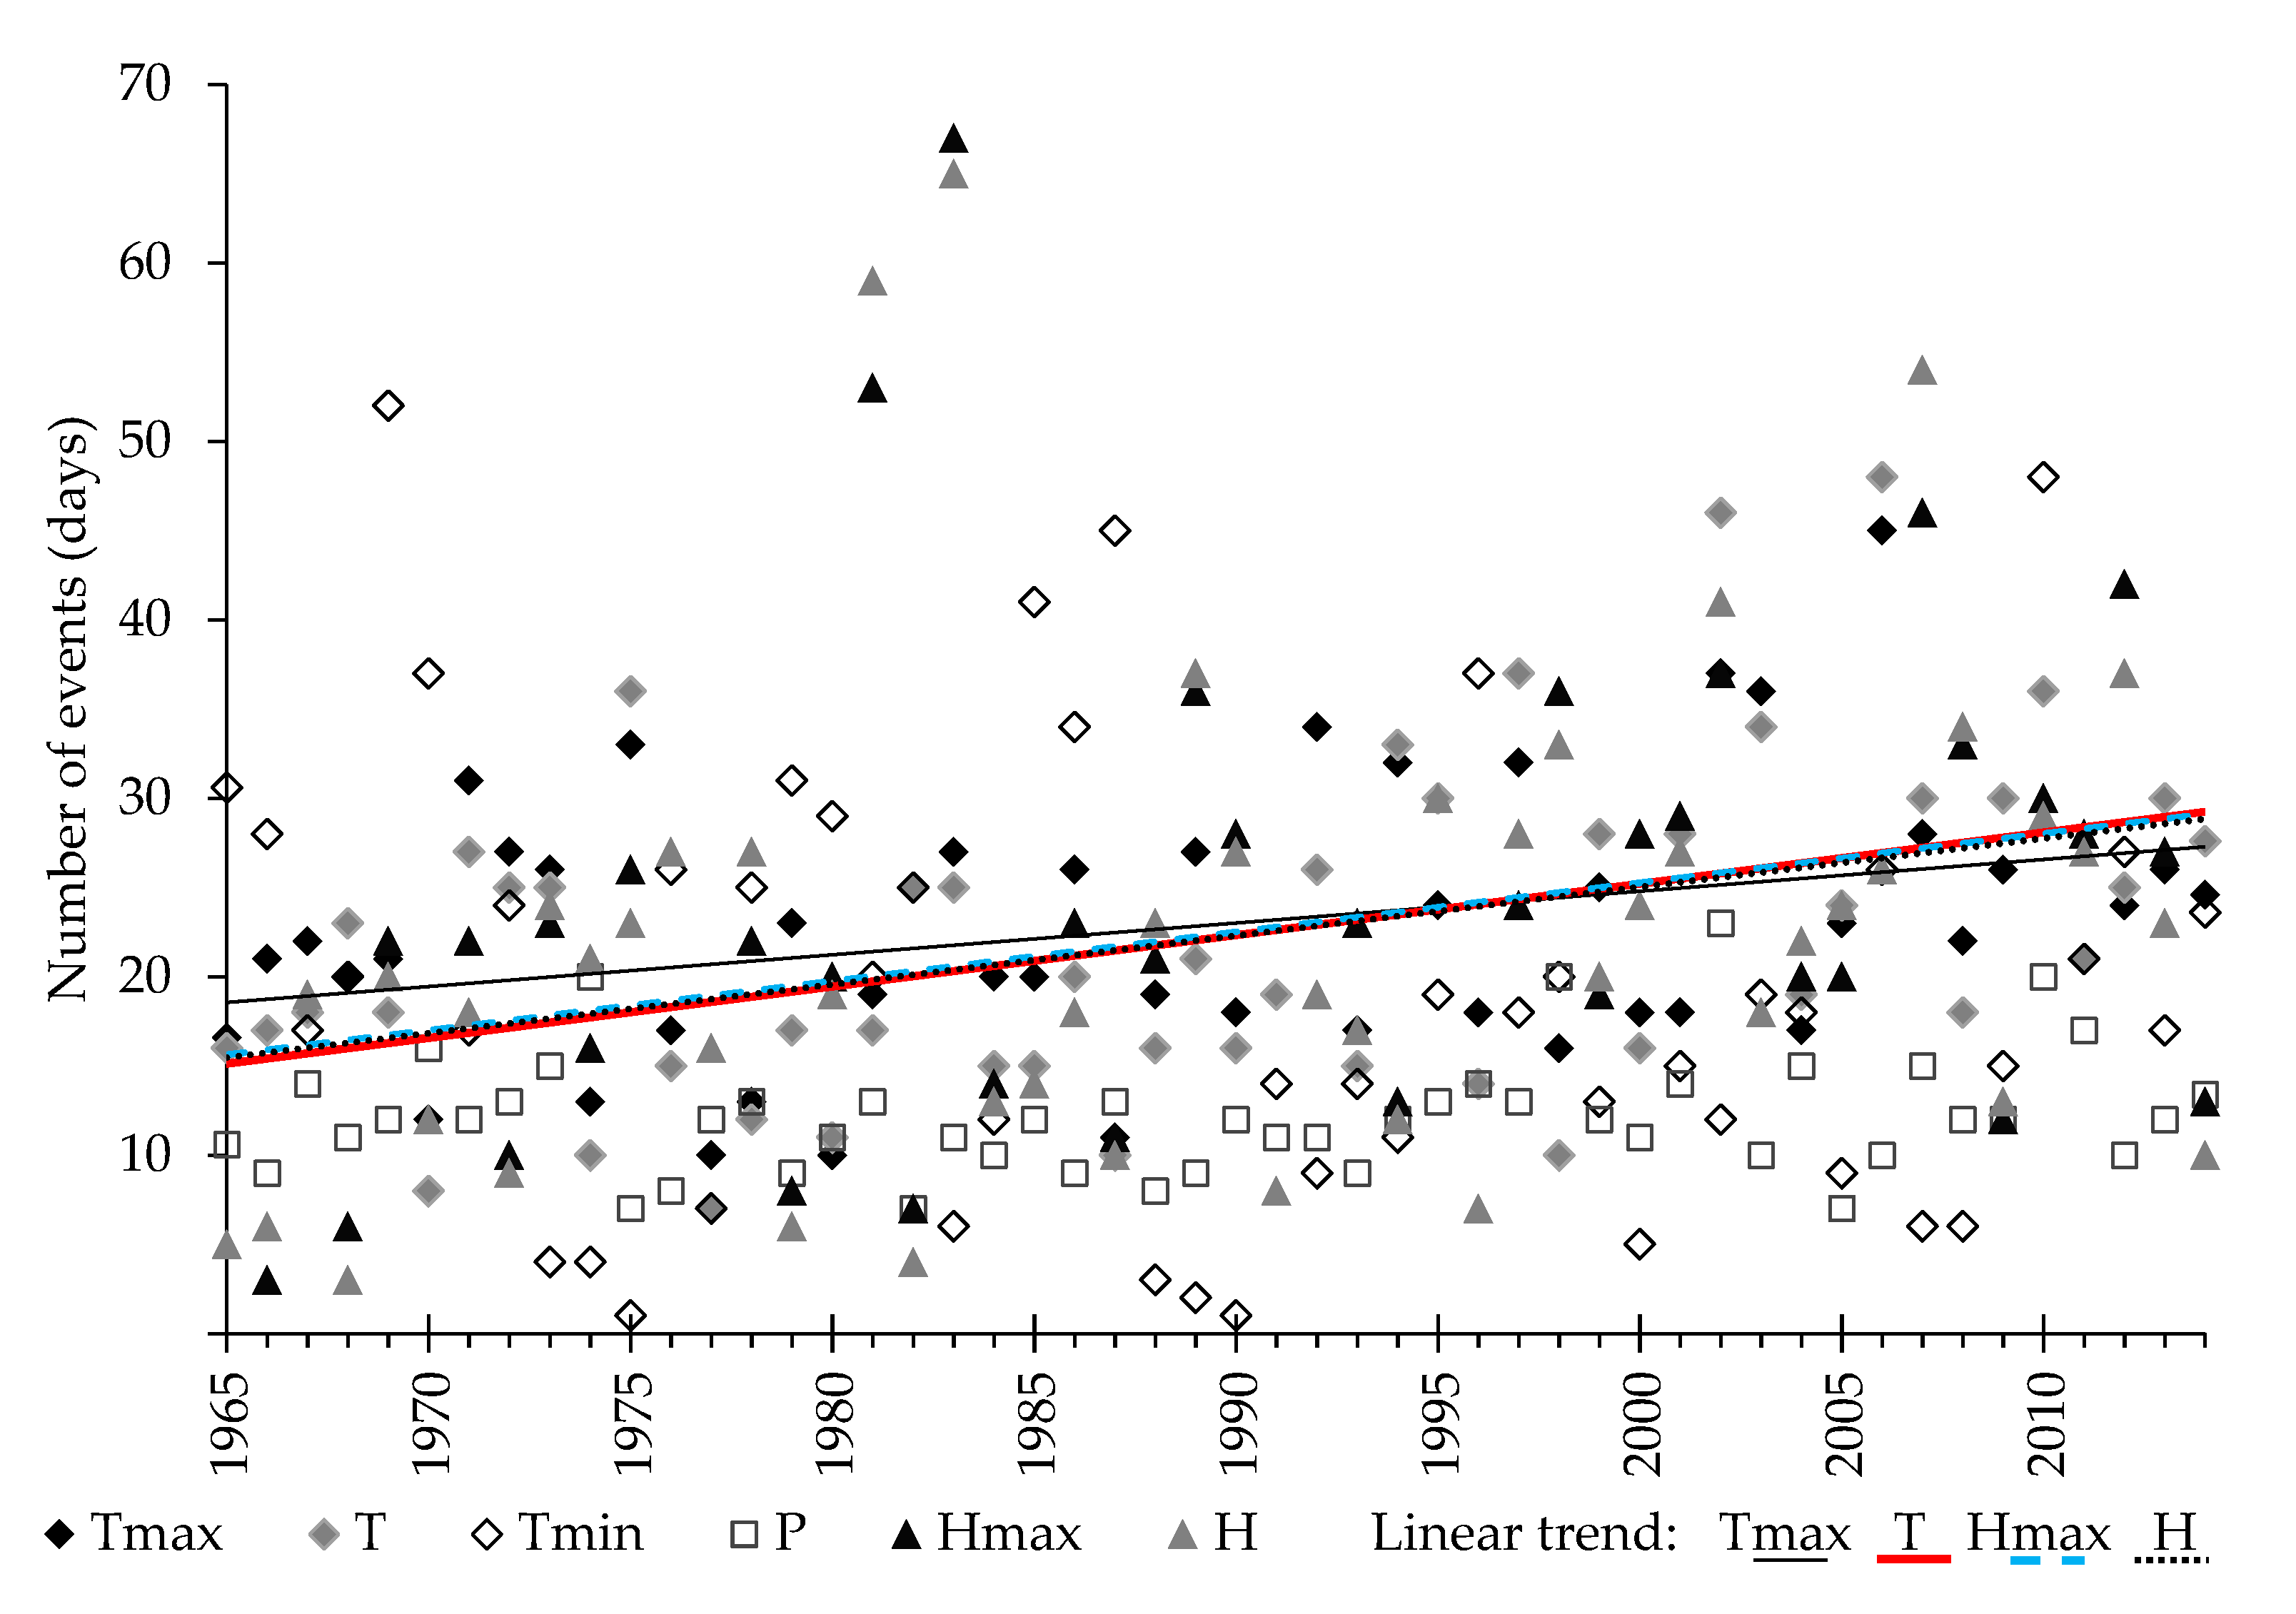
3.2. Extreme Events—Probabilistic Analysis
3.3. Extreme Events—Quantile Analysis
4. Discussion
5. Conclusions
Author Contributions
Funding
Acknowledgments
Conflicts of Interest
References
- Rotnicki, K.; Borzyszkowska, W. Accelerated sea level rise and its components at the Polish Baltic Coast in the years 1951–1990. In Ewolucja Geosystemów Nadmorskich Południowego Bałtyku; Borówka, R.K., Młynarczyk, Z., Wojciechowski, A., Eds.; Bogucki Wydawnictwo Naukowe: Poznań, Poland; Szczecin, Poland, 1999; pp. 141–160. ISBN 83-88163-02-7. [Google Scholar]
- Masria, A.; Negm, A.; Iskander, M.M.; Saavedra, O.C. Coastal protection measures, case study (Mediterranean zone, Egypt). J. Coast. Conserv. 2015, 19, 281–294. [Google Scholar] [CrossRef]
- Räisänen, J. Future Climate Change in the Baltic Sea Region and Environmental Impacts. Oxf. Res. Encycl. Clim. Sci. 2017. [Google Scholar] [CrossRef]
- Paprotny, D.; Terefenko, P. New estimates of potential impacts of sea level rise and coastal floods in Poland. Nat. Hazards 2017, 85, 1249–1277. [Google Scholar] [CrossRef]
- Heino, R.; Brázdil, R.; Førland, E.; Tuomenvirta, H.; Alexandersson, H.; Beniston, M.; Pfister, C.; Rebetez, M.; Rosenhagen, G.; Rösner, S.; et al. Progress in the study of climate extremes in northern and central Europe. Clim. Chang. 1999, 42, 151–181. [Google Scholar] [CrossRef]
- Frich, P.; Alexander, L.V.; Della-Marta, P.; Gleason, B.; Haylock, M.; Klein Tank, A.M.G.; Peterson, T. Observed coherent changes in climatic extremes during the second half of the twentieth century. Clim. Res. 2002, 19, 193–212. [Google Scholar] [CrossRef] [Green Version]
- Alexander, L.V.; Zhang, X.; Peterson, T.C.; Caesar, J.; Gleason, B.; Klein Tank, A.M.G.; Haylock, M.; Collins, D.; Trewin, B.; Rahimzadeh, F.; et al. Global observed changes in daily climate extremes of temperature and precipitation. J. Geophys. Res. 2006, 111. [Google Scholar] [CrossRef] [Green Version]
- Przybylak, J.; Vízi, Z.; Araźny, A.; Kejna, M.; Maszewski, R.; Uscka-Kowalkowska, J. Poland’s Climate Extremes Index, 1951–2005. Geogr. Pol. 2007, 80, 47–58. [Google Scholar]
- Friederichs, P. Statistical downscaling of extreme precipitation events using extreme value theory. Extremes 2010, 13, 109–132. [Google Scholar] [CrossRef]
- Ustrnul, Z.; Czekierda, D.; Wypych, A. Extreme values of air temperature in Poland according to different atmospheric circulation classifications. Phys. Chem. Earth 2010, 35, 429–436. [Google Scholar] [CrossRef]
- Kysely, J. Probability estimates of extreme temperature events: Stochastic modelling approach vs. extreme value distributions. Studia Geophysica et Geodaetica 2002, 46, 93–112. [Google Scholar] [CrossRef]
- Wiśniewski, B.; Wolski, T. Occurrence probability of maximum sea levels in Polish ports of Baltic Sea coast. Pol. Marit. Res. 2009, 3, 62–69. [Google Scholar] [CrossRef]
- Haigh, I.D.; Nicholls, R.; Wells, N. A comparison of the main methods for estimating probabilities of extreme still water levels. Coast. Eng. 2010, 57, 838–849. [Google Scholar] [CrossRef]
- IPCC. Climate Change. The Scientific Basis. Contribution of the Working Group I to the Third Assessment Report of the Intergovernmental Panel on Climate Change; Houghton, D., Griggs, N., Van der Linden, D., Maskell, J., Eds.; Cambridge University Press: Cambridge, UK; New York, NY, USA, 2001; pp. 1–881. ISBN 0-521-01495-6. [Google Scholar]
- Czernecki, B.; Miętus, M. Comparison of thermal classification on the example in selected regions of Poland. Rev. Geophys. 2011, LVI, 201–233. [Google Scholar]
- Wójcik, R.; Pilarski, M.; Miętus, M. Statistical downscaling of probability density function of daily precipitation on the Polish coast. Meteorol. Hydrol. Water Manag. 2014, 2, 27–36. [Google Scholar] [CrossRef]
- Tylkowski, J. Temporal and spatial variability of air temperature and precipitation at the Polish coastal zone of the southern Baltic Sea. Baltica 2013, 26, 83–94. [Google Scholar]
- Tylkowski, J. The temporal and spatial variability of coastal dune erosion in the Polish Baltic coastal zone. Baltica 2017, 30, 97–106. [Google Scholar] [CrossRef]
- Wolski, T. Temporal and Spatial Characterization of Extreme Baltic Sea Levels; Scientific Publisher of the University of Szczecin: Szczecin, Poland, 2017; pp. 1–265. ISBN 978-83-7972-091-0. [Google Scholar]
- Wiśniewski, B.; Wolski, T.; Giza, A. Adjustment of the European Vertical Reference System for the representation of the Baltic Sea water surface topography. Sci. J. 2014, 38, 106–117. [Google Scholar]
- Russell, G.L.; Gornitz, V.; Miller, J.R. Regional sea level changes projected by the NASA/GISS atmosphere-ocean model. Clim. Dyn. 2000, 16, 789–797. [Google Scholar] [CrossRef]
- Horton, E.B.; Folland, C.K.; Parker, D.E. The changing incidence of extremes in worldwide and Central England temperatures to the end of the twentieth century. Clim. Chang. 2001, 50, 267–295. [Google Scholar] [CrossRef]
- Milly, P.C.D.; Wetherald, R.T.; Dunne, K.A.; Delworth, T.L. Increasing risk of great floods in a changing climate. Nature 2002, 415, 514–517. [Google Scholar] [CrossRef] [PubMed]
- Zwoliński, Z. Selected extreme phenomena of Polish lakelands. Landf. Anal. 2008, 8, 98–106. [Google Scholar]
- Miętus, M. Temperature and Precipitation Variability in the Polish Baltic Coast and Its Expected Course until 2030. Res. Mater. IMGW Meteorol. Ser. 1996, 26, 1–72. [Google Scholar]
- Hupfer, P.; Harff, J.; Sterr, H.; Stigge, H.J. Die Küste. Die Wasserstӓnde an der Ostseeküste. Entwicklung-Sturm-fluten-Klimawandel; Kuratorium für Forschung im Küsteningenieurwesen: Cuxhaven, Germany, 2003; pp. 1–331. ISBN 3-8042-1057-0. [Google Scholar]
- Suursaar, U.; Kullas, T.; Otsmann, M.; Kouts, T. Extreme sea level events in the coastal waters of western Estonia. J. Sea Res. 2003, 49, 295–303. [Google Scholar] [CrossRef] [Green Version]
- Linderson, M.L.; Achberger, C.; Chen, D. Statistical downscaling and scenario construction of precipitation in Scania, southern Sweden. Nord. Hydrol. 2004, 35, 261–278. [Google Scholar] [CrossRef]
- Jensen, J.; Müller-Navara, S.H. Die Küste. Storm Surges on the German Coast; Kuratorium für Forschung im Küsteningenieurwesen: Cuxhaven, Germany, 2008; Volume 74, pp. 92–124. ISBN 3-8042-1057-0. [Google Scholar]
- Kriaučiūnienė, J.; Meilutytė-Barauskienė, D.; Reihan, A.; Koltsova, T.; Lizuma, L.; Šarauskienė, D. Variability of regional series of temperature, precipitation and river discharge in the Baltic States. Boreal Environ. Res. 2012, 2, 150–162. [Google Scholar]
- Marosz, M.; Wójcik, R.; Pilarski, M.; Miętus, M. Extreme daily precipitation totals in Poland during summer: The role of regional atmospheric circulation. Clim. Res. 2013, 56, 245–259. [Google Scholar] [CrossRef]
- Wróblewski, A. Analysis and forecast of long term sea level changes along the polish Baltic Sea coast, Part I Annual sea level maxima. Oceanology 1992, 33, 65–85. [Google Scholar]
- Wolski, T.; Wiśniewski, B.; Giza, A.; Kowalewska-Kalkowska, H.; Boman, H.; Grabbi-Kaiv, S.; Hammarklint, T.; Holfort, J.; Lydeikaite, Z. Extreme sea levels at selected stations on the Baltic Sea coast. Oceanology 2014, 56, 259–290. [Google Scholar] [CrossRef]
- Łupikasza, E. Spatial and temporal variability of extreme precipitation in Poland in the period 1951–2006. Int. J. Climatol. 2010, 30, 991–1007. [Google Scholar] [CrossRef]
- Degirmendžić, J.; Kożuchowski, K.; Żmudzka, E. Changes of air temperature and precipitation in Poland in the period 1951–2000 and their relationship to atmospheric circulation. Int. J. Climatol. 2004, 24, 291–310. [Google Scholar] [CrossRef] [Green Version]
- Marsz, A.A. Influence of the North Atlantic Oscillation (NAO) on the increase in air temperature over Poland under conditions of variable heat resources in the North Atlantic. Rev. Geophys. 2013, LVIII, 127–143. [Google Scholar]
- Kostrzewski, A.; Zwoliński, Z.; Winowski, M.; Tylkowski, J.; Samołyk, M. Cliff top recession rate and cliff hazards for the sea coast of Wolin Island (Southern Baltic). Baltica 2015, 28, 109–120. [Google Scholar] [CrossRef] [Green Version]
- Winowski, M. Cliff landslides activity under the influence of extreme meteorological and hydrological conditions, Wolin Island—Southern Balic. Landf. Anal. 2015, 28, 87–102. [Google Scholar] [CrossRef]
- Collins, M.; Knutti, R.; Arblaster, J.; Dufresne, J.-L.; Fichefet, T.; Friedlingstein, P.; Wehner, M. Long-term climate change: Projections, commitments and irreversibility. In IPCC, Climate Change: The Physical Science Basis. Contribution of Working Group I to the Fifth Assessment Report of the Intergovernmental Panel on Climate Change; Cambridge University Press: Cambridge, UK, 2013; pp. 1029–1136. [Google Scholar]
- Nikulin, G.; Kjellström, E.; Hansson, U.; Jones, C.; Strandberg, G.; Ullerstig, A. Evaluation and future projections of temperature, precipitation and wind extremes over Europe in an ensemble of regional climate simulations. Tellus 2011, 63A, 41–55. [Google Scholar] [CrossRef]
- Christensen, O.B.; Kjellström, E.; Zorita, E. Projected Change—Atmosphere. In Second Assessment of Climate Change for the Baltic Sea Basin; The BACC II Author Team, Ed.; Regional Climate Studies; Springer: Cham, Switzerland, 2015; ISBN 978-3-319-16006-1. [Google Scholar]
- Lehtonen, I.; Ruosteenoja, K.; Jylhä, K. Projected changes in European extreme precipitation indices on the basis of global and regional climate model ensembles. Int. J. Climatol. 2014, 34, 1208–1222. [Google Scholar] [CrossRef]
- Orlowsky, B.; Seneviratne, S.I. Global changes in extreme events: Regional and seasonal dimension. Clim. Chang. 2012, 116, 669–696. [Google Scholar] [CrossRef]
- Church, J.A.; Clark, P.U.; Cazenave, A.; Gregory, J.M.; Jevrejeva, S.; Levermann, A.; Merrifield, M.A.; Milne, G.A.; Nerem, R.S.; Nunn, P.D.; et al. Sea level change. In Climate Change: The Physical Science Basis. Contribution of Working Group I to the Fifth Assessment Report of the Intergovernmental Panel on Climate Change; Stocker, T.F., Qin, D., Plattner, G.K., Tignor, M., Allen, S.K., Boschung, J., Nauels, A., Xia, Y., Bex, V., Midgley, P.M., Eds.; Cambridge University Press: Cambridge, UK, 2013; pp. 1137–1216. [Google Scholar]
- Grinsted, A. Projected Change—Sea Level. In Second Assessment of Climate Change for the Baltic Sea Basin; BACC II Author Team, Ed.; Springer: London, UK, 2015; pp. 253–263. ISBN 978-3-319-16006-1. [Google Scholar] [Green Version]
- Vousdoukas, M.I.; Voukouvalas, E.; Annunziato, A.; Giardino, A.; Feyen, L. Projections of extreme storm surge levels along Europe. Clim. Dyn. 2016, 47, 3171–3190. [Google Scholar] [CrossRef] [Green Version]
- Gräwe, U.; Burchard, H. Storm surges in the western Baltic Sea: The present and a possible future. Clim. Dyn. 2012, 39, 165–183. [Google Scholar] [CrossRef]


| Place | Maximum Air Temperaturę at 2 m AGL | Mean Air Temperaturę at 2 m AGL | Minimum Air Temperaturę at 2 m AGL | Precipitation | Maximum Sea Level | Mean Sea Level | ||
|---|---|---|---|---|---|---|---|---|
| Max | Max | Min | Min | Max | Max | Max | Min | |
| Świnoujście | 37.4 | 27.7 | −16.5 | −22.2 | 76.6 | 661 | 624 | 401 |
| Kołobrzeg | 38.0 | 28.1 | −16.5 | −21.9 | 85.2 | 644 | 618 | 401 |
| Ustka | 37.8 | 29.8 | −16.1 | −22.2 | 94.2 | 636 | 611 | 428 |
| Łeba | 37.2 | 28.4 | −16.5 | −25.0 | 141.0 | - | - | - |
| Hel | 33.7 | 26.0 | −14.6 | −18.2 | 77.1 | 620 | 604 | 431 |
| Gdynia | 35.0 | 27.2 | −16.0 | −18.7 | 82.1 | - | - | - |
| Gdańsk | - | - | - | - | - | 644 | 620 | 436 |
| Place | Hydrometeorological Conditions | |||||
|---|---|---|---|---|---|---|
| Maximum Air | Mean Air | Minimum Air | Precipitation | Maximum | Mean Sea | |
| Temperature | Temperature | Temperature | Sea Level | Level | ||
| Statistical Distribution | ||||||
| Error (Exponential Power) Distribution | Log-Gamma Distribution | Generalized Logistic Distribution | ||||
| Świnoujście | k = 3.91 | k = 3.39 | k = 2.42 | α = 70.59 | k = 0.10 | k = 0.05 |
| σ= 8.19 | σ= 7.18 | σ = 6.72 | β = 0.048 | σ = 11.55 | σ = 10.78 | |
| μ = 11.95 | μ = 8.62 | μ = 5.70 | μ = 506.46 | μ = 499.80 | ||
| K − S = 0.021 | K − S = 0.033 | K − S = 0.042 | K − S = 0.108 | K − S = 0.015 | K − S = 0.015 | |
| p < 0.001 | p < 0.001 | p < 0.001 | p = 0.590 | p < 0.001 | p < 0.001 | |
| Kołobrzeg | k = 3.50 | k = 3.17 | k = 2.30 | α = 127.11 | k = 0.10 | k = 0.06 |
| σ = 7.98 | σ = 7.12 | σ = 6.68 | β = 0.028 | σ = 12.01 | σ = 11.06 | |
| μ = 11.67 | μ = 8.34 | μ = 5.34 | μ = 507.11 | μ = 500.73 | ||
| K − S = 0.025 | K − S = 0.039 | K − S = 0.044 | K − S = 0.123 | K − S = 0.014 | K − S = 0.013 | |
| p < 0.001 | p < 0.001 | p < 0.001 | p = 0.429 | p < 0.001 | p < 0.001 | |
| Ustka | k = 3.35 | k = 3.14 | k = 2.30 | α = 89.93 | k = 0.09 | k = 0.05 |
| σ = 7.97 | σ = 7.08 | σ = 6.75 | β = 0.040 | σ = 11.98 | σ = 11.13 | |
| μ = 11.36 | μ = 8.20 | μ = 5.41 | μ = 508.11 | μ = 502.18 | ||
| K − S = 0.031 | K − S = 0.036 | K − S = 0.041 | K − S = 0.090 | K − S = 0.017 | K − S = 0.018 | |
| p < 0.001 | p < 0.001 | p < 0.001 | p = 0.797 | p < 0.001 | p < 0.001 | |
| Łeba | k = 3.74 | k = 3.31 | k = 2.16 | α = 87.05 | - | - |
| σ = 8.01 | σ = 7.12 | σ = 6.82 | β = 0.040 | |||
| μ = 11.22 | μ = 7.92 | μ = 4.61 | ||||
| K − S = 0.031 | K − S = 0.038 | K − S = 0.041 | K − S = 0.101 | |||
| p < 0.001 | p < 0.001 | p < 0.001 | p = 0.672 | |||
| Hel | k = 5.58 | k = 4.47 | k = 3.12 | α = 72.66 | k = 0.09 | k = 0.042 |
| σ = 8.08 | σ = 7.07 | σ = 6.64 | β = 0.049 | σ = 12.15 | σ = 11.15 | |
| μ = 11.30 | μ = 8.24 | μ = 5.52 | μ = 508.28 | μ = 503.29 | ||
| K − S = 0.027 | K − S = 0.031 | K − S = 0.037 | K − S = 0.066 | K − S = 0.015 | K − S = 0.020 | |
| p < 0.001 | p < 0.001 | p < 0.001 | p = 0.975 | p < 0.001 | p < 0.001 | |
| Gdynia | k = 4.30 | k = 3.75 | k = 2.87 | α = 83.83 | - | - |
| σ = 7.81 | σ = 7.23 | σ = 6.97 | β = 0.041 | |||
| μ = 11.28 | μ = 8.51 | μ = 6.00 | ||||
| K − S = 0.023 | K − S = 0.031 | K − S = 0.039 | K − S = 0.094 | |||
| p < 0.001 | p < 0.001 | p < 0.001 | p = 0.758 | |||
| Gdańsk | - | - | - | - | k = 0.07 | k = 0.02 |
| σ = 12.17 | σ = 11.64 | |||||
| μ = 513.45 | μ = 508.29 | |||||
| K − S = 0.018 | K − S = 0.019 | |||||
| p < 0.001 | p < 0.001 | |||||
| Place | Parameter | P(X) [%] | |||||||||
|---|---|---|---|---|---|---|---|---|---|---|---|
| 0.1 | 0.2 | 0.5 | 1 | 2 | 5 | 10 | 20 | 500 | 100 | ||
| T [Years] | |||||||||||
| 1000 | 500 | 200 | 100 | 50 | 20 | 10 | 5 | 2 | 1 | ||
| Świnoujście | Tmax | 36.7 | 36.2 | 35.6 | 35.0 | 34.5 | 33.7 | 33.1 | 32.4 | 31.3 | 30.5 |
| T | 31.9 | 31.5 | 30.8 | 30.2 | 29.6 | 28.8 | 28.2 | 27.4 | 26.4 | 25.5 | |
| Tmin | −21.0 | −20.2 | −19.2 | −18.4 | −17.5 | −16.3 | −15.4 | −14.4 | −12.9 | −11.8 | |
| P | 117.2 | 105.4 | 90.8 | 80.5 | 70.8 | 58.6 | 49.8 | 41.1 | 29.0 | 1.0 | |
| Hmax | 817.0 | 787.6 | 752.0 | 727.0 | 703.9 | 675.8 | 656.3 | 638.1 | 616.0 | 600.6 | |
| H | 686.4 | 673.3 | 656.7 | 644.5 | 632.7 | 617.7 | 606.7 | 596.1 | 582.5 | 572.6 | |
| Kołobrzeg | Tmax | 37.1 | 36.6 | 35.9 | 35.3 | 34.7 | 33.8 | 33.1 | 32.3 | 31.2 | 30.2 |
| T | 32.3 | 31.8 | 31.1 | 30.5 | 29.8 | 29.0 | 28.2 | 27.5 | 26.3 | 25.4 | |
| Tmin | −22.1 | −21.3 | −20.2 | −19.4 | −18.5 | −17.2 | −16.2 | −15.1 | −13.6 | −12.3 | |
| P | 101.1 | 93.4 | 83.6 | 76.4 | 69.3 | 60.0 | 53.0 | 45.7 | 34.8 | 1.0 | |
| Hmax | 820.5 | 791.3 | 755.9 | 731.0 | 707.9 | 679.7 | 660.1 | 641.7 | 619.4 | 603.7 | |
| H | 711.3 | 695.4 | 675.5 | 661.0 | 647.2 | 629.7 | 617.0 | 604.9 | 589.6 | 578.6 | |
| Ustka | Tmax | 37.4 | 36.9 | 36.1 | 35.5 | 34.8 | 33.9 | 33.2 | 32.3 | 31.2 | 30.2 |
| T | 32.2 | 31.6 | 30.9 | 30.3 | 29.7 | 28.8 | 28.0 | 27.3 | 26.1 | 25.2 | |
| Tmin | −22.4 | −21.6 | −20.5 | −19.6 | −18.7 | −17.4 | −16.3 | −15.3 | −13.7 | −12.5 | |
| P | 129.3 | 117.3 | 102.3 | 91.6 | 81.3 | 68.3 | 58.7 | 49.1 | 35.4 | 1.0 | |
| Hmax | 786.0 | 762.0 | 732.5 | 711.5 | 691.8 | 667.4 | 650.2 | 634.0 | 614.0 | 599.8 | |
| H | 707.6 | 692.5 | 673.4 | 659.5 | 646.1 | 629.2 | 617.0 | 605.2 | 590.3 | 579.5 | |
| Łeba | Tmax | 35.9 | 35.5 | 34.8 | 34.3 | 33.7 | 32.9 | 32.2 | 31.5 | 30.4 | 29.5 |
| T | 31.3 | 30.8 | 30.1 | 29.6 | 29.0 | 28.1 | 27.5 | 26.7 | 25.6 | 24.7 | |
| Tmin | −24.7 | −23.8 | −22.6 | −21.6 | −20.6 | −19.2 | −18.1 | −16.9 | −15.2 | −13.8 | |
| P | 120.3 | 109.2 | 95.2 | 85.3 | 75.7 | 63.6 | 54.7 | 45.8 | 33.1 | 1.0 | |
| Hel | Tmax | 32.3 | 32.0 | 31.6 | 31.3 | 30.9 | 30.4 | 30.0 | 29.5 | 28.8 | 28.2 |
| T | 28.3 | 28.0 | 27.5 | 27.2 | 26.7 | 26.2 | 25.7 | 25.2 | 24.4 | 23.7 | |
| Tmin | −17.1 | −16.5 | −15.8 | −15.3 | −14.7 | −13.8 | −13.1 | −12.4 | −11.3 | −10.5 | |
| P | 142.2 | 127.5 | 109.4 | 96.7 | 84.7 | 69.7 | 58.9 | 48.4 | 33.8 | 1.0 | |
| Hmax | 801.6 | 775.7 | 743.8 | 721.3 | 700.2 | 674.2 | 656.0 | 638.8 | 617.7 | 602.9 | |
| H | 692.3 | 679.3 | 662.7 | 650.5 | 638.6 | 623.5 | 612.5 | 601.7 | 588.0 | 577.9 | |
| Gdynia | Tmax | 33.9 | 33.5 | 32.9 | 32.5 | 32.0 | 31.4 | 30.8 | 30.2 | 29.3 | 28.6 |
| T | 30.8 | 30.4 | 29.8 | 29.3 | 28.8 | 28.0 | 27.4 | 26.8 | 25.8 | 25.0 | |
| Tmin | −18.8 | −18.2 | −17.4 | −16.8 | −16.1 | −15.1 | −14.3 | −13.4 | −12.2 | −11.2 | |
| P | 117.1 | 106.1 | 92.4 | 82.6 | 73.3 | 61.5 | 52.8 | 44.1 | 31.8 | 1.0 | |
| Gdańsk | Hmax | 767.7 | 747.2 | 721.8 | 703.5 | 686.1 | 664.4 | 648.9 | 634.2 | 615.8 | 602.6 |
| H | 678.8 | 668.3 | 654.8 | 644.7 | 634.8 | 621.9 | 612.3 | 602.8 | 590.4 | 581.3 | |
| Place | Percentile | Maximum Air Temperature at 2 m AGL [°C] | Mean Air Temperature at 2 m AGL [°C] | Minimum Air Temperature at 2 m AGL [°C] | Precipitation [mm] | Maximum Sea Level [cm] | Mean Sea Level [cm] |
|---|---|---|---|---|---|---|---|
| Świnoujście | 1/100 | −4.6 | −7.7 | −11.2 | 0.1 | 464 | 455 |
| 5/100 | −0.5 | −2.9 | −5.4 | 0.1 | 478 | 471 | |
| 95/100 | 24.7 | 19.4 | 15.8 | 12.0 | 548 | 535 | |
| 99/100 | 29.0 | 22.2 | 18.1 | 22.3 | 576 | 557 | |
| Kołobrzeg | 1/100 | −4.6 | −8.2 | −12.0 | 0.1 | 464 | 458 |
| 5/100 | −0.4 | −3.2 | −6.0 | 0.1 | 478 | 472 | |
| 95/100 | 24.2 | 18.9 | 15.3 | 13.0 | 550 | 538 | |
| 99/100 | 28.8 | 21.7 | 17.4 | 26.1 | 577 | 558 | |
| Ustka | 1/100 | −4.7 | −8.2 | −11.8 | 0.1 | 465 | 459 |
| 5/100 | −0.6 | −3.1 | −6.0 | 0.1 | 478 | 473 | |
| 95/100 | 24.3 | 18.8 | 15.5 | 13.8 | 550 | 539 | |
| 99/100 | 29.0 | 21.7 | 17.8 | 25.7 | 573 | 558 | |
| Łeba | 1/100 | −5.0 | −8.4 | −12.9 | 0.1 | − | − |
| 5/100 | −0.8 | −3.5 | −6.8 | 0.1 | − | − | |
| 95/100 | 24.1 | 18.6 | 14.9 | 13.5 | − | − | |
| 99/100 | 28.5 | 21.5 | 17.3 | 26.2 | − | − | |
| Hel | 1/100 | −4.8 | −7.0 | −9.9 | 0.1 | 464 | 460 |
| 5/100 | −1.0 | −2.8 | −5.0 | 0.1 | 478 | 474 | |
| 95/100 | 23.8 | 18.9 | 15.6 | 12.2 | 548 | 539 | |
| 99/100 | 26.9 | 21.3 | 17.9 | 23.6 | 570 | 556 | |
| Gdynia | 1/100 | −4.8 | −7.5 | −10.5 | 0.1 | − | − |
| 5/100 | −0.9 | −3.0 | −5.4 | 0.1 | − | − | |
| 95/100 | 23.2 | 19.4 | 16.4 | 12.4 | − | − | |
| 99/100 | 26.7 | 21.9 | 18.9 | 23.4 | − | − | |
| Gdańsk | 1/100 | − | − | − | − | 468 | 463 |
| 5/100 | − | − | − | − | 483 | 478 | |
| 95/100 | − | − | − | − | 555 | 545 | |
| 99/100 | − | − | − | − | 578 | 563 |
© 2018 by the authors. Licensee MDPI, Basel, Switzerland. This article is an open access article distributed under the terms and conditions of the Creative Commons Attribution (CC BY) license (http://creativecommons.org/licenses/by/4.0/).
Share and Cite
Tylkowski, J.; Hojan, M. Threshold Values of Extreme Hydrometeorological Events on the Polish Baltic Coast. Water 2018, 10, 1337. https://doi.org/10.3390/w10101337
Tylkowski J, Hojan M. Threshold Values of Extreme Hydrometeorological Events on the Polish Baltic Coast. Water. 2018; 10(10):1337. https://doi.org/10.3390/w10101337
Chicago/Turabian StyleTylkowski, Jacek, and Marcin Hojan. 2018. "Threshold Values of Extreme Hydrometeorological Events on the Polish Baltic Coast" Water 10, no. 10: 1337. https://doi.org/10.3390/w10101337