Article

Influence of Proteins on Transport of Ferrihydrite Particles Formed during Recharge of Groundwater Containing Fe with Reclaimed Water

1
Science and Technology Innovation Center for Municipal Wastewater Treatment and Water Quality Protection, Northeast Normal University, Changchun 130117, China
2
School of Environmental Science & Engineering, Huazhong University of Science and Technology, Wuhan 430074, China
3
Guangdong Shouhui Lantian Engineering and Technology Corporation, Guangzhou 510075, China
4
Jilin Province Key Laboratory of Municipal Wastewater Treatment, Changchun Institute of Technology, Changchun 130012, China
*
Authors to whom correspondence should be addressed.
Water 2018, 10(10), 1329; https://doi.org/10.3390/w10101329
Submission received: 10 June 2018 / Revised: 3 September 2018 / Accepted: 3 September 2018 / Published: 26 September 2018
(This article belongs to the Section Wastewater Treatment and Reuse)

Abstract

:
When reclaimed water was recharged into groundwater containing a low content of ferrous iron, Fe-rich particles were generated and started to transport into the porous medium. X-ray powder diffraction and Mössbauer spectroscopy analysis showed that the generated Fe-rich particles were in a poorly crystallized ferrihydrite phase. After the formation of ferrihydrite particles, the mass loss of contaminants was calculated, which was 88.2% for Al, 93.3% for Zn, and 41.6% for chemical oxygen demand (COD). Protein-like compounds were predominant in the removed COD. Bovine serum albumin (BSA) was used as a model to investigate the effect of proteins on the transport of ferrihydrite particles in porous medium. Results showed that the attachment efficiency of ferrihydrite particles on the porous medium decreased from 100% to 75% with the increase of BSA concentration from 10 mg/L to 100 mg/L. BSA was attached to the surface of ferrihydrite particles via electrostatic adsorption. Thus, the zeta potential of ferrihydrite particles changed from positive to negative, and the particles became less aggregated, thereby enhancing particle mobility. This observation provided evidence that protein residues in reclaimed water enhance the transport of Fe-rich particles in saturated porous medium.

1. Introduction

Reclaimed water is acknowledged as an alternative resource to cope with water crises in terms of quantity and quality [1]. Among all types of reuse strategies, the subsurface storage of reclaimed water is a promising option to meet the growing demand for water, particularly in seasonally arid regions [2,3].
During subsurface storage, the contaminants in reclaimed water were purified through various ways, such as attenuation in groundwater [4], adsorption on the rock surface [5], oxidation reduction, biodegradation, and precipitation [1,3]. Increased attention has been attracted to the chemical precipitation of Fe oxides from the oxidation of ferrous iron, which are ubiquitous in aquifers due to dissolution and mobilization of rocks in the reduction environment caused by natural or artificial activity [6,7,8,9]. Vanderzalm [2] reported that in a full-scale aquifer storage and recovery trial at Bolivar, Australia, ferrous iron concentration increased to 10.1 mg/L in a reduction environment for storage of treated wastewater. After the reduction condition was disrupted by injecting the reclaimed water, ferrous iron was oxidized to ferric iron and rapidly hydrolyzed to form Fe oxides with a positive zeta potential [8]. Fe oxides readily adsorb the dissolved organic matters [5] and are deposited onto the negatively charged porous medium via electrostatic adsorption. Thus, the permeability of the porous medium decreases or even the boreholes clog. In addition, the Fe oxide’s formation depends on environmental conditions chief among which are pH, temperature, and solution composition. Kenari et al. reported ferric hydroxide formation in rapid oxidation of ferrous iron in groundwater [8]. The ferric hydroxide ultimately transformed into a variety of stable Fe oxide, such as ferrihydrite, magnetite, goethite and lepidocrocite. However, in many practical situations (e.g., groundwater recharge system), the nature of Fe oxides is of less interest than the water quality protection.
Well injection of reclaimed water underground is severely hindered by the transport of Fe oxides in groundwater saturated area. Many studies have focused on improving the transport of Fe oxides in porous medium using ferrihydrite as a target. Tosco et al. [10] reported that ferrihydrite particles with mean hydrodynamic radius of 106.7 ± 15.5 nm were transported from 5 m to 30 m at an ionic strength of 2–5 mM in European aquifers. Humic acids were abundant in both groundwater and reclaimed water [11], which considerably increased the moving distances of ferrihydrite particles in sand column due to its ready adsorption of humic acids via enhanced electrostatic and steric forces [12,13]. Protein-like compounds, which are a typically dissolved organic matter in reclaimed water [11], have amino groups that bind positively charged particles, thereby enhancing the repelling forces between ferrihydrite particles and porous medium [14]. Our previous work showed that secondary effluent from typical wastewater treatment plants, which are a type of reclaimed water resource, contain considerable biomass-associated products that are dominated by protein-like compounds [15]. However, minimal attention was focused on the role of protein-like compounds on the ferrihydrite particles transport in a porous medium.
In this study, the effect of protein-like compounds on Fe oxide’s transport during the recharge of groundwater with reclaimed water was investigated. Results showed that the formed Fe oxides were in a ferrihydrite phase. Protein-like compounds from reclaimed water were adsorbed on the formed ferrihydrite particles and promoted the transport of ferrihydrite particles in porous medium.

2. Materials and Methods

2.1. Materials

Groundwater sample was collected from the water inlet of a water plant in Kulunqi (Inner Mongolia, China) and transferred into plastic bottles. The bottles were covered with aluminum foil and placed in the dark. Thereafter, the bottles were stored at 4 °C in a laboratory before use. Meanwhile, the reclaimed water sample was acquired from the outlet of the advanced treatment station of Beijiao wastewater treatment plant (Changchun, China) and preserved similar to the method of groundwater sample collection.
The quartz sand (hereafter called “sand”) was purchased from Sinopharm Chemical Reagent Co. Ltd. (Beijing, China). The sand was size-fractioned between 360 and 600 μm by using nylon sieves. Prior to its use, the sand was cleaned to remove surface metal and organic impurities according to the following steps. First, the sand was ultrasonically cleaned with deionized water for 30 min. The process was repeated twice by soaking with 5 N of NaOH for 24 h. Second, it was rinsed with deionized water until the pH became neutral. Finally, the washed sand was dried at 105 °C for 24 h before it was stored in a vacuum chamber for future use.

2.2. Column Experiments

The column experiment was performed in a plexiglass column with an inner diameter of 2.66 cm and a length of 10.8 cm. The column was wet packed with sand, yielding a porosity of 0.42, and placed vertically in a glove box filled with N2 gas. A total of 10 pore volumes (PV) of groundwater were pumped at the bottom via a peristaltic pump (HL-2D; Shanghai, China) with a velocity of 0.15 cm/min for stabilization. The groundwater was mixed with the reclaimed water at a 1:1 ratio in a 2000 mL conical flask and continuously stirred, and then it was pumped into the column with a velocity of 0.15 cm/min. A 5 mL effluent was collected using a fraction collector (Huxi CBS-A 100, Shanghai, China) at a certain interval and equally divided into two sections. One section was used to analyze the dissolved Fe via centrifugation at 7000 rpm for 5 min to remove solid particles, whereas the other section was used to quantify the total Fe via acid digestion according to the method of Wang et al. [16]. The concentrations of Fe in both sections were determined using an inductively coupled plasma atomic emission spectroscopy (ICP-AES, Profile; Leeman, Sturtevant, WI, USA).
After the 25 PV of the mixed water passed through the column, a 100 mL effluent (called effluent A) was collected to determine the concentrations of metal ions and organic matter. The control experiment was performed using the deoxygenated reclaimed water, which was bubbled with N2 gas to prevent ferrous oxidization. Then, the deoxygenated reclaimed water was mixed with groundwater at the volume ratio of 1:1 in the glove box filled with N2, followed by pumping into the column at a rate of 0.15 cm/min. Subsequently, the effluent of the control, denoted by effluent B, was analyzed for cationic and organic matter concentrations.
The mixed water was filtered through a 0.45 μm membrane and dried at 40 °C in a vacuum freezing dryer (FDU-1200; Riken, Tokyo, Japan) for 2 days to determine its particles. The retained particles on the membrane were scraped gently using a plastic blade and stored in a vacuum freezing dryer before analysis.

2.3. Transport Experiments

2.3.1. Ferrihydrite Synthesis

Ferrihydrite was formed and was predominant in the retained mass particles on the membrane surface according to the X-ray diffraction (XRD) and Mössbauer results. During the formation of ferrihydrite, 41.6% of chemical oxygen demand (COD) was removed due to the removal of protein-like organic matter, as shown in the fluorescence analysis result. Thus, transport experiments were designed to reveal the role of protein in the transport of ferrihydrite under anoxic conditions.
Ferrihydrite was synthesized by ferric Fe precipitation according to the method of Schwertmann et al. [17]. First, 20 g of FeCl3 was dissolved with 200 mL of deionized water in an Erlenmeyer flask and stirred vigorously. Then, the pH was adjusted to 7.5 via dropwise addition of 1 M NaOH. After the brown precipitate of the ferrihydrite settled for 1 h, it was collected via centrifugation at 5500 rpm for 5 min. After discarding the supernatant, the precipitate was suspended in deionized water and washed three times. Thereafter, the precipitate was dried in a vacuum freezing drying oven (FDU-1200, Riken, Japan) for 2 days before storing at room temperature.

2.3.2. Preparation of Ferrihydrite Suspensions

The background electrolyte solution composed of 15 mM of NaCl at pH 7.2 was prepared according to the ionic strength and pH value of the groundwater recharging by the reclaimed water at the volume ratio of 1:1. Then, the solution was bubbled with pure N2 gas for a minimum of 2 h before use. The pH of the electrolyte solution was not changed. Finally, the solution was placed into a glove box filled with N2 gas.
Bovine serum albumin (BSA) was used to simulate the dissolved proteins in the reclaimed water. The BSA powder was dissolved in the electrolyte solution to produce the BSA concentrations of 0, 10, 30, 60, and 100 mg/L. Then, ferrihydrite was added to the BSA solutions to produce the ferrihydrite suspensions with concentrations of 5 and 150 mg/L. After stirring, the suspensions were equilibrated for 24 h in the glove box before use.

2.3.3. Ferrihydrite Transport in Porous Medium

Transport experiments were performed at 17.5 ± 2.5 °C in a glove box filled with N2 by using the same plexiglass column filled with sand, as described in Section 2.2. Then, the O2-free background electrolyte solution (15 mM of NaCl at pH 7.2) was injected using a pump (HL-2D, Shanghai, China) at 0.15 cm/min for 10 PV to standardize the pore-water solution chemistries. Ferrihydrite or BSA influent in a total of 6 PVs was applied to the column and subsequently eluted with a 4 PV background electrolyte solution. In the transport experiments, the influent suspension was applied and continuously stirred to prevent ferrihydrite aggregation and maintain suspension stability. In the control, the column was supplied with a nonreactive tracer (10 mg/L of KBr at pH 7.2) to evaluate the hydraulic properties of the packed column. In all transport experiments, the influent was controlled at 0.15 cm/min by using a peristaltic pump. Finally, the effluent from the column was collected at a certain interval (i.e., 2 min) for the analysis.
After each transport experiment, the retained ferrihydrite in the column was evaluated. The sand was carefully excavated from the column with 1 cm increments (1 cm long for each segment) and dried in a vacuum freezing drying oven (FDU-1200; Riken, Japan) for 2 days. A total of 2.5 g of dried sand was suspended in a 10 mL 1 M HCl solution and placed in 20 mL serum bottles. The bottles were sealed with parafilm and then shaken overnight at 25 °C in a shaking incubator (HZQ-X300; Yiheng, Shanghai, China) at 150 rpm to ensure complete dissolution of the retained ferrihydrite. The retained ferrihydrite was calculated with the following equation:
q B = C B × V B r m C B × V B r  
where qB is the adsorption capacity of ferrihydrite onto the sand (mg/g), m is the weight of the sand (g), r is the weight ratio of Fe in the synthesized ferrihydrite (52.68 wt%), CB is the Fe concentration in the HCl solution (mg/L), and VB is the volume of the HCl solution (L).

2.4. Batch Experiments

Batch experiments were conducted with a series of BSA concentrations for adsorption on ferrihydrite and sand to evaluate the mechanism of the ferrihydrite transport in the sand column. A 0.015 g ferrihydrite or a 5 g sand was added to 100 mL of BSA with concentrations of 10, 30, 60, and 100 mg/L in a 250 mL Erlenmeyer flask. The ion strength (IS) was maintained at 15 mM by adding NaCl and the pH was adjusted to 7.2 by adding 1 M of NaOH. The mixture was agitated overnight. The 20 mL mixture was extracted, and the supernatant was sampled to determine the BSA residue concentration after centrifugation at 5000 rpm for 20 min.
To determine the effect of BSA on ferrihydrite adsorption onto sand, ferrihydrite and sand were added to BSA collectively. First, the ISs and pH in this experiment were adjusted as described previously. Second, different volumes, namely, 10, 30, 60, and 100 mg/L, of BSA were added with ferrihydrite to yield a concentration of 150 mg/L ferrihydrite and stirred for 12 h. These volumes were added with 5 g of sand and stirred overnight. At the end of experiment, 20 mL of the suspension was sampled. After removing sand by settling, the supernatant was mixed with 10 mL of 3 M HCl by shaking at room temperature for 12 h to completely dissolve the ferrihydrite. The Fe concentrations in the solution were determined, and the adsorption capacity of ferrihydrite on the sand was calculated using the following equation:
q F = ( C 0 C F r × 3 2 ) × V F m  
where C0 is the ferrihydrite concentration (150 mg/L), CF is the Fe concentration in the digested solution with 3 M HCl (mg/L), VF is the volume in the batch adsorption experiments (L), and m is the weight of the sand (g).
All the experiments in this study were performed three times, and the average of the values was reported. Various sets of experimental data were subjected to one-way analysis of variance by using Microsoft Excel (v. 2016; Microsoft, Redmond, WA, USA). The differences between the data sets were not statistically significant.

2.5. Characteristics

The XRD patterns of the retained particles on the membrane and the synthesized ferrihydrite were determined using a diffractometer (RAPID-S; Rigaku, Tokyo, Japan) with Cu Kα radiation in 2θ range of 10°–70°. The composition of the retained particles on the membrane was measured using X-ray fluorescence (ARL Advant XP+; Thermo, Waltham, MA, USA). The transmission Mössbauer spectroscopy experiment was performed using a spectrometer (MP500; Oxford, MS, UK) at room temperature. The organic matters in the groundwater, reclaimed water, and effluents A and B were analyzed through fluorescence excitation–emission matrix spectroscopy (EEMs, F4600; Hitachi, Japan) equipped with a 150W Xe lamp at a voltage of 730 V in accordance with the method of Wei et al. [18]. The excitation wavelengths were incremented from 200 to 400 nm at 5 nm intervals, whereas the emission was detected from 280 to 500 nm at 2 nm steps. Protein concentrations in the reclaimed water and effluents were measured with a UV–vis spectrometer (T-6; Persee, Beijing, China) at 595 nm in accordance with the Bradford method [19]. The cations in water were measured using ICP-AES, whereas the ions were measured using ion chromatography (883 Basic; Metrohm AG, Blackheath, Switzerland) coupled with an anion column (Supp 4-250; Metrohm AG, Blackheath, Switzerland). The COD was determined on the basis of the Standard Methods for the Examination of Water and Wastewater, APHA [20]. The Brunauer–Emmett–Teller surface areas of the ferrihydrite and sand were determined via nitrogen adsorption–desorption (TriStar 3000; Micromeritics, Norcross, GA, USA). The zeta potential and volume-averaged hydrodynamic size were measured using a zeta potential analyzer (Nano ZS90; Malvern, UK). Each measurement was repeated 10 times and then averaged. The morphology of the ferrihydrite adsorbed on the sand was observed through a field-emission scanning electron microscope (FEI Co., Hillsboro, OR, USA) equipped with an energy dispersive spectroscopy (EDS).

2.6. Transport Model

The transport of BSA-coated ferrihydrite particles in the saturated sand columns was simulated via an advection–dispersion–reaction model as described by Liu et al. [21]. The model was modified to consider the combined dynamic process of the blocking and depth-dependent straining. The modified model was expressed as follows:
ρ S t + ( n C ) t = n D 2 C z 2 v C z  
where ρ is the bulk density of the porous media, S is the ferrihydrite concentration adsorbed on the sand, t is the time, n is the porosity, D is the dispersion coefficient, C is the concentration, z is the distance traveled in the direction of flow, and v is the average linear pore water velocity.
The adsorption rate of ferrihydrite on the sand was described via the attachment and detachment processes, as expressed in Equation (4).
ρ S t = n k a t t ψ C k d e t ρ S  
where katt is the first-order attachment coefficient, kdet is the first-order detachment coefficient, and ψ is a dimensionless function for the combined process of the dynamic blocking and depth-dependent straining [4] expressed as follows:
ψ = ( 1 S S m a x ) ( d c + z d c ) x  
where Smax is the maximum ferrihydrite particle concentration, dc is the average diameter, and x is an empirical constant for the shape of the retention profile [22].
The model was applied to the experimental data. The parameters kat, kde, and Smax were calculated.

3. Results and Discussion

3.1. Ferrihydrite Formation

When the groundwater was mixed with the reclaimed water containing dissolved oxygen to inject into the column, the ferrous Fe was oxidized by the dissolved oxygen to form Fe oxide, and the water quality of the effluent was improved. Table 1 shows the water quality of the reclaimed water, the groundwater, and effluent A. The cations of Fe in the reclaimed and groundwater were 0.27 and 8.48 mg/L, respectively, whereas that of effluent A was 0.03 mg/L. Other metallic cations, such as Al, Zn, Ca, and Mg, in the reclaimed water were obviously removed, and their mass losses were 88.2%, 93.3%, 22.6%, and 33.8%, respectively. Moreover, the COD in effluent A was 10.3 mg/L, which was slightly higher than that in the groundwater due to the dilution of organics from the reclaimed water. When the combination of the deoxygenated reclaimed and groundwater was injected into the column, the effluent was filtrated through 0.45 µm membrane, no particles were observed on the membrane. In addition, the concentrations of Fe and COD in effluent B were 3.68 and 13.57 mg/g (Table S1). The result was higher than those in effluent A, thereby indicating that the oxidation of ferrous Fe was important for water purification.
The particles in the column effluent were analyzed to investigate the formation and transport of Fe oxides formed in the groundwater by recharging the reclaimed water. The results are shown in Figure 1. The retained particles on the membrane showed that the cations of Fe were 43.2 wt%, which was predominant in the retained particles and four times the Si (Figure 1A). Other cationic ions, such as Mn, Al, and Zn, were lower than 1 wt%. The XRD patterns showed broad peaks at high Bragg angles of 34° and 61° (Figure 1B), corresponding to the superposition of 115 and 300 peaks. Thus, the Fe oxides were in a low crystalline that was also observed in the synthesized ferrihydrite. The Mössbauer spectra of the retained particles (Figure 1C) showed a single doublet corresponding to the isomer shift of 0.34 mm/s and electric quadruple splitting of 0.82 mm/s (Table S2). The result matched well with the poor crystalline ferrihydrite [23]. In the analysis of the relative area of the spectra, Fe was 100% for the doublet in the Mössbauer spectra of the retained particles, thereby indicating that ferrihydrite was the sole crystalline phase of the Fe oxides. Figure 1D shows that after 1 PV, the ferrihydrite particles start to break through the column and present a peak of the effluent in the first 10 PVs. However, the particles were stabilized with the normalized effluent concentration (C/C0) > 0.4.
Ferrihydrite in the retained particles was mainly generated in two steps. First, the low-content ferrous Fe in the groundwater was oxidized to ferric Fe by the dissolved oxygen in the reclaimed water (Equation (6)). Second, the ferric Fe was a strong Lewis acid with pKa of 2.2, which was unstable at neutral or alkaline condition, and was hydrolyzed to form ferrihydrite (Equation (7)). The newly formed ferrihydrite was a weak crystalline Fe oxide formed by combining an iron ion with six hydroxyl groups [24] to confer its ability to ligand metallic cations (denoted by M in Equations (8) and (9)), such as Zn, Ca, and Mg, by the hydroxyl groups on its surface.
Fe 2 + + O 2 + 2 H 2 O Fe 3 + + 4 OH
Fe 3 + + 2 H 2 O FeOOH + 3 H +  
FeO + M 2 + FeOM +  
FeOH + M 2 + + H 2 O FeOMOH + 2 H +  
The ferrihydrite particles were coalesced rapidly. In the incipient coalescence process, metallic cations could be encapsulated in the coalesced ferrihydrite particles by incorporation into ferrihydrite structure or as segregated particle occlusion. Shaw et al. [25] used the time-resolved small-angle X-ray scattering technique to investigate the hydrolysis of Fe3+ and found that the diameter of the formed particles increased from 1.6 nm to 5 nm in 10 min. Martin et al. [26] studied the co-precipitation process of Zn2+ with Fe3+ and the results showed that Zn2+ was homogeneously distributed in the precipitate, in which the tetrahedral polydentate Zn2+ complexes shared apices with Fe3+ octahedral in the ferrihydrite structure. Mn2+ in groundwater also can be converted into MnO2 by dissolved oxygen from the reclaimed water. However, its conversion consumed more energy than Fe2+ to ensure that its conversion rate was low [27]. The unoxidized Mn2+ and other metallic cations were encapsulated into the ferrihydrite particles, yielding a solid solution to retard the release of metallic cations to water.
The newly formed ferrihydrite had a zeta potential of +9.43 mV, whereas the particles formed in the recharging of reclaimed water in the groundwater exhibited a negative zeta potential of −9.55 mV. The particle surface became negatively charged due to the electrostatic adsorption of negatively-charged organics, such as protein and humic acid [28]. Apart from the electrostatic adsorption, the surface sites of ferrihydrite particles might react with the organic ligands, such as hydroxyl, phosphoryl, and carboxyl groups [29], resulting in the formation of ferrihydrite–organic matter complex. This formation might correspond to the mass loss of 41.6% of COD. Zhen et al. [30] reported that polyferric sulfate was rapidly hydrolyzed to flocculate organics, and COD removal efficiency was approximately 80% in the treatment of molasses wastewater; the mechanism for the organic destabilization was charge neutralization/precipitation. After the formation of ferrihydrite–organic matter complex, the strong electrostatic repulsion between the negatively charged particles resulted in less aggregated particles. Thus, the ferrihydrite particles became small. The combined effect of the negatively charged surface and the small particle diameter improved the mobility of ferrihydrite particles in the groundwater saturation area.
The ferrous Fe concentration in the groundwater varied in the range of 0.02–20 mg/L [31]. When the reclaimed water was recharged into the groundwater with high Fe concentration, additional ferrihydrite particles were generated, followed by high mass loss of metallic metals [32] and organic matter from the mixed water. The ferrihydrite particles became less negatively charged because the organic matter loading on the ferrihydrite particles was reduced [33]. To further investigate the effect of the ferrous concentration on the crystalline of the Fe oxide, the particles formed at the ferrous Fe concentration of 1 and 15 mg/L were characterized by the Mössbauer spectrum. The results showed that the ferrihydrite phase also predominated in the two particles (Figure S1), thereby indicating that the ferrihydrite formation was irrelevant to the ferrous Fe concentration.
When the ferrihydrite particle moved to the groundwater saturated area, the surrounding condition was changed, and the release of the metallic metals and organic matter occurred from the surface sites of the ferrihydrite particles and not the interior. Saalfield and Bostick [34] reported that in the groundwater system, the increased concentration of Ca2+ or Mg2+ with HCO3 in groundwater led to As desorption from the ferrihydrite surface. In the incipient coalescence of the new ferrihydrite, metallic metals and organic matter were encapsulated into the ferrihydrite particles. The compounds obtained by ferrihydrite encapsulation were greater than those by adsorption. Eusterhues et al. [35] reported that by co-precipitation with Fe3+, the maximum loading of the organic matter on the ferrihydrite particles was more than 360 mg/g, remarkably higher than that by the adsorption (approximately 120 mg/g). Thus, the metallic metals and organic matter can be effectively stabilized in the ferrihydrite particles, resulting in water quality improvement.

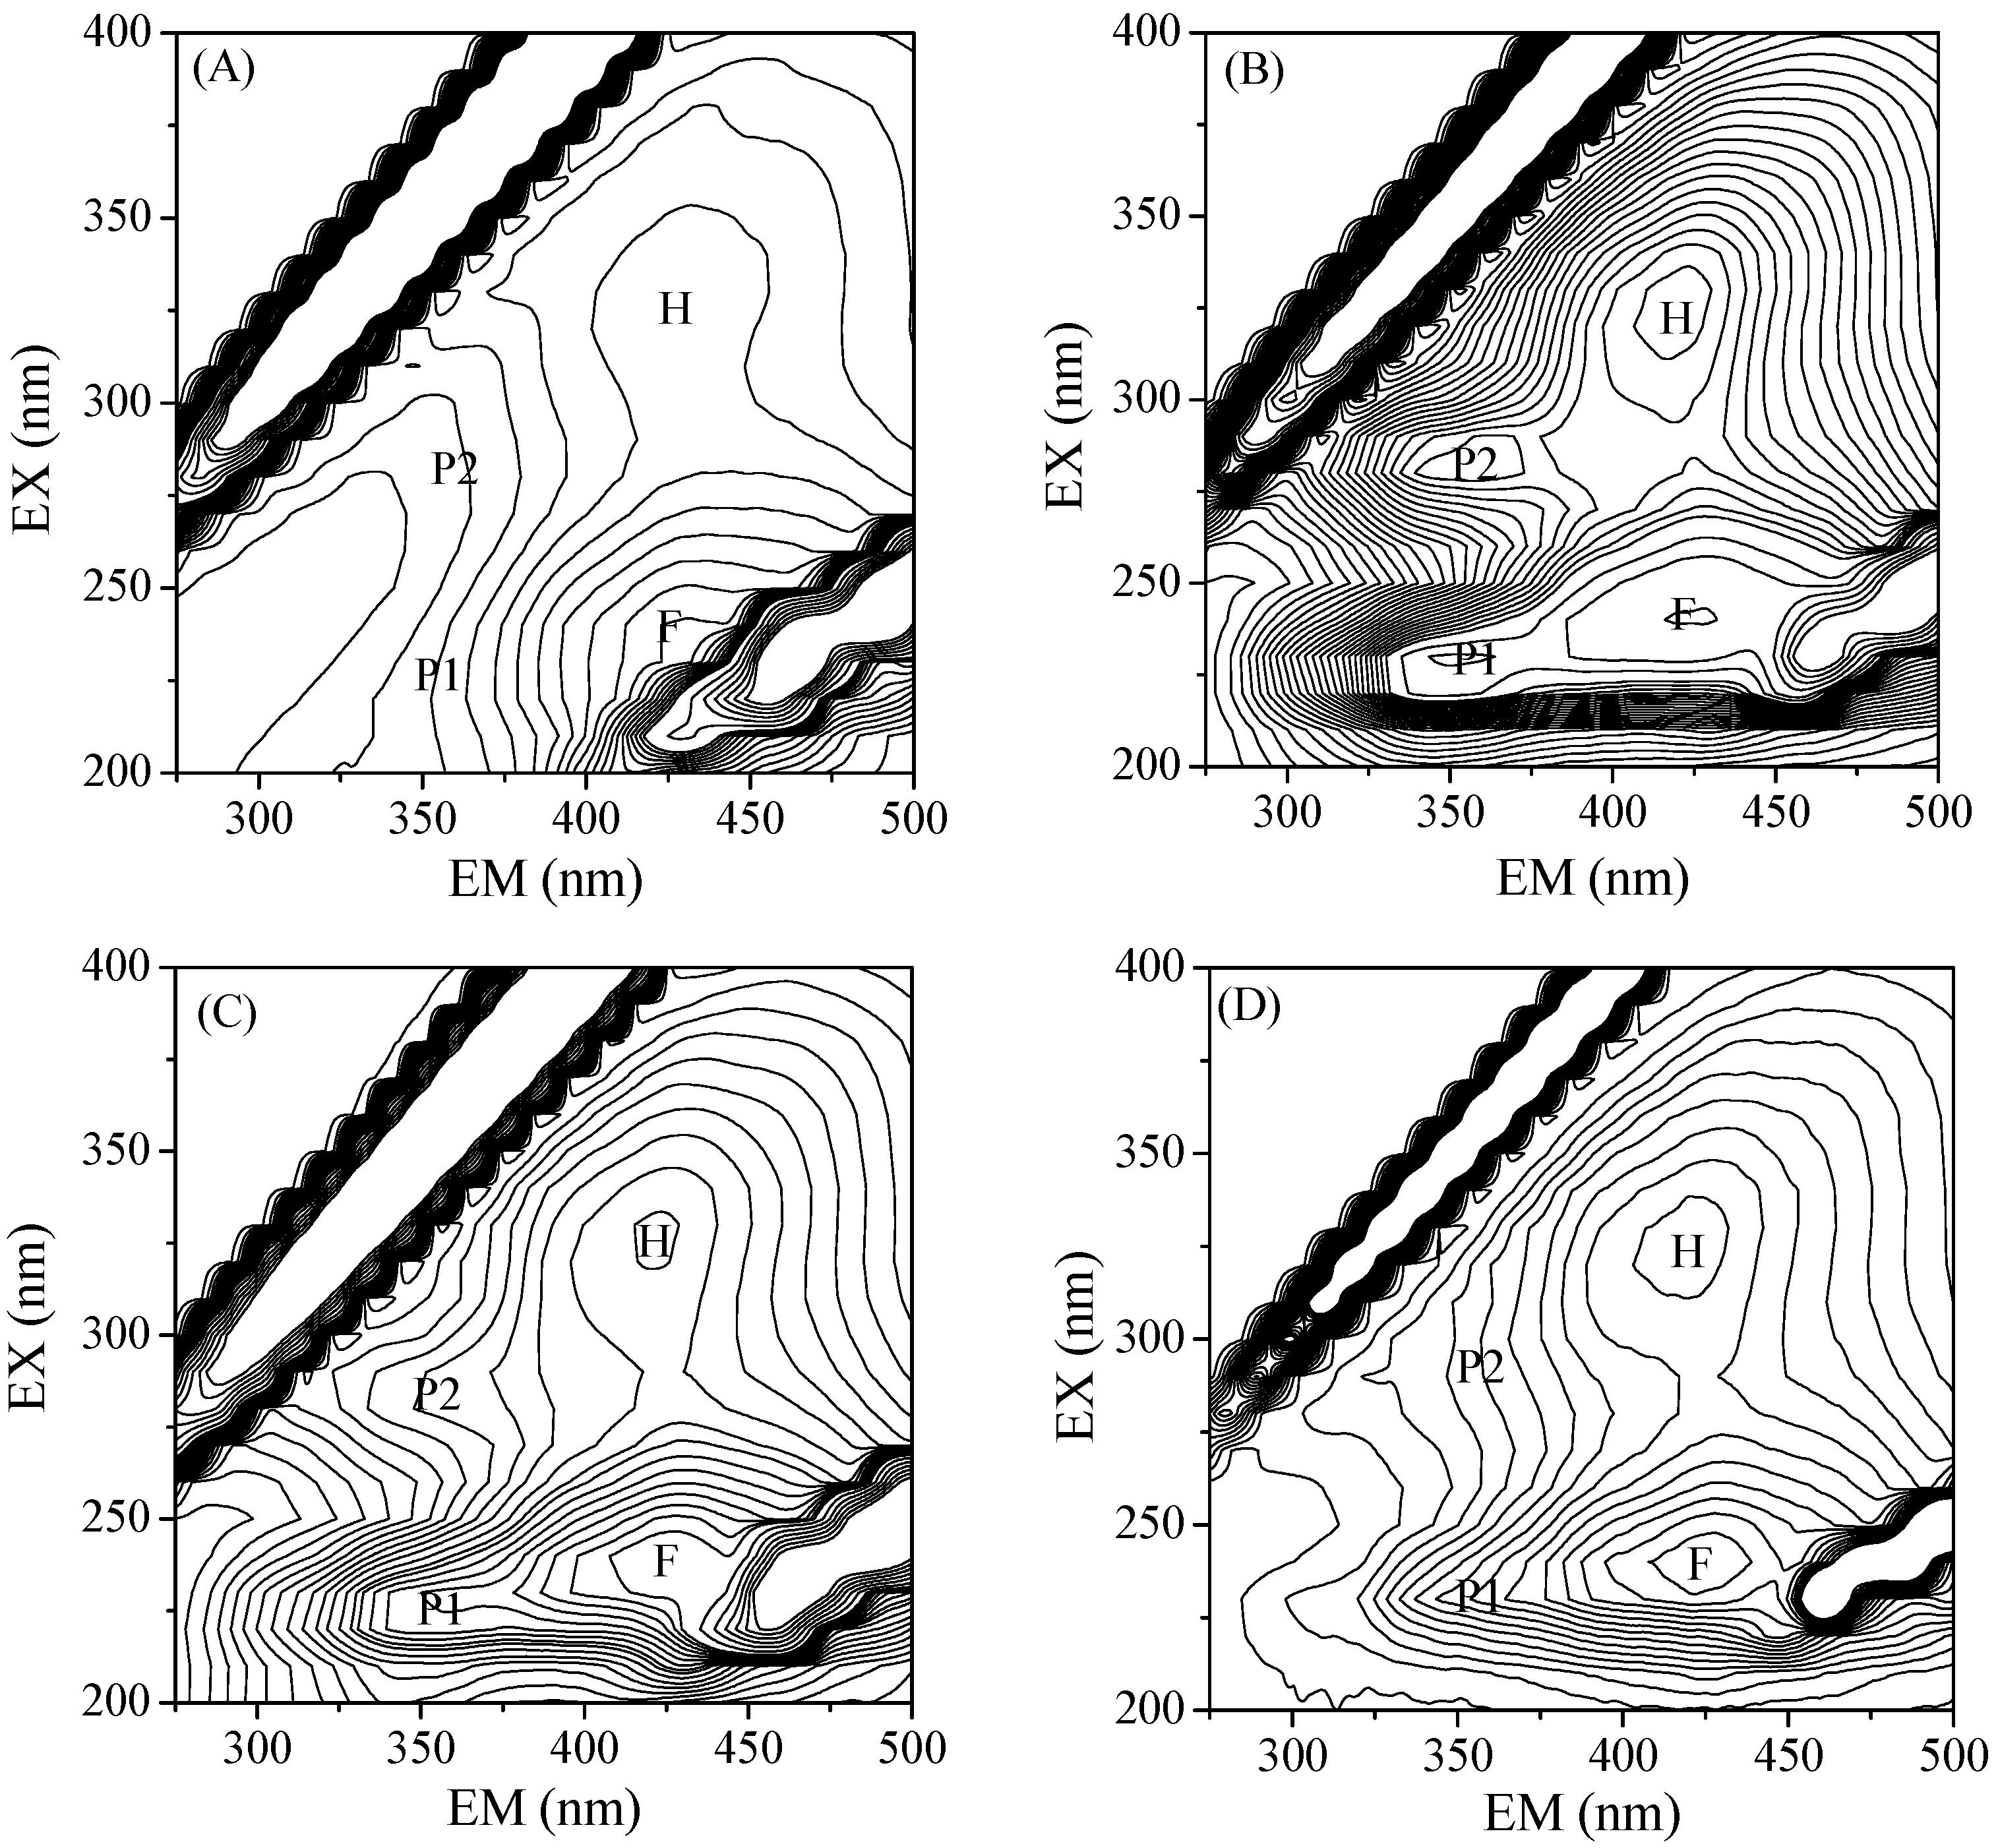
3.2. Organics Adsorbed onto the Ferrihydrite Particles

The organic matters in the groundwater, reclaimed water, and effluents A and B were characterized through EEMs. As shown in Figure 2, three groups of fluorophores are presented in the visual inspection of pre-processed EEMs. These groups were commonly called fulvic-, humic-, and protein-like (specifically tryptophan-like) compounds [18]. In the position at Ex/Em 325/420 nm, a peak (peak H) with 57.5 afu for the humic-like compound was observed in the groundwater (Figure 2A). In reclaimed water, peak H became intensified (Figure 2B), indicating the increase of the humic-like compound. In addition, one peak at Ex/Em 260/425 nm (peak F) for fulvic-like compound and two peaks at Ex/Em 230/335 nm (peak P1) and 275/335 nm (peak P2) for the tryptophan-like compounds were observed in the reclaimed water with fluorescence intensities of 355.2, 304.4, and 219.3 afu, respectively. Figure 2C shows that the fluorescence intensities of peaks H, F, P1, and P2 in effluent B were less than those in the reclaimed water because the concentrations of these compounds in the reclaimed water were diluted by the groundwater. Moreover, unlike effluent B, the intensities of peaks P1 and P2 in effluent A decreased from 174.1 afu to 92.1 afu and from 94.6 afu to 49.7 afu (Figure 2D), respectively, indicating the low concentration of protein-like compounds in the effluent. The intensities of peak H in effluent A slightly decreased from 133.7 afu to 113.7 afu, demonstrating the removal of humic-like compounds after the formation of ferrihydrite particles.
The Fe–OH groups on the surface of the ferrihydrite were deprotonated at a neutral condition to complex with the organic matter, such as the protein-and humic-like compounds. In addition, most of the protein- and humic-like compounds exhibited negative charges in water [13,36]. Thus, the positively charged ferrihydrite had high affinity to the negatively charged organic matter via electrostatic attraction, resulting in the decrease of COD in the effluent.
Table 1 shows that the mass loss of the protein-like compounds is 73.5%, which was predominant in the removed COD. The protein-like compounds in the reclaimed water can be categorized into acidic protein with isoelectric point (PI) of <7 and basic protein with PI of >7. When the groundwater was mixed with the reclaimed water, the pH of the mixed water was approximately 7.2, where the acid and basic proteins contained negative and positive charges, respectively. The adsorption of negatively charged protein was high on the ferrihydrite particles, whereas the positively charged protein adsorption was low (Figure S2). Therefore, the acidic protein adsorption on the ferrihydrite particles contributed to the loss of COD in the effluent.
The effect of humic acid on the mass loss of the protein-like compounds was investigated by adding the humic acid (Sinopharm, Beijing, China) into the groundwater. As shown in Figure S3, when the humic acid addition increased from 1 mg/L to 10 mg/L, the mass loss of the protein-like compounds slightly elevated to 74.3% due mainly to the adsorption of the complex compounds formed by the humic acid reacted with the basic protein [37]. Moreover, the zeta potential of the ferrihydrite particles decreased from −9.62 mV to −9.81 mV. This result demonstrated that the adsorption of the humic-like compounds had a slight influence on the mass loss of protein-like compounds.

3.3. Effect of Protein on the Ferrihydrite Transport

Given that protein-like compounds may attach to the generated ferrihydrite, their functions on the transport of ferrihydrite in porous medium were investigated using BSA as the model protein. The BSA transport curve showed that the normalized BSA concentration (C/C0) at the peak was 0.46 (Figure 3A), which was smaller than that of the tracer, thereby indicating that BSA was retained in the column. The transport of ferrihydrite in the sand column was remarkably affected by its concentrations. The breakthrough curve plateaus of the 5 mg/L ferrihydrite particles were higher than those of the 150 mg/L ones, which were almost 100% retained at the 1–4 cm inlet region of the column (Figure 3C). Figure 4A shows that the sand had a smooth surface, and Si and O were evenly distributed (Figure 4B,C). Unlike Si and O, Fe was distributed sporadically with several blue dots (Figure 4D) indicating the aggregation of the ferrihydrite particles.
When the BSA concentration increased from 10 mg/L to 30, 60, or 100 mg/L (Figure 3B), the retained ferrihydrite (with initial concentration of 150 mg/L) in the column was reduced to 78.7%, 76.9%, and 75%, separately, with the first-order attachment coefficients (Katt) of 1.433, 1.159, and 1.036/min (Table 2). The results indicated that ferrihydrite was readily attached to the sand. However, the attachment weakened when BSA was added. The value of Katt was similar to the transport of 25 mg/L of ferrihydrite particles coated with 5 mg/L humic acid [28]. Moreover, the value of the detachment coefficient (Kdet) was 8 × 10⁻⁴/min, which was nearly one thousandth of the value of Katt, indicating that the subsequent elution by water did not cause a release of ferrihydrite. Therefore, the retained ferrihydrite on the porous media was not washed out by the water flow in a steady state.

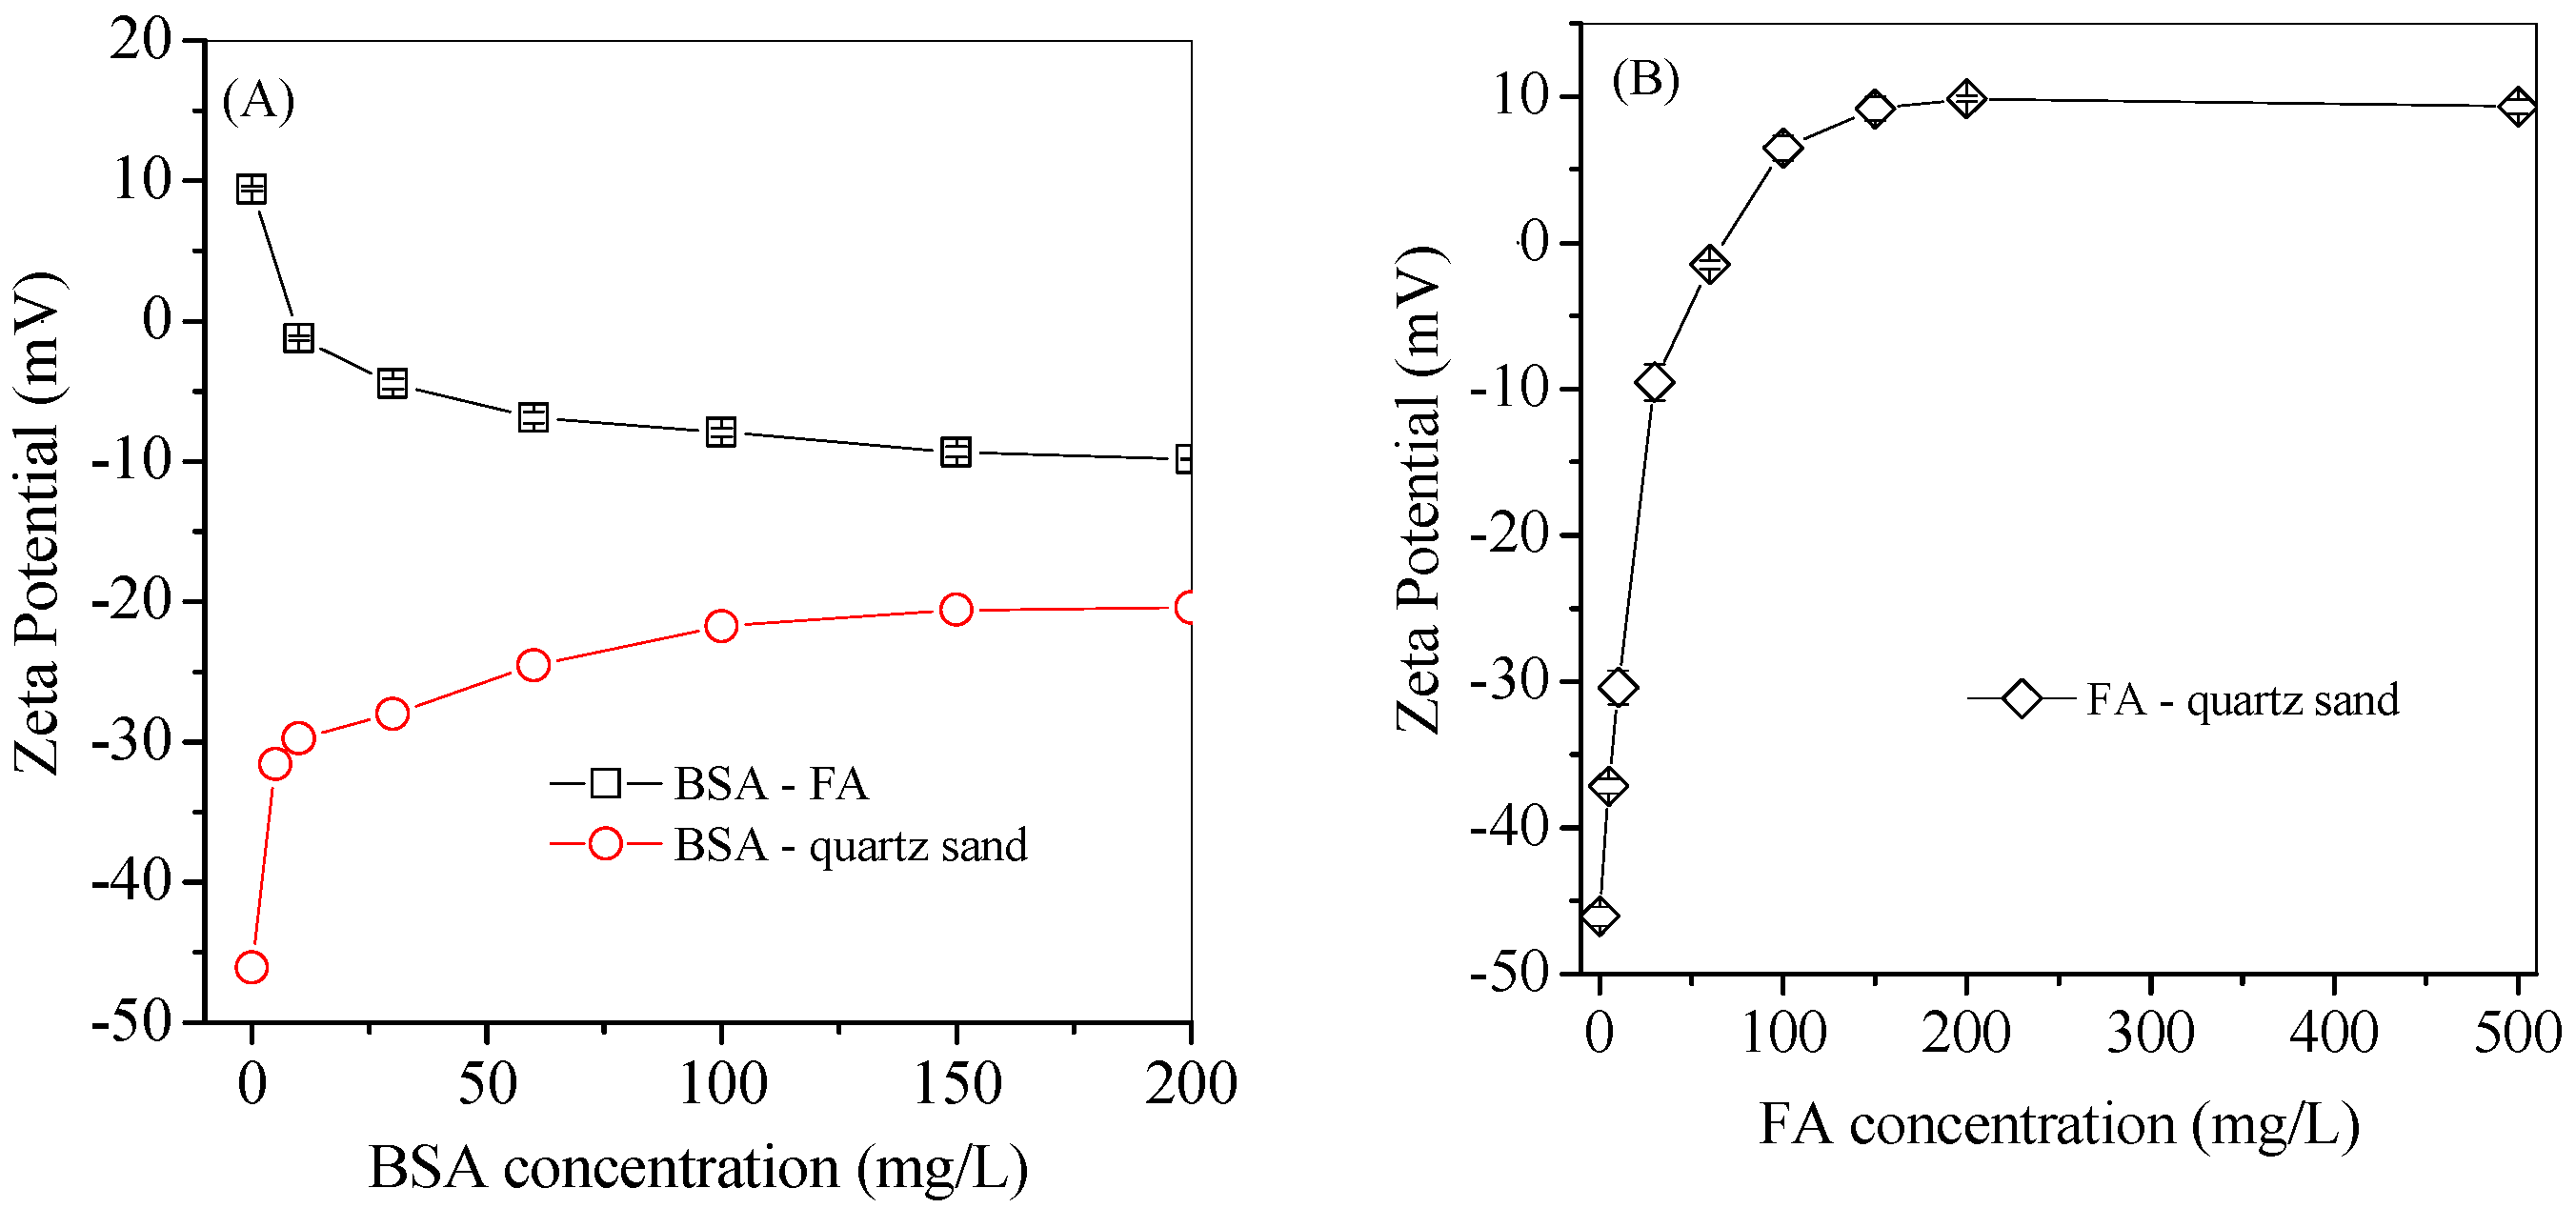
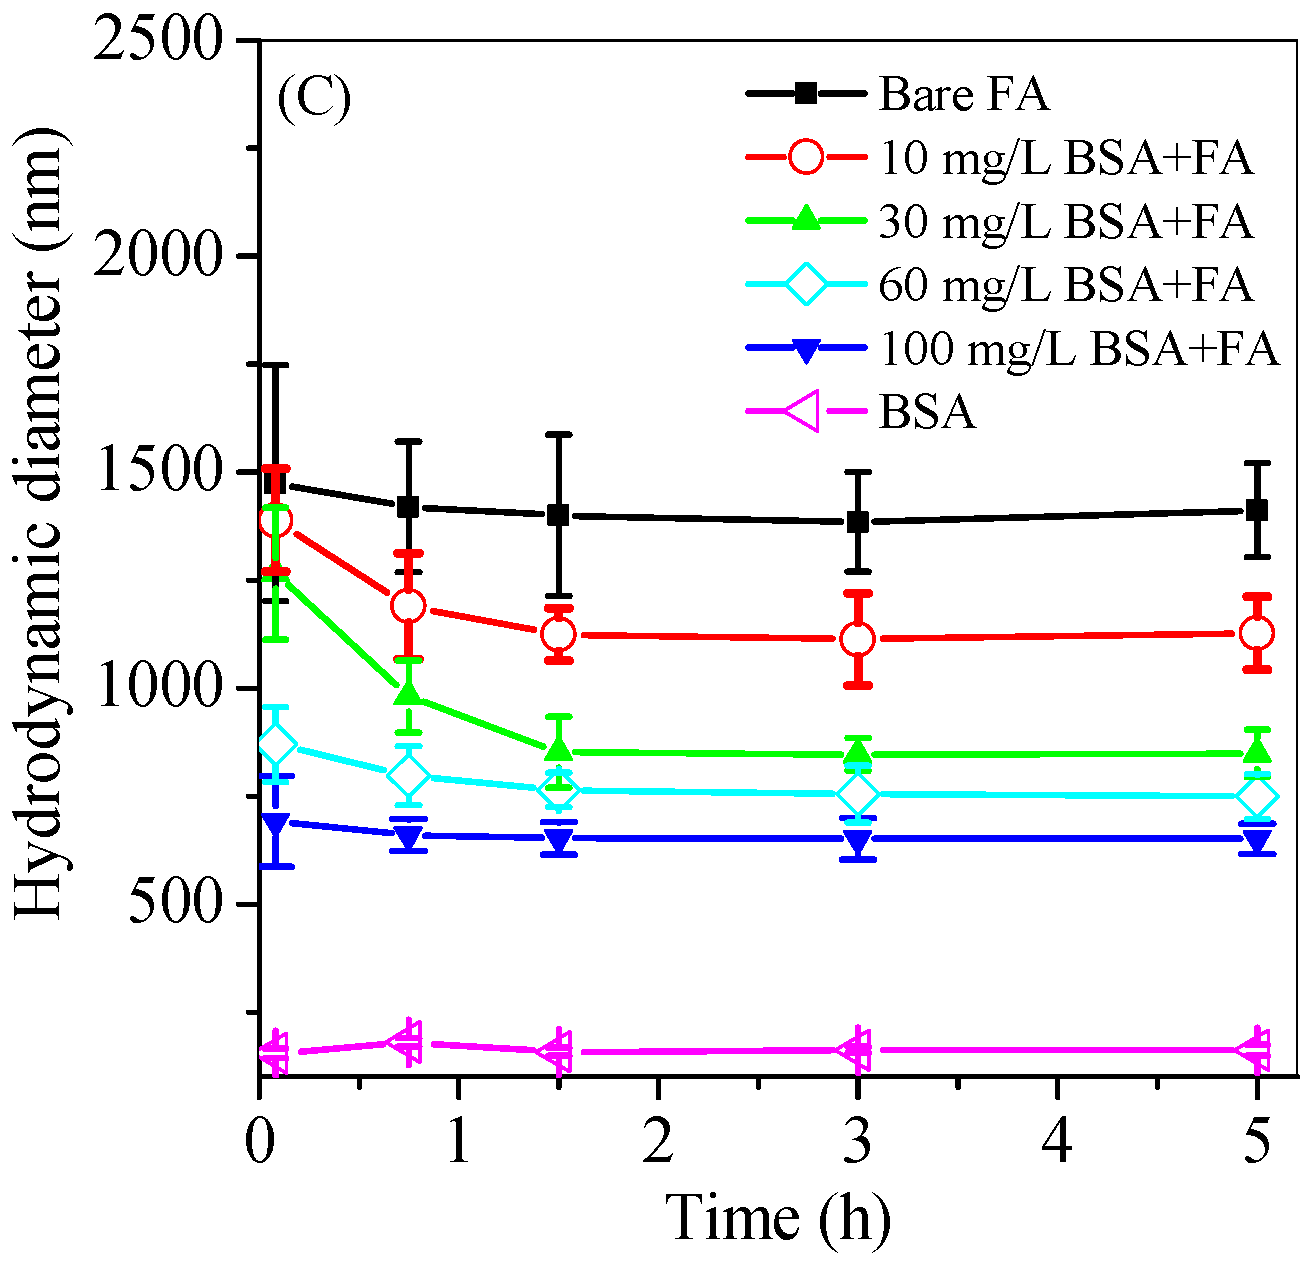
3.4. Protein Adsorption

Figure 5A presents the effect of BSA on the zeta potentials of sand and ferrihydrite. The zeta potential of ferrihydrite at the concentration of 150 mg/L was 9.43 mV, which rapidly dropped to −1.2 mV when BSA was added at the concentration of 10 mg/L, further decreasing to −7.7 mV at the BSA concentration of 100 mg/L. The zeta potential of the sand was −46.1 mV, which increased gradually to −21.8 mV when the BSA concentration was increased to 100 mg/L. When the ferrihydrite concentration was 150 mg/L, the zeta potential of the sand was +9.17 mV (Figure 5B), similar to that of bare ferrihydrite particles.
The BSA molecule was composed of 18 amino acids in which the number of negatively and positively charged amino acids was both three. However, the charged unit of a neutral BSA molecule was −18.01 e [14,19]. Therefore, the BSA was negatively charged and had strong affinity to adsorb into the positively charged ferrihydrite via electrostatic force. Under the action of electrostatic force, the negatively charged BSA molecules entered into the electric double layer of ferrihydrite particles [14]. Thereafter, a strong chemisorption between the BSA molecules and the ferrihydrite particles occurred, in which the amino groups of BSA attached to the surface sites (Fe-O) of ferrihydrite particles via ligand exchange [24], and the other groups of BSA, such as α-carboxyl groups and hydroxyl groups at meta position [14,19], reacted with the O atom on the ferrihydrite surface via interfacial hydrogen bonds and innersphere complexes [29]. When BSA concentration was high in the liquid fraction, more BSA molecules were adsorbed on ferrihydrite particles and thereby BSA coating was gradually generated. The BSA coating overlapped the diffuse layer of the electrical double layer on ferrihydrite particles and changed the zeta potential of ferrihydrite particles from positive to negative.
The surface of the sand was negatively charged and showed a similar trend to BSA for ferrihydrite particles adsorption. When the sand was gradually covered by ferrihydrite particles via chemisorption and surface deposition [38], the overlapping of the diffuse layers of electrical double layers on the sand was formed, and thereby the sand became positively charged.
Unlike BSA adsorption on ferrihydrite particles, BSA attached to the sand through the positively charged amino acids, such as lysine, histidine, and arginine. With the adsorption of BSA into the sand, the BSA stretched to the water due to electrostatic repulsion and steric hindrance from the sand surface [19]. Thus, the shear plane moved outside to reduce the absolute value of the zeta potential of the sand.
The specific surface areas of the ferrihydrite and sand were determined to be 36.1 m2/g and 0.046 m2/g, respectively (Figure 6A). The effect of BSA on the adsorption of ferrihydrite particles on the sand was investigated. The adsorption capacity was normalized with their surface areas. The results are shown in Figure 6B. By increasing the BSA concentrations, the adsorption capacity of ferrihydrite into the sand gradually decreased (Figure 6B), whereas the BSA adsorption on the ferrihydrite particles and sand increased. The synthesized ferrihydrite exhibited a hydrodynamic diameter of 1418.4 nm, indicating the particle aggregation. After BSA was added, the hydrodynamic diameter decreased from 1418 nm to 661 nm (Figure 6C), indicating that ferrihydrite became less aggregated.
The synthesized ferrihydrite was positively charged, thus showing the high normalized adsorption capacity of BSA compared with that of the negatively charged sand. BSA had a remarkable effect on the aggregation of ferrihydrite. When BSA was added, the negatively charged particles were dominant in the suspension, which repelled one other. This condition resulted in a decrease in hydrodynamic diameter. After the ferrihydrite was coated with negatively charged BSA, a strong electrostatic repulsion force was generated between the ferrihydrite and sand, which hindered the attachment of the ferrihydrite particle to the sand.

3.5. Mechanism of Transport of Protein-Mediated Ferrihydrite Particles

After the reclaimed water was injected into the groundwater, the ferrihydrite particles were produced by the reaction of ferrous Fe and dissolved oxygen. The generated ferrihydrite was positively charged, resulting in its strong adsorption into the sand-dominated groundwater-saturated porous media. Thus, its capability to transport into the natural aquifer zone was minimal. Evidently, the positively charged ferrihydrite particles became negative after the adsorption of BSA (Figure 5A). The particles generated in the mixed water also exhibited a negative zeta potential after the adsorption of the organics (Table 1 and Figure 2). Ruggero et al. [6] reported that the zeta potential decreased to −40 mV at pH 7 after the ferrihydrite was co-precipitated with humic acid. After binding the negatively charged compounds, the ferrihydrite particles became stable and transported rapidly in a porous media composed of negatively charged sand. Aishuang et al. [7] found that after the ferrihydrite was suspended in 500 mg/L of poly (acrylic acid) solution, it became negatively charged and showed a breakthrough curve similar to the bromide tracer. Liao et al. [12] observed that when the concentration was higher than 10 mg/L, the negatively charged humic acids, which existed ubiquitously in the groundwater, enhanced the transport of ferrihydrite particles. Meanwhile, the negatively charged protein-like compounds in the reclaimed water were also abundant and easily coated on the ferrihydrite particles via electrostatic attraction, which enhanced the transport of ferrihydrite particles in the porous media.

4. Conclusions

During well injection of reclaimed water into the Fe-containing groundwater, the ferrihydrite particles were generated from the hydrolysis of the oxidized ferrous Fe and moved from the wells to the groundwater-saturated area. Ferrihydrite was the sole crystalline phase of the Fe oxide in the generated particles, which were composed of 43.2 wt% of Fe and other impurities, such as Si, Mn, and organic matter. The ferrihydrite particles exhibited good mobility with the normalized effluent concentration (C/C0) of >0.4 due primarily to the negatively charged surface and less aggregation through the adsorption of protein-like compounds from the reclaimed water. The protein-like compounds in the reclaimed water played a key role in controlling the transport of the ferrihydrite particles. The results of the batch experiments demonstrated that without protein coating, the mobility of the ferrihydrite particles was limited due to the dominant aggregation and deposition of ferrihydrite particles. The transport of the ferrihydrite particles was remarkably enhanced after coating with protein because the zeta potential of the ferrihydrite particles changed from +9.43 mV to −7.7 mV. Furthermore, the electrostatic repulsion between the negatively charged ferrihydrite particles and sands dominated the transport of ferrihydrite particles. Moreover, the ferrihydrite particles became less aggregated and exhibited a small hydrodynamic radius, further improving the mobility of ferrihydrite particles. Notably, the composition of protein-like compounds in the reclaimed water was complex due to the various sources and treatment processes. Therefore, future research should also focus on the transport behaviors of ferrihydrite particles in the groundwater recharge with various sources of reclaimed water.

Supplementary Materials

The following are available online at https://www.mdpi.com/2073-4441/10/10/1329/s1, Table S1: Characteristics of effluent B; Table S2: Mössbauer parameters of ferrite sample. Figure S1: Mössbauer spectrum of particles generated from the mixture of reclaimed water with groundwater containing (A) 1 mg/L and (B) 15 mg/L Fe2+ separately. Figure S2: Adsorption of lysozyme (LSZ) and BSA on the ferrihydrite particles. Here, the initial concentration of LSZ and BSA is 100 mg/L. Figure S3: Effect of humic acid on the zeta potential of ferrihydrite particles and the mass loss of protein-like compounds during groundwater recharge with reclaimed water.

Author Contributions

Investigation, S.Z., J.Z., W.F. and Y.Y.; Resources, M.H. and D.B.; Writing-Review & Editing, S.Z., Y.C. and Y.Y.; Funding Acquisition, J.Y. and L.Z.

Funding

This research was funded by National Natural Science Foundation of China [51578118, 51778117, 51508079, 51678273, and 51408110], Major Science and Technology Program for Water Pollution Control and Treatment of China [2014ZX07201-011-004-2], the Long-term Program in “1000 Talent Plan for High-Level Foreign Experts” [WQ20142200209], and the Fundamental Research Funds for the Central Universities [2412017QD021].

Conflicts of Interest

The authors declare no conflict of interest.

References

  1. Overacre, R.; Clinton, T.; Pyne, D.; Snyder, S.; Dillon, P. Reclaimed water aquifer storage and recovery: Potential changes in water quality. Proc. Water Environ. Fed. 2006, 2006, 1339–1360. [Google Scholar] [CrossRef]
  2. Vanderzalm, J.; Le Gal La Salle, C.; Hutson, J.; Dillon, P. Behaviour of metals during reclaimed water aquifer storage and recovery. In Proceedings of the EGS-AGU-EUG Joint Assembly, Nice, France, 6–11 April 2003. [Google Scholar]
  3. Shareef, A.; Page, D.; Vanderzalm, J.; Williams, M.; Gupta, V.V.; Dillon, P.; Kookana, R. Biodegradation of simazine and diuron herbicides under aerobic and anoxic conditions relevant to managed aquifer recharge of storm water. Clean Soil Air Water 2014, 42, 745–752. [Google Scholar] [CrossRef]
  4. Bradford, S.A.; Bettahar, M. Concentration dependent transport of colloids in saturated porous media. J. Contam. Hydrol. 2006, 82, 99–117. [Google Scholar] [CrossRef] [PubMed]
  5. Karlsson, T.; Persson, P. Complexes with aquatic organic matter suppress hydrolysis and precipitation of Fe(III). Chem. Geol. 2012, 322, 19–27. [Google Scholar] [CrossRef]
  6. Angelico, R.; Ceglie, A.; He, J.Z.; Liu, Y.R.; Palumbo, G.; Colombo, C. Particle size, charge and colloidal stability of humic acids coprecipitated with ferrihydrite. Chemosphere 2014, 99, 239–247. [Google Scholar] [CrossRef] [PubMed]
  7. Xiang, A.; Yan, W.; Koel, B.E.; Jaffé, P.R. Poly(acrylic acid) coating induced 2-line ferrihydrite nanoparticle transport in saturated porous media. J. Nanopart. Res. 2013, 15, 1–9. [Google Scholar] [CrossRef]
  8. Kenari, S.L.D.; Barbeau, B. Size and zeta potential of oxidized iron and manganese in water treatment: Influence of pH, ionic strength, and hardness. J. Environ. Eng. 2016, 142, 04016010. [Google Scholar] [CrossRef]
  9. Tokoro, C.; Yatsugi, Y.; Koga, H.; Owada, S. Sorption mechanisms of arsenate during coprecipitation with ferrihydrite in aqueous solution. Environ. Sci. Technol. 2009, 44, 638–643. [Google Scholar] [CrossRef] [PubMed]
  10. Tosco, T.; Bosch, J.; Meckenstock, R.U.; Sethi, R. Transport of ferrihydrite nanoparticles in saturated porous media: Role of ionic strength and flow rate. Environ. Sci. Technol. 2012, 46, 4008–4015. [Google Scholar] [CrossRef] [PubMed]
  11. Hu, H.Y.; Du, Y.; Wu, Q.Y.; Zhao, X.; Tang, X.; Chen, Z. Differences in dissolved organic matter between reclaimed water source and drinking water source. Sci. Total Environ. 2016, 551, 133–142. [Google Scholar] [CrossRef] [PubMed]
  12. Liao, P.; Li, W.; Wang, D.; Jiang, Y.; Pan, C.; Fortner, J.D.; Yuan, S. Effect of reduced humic acid on the transport of ferrihydrite nanoparticles under anoxic conditions. Water. Res. 2017, 109, 347–357. [Google Scholar] [CrossRef] [PubMed]
  13. Zhou, J.; Zhang, W.; Liu, D.; Wang, Z.; Li, S. Influence of humic acid on the transport and deposition of colloidal silica under different hydrogeochemical conditions. Water 2016, 9, 10. [Google Scholar] [CrossRef]
  14. Allen, M.; Douglas, T.; Nest, D.; Schoonen, M.; Strongin, D. Charge development on ferritin: An electrokinetic study of a protein containing a ferrihydrite nanoparticle. ACS Symp. Ser. 2005, 890, 226–229. [Google Scholar]
  15. Cui, X.; Zhou, D.; Fan, W.; Huo, M.; Crittenden, J.C.; Yu, Z.; Ju, P.; Wang, Y. The effectiveness of coagulation for water reclamation from a wastewater treatment plant that has a long hydraulic and sludge retention times: A case study. Chemosphere 2016, 157, 224–231. [Google Scholar] [CrossRef] [PubMed]
  16. Wang, D.; Paradelo, M.; Bradford, S.A.; Peijnenburg, W.J.; Chu, L.; Zhou, D. Facilitated transport of Cu with hydroxyapatite nanoparticles in saturated sand: Effects of solution ionic strength and composition. Water Res. 2011, 45, 5905–5915. [Google Scholar] [CrossRef] [PubMed]
  17. Cornell, R.M.; Schwertmann, U. The Iron Oxides: Structure, Properties, Reactions, Occurences and Uses; John Wiley & Sons: Hoboken, NJ, USA, 2003. [Google Scholar]
  18. Wei, Q.; Yan, C.; Liu, J.; Luo, Z.; Xu, Q.; Zhang, X.; Chow, C.W.; Chong, M.N. Multistep, microvolume resin fractionation combined with 3D fluorescence spectroscopy for improved DOM characterization and water quality monitoring. Environ. Monit. Assess. 2013, 185, 3233–3241. [Google Scholar] [CrossRef] [PubMed]
  19. Rezwan, K.; Meier, L.P.; Rezwan, M.; Vörös, J.; Textor, M.; Gauckler, L.J. Bovine serum albumin adsorption onto colloidal Al2O3 particles: A new model based on zeta potential and UV-vis measurements. Langmuir 2004, 20, 10055–10061. [Google Scholar] [CrossRef] [PubMed]
  20. APHA; AWWA; WEF. Standard Methods for Examination of Water and Wastewater, 22nd ed.; American Public Health Association: Washington, DC, USA, 2012. [Google Scholar]
  21. Liu, L.; Gao, B.; Wu, L.; Sun, Y.; Zhou, Z. Effects of surfactant type and concentration on graphene retention and transport in saturated porous media. Chem. Eng. J. 2015, 262, 1187–1191. [Google Scholar] [CrossRef]
  22. Bradford, S.A.; Simunek, J.; Bettahar, M.; van Genuchten, M.T.; Yates, S.R. Modeling colloid attachment, straining, and exclusion in saturated porous media. Environ. Sci. Technol. 2003, 37, 2242–2250. [Google Scholar] [CrossRef] [PubMed]
  23. Chistyakova, N.I.; Rusakov, V.S.; Shapkin, A.A.; Starokurov, Y.V.; Kazakov, A.P.; Zavarzina, D.G.; Zhilina, T.N.; Lančok, A.; Kohout, J. Mössbauer study of biogenic formation processes of iron minerals. In Proceedings of the International Conference on Mössbauer Spectroscopy in Materials Science, Olomouc, Czech Republic, 11–15 June 2012. [Google Scholar]
  24. Zhao, J.; Huggins, F.E.; Feng, Z.; Huffman, G.P. Ferrihydrite: Surface structure and its effects on phase transformation. Clays Clay Miner. 1994, 42, 737–746. [Google Scholar]
  25. Shaw, S.; Benning, L.G.; Terrill, N.J.; Davidson, L. Nucleation and growth of iron oxyhydroxide nanoparticles from solution: An in situ time-resolved Small Angle X-ray Scattering (SAXS) study. Geochim. Cosmochim. Acta 2004, 68, A158. [Google Scholar]
  26. Martin, S.; Zhu, C.; Rule, J.; Nuhfer, N.T.; Ford, R.; Hedges, S.; Soong, Y. A high-resolution TEM-AEM, pH titration, and modeling study of Zn2+ coprecipitation with ferrihydrite. Geochim. Cosmochim. Acta 2005, 69, 1543–1553. [Google Scholar] [CrossRef]
  27. Chi-Chuan, K.; Wen-Hsiang, C.; Meng-Wei, W.; Piaw, P.; Jatuporn, W.; Kun-Feng, L. The preliminary study of iron and manganese removal from groundwater by NaOCl oxidation and MF filtration. Sustain. Environ. Res. 2012, 22, 25–30. [Google Scholar]
  28. Ma, J.; Guo, H.; Lei, M.; Li, Y.; Weng, L.; Chen, Y.; Ma, Y.; Deng, Y.; Feng, X.; Xiu, W. Enhanced transport of ferrihydrite colloid by chain-shaped humic acid colloid in saturated porous media. Sci. Total Environ. 2018, 621, 1581–1590. [Google Scholar] [CrossRef] [PubMed]
  29. Shen, J.; Huang, G.; An, C.; Xin, X.; Huang, C.; Rosendahl, S. Removal of Tetrabromobisphenol A by Adsorption on Pinecone-Derived Activated Charcoals: Synchrotron FTIR, Kinetics and Surface Functionality Analyses. Bioresour. Technol. 2018, 247, 812–820. [Google Scholar] [CrossRef] [PubMed]
  30. Liang, Z.; Wang, Y.; Zhou, Y.; Liu, H.; Wu, Z. Hydrolysis and coagulation behavior of polyferric sulfate and ferric sulfate. Water Sci. Technol. 2009, 59, 1129–1135. [Google Scholar] [CrossRef] [PubMed] [Green Version]
  31. Voegelin, A.; Kaegi, R.; Berg, M.; Nitzsche, K.S.; Kappler, A.; Lan, V.M.; Trang, P.T.; Göttlicher, J.; Steininger, R. Solid-phase characterisation of an effective household sand filter for As, Fe and Mn removal from groundwater in Vietnam. Environ. Chem. 2014, 11, 566–578. [Google Scholar] [CrossRef]
  32. Seda, N.N.; Koenigsmark, F.; Vadas, T.M. Sorption and coprecipitation of copper to ferrihydrite and humic acid organomineral complexes and controls on copper availability. Chemosphere 2016, 147, 272–278. [Google Scholar] [CrossRef] [PubMed] [Green Version]
  33. Ajmal, Z.; Muhmood, A.; Usman, M.; Kizito, S.; Lu, J.; Dong, R.; Wu, S. Phosphate removal from aqueous solution using iron oxides: Adsorption, desorption and regeneration characteristics. J. Colloid Interface Sci. 2018, 528, 145–155. [Google Scholar] [CrossRef] [PubMed]
  34. Saalfield, S.L.; Bostick, B.C. Synergistic effect of calcium and bicarbonate in enhancing arsenate release from ferrihydrite. Geochim. Cosmochim. Acta 2010, 74, 5171–5186. [Google Scholar] [CrossRef]
  35. Eusterhues, K.; Rennert, T.; Knicker, H.; Totsche, K.U. Association of organic matter and ferrihydrite: Adsorption versus coprecipitation. In Proceedings of the EGU General Assembly, Vienna, Austria, 19–24 April 2009. [Google Scholar]
  36. Liu, N.N.; Li, B.; Liu, R.X.; Song, Y.H.; Wu, W. Fluorescence characteristics of fractionated colloidal organic matter in freshwater from Hunhe and Taizihe watersheds. Huan Jing Ke Xue 2014, 35, 4103–4110. [Google Scholar] [PubMed]
  37. Norde, W.; Tan, W.; Koopal, L. Protein Adsorption at Solid Surfaces and Protein Complexation with Humic Acids. J. Soil Sci. Plant Nutr. 2008, 8, 64–74. [Google Scholar] [CrossRef] [Green Version]
  38. Jiang, W.; Sun, C.; Yang, X. Adsorption and zeta potential studies relevant to hematite ore reverse froth flotation. Miner. Metall. Process. 2012, 29, 148–155. [Google Scholar]
Figure 1. Composition (A); XRD patterns (B); Mössbauer spectra (C) of the retained particles on the membrane, and (D) the breakthrough curves of the ferrihydrite particles formed in the mixed water at the flow velocity of 0.15 cm/min.
Water 10 01329 g001
Figure 2. 3D fluorescence spectra of groundwater (A), reclaimed water (B), effluent B (C), and effluent A (D). In the figures, the contour interval is 10 afu. P1 and P2 represent the peaks of protein-like compounds. F and H represent the peak of the fulvic-and humic-like compounds, respectively.
Water 10 01329 g002
Figure 3. (A) Breakthrough curves of 0, 5, and 150 mg/L of ferrihydrite in 10 mg/L BSA solution by using the KBr tracer as control; (B) Breakthrough curves of 150 mg/L of ferrihydrite in 10, 30, 60, and 100 mg/L BSA solutions; (C) Spatial distribution of BSA-coated ferrihydrite in the column. In the figures, the KBr electrolyte is 10 mg/L, the flow rate is 0.15 cm/min, and the pH is 7.2. FA represents the ferrihydrite particles.
Water 10 01329 g003
Figure 4. (A) SEM image of the sand sampled at inlet of column and corresponding EDS mappings of (B) Si, (C) O, and (D) Fe distributions. In the figure, the sand was extracted from the column in which the influent is composed of 150 mg/L of ferrihydrite particles and 10 mg/L of BSA.
Water 10 01329 g004
Figure 5. (A) Zeta potential of ferrihydrite and sand in BSA concentration range of 0–200 mg/L and (B) zeta potential of sand in concentrations of ferrihydrite particles ranging from 0 to 500 mg/L. In the figures, the initial concentrations of the ferrihydrite and sand are 150 mg/L and 50 g/L, respectively, the pH is 7.2, and the IS is 0.015 M of NaCl. FA represents the ferrihydrite particles.
Water 10 01329 g005
Figure 6. (A) N2 adsorption–desorption isotherm of ferrihydrite particles and sand; (B) effect of BSA on the adsorption of ferrihydrite particles into the sand and BSA adsorption onto the ferrihydrite and sand; and (C) hydrodynamic diameter of the ferrihydrite particles at varying initial concentrations (i.e., 10, 30, 60, and 100 mg/L) of BSA. In the figures, the initial concentration of ferrihydrite and sand are 150 mg/L and 50 g/L, respectively; the pH is 7.2; and the IS is 0.015 M of NaCl. FA represents the ferrihydrite particles.
Water 10 01329 g006aWater 10 01329 g006b
Table 1. Characteristics of the influent and effluent (unit: mg/L).
ElementsReclaimed WaterGroundwaterEffluent AMass Loss (%)
Fe0.278.480.0399.3
Zn0.080.010.00393.3
Mn0.0050.250.0192.2
Al0.150.020.0188.2
Protein-like compounds8.60.021.1473.5
COD25.589.5310.341.6
Si1.689.573.3141.2
Mg11.490.263.8933.8
Ca15.435.197.9822.6
Na166.6554.54101.48.3
pH6.77.37.2
Table 2. Attachment dynamics of ferrihydrite to sand with BSA.
Experiment NumberRdkatt (/min)Kdet (/min)Smax (mg/g)R2
10 mg/L BSA54.0%0.42001.2640.97
5 mg/L FA * in 10 mg/L of BSA solution48.5%0.7188 × 1045.4940.92
150 mg/L FA * in 30 mg/L of BSA solution78.7%1.4338 × 10427.0870.93
150 mg/L FA * in 60 mg/L of BSA solution76.9%1.1598 × 10421.7420.95
150 mg/L FA * in 100 mg/L of BSA solution75.0%1.0368 × 10417.4600.96
Notes: * FA represents ferrihydrite particles. Rd, retention percentage; katt, first-order retention coefficient; kdet, first-order detachment coefficient; Smax, maximum adsorption capacity; and R2, R-squared.

