Monthly Prediction of Drought Classes Using Log-Linear Models under the Influence of NAO for Early-Warning of Drought and Water Management


Abstract
1. Introduction
2. Data and Methods
2.1. Standardized Drought Indicators and the NAO
2.2. Correlations between SPEI/SPI and NAO
2.3. Modeling
2.4. Model Performance
3. Results and Discussion
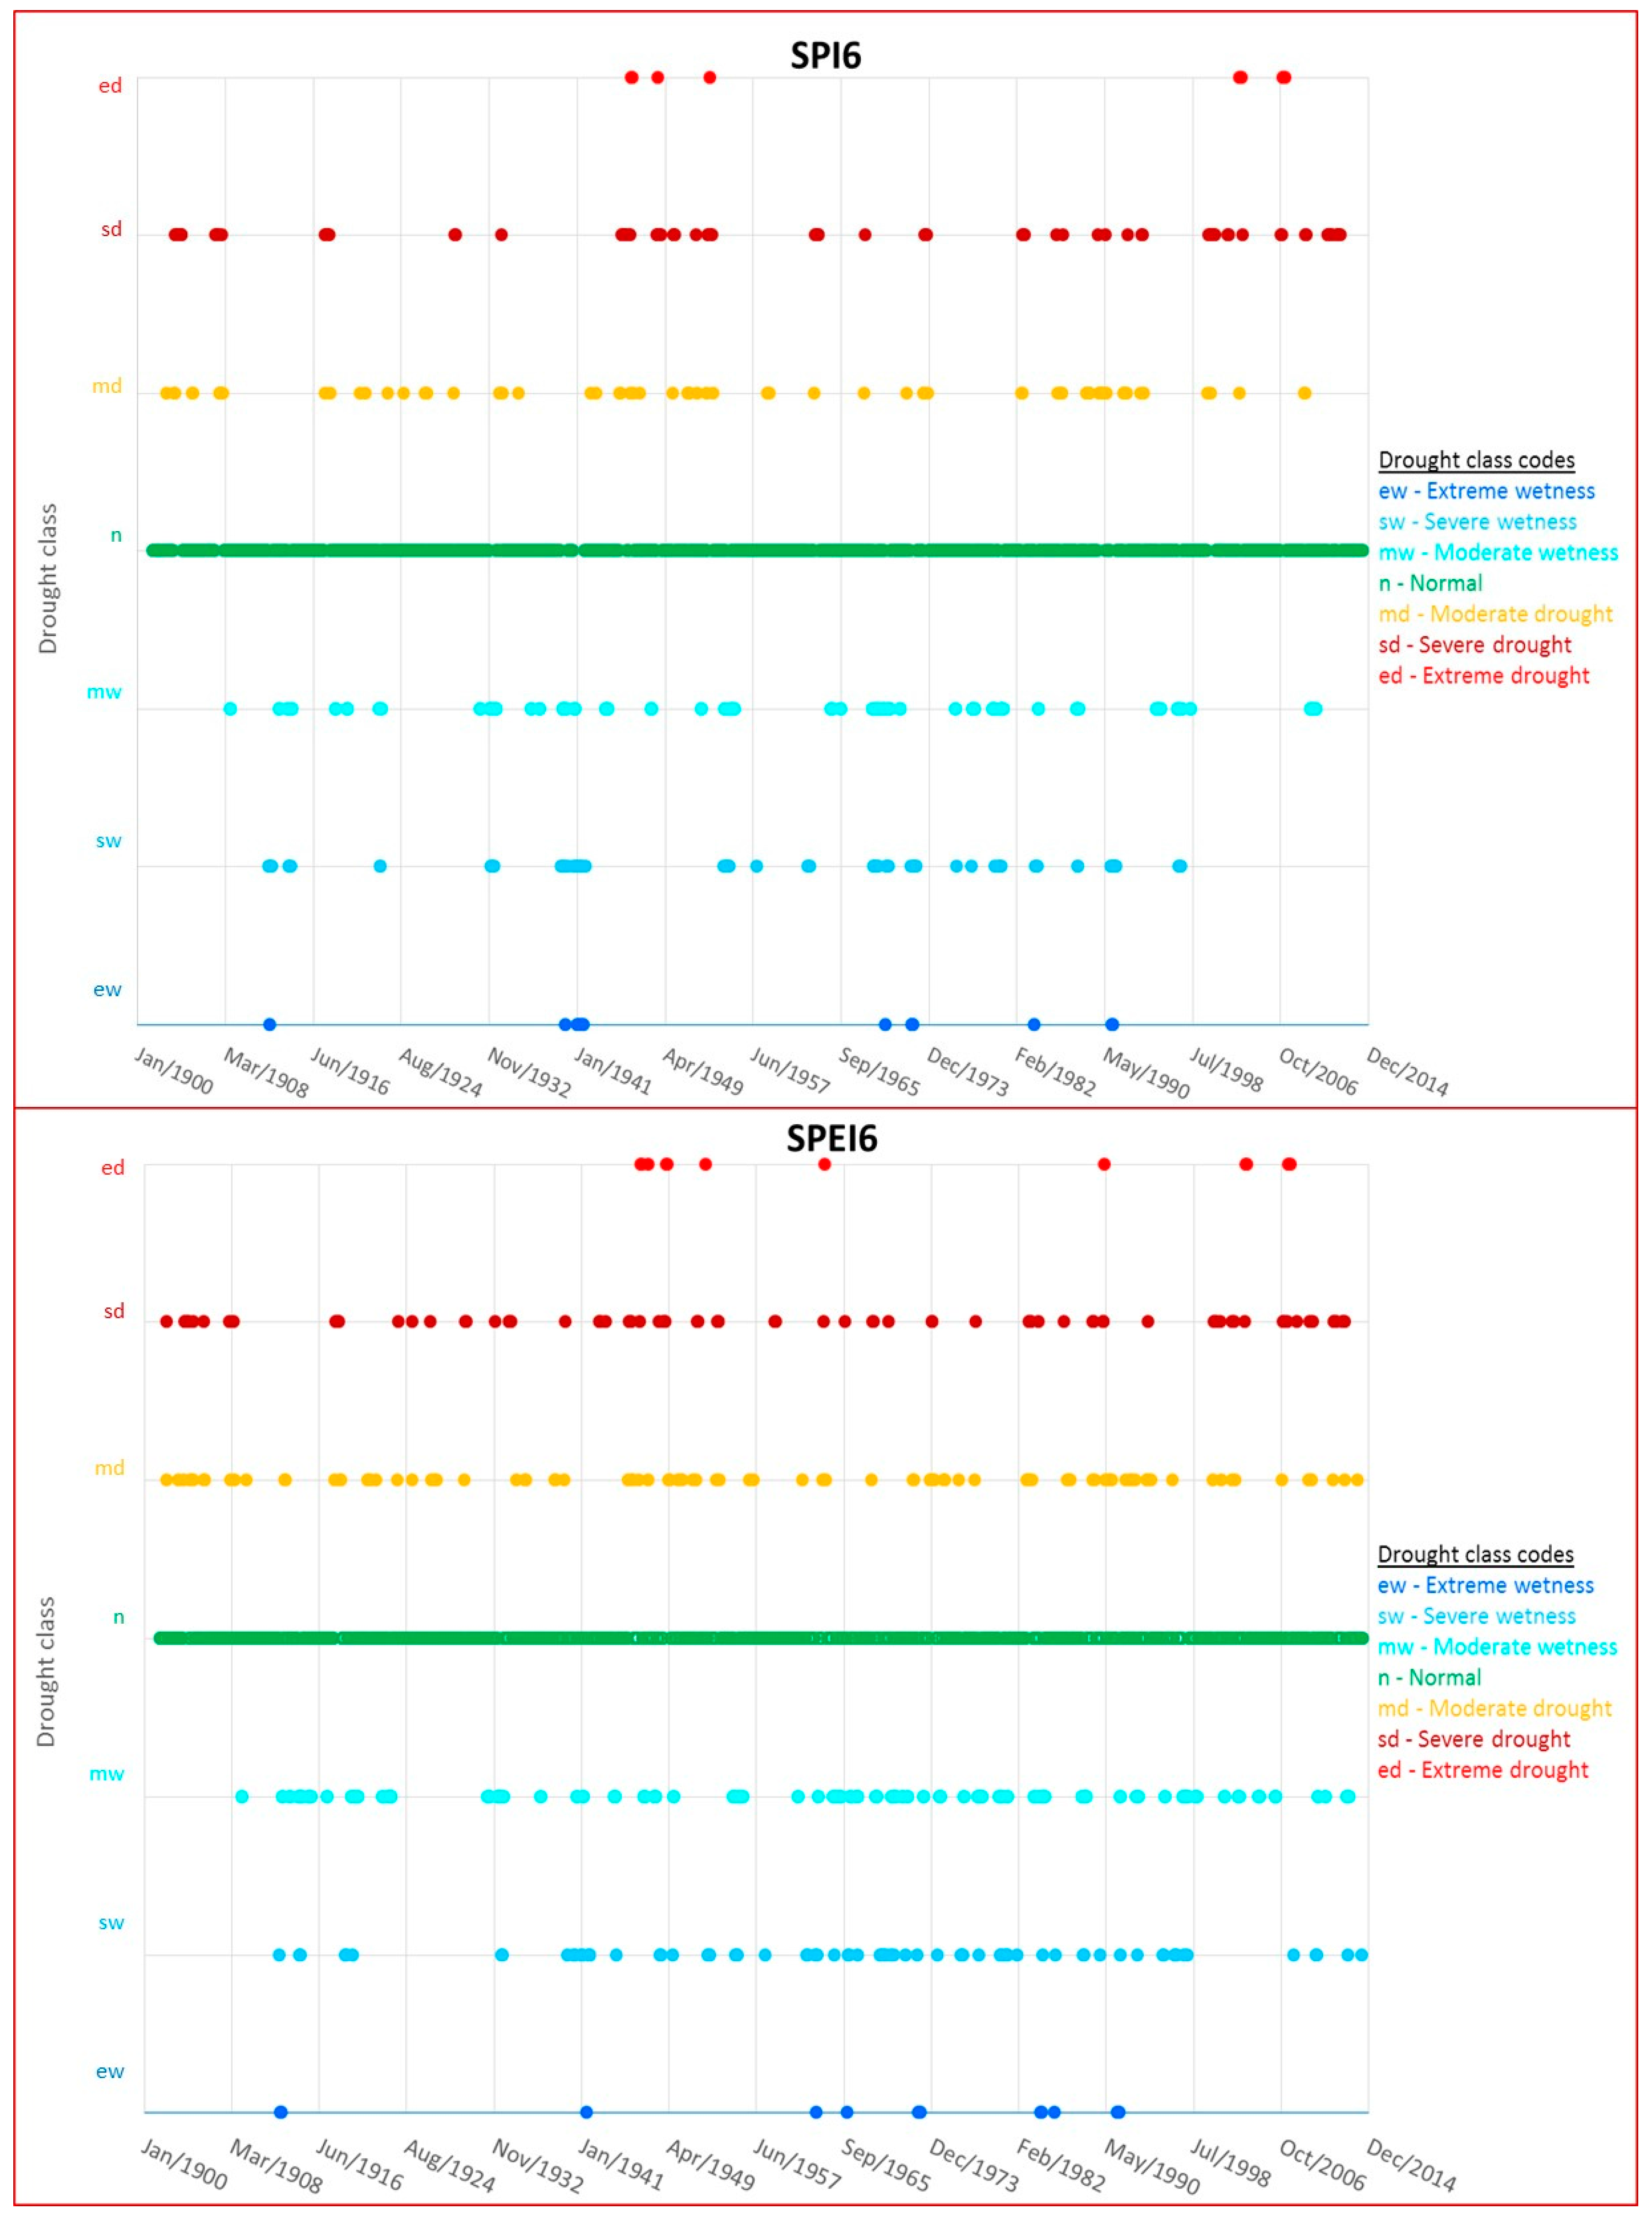
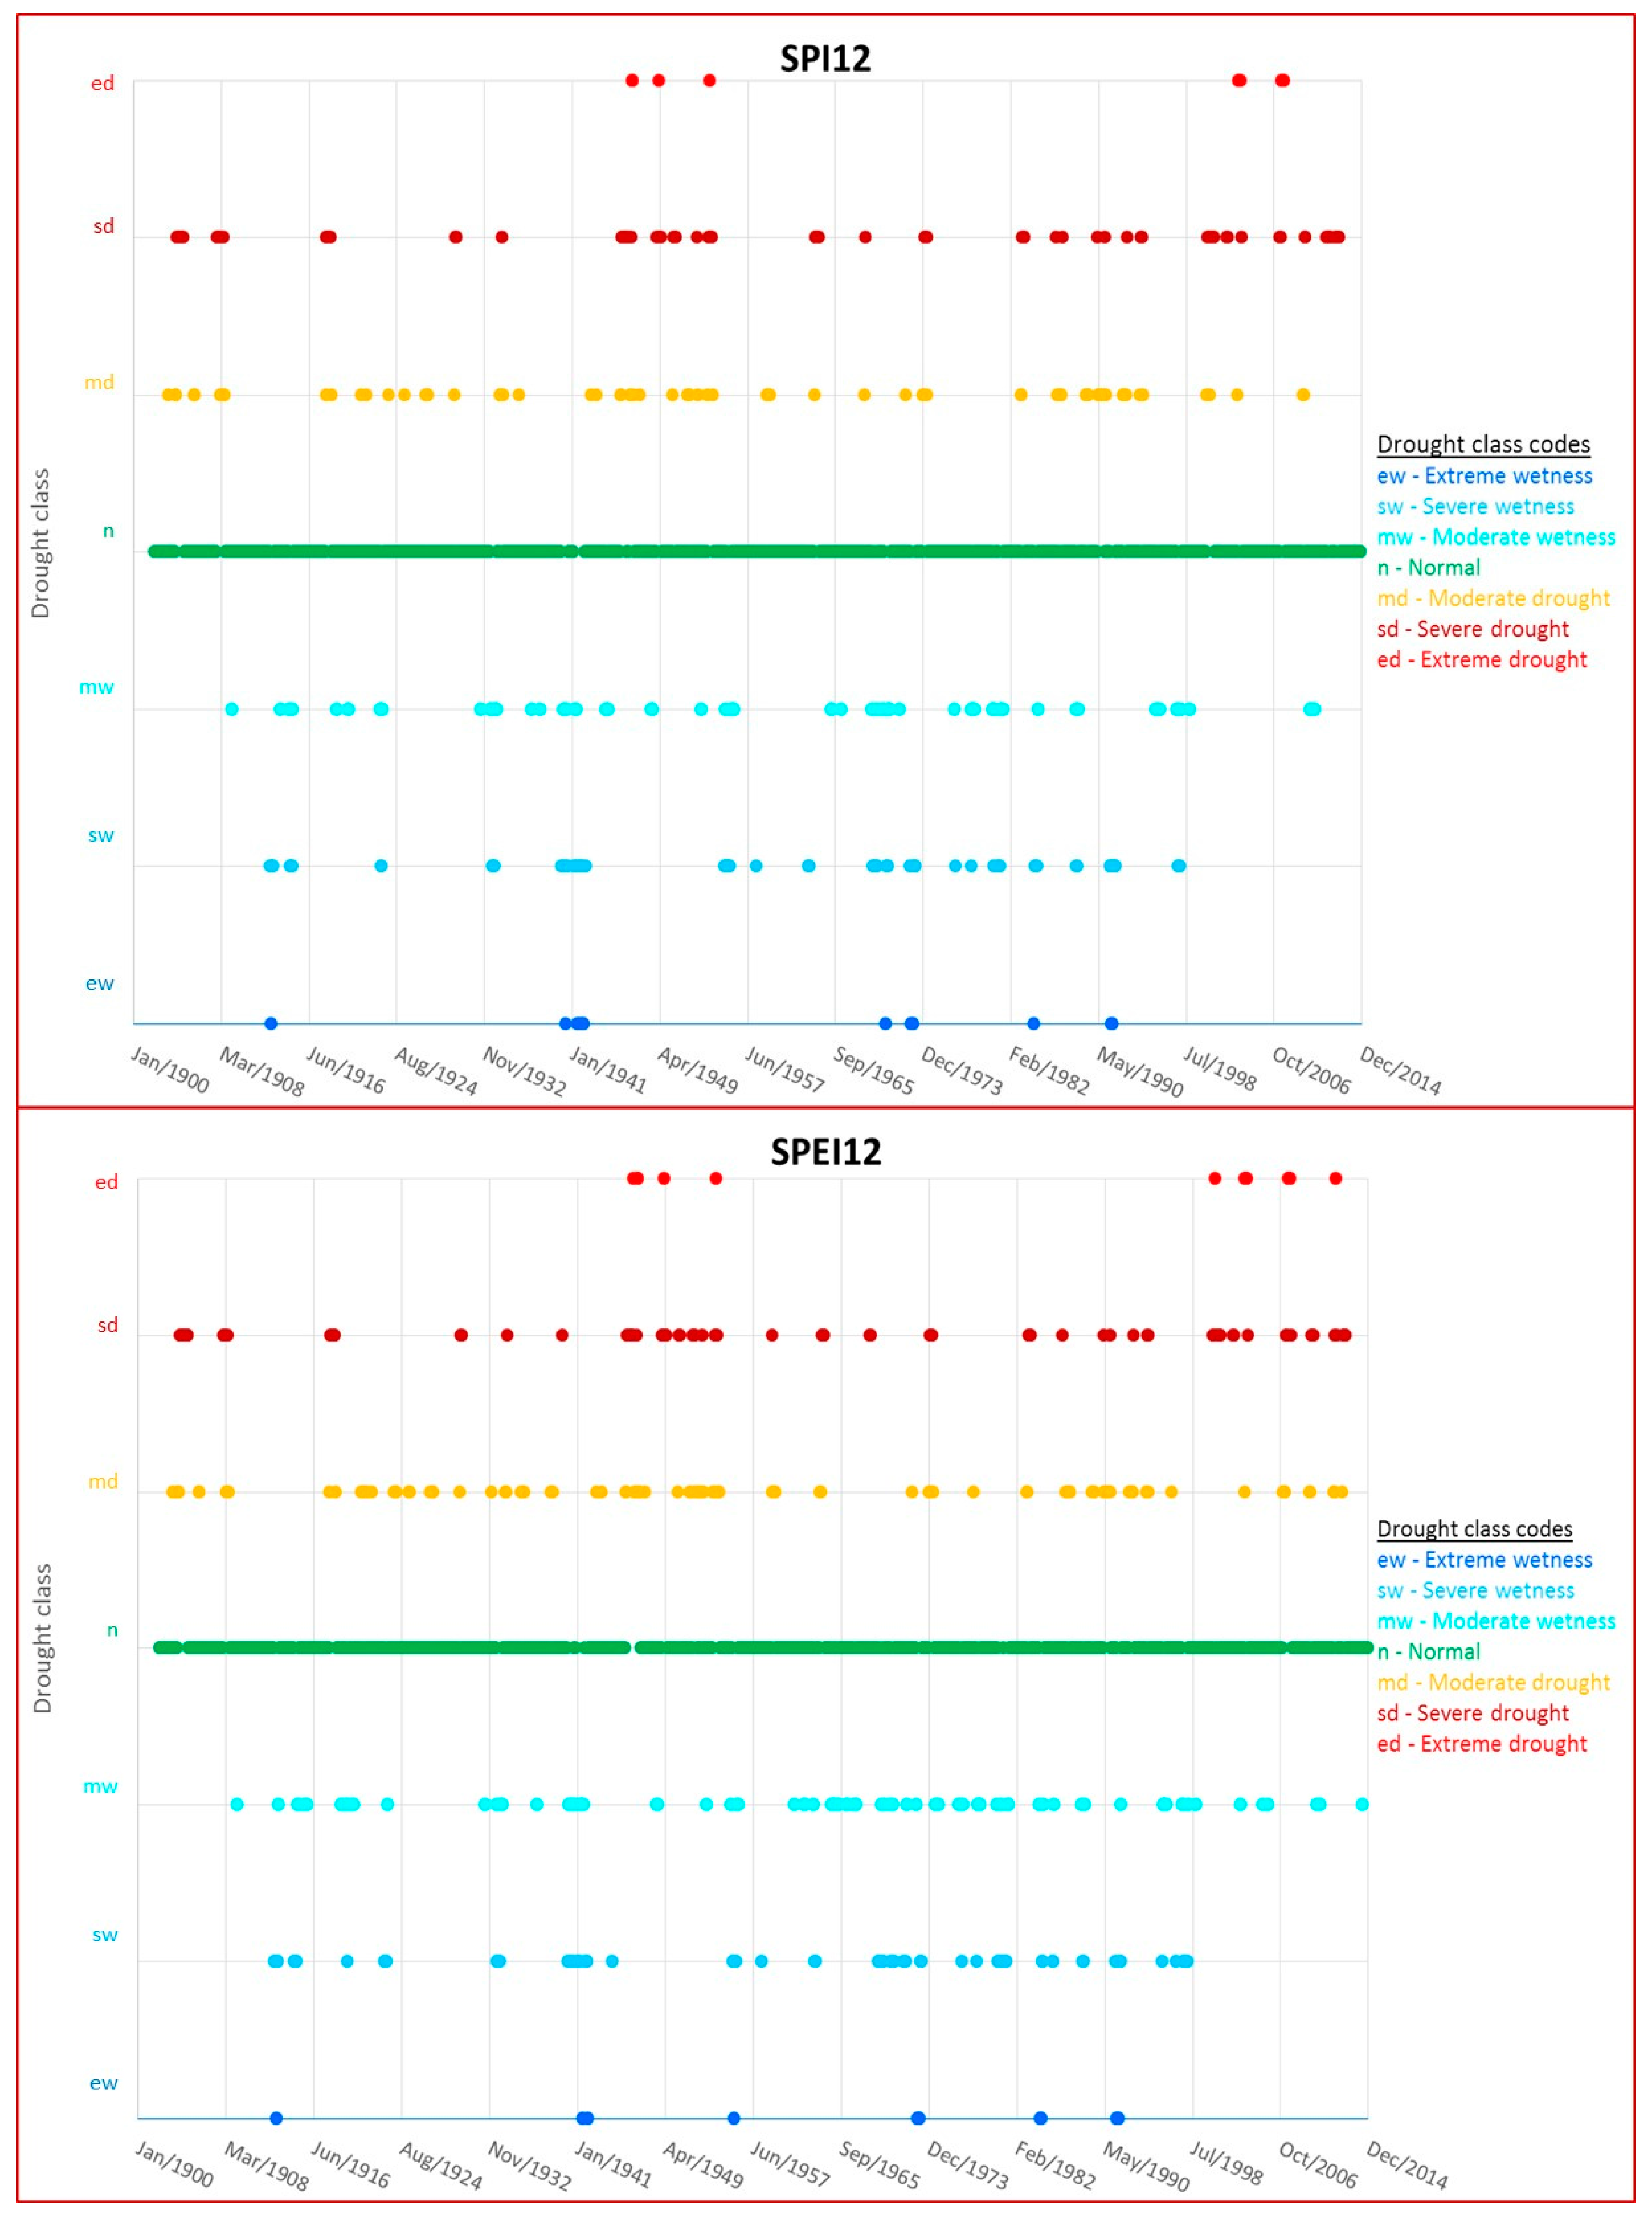
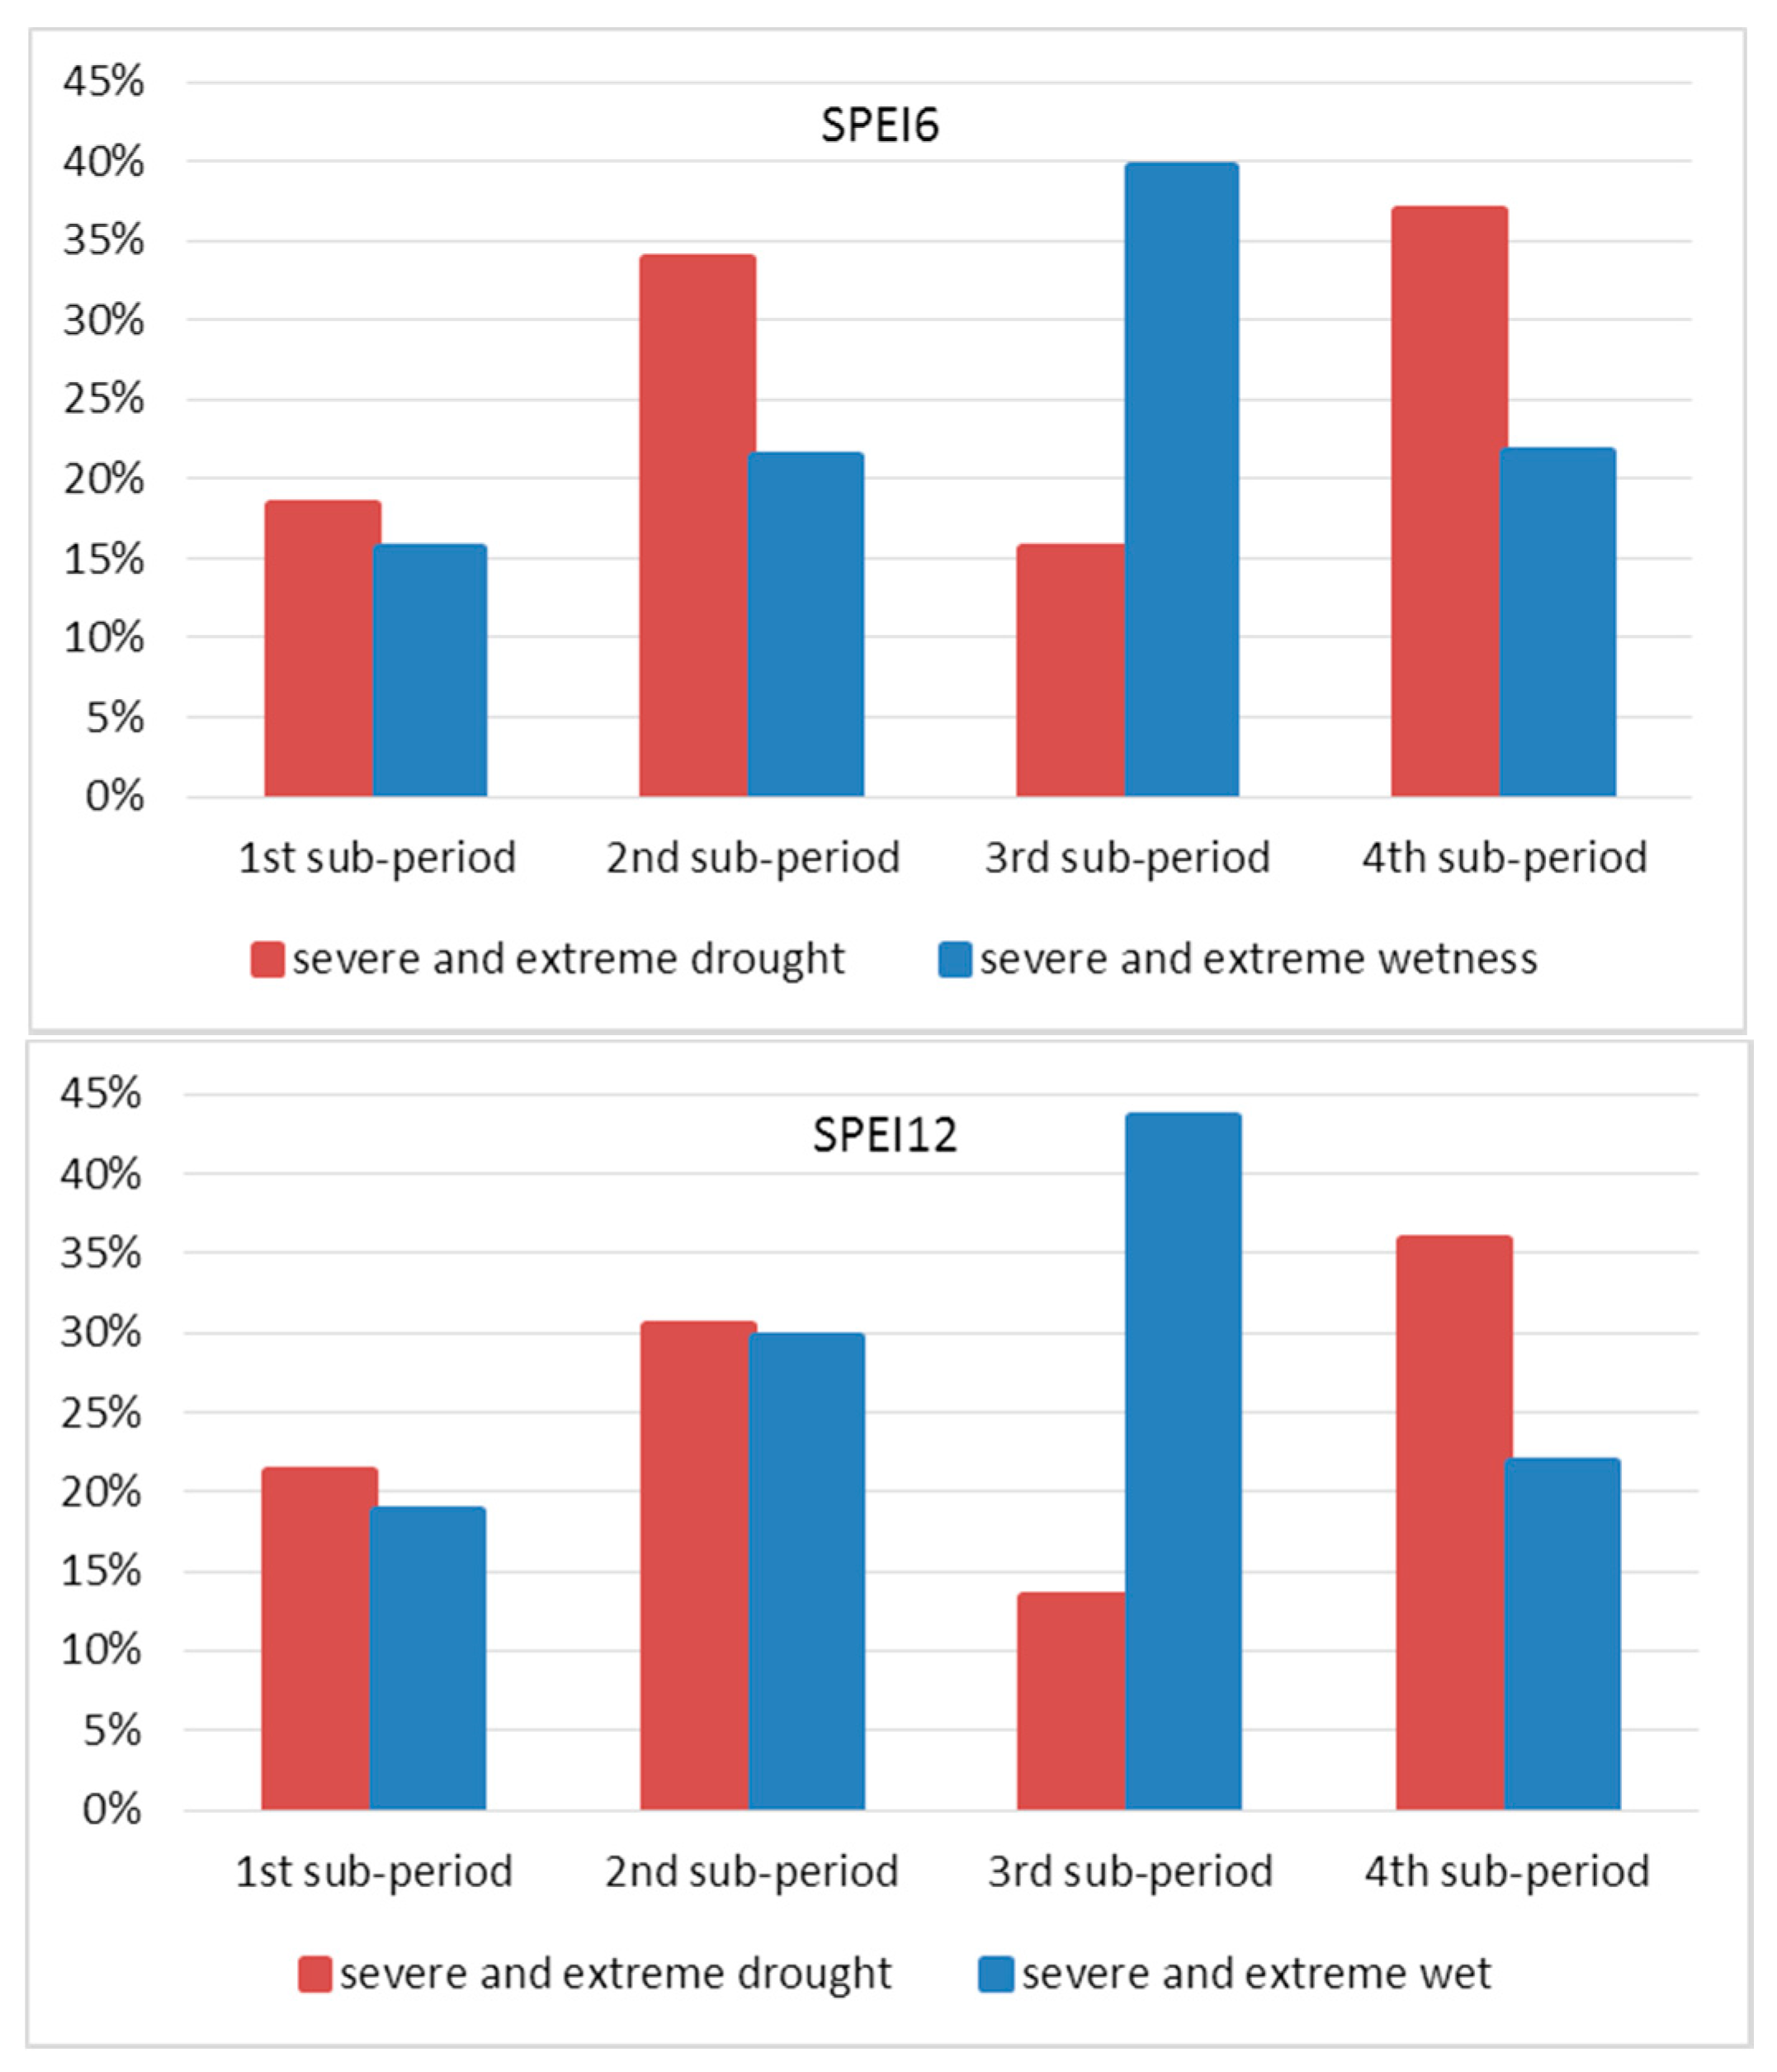
3.1. Drought Class Analysis
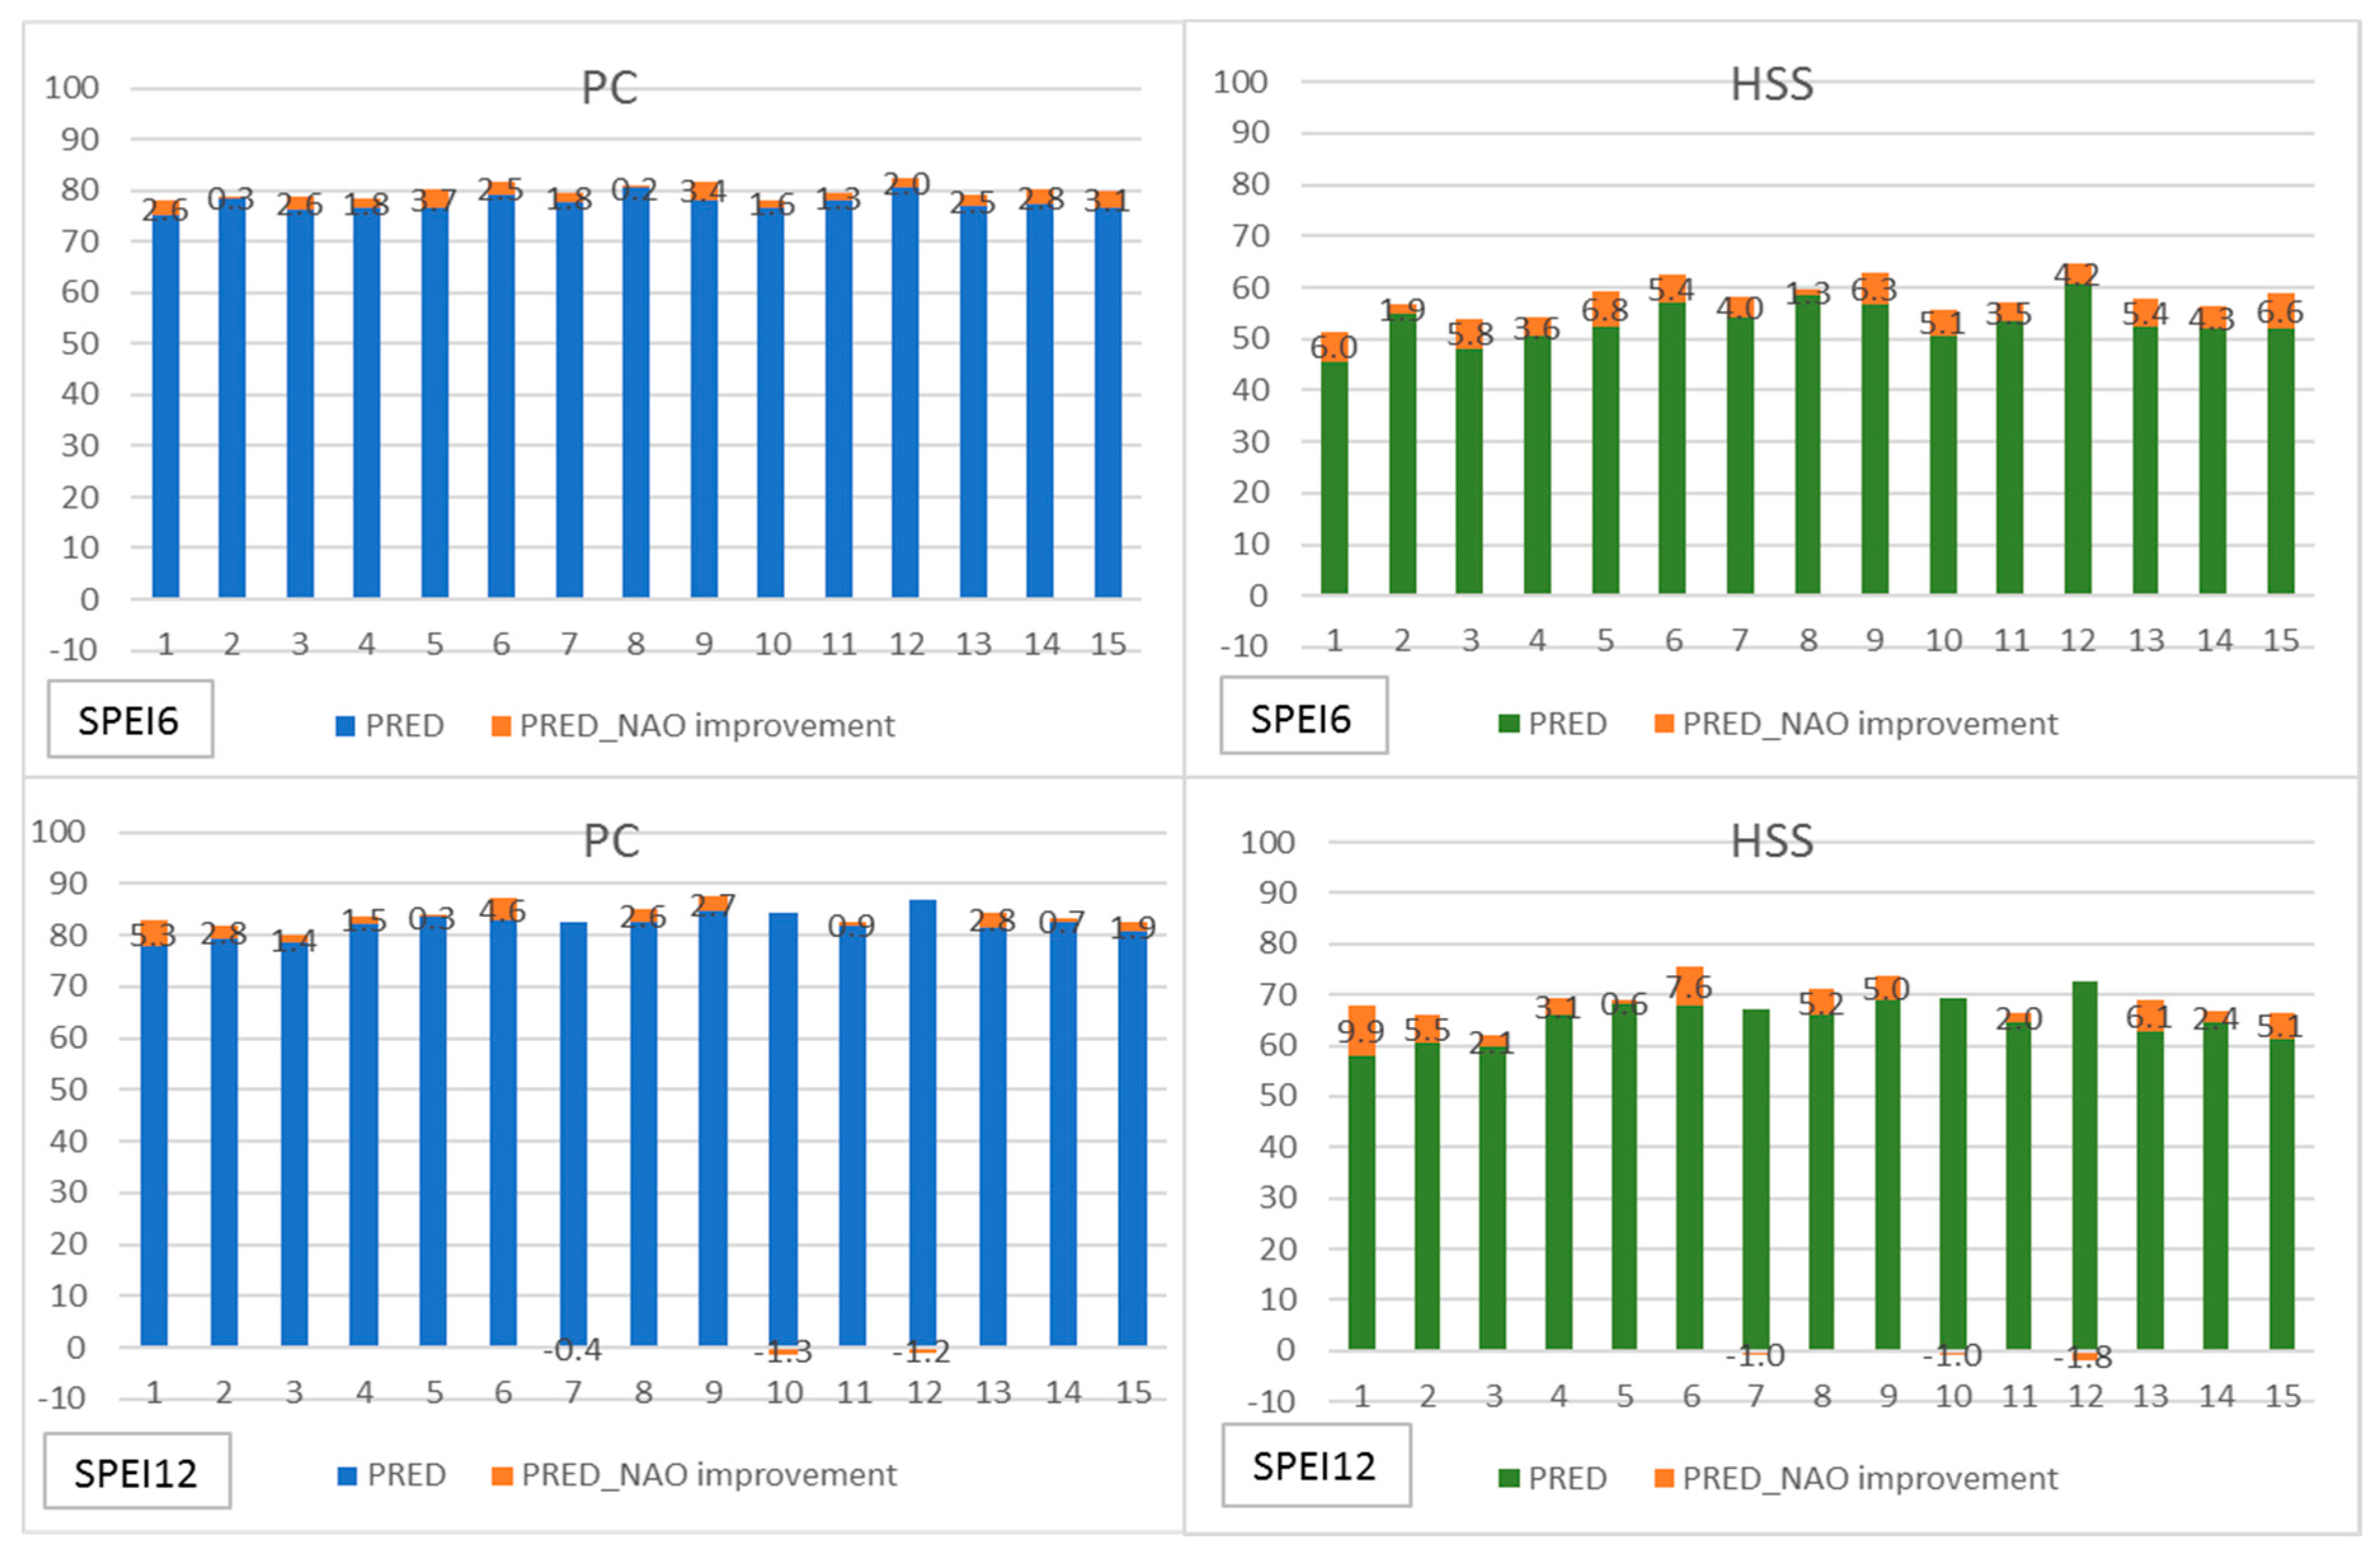
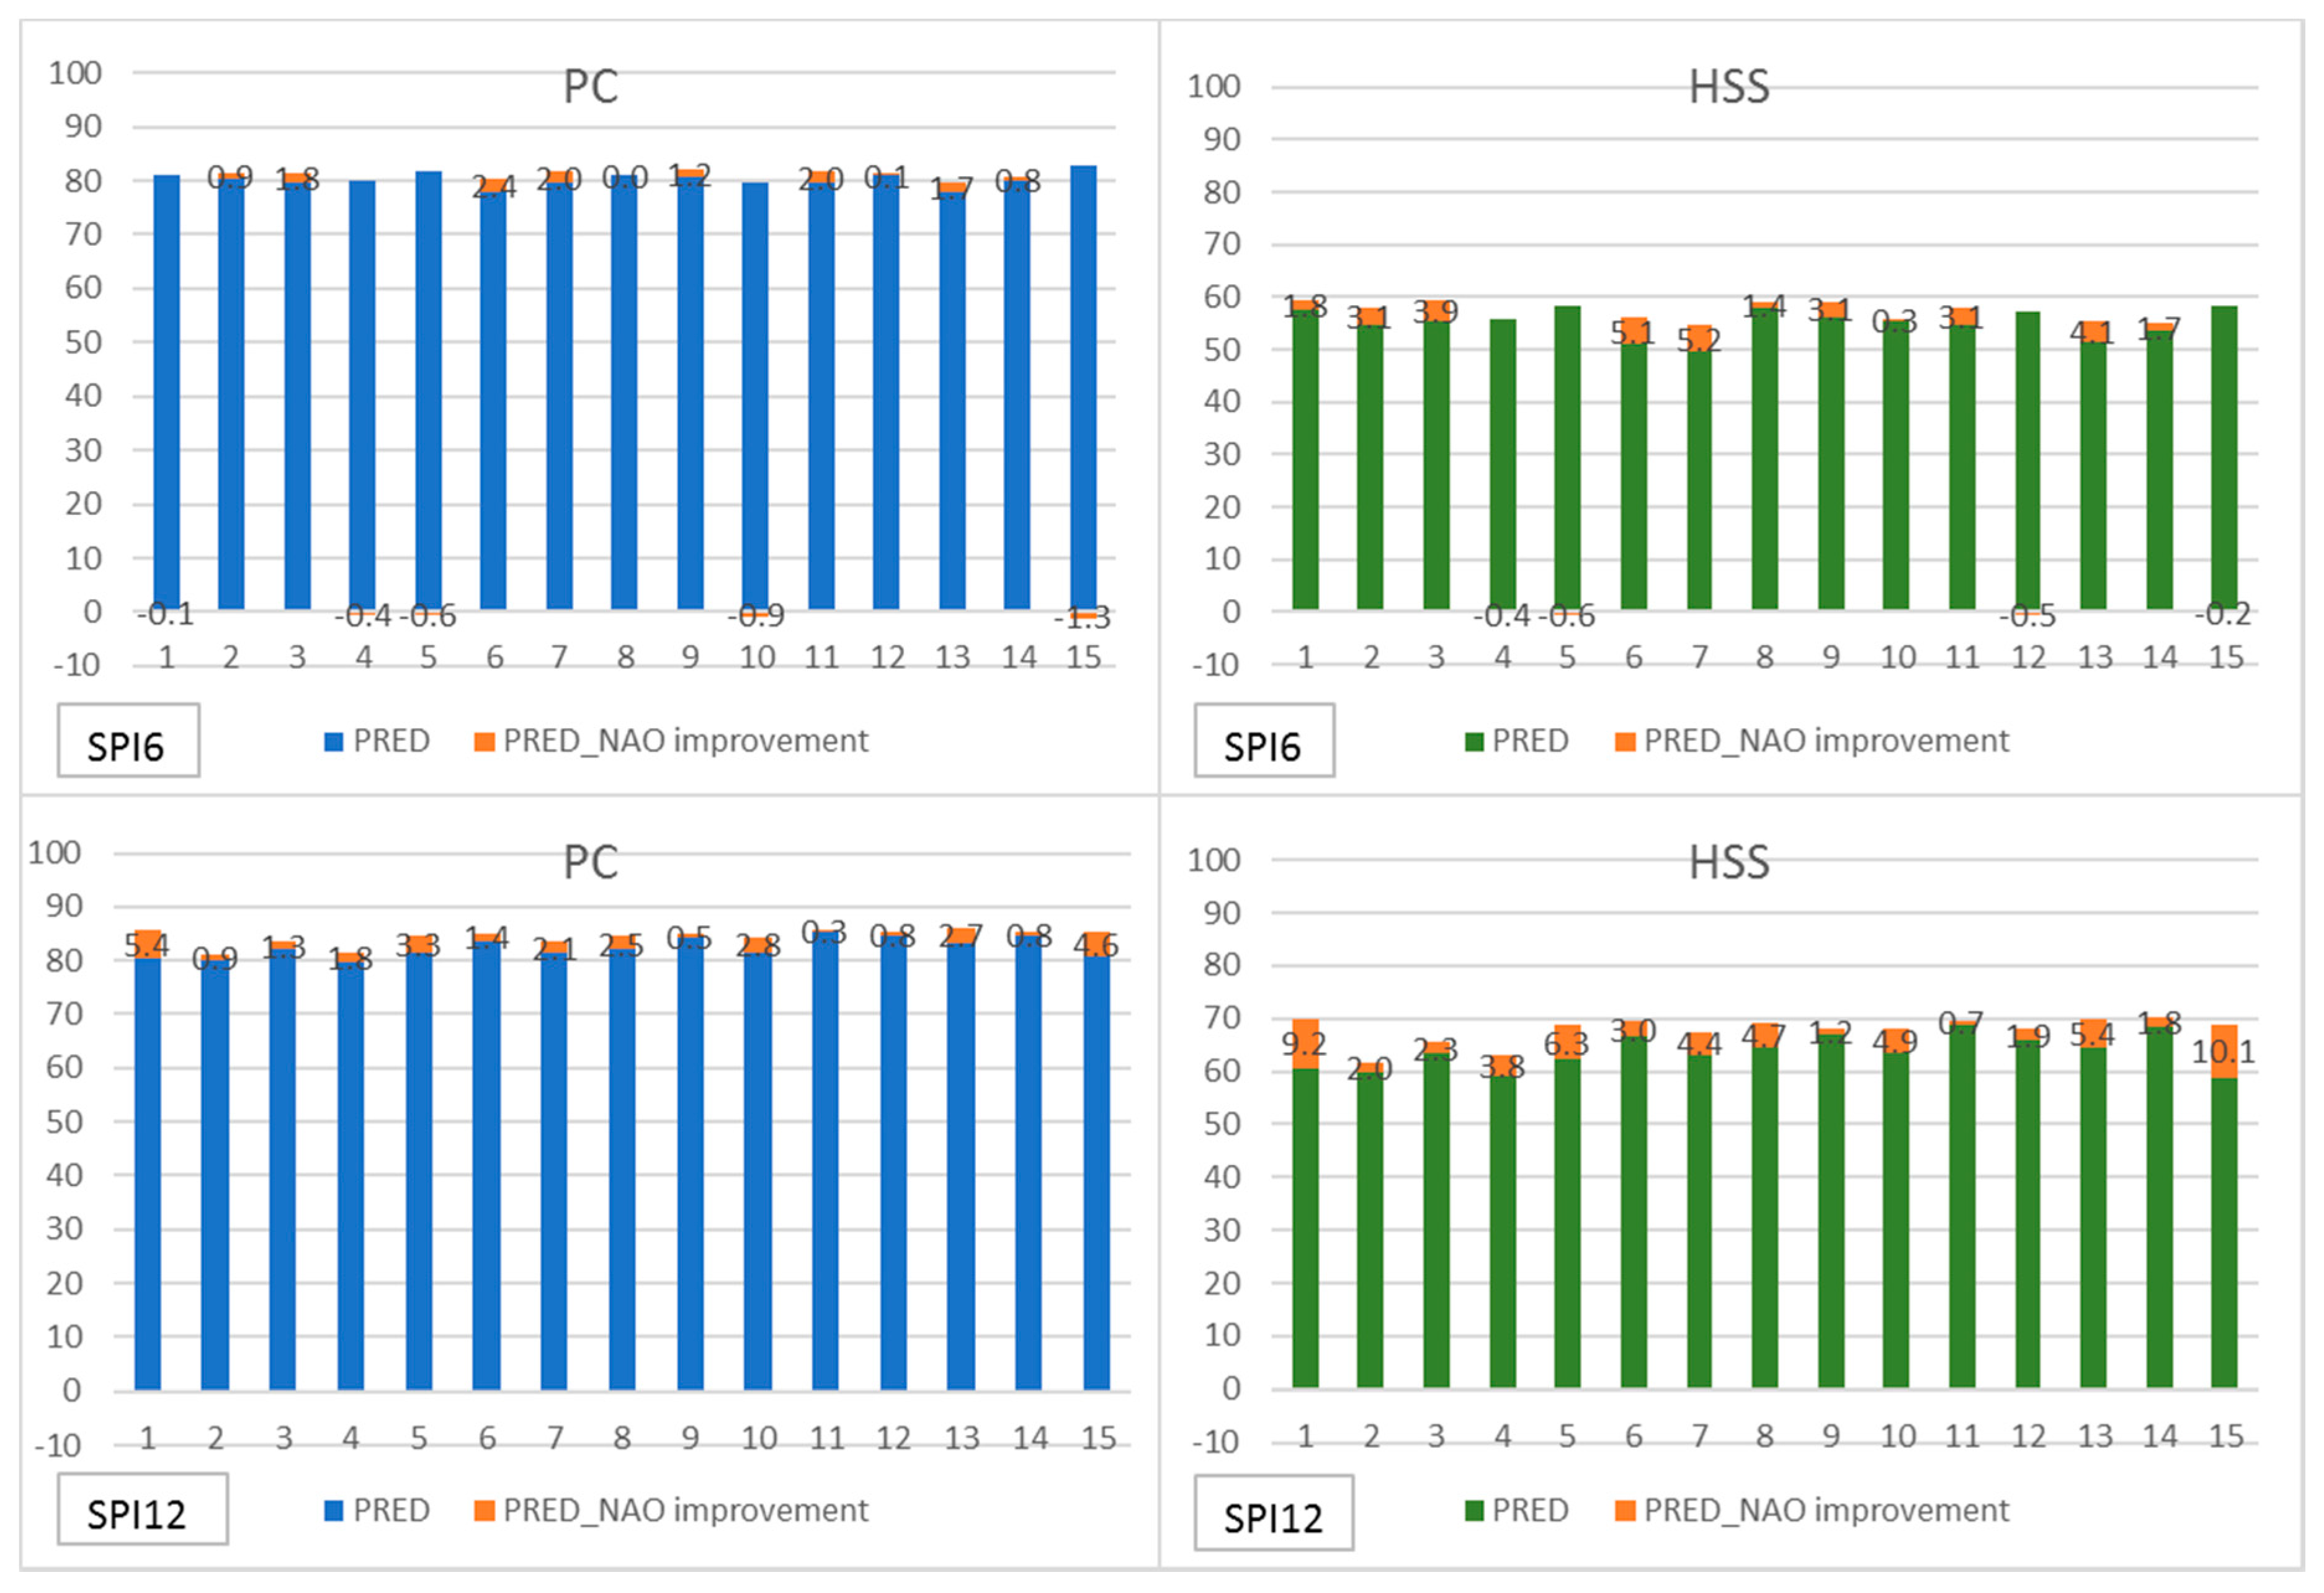
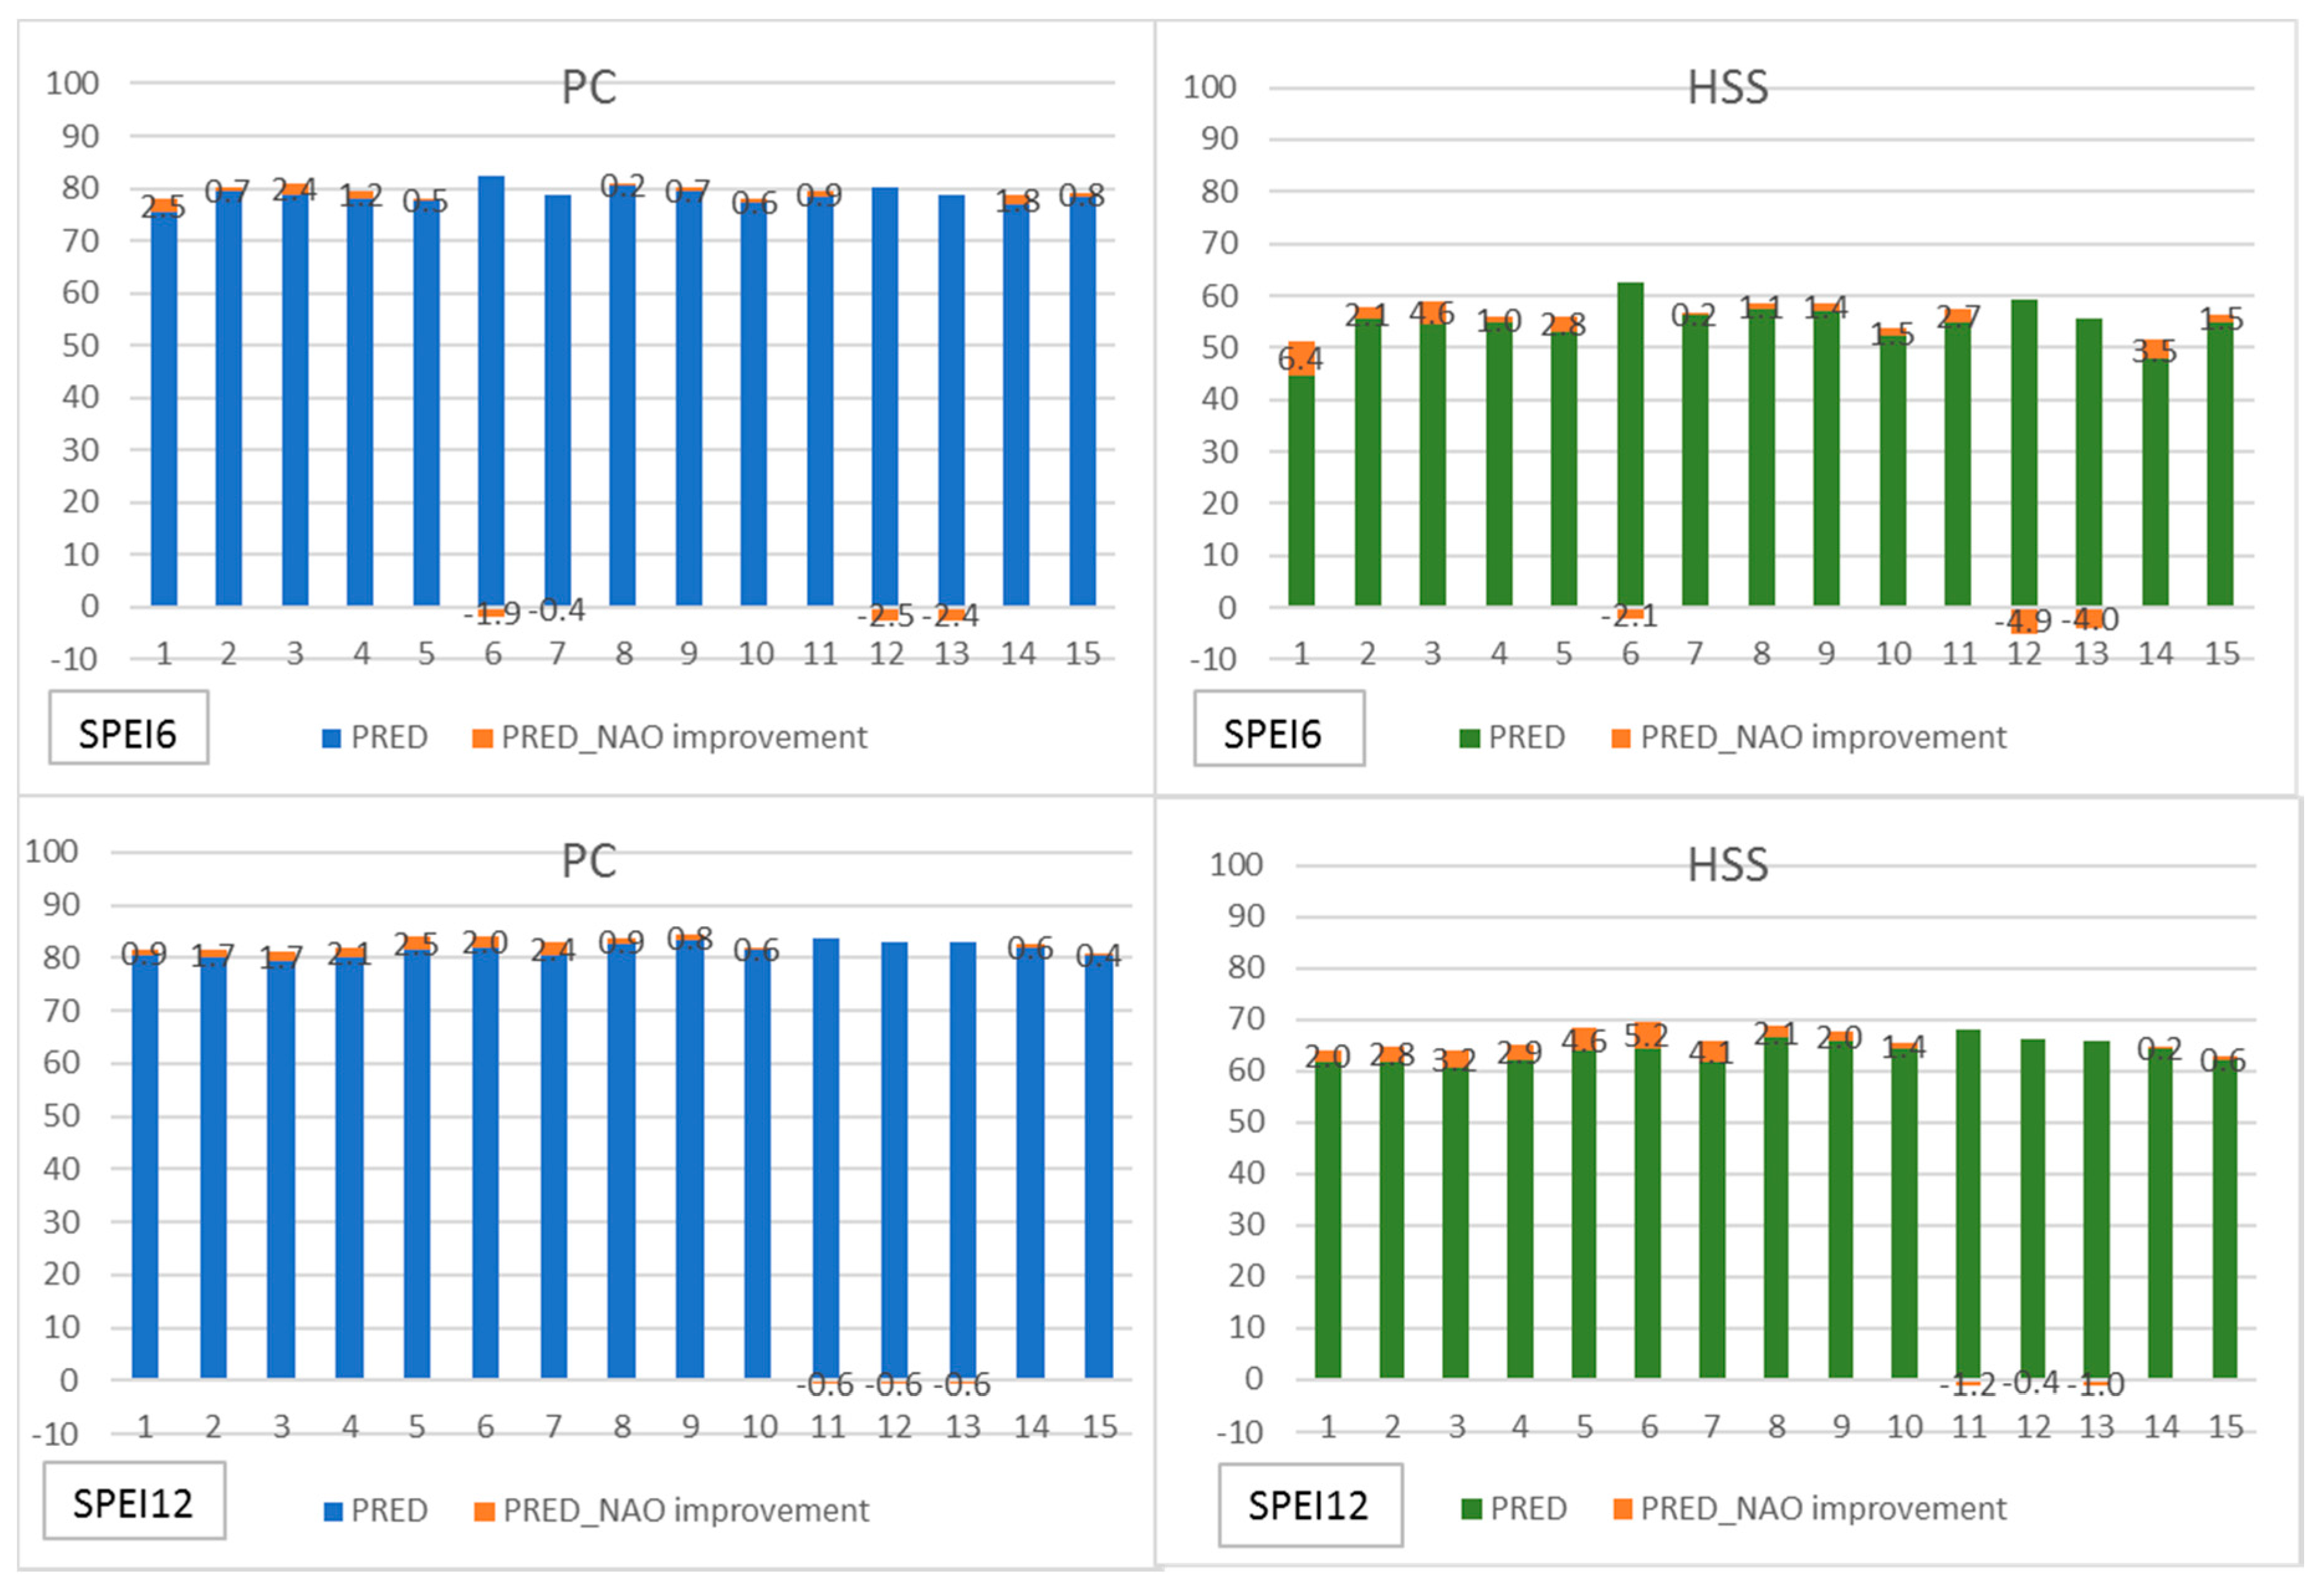
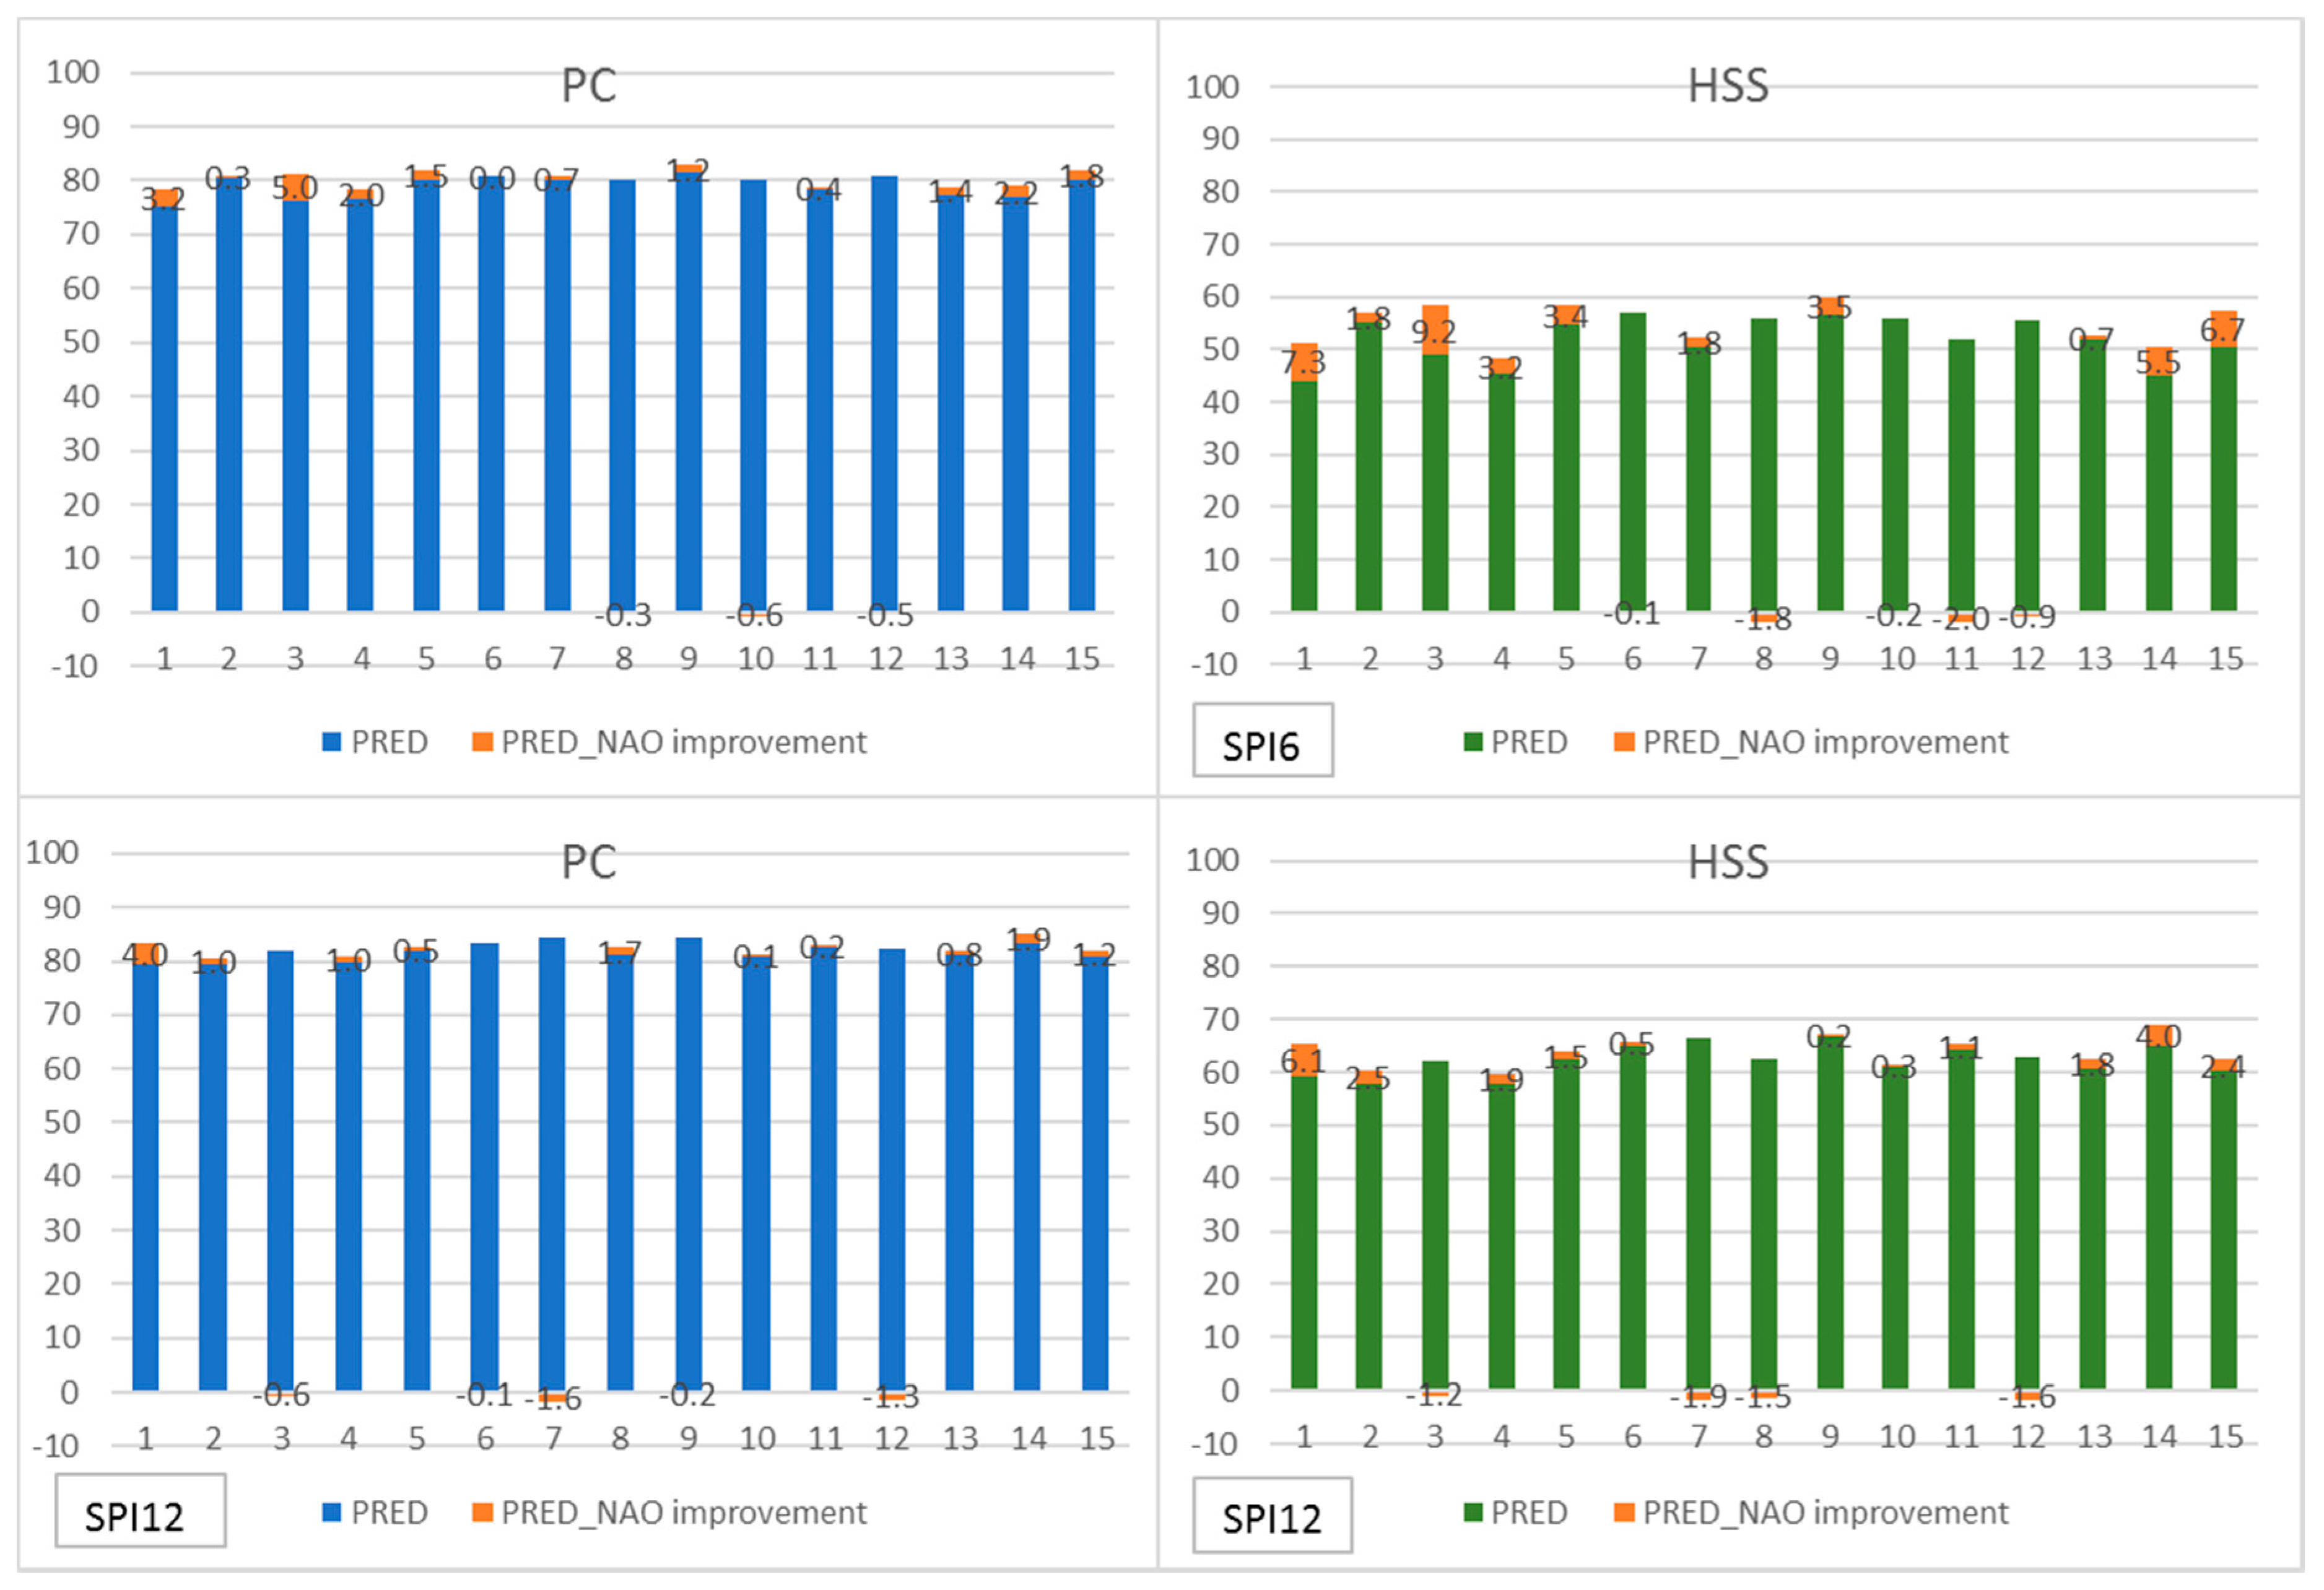
3.2. Prediction Analysis
4. Conclusions
Acknowledgments
Author Contributions
Conflicts of Interest
References
- Lloyd-Hughes, B.; Saunders, M.A. Drought climatology for Europe. Int. J. Climatol. 2002, 22, 1571–1592. [Google Scholar] [CrossRef]
- Bordi, I.; Fraedrich, K.; Sutera, A. Observed drought and wetness trends in Europe: An update. Hydrol. Earth Syst. Sci. 2009, 13, 1519–1530. [Google Scholar] [CrossRef]
- Pereira, L.S.; Cordery, I.; Iacovides, I. Coping with Water Scarcity, Addressing the Challenges; Springer: Berlin, Germany, 2009. [Google Scholar]
- Mishra, A.; Singh, V. A review of drought concepts. J. Hydrol. 2010, 391, 202–216. [Google Scholar] [CrossRef]
- Vogt, J.V.; Barbosa, P.; Hofer, B.; Magni, D.; De Jager, A.; Singleton, A.; Horion, S.; Sepulcre, G.; Micale, F.; Sokolova, E.; et al. Developing a European drought observatory for monitoring, assessing and forecasting droughts across the European continent. In AGU Fall Meeting Abstracts 1; NH24A-07; American Geophysical Union: Washington, DC, USA, 2011. [Google Scholar]
- Spinoni, J.; Naumann, G.; Vogt, J.; Barbosa, P. European drought climatologies and trends based on a multi-indicator approach. Glob. Planet. Chang. 2015, 127, 50–57. [Google Scholar] [CrossRef]
- Spinoni, J.; Naumann, G.; Vogt, J.; Barbosa, P. The biggest drought events in Europe from 1950 to 2012. J. Hydrol. Reg. Stud. 2015, 3, 509–524. [Google Scholar] [CrossRef]
- Dai, A. Drought under global warming: A review. WIREs Clim. Chang. Adv. Rev. 2011, 2, 45–65. [Google Scholar] [CrossRef]
- Spinoni, J.; Naumann, G.; Carrao, H.; Barbosa, P.; Vogt, J. World drought frequency, duration, and severity for 1951–2010. Int. J. Climatol. 2014, 34, 2792–2804. [Google Scholar] [CrossRef]
- Vicente-Serrano, S.; Lopez-Moreno, J.; Beguería, S.; Lorenzo-Lacruz, J.; Sanchez-Lorenzo, A.; García-Ruiz, J.; Azorin-Molina, C.; Morán-Tejeda, E.; Revuelto, J.; Trigo, R.; et al. Evidence of increasing drought severity caused by temperature rise in southern Europe. Environ. Res. Lett. 2014, 9, 044001. [Google Scholar] [CrossRef]
- Trenberth, K.E.; Dai, A.; Van der Schrier, G.; Jones, P.D.; Barichivich, J.; Briffa, K.R.; Sheffield, J. Global warming and changes in drought. Nat. Clim. Chang. 2014, 4, 17–22. [Google Scholar] [CrossRef]
- Briffa, K.R.; Van der Schrier, G.; Jonesa, P.D. Wet and dry summers in Europe since 1750: Evidence of increasing drought. Int. J. Climatol. 2009, 29, 1894–1905. [Google Scholar] [CrossRef]
- Paltineanu, C.; Mihailescu, I.F.; Prefac, Z.; Dragota, C.; Vasenciuc, F.; Claudia, N. Combining the standardized precipitation index and climatic water deficit in characterizing droughts: A case study in Romania. Theor. Appl. Climatol. 2009, 97, 219–233. [Google Scholar] [CrossRef]
- Sousa, P.M.; Trigo, R.M.; Aizpurua, P.; Nieto, R.; Gimeno, L.; Garcia Herrera, R. Trends and extremes of drought indices throughout the 20th century in the Mediterranean. Nat. Hazards Earth Syst. Sci. 2011, 11, 33–51. [Google Scholar] [CrossRef]
- Hoerling, M.; Eischeid, J.; Perlwitz, J.; Quan, X.; Zhang, T.; Pegion, P. On the Increased Frequency of Mediterranean Drought. J. Clim. 2012, 25, 2146–2161. [Google Scholar] [CrossRef]
- Spinoni, J.; Naumann, G.; Vogt, J. Pan-European seasonal trends and recent changes of drought frequency and severity. Glob. Planet. Chang. 2017, 148, 113–130. [Google Scholar] [CrossRef]
- Intergovernmental Panel on Climate Change (IPCC). Climate Change 2014, Synthesis Report, WMO and UNEP, Geneva. Available online: https://www.ipcc.ch/pdf/assessment-report/ar5/syr/SYR_AR5_FINAL_full_wcover.pdf (accessed on 10 January 2018).
- Dumitrescu, A.; Bojariu, R.; Birsan, M.; Marin, L.; Manea, A. Recent climatic changes in Romania from observational data (1961–2013). Theor. Appl. Climatol. 2015, 122, 111–119. [Google Scholar] [CrossRef]
- Spinoni, J.; Antofie, T.; Barbosa, P.; Bihari, Z.; Lakatos, M.; Szalai, S.; Szentimrey, T.; Vogt, J. An overview of drought events in the Carpathian Region in 1961–2010. Adv. Sci. Res. 2013, 10, 21–32. [Google Scholar] [CrossRef]
- Wang, Q.; Wu, J.; Lei, T.; He, B.; Wu, Z.; Liu, M.; Mo, X.; Geng, G.; Li, X.; Zhou, H.; et al. Temporal-spatial characteristics of severe drought events and their impact on agriculture on a global scale. Quat. Int. 2014, 349, 10–21. [Google Scholar] [CrossRef]
- Trenberth, K.E. Changes in precipitation with climate change. Clim. Res. 2011, 47, 123–138. [Google Scholar] [CrossRef]
- Trenberth, K.E.; Fasullo, J.T.; Shepherd, T.G. Attribution of climate extreme events. Nat. Clim. Chang. 2015, 5, 725–730. [Google Scholar] [CrossRef]
- Spinoni, J.; Vogt, J.V.; Naumann, G.; Barbosa, P.; Dosio, A. Will drought events become more frequent and severe in Europe? Int. J. Climatol. 2017. [Google Scholar] [CrossRef]
- Cuculeanu, V.; Marica, A.; Simota, C. Climate change impact on agricultural crops and adaptation options in Romania. Clim. Res. 1999, 12, 153–160. [Google Scholar] [CrossRef]
- Marica, A.C.; Busuioc, A. The potential of climate change on the main components of water balance relating to maize crop. Romanian J. Meteorol. 2004, 6, 50–57. [Google Scholar]
- Romanian National Climate Change Strategy (2013–2020), Adaptation Component, Report. Available online: http://climate-adapt.eea.europa.eu/countries-regions/countries/romania (accessed on 10 January 2018).
- Falco, S.D.; Adinolfi, F.; Bozzola, M.; Capitanio, F. Crop Insurance as a Strategy for Adapting to Climate Change. J. Agric. Econ. 2014, 65, 485–504. [Google Scholar] [CrossRef]
- Lesk, C.; Rowhani, P.; Ramankutty, N. Influence of extreme weather disasters on global crop production. Nature 2016, 529, 84–87. [Google Scholar] [CrossRef] [PubMed]
- Ontel, I.; Vladut, A. Impact of drought on the productivity of agricultural crops within the Oltenia Plain, Romania. Geogr. Pannonica 2015, 19, 9–19. [Google Scholar] [CrossRef]
- Kang, Y.; Khan, S.; Ma, X. Climate change impacts on crop yield, crop water productivity and food security—A review. Prog. Nat. Sci. 2009, 19, 1665–1674. [Google Scholar] [CrossRef]
- Nguyen, T.; Mula, L.; Cortignani, R.; Seddaiu, G.; Dono, G.; Virdis, S.G.P.; Pasqui, M.; Roggero, P.P. Perceptions of Present and Future Climate Change Impacts on Water Availability for Agricultural Systems in the Western Mediterranean Region. Water 2016, 8, 523. [Google Scholar] [CrossRef]
- Pozzi, W.; Sheffield, J.; Stefanski, R.; Cripe, D.; Pulwarty, R.; Vogt, J.V.; Heim, R., Jr.; Brewer, M.J.; Svoboda, M.; Westerhoff, R. Toward global drought early warning capability: Expanding international cooperation for the development of a framework for monitoring and forecasting. Am. Meteorol. Soc. 2013, 94, 776–785. [Google Scholar] [CrossRef]
- National Drought Mitigation Center (NDMC): What is Drought? Available online: http://drought.unl.edu/DroughtBasics/WhatisDrought.aspx (accessed on 10 January 2018).
- Pulwarty, R.S.; Sivakumar, M. Information systems in a changing climate: Early warnings and drought risk management. Weather Clim. Extremes 2014, 3, 14–21. [Google Scholar] [CrossRef]
- Turco, M.; Ceglar, A.; Prodhomme, C.; Soret, A.; Toreti, A.; Doblas-Reyes, F. Summer drought predictability over Europe: Empirical versus dynamical forecasts. Environ. Res. Lett. 2017, 12, 084006. [Google Scholar] [CrossRef]
- Palmer, W.C. Meteorological Drought; US Department of Commerce: Washington, DC, USA, 1965.
- Pereira, L.S.; Rosa, R.D.; Paulo, A.A. Testing a modification of the Palmer drought severity index for Mediterranean environments. In Methods and Tools for Drought Analysis and Management; Rossi, G., Vega, T., Bonaccorso, B., Eds.; Springer: Dordrecht, The Netherlands, 2007; pp. 149–167. [Google Scholar]
- Martins, D.S.; Raziei, T.; Paulo, A.A.; Pereira, L.S. Spatial and temporal variability of precipitation and drought in Portugal. Nat. Hazards Earth Syst. Sci. 2012, 12, 1493–1501. [Google Scholar] [CrossRef]
- McKee, T.B.; Doesken, N.J.; Kleist, J. Drought monitoring with multiple time scales. In Proceedings of the 9th Conference on Applied Climatology, Dallas, TX, USA, 15–20 January 1995; pp. 233–236. [Google Scholar]
- Vicente-Serrano, S.M.; Beguería, S.; López-Moreno, J.I. A multi-scalar drought index sensitive to global warming: The Standardized Precipitation Evapotranspiration Index—SPEI. J. Clim. 2010, 23, 1696–1718. [Google Scholar] [CrossRef]
- Vautard, R. Multiple weather regimes over the North Atlantic: Analysis of precursors and successors. Mon. Weather Rev. 1990, 118, 2056–2081. [Google Scholar] [CrossRef]
- Trigo, R.; DaCamara, C. Circulation weather types and their influence on the precipitation regime in Portugal. Int. J. Climatol. 2000, 20, 1559–1581. [Google Scholar] [CrossRef]
- Trigo, R.M.; Valente, M.A.; Trigo, I.F.; Miranda, P.M.; Ramos, A.M.; Paredes, D.; García-Herrera, R. North Atlantic wind and cyclone trends and their impact in the European precipitation and Atlantic significant wave height. Ann. N. Y. Acad. Sci. 2008, 1146, 212–234. [Google Scholar] [CrossRef] [PubMed]
- Hurrell, J.W. Decadal trends in the North Atlantic Oscillation: Regional temperatures and precipitation. Science 1995, 269, 676–679. [Google Scholar] [CrossRef] [PubMed]
- Trigo, R.; Osborn, T.; Corte-Real, J. The North Atlantic Oscillation influence on Europe: Climate impacts and associated physical mechanisms. Clim. Res. 2002, 20, 9–17. [Google Scholar] [CrossRef]
- Cleary, D.M.; Wynn, J.G.; Ionita, M.; Forray, F.L.; Onac, B.P. Evidence of long-term NAO influence on East-Central Europe winter precipitation from a guano-derived δ15N record. Sci. Rep. 2017, 7, 14095. [Google Scholar] [CrossRef] [PubMed]
- Busuioc, A.; Von Storch, H. Changes in the winter precipitation in Romania and its relation to the large-scale circulation. Tellus 1996, 48, 538–552. [Google Scholar] [CrossRef]
- Croitoru, A.; Piticar, A.; Imbroane, A.; Burada, D. Spatiotemporal distribution of aridity indices based on temperature and precipitation in the extra-Carpathian regions of Romania. Theor. Appl. Climatol. 2013, 112, 597–607. [Google Scholar] [CrossRef]
- Corduneanu, F.; Bucur, D.; Cimpeanu, S.M.; Apostol, I.C.; Strugariu, A. Hazards resulting from hydrological extremes in the upstream catchment of the Prut River. Water Resour. 2016, 43, 42–47. [Google Scholar] [CrossRef]
- Bojariu, R. Prut River Basin. Available online: http://imdroflood.csic.es/wp-content/uploads/2016/09/Bojariu.pdf (accessed on 31 July 2017).
- Tomozeiu, R.; Stefan, S.; Busuioc, A. Winter precipitation variability and large-scale circulation patterns in Romania. Theor. Appl. Climatol. 2005, 81, 193–201. [Google Scholar] [CrossRef]
- Bojariu, R.; Giorgi, F. The North Atlantic Oscillation signal in a regional climate simulation for the European region. Tellus A 2005, 57, 641–653. [Google Scholar] [CrossRef]
- Bojariu, B.; Paliu, D. North Atlantic Oscillation Projection on Romanian Climate Fluctuations in the Cold Season. In Detecting and Modelling Regional Climate Change; Springer: Berlin, Germany, 2001; pp. 345–356. [Google Scholar]
- Mishra, A.; Desai, V.; Singh, V. Drought forecasting using a hybrid stochastic and neural network model. J. Hydrol. Eng. 2007, 12, 626–638. [Google Scholar] [CrossRef]
- Kim, T.; Valdes, J.B. Nonlinear model for drought forecasting based on a conjunction of wavelet transforms and neural networks. J. Hydrol. Eng. 2003, 8, 319–328. [Google Scholar] [CrossRef]
- Ozger, M.; Mishra, A.; Singh, V. Long lead time drought forecasting using a wavelet and fuzzy logic combination model: A case study in Texas. J. Hydrometeorol. 2012, 13, 284–297. [Google Scholar] [CrossRef]
- Bacanli, U.; Firat, M.; Dikbas, F. Adaptive neuro-fuzzy inference system for drought forecasting. Stoch. Environ. Res. Risk Assess. 2009, 23, 1143–1154. [Google Scholar] [CrossRef]
- Mishra, A.; Singh, V. Drought modeling—A review. J. Hydrol. 2011, 403, 157–175. [Google Scholar] [CrossRef]
- Mishra, A.; Desai, V. Drought forecasting using stochastic models. Stoch. Environ. Res. Risk Assess. 2005, 19, 326–339. [Google Scholar] [CrossRef]
- Han, P.; Wang, P.; Zhang, S.; Zhu, D. Drought forecasting based on the remote sensing data using ARIMA models. Math. Comput. Model. 2010, 51, 1398–1403. [Google Scholar] [CrossRef]
- Mishra, A.; Desai, V. Drought forecasting using feed-forward recursive neural network. Ecol. Model. 2006, 198, 127–138. [Google Scholar] [CrossRef]
- Bierkens, M.; Van Beek, L. Seasonal predictability of European discharge: NAO and hydrological response time. J. Hydrometeorol. 2009, 10, 953–968. [Google Scholar] [CrossRef]
- Paulo, A.A.; Pereira, L.S. Prediction of SPI drought class transitions using Markov chains. Water Resour. Manag. 2007, 21, 1813–1827. [Google Scholar] [CrossRef]
- Moreira, E.E.; Coelho, C.A.; Paulo, A.A.; Pereira, L.S.; Mexia, J.T. SPI-based drought category prediction using log-linear models. J. Hydrol. 2008, 354, 116–130. [Google Scholar] [CrossRef]
- Moreira, E.E.; Pires, C.L.; Pereira, L.S. SPI Drought Class Predictions Driven by the North Atlantic Oscillation Index Using Log-Linear Modeling. Water 2016, 8, 43. [Google Scholar] [CrossRef]
- Cancelliere, A.; Di Mauro, G.; Bonaccorso, B.; Rossi, G. Drought forecasting using the Standardized Precipitation Index. Water Resour. Manag. 2007, 21, 801–819. [Google Scholar] [CrossRef]
- Bonaccorso, B.; Cancelliere, A.; Rossi, G. Probabilistic forecasting of drought class transitions in Sicily (Italy) using Standardized Precipitation Index and North Atlantic Oscillation. J. Hydrol. 2015, 526, 136–150. [Google Scholar] [CrossRef]
- Morid, S.; Smakhtin, V.; Bagherzadeh, K. Drought forecasting using artificial neural networks and time series of drought indices. Int. J. Climatol. 2007, 27, 2103–2111. [Google Scholar] [CrossRef]
- Moreira, E.E. SPI drought class prediction using log-linear models applied to wet and dry seasons. Phys. Chem. Earth 2016, 94, 136–145. [Google Scholar] [CrossRef]
- Paulo, A.A.; Pereira, L.S. Drought concepts and characterization: Comparing drought indices applied at local and regional Scales. Water Int. 2006, 31, 37–49. [Google Scholar] [CrossRef]
- Agresti, A. Categorical Data Analysis; John Willey & Sons: New York, NY, USA, 1990. [Google Scholar]
- Jolliffe, I.; Stephenson, D. Forecast Verification: A Practitioner’s Guide in Atmospheric Science, 2nd ed.; Willey: Indianapolis, IN, USA, 2011. [Google Scholar]
- Wilks, D.S. Statistical Methods in the Atmospheric Sciences, 3rd ed.; Academic Press: Cambridge, MA, USA, 2011. [Google Scholar]
- Montgomery, D.C. Design and Analysis of Experiments, 5th ed.; John Willey & Sons: New York, NY, USA, 1997. [Google Scholar]
- Moreira, E.E.; Mexia, J.T.; Pereira, L.S. Are drought occurrence and severity aggravating? A study on SPI drought class transitions using log-linear models and ANOVA-like inference. Hydrol. Earth Syst. Sci. 2012, 16, 3011–3028. [Google Scholar] [CrossRef]


| Code | Classes | SPI/SPEI Interval |
|---|---|---|
| ew | Extreme wetness | [2, +∞[ |
| sw | Severe wetness | [1.5, 2[ |
| mw | Moderate wetness | [1, 1.5[ |
| n | Normal | [−1, 1[ |
| md | Moderate drought | [−1.5, −1[ |
| sd | Severe drought | [−2, −1.5[ |
| ed | Extreme drought | ]−∞, −2[ |
| Code | Classes | SPI/SPEI Interval |
|---|---|---|
| 1 | Wet | [1, +∞[ |
| 2 | Normal/Near-Normal | [−1, 1[ |
| 3 | Moderate | [−1.5, −1[ |
| 4 | Severe/Extreme | ]−∞, −1.5[ |
| Grid Point | Latitude | Longitude | Correlation | |||
|---|---|---|---|---|---|---|
| SPEI6 | SPEI12 | SPI6 | SPI12 | |||
| 1 | 48.25 | 25.25 | −0.30 | −0.27 | −0.31 | −0.29 |
| 2 | 48.25 | 26.25 | −0.28 | −0.25 | −0.29 | −0.27 |
| 3 | 48.25 | 27.25 | −0.30 | −0.28 | −0.30 | −0.29 |
| 4 | 47.75 | 26.25 | −0.28 | −0.25 | −0.28 | −0.26 |
| 5 | 47.75 | 27.25 | −0.30 | −0.28 | −0.31 | −0.30 |
| 6 | 47.25 | 27.25 | −0.29 | −0.27 | −0.29 | −0.28 |
| 7 | 47.25 | 28.25 | −0.34 | −0.34 | −0.32 | −0.33 |
| 8 | 46.75 | 27.75 | −0.32 | −0.32 | −0.30 | −0.30 |
| 9 | 46.75 | 28.75 | −0.37 | −0.36 | −0.34 | −0.34 |
| 10 | 46.25 | 27.75 | −0.35 | −0.34 | −0.33 | −0.32 |
| 11 | 46.25 | 28.75 | −0.38 | −0.37 | −0.35 | −0.33 |
| 12 | 45.75 | 27.75 | −0.36 | −0.34 | −0.33 | −0.32 |
| 13 | 45.75 | 28.75 | −0.38 | −0.35 | −0.34 | −0.32 |
| 14 | 45.25 | 28.25 | −0.38 | −0.35 | −0.35 | −0.33 |
| 15 | 45.25 | 28.75 | −0.39 | −0.35 | −0.35 | −0.32 |
| Average | −0.34 | −0.31 | −0.32 | −0.31 | ||
| Minimum | −0.39 | −0.37 | −0.35 | −0.34 | ||
| Maximum | −0.28 | −0.25 | −0.28 | −0.26 | ||
| NAO− | Drought Class Month t + 1 | Drought Class Month t + 1 | Drought Class Month t + 1 | Drought Class Month t + 1 | ||||||||||||
| 1 | 2 | 3 | 4 | |||||||||||||
| Drought Class Month t – 1 | Drought Class Month t | Drought Class Month t | Drought Class Month t | Drought Class Month t | ||||||||||||
| 1 | 2 | 3 | 4 | 1 | 2 | 3 | 4 | 1 | 2 | 3 | 4 | 1 | 2 | 3 | 4 | |
| 1 | 52 | 3 | 0 | 0 | 39 | 43 | 0 | 0 | 0 | 3 | 0 | 0 | 0 | 1 | 0 | 0 |
| 2 | 41 | 49 | 0 | 0 | 21 | 246 | 7 | 1 | 1 | 25 | 9 | 1 | 0 | 7 | 7 | 3 |
| 3 | 0 | 2 | 0 | 0 | 0 | 19 | 5 | 10 | 0 | 1 | 7 | 2 | 0 | 0 | 5 | 2 |
| 4 | 0 | 1 | 0 | 0 | 0 | 6 | 5 | 1 | 0 | 2 | 4 | 4 | 0 | 0 | 0 | 4 |
| NAO+ | Drought Class Month t + 1 | Drought Class Month t + 1 | Drought Class Month t + 1 | Drought Class Month t + 1 | ||||||||||||
| 1 | 2 | 3 | 4 | |||||||||||||
| Drought Class Month t – 1 | Drought Class Month t | Drought Class Month t | Drought Class Month t | Drought Class Month t | ||||||||||||
| 1 | 2 | 3 | 4 | 1 | 2 | 3 | 4 | 1 | 2 | 3 | 4 | 1 | 2 | 3 | 4 | |
| 1 | 27 | 1 | 0 | 0 | 19 | 42 | 0 | 0 | 0 | 1 | 1 | 0 | 0 | 0 | 0 | 0 |
| 2 | 17 | 37 | 0 | 0 | 15 | 293 | 19 | 1 | 0 | 35 | 16 | 3 | 0 | 7 | 12 | 6 |
| 3 | 0 | 1 | 0 | 0 | 0 | 33 | 16 | 6 | 0 | 2 | 7 | 6 | 0 | 0 | 10 | 9 |
| 4 | 0 | 1 | 0 | 0 | 0 | 17 | 6 | 9 | 0 | 1 | 6 | 6 | 0 | 0 | 1 | 13 |
| NAO− | Drought Class Month t + 1 | Drought Class Month t + 1 | Drought Class Month t + 1 | Drought Class Month t + 1 | ||||||||||||
| 1 | 2 | 3 | 4 | |||||||||||||
| Drought Class Month t – 1 | Drought Class Month t | Drought Class Month t | Drought Class Month t | Drought Class Month t | ||||||||||||
| 1 | 2 | 3 | 4 | 1 | 2 | 3 | 4 | 1 | 2 | 3 | 4 | 1 | 2 | 3 | 4 | |
| 1 | 71 | 7 | 0 | 0 | 31 | 30 | 0 | 0 | 0 | 0 | 0 | 0 | 0 | 0 | 0 | 0 |
| 2 | 28 | 26 | 0 | 0 | 10 | 297 | 8 | 0 | 0 | 32 | 7 | 0 | 0 | 2 | 6 | 2 |
| 3 | 0 | 1 | 0 | 0 | 0 | 15 | 8 | 1 | 0 | 6 | 6 | 2 | 0 | 0 | 6 | 5 |
| 4 | 0 | 0 | 0 | 0 | 0 | 4 | 8 | 0 | 0 | 1 | 3 | 8 | 0 | 0 | 0 | 20 |
| NAO+ | Drought class Month t + 1 | Drought Class Month t + 1 | Drought Class Month t + 1 | Drought Class Month t + 1 | ||||||||||||
| 1 | 2 | 3 | 4 | |||||||||||||
| Drought Class Month t − 1 | Drought Class Month t | Drought Class Month t | Drought Class Month t | Drought Class Month t | ||||||||||||
| 1 | 2 | 3 | 4 | 1 | 2 | 3 | 4 | 1 | 2 | 3 | 4 | 1 | 2 | 3 | 4 | |
| 1 | 44 | 4 | 0 | 0 | 23 | 33 | 0 | 0 | 0 | 0 | 0 | 0 | 0 | 0 | 0 | 0 |
| 2 | 26 | 34 | 0 | 0 | 10 | 323 | 12 | 0 | 0 | 19 | 19 | 0 | 0 | 2 | 7 | 2 |
| 3 | 0 | 2 | 0 | 0 | 0 | 28 | 13 | 1 | 0 | 1 | 10 | 4 | 0 | 0 | 5 | 13 |
| 4 | 0 | 0 | 0 | 0 | 0 | 4 | 5 | 7 | 0 | 0 | 3 | 7 | 0 | 0 | 2 | 29 |
| SPEI6 Date | NAO 4-Month Average | Drought Class at | Drought Class at Month t + 1 | SPEI12 Date | NAO 4-Month Average | Drought Class at | Drought Class at Month t + 1 | ||||||
|---|---|---|---|---|---|---|---|---|---|---|---|---|---|
| Month t − 1 | Month t | OBS | PRED | PRED_NAO | Month t − 1 | Month t | OBS | PRED | PRED_NAO | ||||
| Jan-12 | 2.09 | 4 | 4 | 2 | 4 | 3 or 4 | Jan-12 | 1.25 | 4 | 4 | 4 | 4 | 4 |
| Feb-12 | 1.86 | 4 | 2 | 2 | 2 | 2 | Feb-12 | 2.09 | 4 | 4 | 2 | 4 | 4 |
| Mar-12 | 1.82 | 2 | 2 | 2 | 2 | 2 | Mar-12 | 1.86 | 4 | 2 | 2 | 2 | 2 |
| Apr-12 | 2.08 | 2 | 2 | 2 | 2 | 2 | Apr-12 | 1.82 | 2 | 2 | 3 | 2 | 2 |
| May-12 | 0.69 | 2 | 2 | 2 | 2 | 2 | May-12 | 2.08 | 2 | 3 | 2 | 2 or 3 | 2 or 3 |
| Jun-12 | −0.03 | 2 | 2 | 4 | 2 | 2 | Jun-12 | 0.69 | 3 | 2 | 4 | 2 | 2 |
| Jul-12 | −1.00 | 2 | 4 | 3 | 4 | 3 or 4 | Jul-12 | −0.03 | 2 | 4 | 3 | 3 or 4 | 3 or 4 |
| Aug-12 | −1.77 | 4 | 3 | 4 | 2 | 3 or 4 | Aug-12 | −1.00 | 4 | 3 | 4 | 2 or 3 | 3 or 4 |
| Sep-12 | −1.29 | 3 | 4 | 4 | 3 or 4 | 3 or 4 | Sep-12 | −1.77 | 3 | 4 | 4 | 3 or 4 | 3 or 4 |
| Oct-12 | −1.44 | 4 | 4 | 3 | 4 | 3 or 4 | Oct-12 | −1.29 | 4 | 4 | 4 | 4 | 4 |
| Nov-12 | −1.60 | 4 | 3 | 2 | 2 | 3 or 4 | Nov-12 | −1.44 | 4 | 4 | 3 | 4 | 4 |
| Dec-12 | −1.55 | 3 | 2 | 1 | 2 | 2 | Dec-12 | −1.60 | 4 | 3 | 2 | 2 or 3 | 3 or 4 |
| Jan-13 | −1.29 | 2 | 1 | 1 | 1 | 1 | Jan-13 | −1.55 | 3 | 2 | 2 | 2 | 2 |
| Feb-13 | −0.66 | 1 | 1 | 1 | 1 or 2 | 1 or 2 | Feb-13 | −1.29 | 2 | 2 | 2 | 2 | 2 |
| Mar-13 | 0.08 | 1 | 1 | 2 | 1 or 2 | 1 or 2 | Mar-13 | −0.66 | 2 | 2 | 1 | 2 | 2 |
| Abr-13 | −0.58 | 1 | 2 | 2 | 2 | 2 | Apr-13 | 0.08 | 2 | 1 | 2 | 1 | 1 or 2 |
| May-13 | −0.73 | 2 | 2 | 2 | 2 | 2 | May-13 | −0.58 | 1 | 2 | 2 | 2 | 2 |
| Jun-13 | −0.69 | 2 | 2 | 2 | 2 | 2 | Jun-13 | −0.73 | 2 | 2 | 2 | 2 | 2 |
| SPEI6 Date | NAO 4-Month Average | Drought Class at | Drought Class at Month t + 1 | SPEI12 Date | NAO 4-Month Average | Drought Class at | Drought Class at Month t + 1 | ||||||
|---|---|---|---|---|---|---|---|---|---|---|---|---|---|
| Month t − 1 | Month t | OBS | PRED | PRED_NAO | Month t − 1 | Month t | OBS | PRED | PRED_NAO | ||||
| Nov-11 | 0.21 | 4 | 4 | 4 | 4 | 3 or 4 | Nov-11 | −0.55 | 3 | 3 | 4 | 3 | 3 or 4 |
| Dec-11 | 1.25 | 4 | 4 | 4 | 4 | 3 or 4 | Dec-11 | 0.21 | 3 | 4 | 4 | 3 or 4 | 3 or 4 |
| Jan-12 | 2.09 | 4 | 4 | 2 | 4 | 3 or 4 | Jan-12 | 1.25 | 4 | 4 | 4 | 4 | 4 |
| Feb-12 | 1.86 | 4 | 2 | 2 | 2 | 2 | Feb-12 | 2.09 | 4 | 4 | 2 | 4 | 4 |
| Mar-12 | 1.82 | 2 | 2 | 2 | 2 | 2 | Mar-12 | 1.86 | 4 | 2 | 2 | 2 | 2 |
| Apr-12 | 2.08 | 2 | 2 | 2 | 2 | 2 | Apr-12 | 1.82 | 2 | 2 | 3 | 2 | 2 |
| May-12 | 0.69 | 2 | 2 | 2 | 2 | 2 | May-12 | 2.08 | 2 | 3 | 2 | 2 or 3 | 2 or 3 |
| Nov-12 | −1.60 | 4 | 3 | 2 | 2 | 2 or 3 | Nov-12 | −1.44 | 4 | 4 | 3 | 4 | 4 |
| Dec-12 | −1.55 | 3 | 2 | 1 | 2 | 2 | Dec-12 | −1.60 | 4 | 3 | 2 | 3 or 4 | 2 or 3 |
| Jan-13 | −1.29 | 2 | 1 | 1 | 1 | 1 | Jan-13 | −1.55 | 3 | 2 | 2 | 2 | 2 |
| Feb-13 | −0.66 | 1 | 1 | 1 | 1 or 2 | 1 or 2 | Feb-13 | −1.29 | 2 | 2 | 2 | 2 | 2 |
| Mar-13 | 0.08 | 1 | 1 | 2 | 1 or 2 | 1 or 2 | Mar-13 | −0.66 | 2 | 2 | 1 | 2 | 2 |
| Apr-13 | −0.58 | 1 | 2 | 2 | 2 | 2 | Apr-13 | 0.08 | 2 | 1 | 2 | 3 or 4 | 3 or 4 |
| May-13 | −0.73 | 2 | 2 | 2 | 2 | 2 | May-13 | −0.58 | 1 | 2 | 2 | 2 | 2 |
| Nov-13 | 0.94 | 2 | 2 | 2 | 2 | 2 | Nov-13 | 1.38 | 2 | 2 | 2 | 2 | 2 |
| Dec-13 | 0.32 | 2 | 2 | 2 | 2 | 2 | Dec-13 | 0.94 | 2 | 2 | 2 | 2 | 2 |
| Grid Point | SPEI6 | SPEI12 | ||||||||||||||||||
|---|---|---|---|---|---|---|---|---|---|---|---|---|---|---|---|---|---|---|---|---|
| PRED (1) | Persistence | PRED_NAO (2) | Persistence | Difference: (2)−(1) | PRED (1) | Persistence | PRED_NAO (2) | Persistence | Difference: (2)−(1) | |||||||||||
| PC | HSS | PC | HSS | PC | HSS | PC | HSS | PC | HSS | PC | HSS | PC | HSS | PC | HSS | PC | HSS | PC | HSS | |
| 1 | 75.4 | 45.6 | 31.9 | 20.8 | 78.0 | 51.5 | 39.2 | 29.5 | 2.6 | 6.0 | 77.7 | 58.1 | 12.1 | 9.8 | 83.0 | 68.0 | 32.2 | 31.1 | 5.3 | 9.9 |
| 2 | 78.5 | 54.8 | 40.2 | 32.3 | 78.8 | 56.7 | 40.9 | 35.1 | 0.3 | 1.9 | 79.2 | 60.6 | 13.3 | 11.5 | 82.0 | 66.1 | 25.0 | 23.7 | 2.8 | 5.5 |
| 3 | 76.4 | 48.2 | 30.0 | 19.3 | 79.0 | 54.0 | 37.9 | 28.4 | 2.6 | 5.8 | 78.5 | 59.8 | 13.8 | 11.4 | 79.9 | 61.9 | 19.5 | 15.9 | 1.4 | 2.1 |
| 4 | 76.8 | 50.5 | 31.7 | 21.5 | 78.6 | 54.1 | 37.5 | 27.5 | 1.8 | 3.6 | 82.2 | 66.1 | 20.6 | 18.1 | 83.7 | 69.2 | 26.9 | 25.7 | 1.5 | 3.1 |
| 5 | 76.5 | 52.4 | 23.4 | 18.2 | 80.2 | 59.2 | 35.1 | 29.9 | 3.7 | 6.8 | 83.5 | 68.2 | 21.8 | 19.6 | 83.8 | 68.8 | 23.2 | 21.1 | 0.3 | 0.6 |
| 6 | 79.2 | 57.1 | 32.2 | 26.2 | 81.7 | 62.5 | 40.2 | 35.4 | 2.5 | 5.4 | 82.8 | 68.0 | 11.8 | 11.7 | 87.4 | 75.6 | 35.3 | 32.6 | 4.6 | 7.6 |
| 7 | 78.0 | 54.3 | 33.3 | 25.5 | 79.7 | 58.3 | 38.8 | 32.3 | 1.8 | 4.0 | 82.6 | 67.2 | 20.5 | 18.7 | 82.2 | 66.2 | 18.7 | 16.4 | −0.4 | −1.0 |
| 8 | 80.6 | 58.5 | 40.3 | 33.0 | 80.8 | 59.8 | 37.9 | 31.9 | 0.2 | 1.3 | 82.5 | 65.9 | 20.3 | 18.5 | 85.1 | 71.1 | 32.0 | 30.8 | 2.6 | 5.2 |
| 9 | 78.3 | 56.6 | 28.1 | 22.8 | 81.7 | 62.9 | 39.4 | 34.1 | 3.4 | 6.3 | 84.8 | 68.9 | 23.2 | 19.8 | 87.5 | 73.9 | 36.8 | 32.9 | 2.7 | 5.0 |
| 10 | 76.7 | 50.7 | 32.8 | 23.9 | 78.3 | 55.8 | 37.5 | 31.8 | 1.6 | 5.1 | 84.3 | 69.4 | 30.9 | 26.8 | 83.0 | 68.4 | 25.3 | 24.6 | −1.3 | −1.0 |
| 11 | 78.2 | 53.5 | 30.0 | 22.6 | 79.5 | 57.0 | 34.2 | 28.3 | 1.3 | 3.5 | 81.7 | 64.5 | 17.8 | 15.3 | 82.6 | 66.5 | 21.8 | 20.1 | 0.9 | 2.0 |
| 12 | 80.6 | 60.6 | 41.9 | 35.0 | 82.6 | 64.8 | 47.9 | 41.9 | 2.0 | 4.2 | 86.8 | 72.6 | 36.8 | 31.8 | 85.6 | 70.8 | 30.7 | 27.4 | −1.2 | −1.8 |
| 13 | 76.9 | 52.4 | 25.0 | 19.8 | 79.4 | 57.8 | 33.2 | 28.8 | 2.5 | 5.4 | 81.6 | 62.8 | 19.1 | 15.7 | 84.4 | 68.9 | 31.5 | 29.4 | 2.8 | 6.1 |
| 14 | 77.4 | 52.1 | 35.8 | 26.7 | 80.2 | 56.4 | 43.6 | 33.4 | 2.8 | 4.3 | 82.4 | 64.5 | 20.2 | 16.5 | 83.1 | 66.9 | 23.7 | 22.2 | 0.7 | 2.4 |
| 15 | 76.7 | 52.2 | 25.4 | 19.5 | 79.8 | 58.8 | 35.2 | 30.8 | 3.1 | 6.6 | 80.7 | 61.4 | 25.6 | 19.8 | 82.6 | 66.5 | 33.0 | 30.4 | 1.9 | 5.1 |
| Mean | 77.7 | 53.3 | 32.1 | 24.5 | 79.9 | 58.0 | 38.6 | 31.9 | 2.1 | 4.7 | 82.1 | 65.2 | 20.5 | 17.7 | 83.7 | 68.6 | 27.7 | 25.6 | 1.6 | 3.4 |
| Max | 80.6 | 60.6 | 41.9 | 35.0 | 82.6 | 64.8 | 47.9 | 41.9 | 3.7 | 6.8 | 82.1 | 65.2 | 20.5 | 17.7 | 83.7 | 68.6 | 27.7 | 25.6 | 1.6 | 3.4 |
| Min | 75.4 | 45.6 | 23.4 | 18.2 | 78.0 | 51.5 | 33.2 | 27.5 | 0.2 | 1.3 | 86.8 | 72.6 | 36.8 | 31.8 | 87.5 | 75.6 | 36.8 | 32.9 | 5.3 | 9.9 |
| SPI6 | PRED (1) | Persistence | PRED_NAO (2) | Persistence | Difference: (2)–(1) | |||||
| PC | HSS | PC | HSS | PC | HSS | PC | HSS | PC | HSS | |
| Mean | 80.2 | 55.1 | 36.7 | 27.9 | 80.8 | 57.2 | 38.7 | 31.3 | 0.6 | 2.1 |
| Max | 82.8 | 58.4 | 41.0 | 33.1 | 82.0 | 59.5 | 44.1 | 34.7 | 2.4 | 5.2 |
| Min | 77.8 | 49.6 | 26.7 | 19.6 | 78.6 | 54.8 | 32.5 | 26.6 | −1.3 | −0.6 |
| SPI12 | PRED (1) | Persistence | PRED_NAO (2) | Persistence | Difference: (2)–(1) | |||||
| PC | HSS | PC | HSS | PC | HSS | PC | HSS | PC | HSS | |
| Mean | 82.4 | 63.8 | 16.0 | 13.3 | 84.4 | 67.9 | 25.9 | 23.2 | 2.1 | 4.1 |
| Max | 85.3 | 69.0 | 27.1 | 22.2 | 86.1 | 70.4 | 35.1 | 31.7 | 5.4 | 10.1 |
| Min | 79.8 | 58.9 | 5.5 | 1.3 | 81.0 | 61.7 | 18.6 | 17.3 | 0.3 | 0.7 |
| SPEI6 | PRED (1) | Persistence | PRED_NAO (2) | Persistence | Difference: (2)–(1) | |||||
| PC | HSS | PC | HSS | PC | HSS | PC | HSS | PC | HSS | |
| Mean | 78.7 | 54.8 | 33.5 | 25.7 | 79.1 | 56.0 | 34.2 | 27.2 | 0.3 | 1.2 |
| Max | 82.5 | 62.7 | 41.3 | 33.9 | 81.1 | 60.6 | 41.9 | 34.5 | 2.5 | 6.4 |
| Min | 75.4 | 44.8 | 24.9 | 17.1 | 76.4 | 51.2 | 24.7 | 18.9 | −2.5 | −4.9 |
| SPEI12 | PRED (1) | Persistence | PRED_NAO (2) | Persistence | Difference: (2)–(1) | |||||
| PC | HSS | PC | HSS | PC | HSS | PC | HSS | PC | HSS | |
| Mean | 81.6 | 64.0 | 18.2 | 15.5 | 82.6 | 65.9 | 22.5 | 20.0 | 1.0 | 1.9 |
| Max | 83.8 | 68.2 | 29.2 | 25.6 | 84.3 | 69.6 | 26.5 | 23.0 | 2.5 | 5.2 |
| Min | 79.5 | 60.6 | 7.6 | 6.1 | 80.9 | 62.8 | 16.9 | 15.7 | −0.6 | −1.2 |
| SPI6 | PRED (1) | Persistence | PRED_NAO (2) | Persistence | Difference: (2)–(1) | |||||
| PC | HSS | PC | HSS | PC | HSS | PC | HSS | PC | HSS | |
| Mean | 79.0 | 52.0 | 34.0 | 24.3 | 80.2 | 54.5 | 37.8 | 28.3 | 1.2 | 2.5 |
| Max | 81.6 | 57.1 | 41.2 | 32.2 | 82.8 | 60.0 | 45.0 | 37.0 | 5.0 | 9.2 |
| Min | 75.3 | 44.0 | 23.4 | 13.6 | 78.5 | 48.5 | 32.0 | 20.8 | −0.6 | −2.0 |
| SPI12 | PRED (1) | Persistence | PRED_NAO (2) | Persistence | Difference: (2)–(1) | |||||
| PC | HSS | PC | HSS | PC | HSS | PC | HSS | PC | HSS | |
| Mean | 81.8 | 62.3 | 19.0 | 15.6 | 82.4 | 63.4 | 21.6 | 18.8 | 0.6 | 1.1 |
| Max | 84.6 | 66.8 | 25.8 | 21.2 | 85.2 | 69.1 | 34.1 | 29.4 | 4.0 | 6.1 |
| Min | 79.4 | 57.7 | 7.3 | 6.2 | 80.4 | 59.6 | 15.7 | 14.7 | −1.6 | −1.9 |
© 2018 by the authors. Licensee MDPI, Basel, Switzerland. This article is an open access article distributed under the terms and conditions of the Creative Commons Attribution (CC BY) license (http://creativecommons.org/licenses/by/4.0/).
Share and Cite
Moreira, E.; Russo, A.; Trigo, R.M. Monthly Prediction of Drought Classes Using Log-Linear Models under the Influence of NAO for Early-Warning of Drought and Water Management. Water 2018, 10, 65. https://doi.org/10.3390/w10010065
Moreira E, Russo A, Trigo RM. Monthly Prediction of Drought Classes Using Log-Linear Models under the Influence of NAO for Early-Warning of Drought and Water Management. Water. 2018; 10(1):65. https://doi.org/10.3390/w10010065
Chicago/Turabian StyleMoreira, Elsa, Ana Russo, and Ricardo M. Trigo. 2018. "Monthly Prediction of Drought Classes Using Log-Linear Models under the Influence of NAO for Early-Warning of Drought and Water Management" Water 10, no. 1: 65. https://doi.org/10.3390/w10010065
APA StyleMoreira, E., Russo, A., & Trigo, R. M. (2018). Monthly Prediction of Drought Classes Using Log-Linear Models under the Influence of NAO for Early-Warning of Drought and Water Management. Water, 10(1), 65. https://doi.org/10.3390/w10010065