Article

Subpixel-Based Precipitation Nowcasting with the Pyramid Lucas–Kanade Optical Flow Technique

1
State Key Laboratory of Geohazard Prevention and Geoenvironment Protection, Chengdu University of Technology, Chengdu 610059, China
2
Key Laboratory of Environment Change and Resources Use in Beibu Gulf, Data Science of Guangxi Higher Education Key Laboratory, Guangxi Teachers Education University, Ministry of Education, Nanning 530001, China
3
School of Atmospheric Sciences, Sun Yat-sen University, Guangzhou 510275, China
4
Guangdong Province Key Laboratory for Climate Change and Natural Disaster Studies, Guangzhou 510275, China
*
Authors to whom correspondence should be addressed.
Atmosphere 2018, 9(7), 260; https://doi.org/10.3390/atmos9070260
Submission received: 16 April 2018 / Revised: 25 June 2018 / Accepted: 6 July 2018 / Published: 12 July 2018
(This article belongs to the Special Issue Precipitation: Measurement and Modeling)

Abstract

:
Short-term high-resolution quantitative precipitation forecasting (QPF) is very important for flash-flood warning, navigation safety, and other hydrological applications. This paper proposes a subpixel-based QPF algorithm using a pyramid Lucas–Kanade optical flow technique (SPLK) for short-time rainfall forecast. The SPLK tracks the storm on the subpixel level by using the optical flow technique and then extrapolates the precipitation using a linear method through redistribution and interpolation. The SPLK compares with object-based and pixel-based nowcasting algorithms using eight thunderstorm events to assess its performance. The results suggest that the SPLK can perform better nowcasting of precipitation than the object-based and pixel-based algorithms with higher adequacy in tracking and predicting severe storms in 0–2 h lead-time forecasting.

1. Introduction

Severe precipitation storms usually lead to huge loss of lives and properties every year. For example, the Hota typhoon on 23 August of 2017 caused 17 deaths and direct economic loss of around 27.6 billion in China. Reliable precipitation forecast with high spatiotemporal resolution in these areas is very helpful for the local governments and public to take actions to deal with hazards related to precipitation storms. The short-term high-resolution quantitative precipitation forecasting (SQPF) is also referred to as “Nowcasting”, which extracts information from current observations (e.g., radar and satellite images), and can precisely predict precipitation intensity in a timely manner in a local region over a relatively short period (e.g., 1–6 h). Due to the detailed forecast of the precipitation, SQPF is widely used in meteorology, hydrology, transport systems, tourism, etc., such as for navigation safety and flash flood warning. In general, in terms of the length of prediction and the forecast skill, two methods are currently under development for the SQPF: numerical weather prediction (NWP) models and extrapolation-based techniques, both of them playing an effective and complementary role in SQPF. The NWP method, simulating the generation, growth, and disappearance of thunderstorms based on physical aspects of related atmospheric processes, is widely used in short and long period precipitation forecasts around the world [1]. However, due to sensitivity to assimilation algorithms, initial condition, and resolution, the NWP method has limitations with respect to short-term prediction of small-scale storms [2,3]. To offset the limitations of the NWP, extrapolation-based precipitation forecasting is introduced to forecasting the very short-term and small-scale precipitation storms. Compared to NWP, extrapolation-based precipitation nowcasting skills are more pronounced, especially in the first few hours of the storm events occurrence [4].
The extrapolation-based QPF algorithms, often based on the extrapolation of the radar reflectivity data or remote sensing data, can produce a reliable forecast with high spatial and temporal resolution in a very short time (0–2 h) [2,5,6,7,8]. Extrapolation-based QPF has developed quickly with the advance of the observed skill and computing techniques. Recently, a number of extrapolation-based QPF algorithms have been developed for hydrology and meteorology. These algorithms include the thunderstorm identification tracking analysis nowcasting (TITAN) algorithm [5] and the storm cell identification and tracking (SCIT) algorithm [9]. Moreover, the tracking of radar echoes by correlation algorithm (TREC) has been integrated into the National Weather Service (NWS) Warning Decision Support System (WDSS) to improve weather service. Recently, the optical flow (OF) algorithm is developed to provide enhanced nowcasting services to the public in Short-range Warning of Intense Rainstorms in Localized Systems (SWIRLS) in Hong Kong [10]. The Auto-Nowcast System (ANC) developed by the National Center for Atmospheric Research (NCAR) can produce time- and space-specific 0–1 h nowcasts of convective storm location and intensity [11]. In addition, the Integrated Nowcasting through Comprehensive Analysis (INCA) System is also widely used in some Europe countries and many Chinese provinces [12].
In general, extrapolation-based QPF algorithms are classified into two categories based on the level of the information extracted from the reflectivity data: pixel-based method and object-based method [13]. Both of the algorithms have been discussed in the literature [2,5,14,15,16]. The object-based method uses the image segmentation and storm identification techniques to treat radar images as a set of disjointed storm-patch regions to produce reliable nowcasting. However, it has a limitation in tracking small-scale storms and rapidly developing storm-patches. Furthermore, feature extraction and identification are the main problems with the object-based method, because of the complex and flexible characters in the storms. The pixel-based method considers the motion between two consecutive radar images and extrapolates the observations at the pixel level [13]. Pixel-based nowcasting algorithms are widely used in the nowcasting systems [2,7,14,17]. However, the pixel-based algorithms often mislocate rainy events because of the coarse spatial resolution of the radar images, and may introduce large uncertainty into the nowcasting system or overestimate the storm location. Overall, both pixel-based and object-based approaches have limitations for tracking small-scale (usually fast-moving) severe thunderstorms, in which storm location and intensity change very quickly in the lifetime. Accuracy is a critical problem in the nowcasting system. Therefore, it is necessary to develop a new nowcasting algorithm that is able to obtain higher accuracy and can intensively track the advection and precisely forecast the rainfall location and intensity. This new algorithm attempts to track the storm on the subpixel level, and to provide a more reliable forecast for real-time hydrometeorological applications.
Subpixel techniques are usually used to increase the spatial resolution in tracking tasks. Subpixel motion estimates, which provide better accuracy than the integer pixel, have been widely used in object tracking [18,19]. Subpixel motion estimation uses the interpolation operation to get the in-between pixel’s value. However, the subpixel technology used in object tracking often yields many discrete points [20]. To get a continuous image in the forecasting process, it must redistribute and interpolate motion estimates to neighboring grid points. Both redistribution and interpolation lead to the degradation or loss of small-scale features, which are known as implicit numerical diffusion or false dissipation [17]. At the same time, the key to redistribution is how to select the optimum radius of advecting influence: too large or too small will lead to the occurrence of the error. This study proposes a new method in storm tracking on subpixel level using pyramid Lucas–Kanade optical flow technology (PLKOF), which can provide accurate motion estimates.
The optical flow (OF) method, which evolved from determining the motion of objects identified by a series of images, was widely used in the subpixel tracking [18,20,21,22]. The OF algorithm can handle successive images in short time intervals, and has been applied successfully in computer vision tasks. Due to its efficiency in tracking moving objects, the OF algorithm has been used in rainfall forecast, and has been proven to be an effective algorithm in precipitation nowcasting [7,23]. However, the OF method still suffers from two limitations: firstly, the extracted wind fields are easily chaotic, due to their dependence on a maximum and statistically noisy operation. The solution of this problem is that the OF tends to smooth the image and impose a maximum deviation from a global motion vector [24]. Secondly, the OF has an “aperture” problem [25], which means that it is impossible to use subgrids to estimate the movement that is smaller than the solid grid, and lead to the forecast image discontinuity. To overcome these two problems, a new scheme is proposed based on location smooth process in subpixel scale in this study, i.e., subpixel-based PLKOF (SPLK), which can achieve higher accuracy and robustness. Experiments with radar data observed in eight rainfall storms indicates that the SPLK shows higher accuracy than the traditional pixel-based PLKOF algorithms.
This paper is organized as follows. The detailed explanations of the SPLK algorithm are introduced in Section 2. The data and the methodology used to evaluate the new method performance are described in Section 3. The validation results are shown and discussed in Section 4. Summary and future works are given in Section 5.

2. Methodology

Traditional extrapolation-based QPF algorithms should consist of a tracking and forecasting process [26]. To obtain a high accuracy nowcasting result, this study used the subpixel technique for the tracking and forecasting process. In the tracking process, the subpixel-based pyramid optical flow technique is introduced, and the subpixel tracking method brings sub-displacement and subvalue. In the forecasting process, the subpixel value is extrapolation with the liner schema. Finally, the subpixel value is redistributed to the pixel level, and interpolated to obtain the continuity forecasting images. Additionally, radar image contains insufficient information or noise, and the velocity computed by the subpixel-based optical flow method is not precise. Therefore, this study uses a smooth constraint to the velocity field to increase the accuracy of short-term nowcasting.
The input and processing steps of SPLK is shown in Figure 1. Detail descriptions of the different steps are given in Section 2.1, Section 2.2 and Section 2.3.
Firstly, the process of SPLK begins with the input of two successive radar rainfall images, and then data pre-processing is performed, i.e., filtering or smoothing with low-pass filters. Thirdly, the advection movement vectors (U, V) are tracked between two successive radar images using the subpixel-based PLKOF technique, which includes two substeps: build the Gaussian pyramid of the images and use the subpixel PLKOF technique to estimate the subpixel velocity field. Fourthly, use a linear method to extrapolate the rainfall and obtain subpixel value. Fifthly, two substeps are included: redistribute the subpixel value to the pixel level and use the interpolation method to obtain the continuity forecasting images. Finally, evaluate the performance of SPLK using traditional pixel-based and object-based verification algorithms. Details of these techniques are given in the following subsections.

2.1. Extrapolation-Based Nowcasting Algorithm

Severe thunderstorms are usually associated with small-scale, fast-moving features, and the shape changes with the time quickly. These thunderstorms often bring in heavy rain and lead to lots of flash floods. The advection-based nowcasting algorithm is expected to accurately predict these storms’ movements and future positions.
In general, data-driven extrapolation-based nowcasting algorithm often assumes that (1) the track is straight in a short time; and (2) previously-obtained information can be used to predict the storm trend in the next image.
Spatial scale is a critical factor in storm prediction and precipitation nowcasting. This study compared three spatial-scale nowcasting models: tracking of radar echoes by correlation (TREC), pixel-based QPF with PLKOF (PPLK), and subpixel-based PLKOF (SPLK). The first model is used widely in QPF and nowcasting systems [27,28]. The second model was proposed by Liu in 2015 [7]. The last one is a new algorithm that is introduced in this paper.
Tracking of radar echoes by correlation (TREC) is the most common technique for QPF, and has been used successfully in nowcasting [27,28]. It uses two consecutive radar images to determine a displacement vector and identify the most matching locations based on dividing the entire domain of imagery into same-size windows through maximizing the correlation coefficient. The details of the TREC used in this study are shown in Tuttle [27].
The pixel-based short-term QPF using PLKOF algorithm (PPLK) was first introduced by Liu in 2015. This algorithm was a pixel-based QPN method. The PPLK algorithm comprises three processes, including: (1) using the PLKOF model for tracking the motion of storms on the pixel level; (2) extrapolating the rainfall using a liner-based method which considers both the precipitation advection and change in rainfall intensity pixel by pixel; (3) interpolation based on the spatial–temporal characteristic of storm patches. More details of the PPLK can be found in Liu [7].

2.2. Subpixel Nowcasting Algorithm

2.2.1. Subpixel-Based Tracking with the Pyramidal Lucas–Kanade Optical Flow Model

Traditional optical flow estimates the motion field based on pixel level. However, the displacement of the precipitation regimes is not usually coincident with integer pixels, but the combination of several integer pixels and a subpixel (i.e., 2.3 pixels). If we treat the displacement as pixel level, it will introduce large errors into the motion tracking. To improve the accuracy, the subpixel-based pyramidal Lucas–Kanade optical flow (PLKOF) technique is introduced for tracking the subpixel motion [29].
Traditional Lucas–Kanade optical flow method introduces local constraints to construct an optical flow method to remedy the global smoothness [22]. The algorithm determines the optical flow as a solution of the following partial differential equation:
I x U + I y V + I t = 0 ,
where U and V denote the velocities in the x and y directions respectively, I ( x , y , t ) is the brightness of the pixel location on ( x , y ) at time t . Equation (1) (optical flow constraint equation, OFC) has two unknown variables that cannot be solved if no additional condition is provided. Lucas–Kanade optical flow utilizes the local differential method to calculate the movement of the pixel with the assumption that the optical flow remains constant in small range neighboring. Thus, in each local region Ω it minimizes the following equation:
W 2 ( x ) [ I ( x , t ) . v + I ( x , t ) ] 2 = 0 ,
where W(x) is a window function, and it has greater influence on neighborhood center than perimeter, and v = ( U ,   V ) T . Equation (2) can be solved with following Equation (3):
A T W 2 A V = A T W 2 b ,
where A = [ I ( x 1 ) , , I ( x n ) ] T ; b = ( I t ( x 1 ) , , I t ( x n ) ) T , and Equation (3) can be solved in the following Equation (4):
V = [ A T W 2 A ] 1 A T W 2 b
Equation (4) is calculated in closed form with A T W 2 A is a nonsingular matrix, as shown in Equations (5) and (6):
A T W 2 A = [ W 2 ( x ) I x 2 ( x ) W 2 ( x ) I x ( x ) I y ( x ) W 2 ( x ) I x ( x ) I y ( x ) W 2 ( x ) I y 2 ( y ) ]
A T W 2 b = [ W 2 I x ( x ) I t ( x ) W 2 I y ( x ) I t ( x ) ]
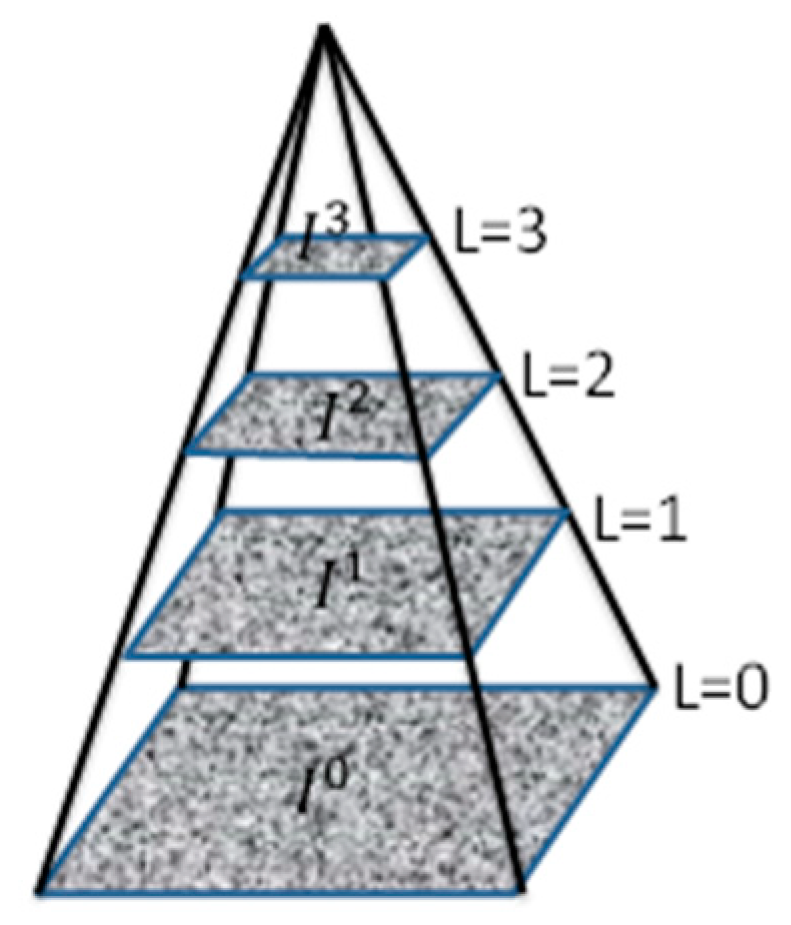
Although this local scheme is rapid and performs well when compared with the global scheme [30], it still has some troubles in handling fast-moving objects and large-scale movement because of the optical flow constraint equation. To overcome this limitation, Gaussian pyramid technique was applied [31]. The pyramid optical flow derives the flow field using pyramid image with every level. The key process is to construct a pyramid with image sequence, in which an image in high-resolution is sampled into a low-resolution image [32] (Figure 2). The Gaussian pyramid construction includes two steps: first, Gaussian smoothing is applied on the images; second, the image is down-sampled to obtain the resampled images. The resampled images compute the higher-level from the low-level using the function.
I L ( x , y ) = 1 4 I L 1 ( 2 x , 2 y ) + 1 8 ( I L 1 ( 2 x 1 , 2 y ) + I L 1 ( 2 x + 1 , 2 y ) + I L 1 ( 2 x , 2 y 1 ) + I L 1 ( 2 x , 2 y + 1 ) ) + 1 16 ( I L 1 ( 2 x 1 , 2 y 1 ) + I L 1 ( 2 x + 1 , 2 y + 1 ) + I L 1 ( 2 x + 1 , 2 y 1 ) + I L 1 ( 2 x 1 , 2 y + 1 )
where L is the level of the pyramid, L = 0, 1, 2… I 0 is the original image with highest resolution.
Traditional PLKOF often deals with pixel level motion tracking. To get the subpixel accuracy, all computation should be kept at the subpixel level. The procedure of subpixel-based PLKOF method can be described as follows:
(a)
Construct, recursively, a Gaussian pyramid composed of the two radar images using Equation (7). The level value L is set as four.
(b)
Compute the subpixel value using bilinear interpolation method between integer pixels at each level, which is critical to obtaining optical flow in subpixel accuracy.
(c)
Initialize the guess of the top-level optical flow: v L m = ( U L m , V L m ) = ( 0 , 0 ) T .
(d)
Let L = Lm.
(e)
Use the standard Lucas–Kanade algorithm Equations (3)–(6) to compute the residual optical flow d L = [ d x L , d y L ] at level L.
(f)
The optical flow v L 1 = ( U L 1 , V L 1 ) T at level L−1 can be estimated with the following Equation (8):
v L 1 = ( U L 1 , V L 1 ) T = ( 2 ( U L + d x L ) , 2 ( V L + d y L ) ) ) T .
The coefficient of 2 means the image size of the L − 1 layer is twice the size of the L layer, either on the x-axis or the y-axis.
(g)
Let L = L − 1, and go to step (e) and loop execution step (e) to step (f) until L = 0.
(h)
In the end, the optical flow v at level L = 0 (original image) is estimated with the following Equation (9):
v = ( U , V ) = ( U 0 + d x 0 , V 0 + d y 0 ) .
(i)
Smoothness constraint: the ( U , V ) obtained in step (h) is sensitive to noise, and the velocity field must be smoothed. Here, the velocity field ( U , V ) obtained above is smoothed with the Bowler smooth scheme based on the average of the eight nearest neighbors [23].
The advection velocity of rainfall objects can reach a maximum of 130 km/h [33]. Therefore, a rain pixel can move 13 km in the six-minute interval between successive images, which is equivalent to 13 pixels on the 1 km grid. Thus, if the precipitation velocity field is larger than 13 pixels, then the max threshold is selected for nowcasting.
The subpixel-based PLKOF used here can track the advection motion at higher accuracy than the traditional PLKOF because of the float type velocity rather than integer velocity. When the subpixel velocity field is diagnosed, it is required to be kept constant for the whole forecast time. That is, it is assumed that rainfall patterns are adverted as stationary motion.

2.2.2. Rainfall Extrapolation

Once the velocity field is obtained, an advection scheme to estimate the forecast precipitation rate will be used to do extrapolation for nowcasting. As mentioned in the literature, the advection schemes include forward scheme and the backward scheme [17]. In the forward advection scheme, the advected rainy intense value is needed to redistribute the subpixel value to the neighboring integer grids. In the backward scheme, the interpolation technique must be used to the integer grids value at the predicted origin. Only forward schemes maintain mass conservation [17].
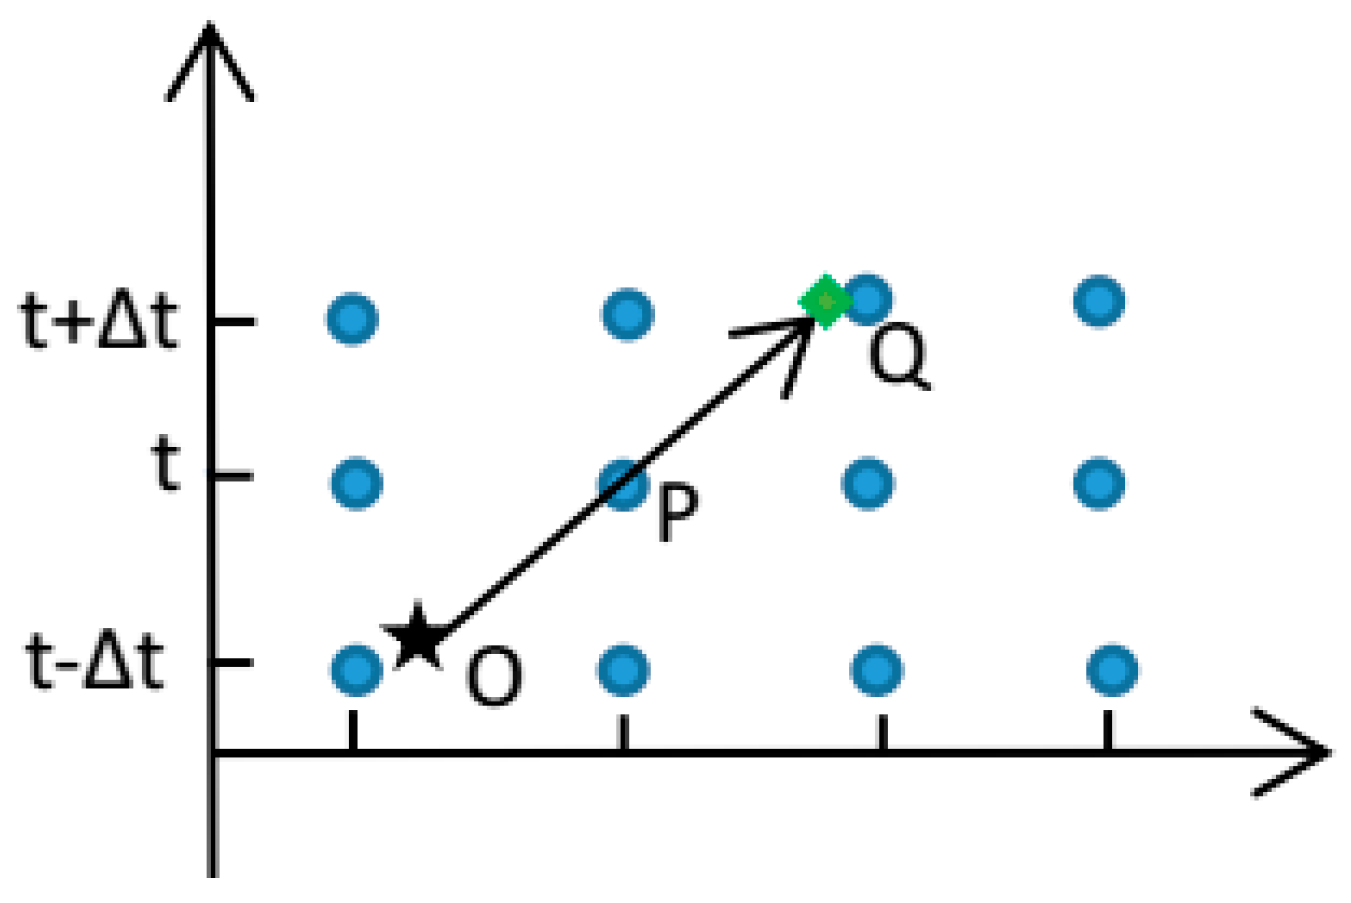
To estimate the decay and growth of the storm evolution, it is assumed that the precipitation intense changes linearly which can be estimated by two consecutive images. In addition, the motion field is assumed to be kept unchanged for the entire forecast period. The proposed algorithm (SPLK) uses the linear extrapolation technology and the velocity field ( U , V ) , which is calculated in the previous section for forecasting the storm motion. Figure 3 presents the schematic of extrapolation for three-time level advection based on linear method. In the forward scheme, it starts at a round number pixel P (at time t ) and moves them downstream to the point Q (at time t + Δ t ), whereas on a backward scheme, we advect upstream and estimate the point O (at time t Δ t ). Generally, both O and Q do not coincide with the integer grid point exactly and they become subpixels. And then, the redistribution and interpolation are require to be processed for these subpixels. The predicted rainfall intensity and location at time t + Δ t can be estimated according to previous time steps. The extrapolation scheme can be described as follows [2]:
Predicted rain rate:
R t + Δ t ( x t + Δ t , y t + Δ t ) = min { R t ( x t , y t , ) + Δ R , t h r e s h o l d }
Predicted rain rate trend:
Δ R = R t ( x t , y t ) R t Δ t ( x t Δ t , y t Δ t )
Predicted location:
( x t + Δ t , y t + Δ t ) = ( x t , y t ) + Δ ( x t , y t )
Predicted displacement:
Δ ( x t , y t ) = V R × Δ t
in which R t + Δ t ( x t + Δ t , y t + Δ t ) (mm/h) is the predicted rain rate at the subpixel level whose locations are on ( x t + Δ t , y t + Δ t ) at time t + Δ t , and R t ( x t , y t ) is the rain rate at time step t corresponding to the location ( x t , y t ) . Δ t is the time interval. V R = ( U , V ) is the velocity of the rain point form t Δ t to t, which has been diagnosed in Section 2.2.1 and remains constant for the entire forecast period. The threshold is the maximum possible rain rate of 50 mm/h.
Consider that the point O is not normally an integer pixel, and the image brightness value (the rainfall rate) is unknown, which is critical for estimating the rain rate trend ∆R. Therefore, it is necessary to compute the rainfall rate of point O which is not an integer pixel, but a subpixel. In order to compute the rainfall rate at a subpixel location, we propose to use the bilinear interpolation method. The process is as follows.
Let L be a generic pyramid level, and the rainfall rate of point O is R t + Δ t ( x t + Δ t , y t + Δ t ) where x t + Δ t , y t + Δ t are not integers, and let x 0 , y 0 be the integer parts of x t + Δ t , y t + Δ t . Let a x , a y be the two reminder values, then we get:
x t + Δ t = x 0 + a x ,
y t + Δ t = y 0 + a y .
The R t + Δ t ( x t + Δ t , y t + Δ t ) can be diagnosed by a bilinear interpolation scheme from the original image rain rate.
R t + Δ t ( x t + Δ t , y t + Δ t ) = ( 1 a x ) ( 1 a y ) R t Δ t ( x 0 , y 0 ) + a x ( 1 a y ) R t Δ t ( x 0 + 1 , y 0 ) + ( 1 a x ) a y R t Δ t ( x 0 , y 0 + 1 ) + a x a y R t Δ t ( x 0 + 1 , y 0 + 1 )

2.2.3. Redistribution of Subpixel Value to Integer Pixel

Since the forecast point Q is often not always an integer pixel (Figure 3), it is necessary to redistribute the subpixel value to the integer pixel that is critical for rebuilding the forecast image. The challenge associated with redistribution is choosing the optimum radius of influence. An extensive series of experiments have shown that a 3 × 3 pixels window gives the best performance and robustness for the model. The redistribution schema is shown in Figure 4. In order to explain the process, we take the red dot as an integer pixel center in the 3 × 3 pixel window, and the green diamond is the extrapolation point estimated by the Equations (10)–(13). The redistribution process is as follows.
(a)
If there is only a green point in the windows (Figure 4a), determine whether the point located in the grid of red point; if yes, assign the green point value to the red point, else, desert this green point and keep the value of red point unchanged.
(b)
If there are two green points in the windows, determine whether the two points are located on the same side of the red dot grid (Figure 4b), for example, the region of the purple dot line. If these green points are not located on the same side, estimate the value of the red point using the two points and the inverse distance method, else, desert these green points.
(c)
If there are more than three green points in the windows (Figure 4c), estimate the value of the red point by using the surrounding points and the inverse distance method.
(d)
Repeat the process until all the pixel values surrounded by the red point are identified and estimated. The redistribution process refines the motion field up to pixel level.

2.2.4. Spatial Interpolation

The forecasting image is discontinuous after the procedure of redistribution, since redistribution deals only with an individual pixel, and there are many “holes” in the forecast image. To address the problem, this study uses the spatial interpolation proposed by Liu [7], and makes some modifications to get a better result, and faster. The implementation process is as follows.
(a)
Identify the pixels in the extrapolation image which is neighboring in the original image.
(b)
If the non-data pixels in the extrapolation image are in the neighbor of the rainy pixels (use the 3 × 3 windows), then use the rainy pixels, and the inverse distance method to calculate the non-data pixels’ value. Then, assign the value to these non-data pixels.
(c)
Repeat steps (a)–(b) until all non-data pixels, which are surrounded by the neighboring rainy pixels, are identified and estimated. These pixels are located in the storm spot.
(d)
Estimate the pixels which are located on the edge of a storm patch using only three neighboring rainy pixels by the same method as used in the four rainy points as mentioned in steps (b)–(c).

2.3. Verification

2.3.1. Pixel-Based Verification

To assess the overall performance of the proposed algorithm, traditional pixel-based verification scheme has been done to evaluate the performance of the forecast values. Six indexes are used to verify the proposed algorithm, including (1) correlation coefficient (CORR); (2) root mean square error (RMSE); (3) bias (BIAS); (4) probability of detection (POD); (5) false-alarm ratio (FAR), and (6) critical success index (CSI). These indexes measure the agreement between observations (obs) and estimates (est). These indices are defined as Equations (17)–(23), [34].
(1) Correlation coefficient (CORR):
C O R R = i = 1 N ( ( P R o b s ) i ( P R e s t ) i ) [ N ( P ¯ R o b s ) P ¯ R e s t ) ] [ i = 1 N ( P R o b s ) i 2   N ( P ¯ R o b s ) 2 ] [ i = 1 N ( P R e s t ) i 2 N ( P ¯ R e s t ) 2 ]
The CORR ranges from [−1, 1], where values close to 1 indicate good performance.
(2) Root mean square error (RMSE):
R M S E = ( 1 N i = 1 N ( P R e s t ( i ) P R o b s ( i ) ) 2 ) 0.5
RMSE varies between 0 and ∞, and the smaller values correspond to better performance. This index provides information about the whole performance of the forecasting skill.
(3) Bias (BIAS):
B i a s = i = 1 N [ P R e s t ( i ) P R o b s ( i ) ] i = 1 N P R o b s ( i ) × 100 %
The bias measures the algorithm’s tendency of beyond (or underforecast) the rainy intense or rain area. A value close to 1 means an unbiased forecast, where forecast value coincides with that observed.
In Equations (17)–(19), P R e s t and P R o b s represent estimated and observed rain rates, N denotes the total number of rain pixels.
(4) POD, FAR, CSI:
The POD, FAR, CSI are defined as
P O D = n h n f + n h ,
F A R = n f a n f a + n h ,
C S I = n h n f + n h + n f a ,
where n f is the number of failures, n h is the number of hits, and n f a is the number of false alarms. By using a series of thresholds, the statistical indexes assess the ability to capture the rainy event occurrences at various rates. In this study, we set the intensity thresholds as 1 mm/h, 5 mm/h, 10 mm/h and 20 mm/h, representing drizzle, light, medium, and heavy rainfall, respectively [35].

2.3.2. Object-Based Verification

SAL (structure, amplitude, and location) is an object-based spatial verification method, which includes three distinct components that consider aspects of the structure (S), amplitude (A), and location (L) of the precipitation field [36]. The definition of the parameter is as follows:
A = D ( R m o d ) D ( R o b s ) 0.5 [ D ( R m o d ) + D ( R o b s ) ] [ 2 , 2 ] .
Here, D(R) represents the domain average of R.
V n = ( i , j R n ) R i j R n m a x ,
S = V ( R m o d ) V ( R o b s ) 0.5 [ V ( R m o d ) + V ( R o b s ) ]   [ 2 , 2 ] ,
where R n m a x denotes the maximum precipitation value R.
L 1 = | x ( R m o d ) x ( R o b s ) | d ,
L = L 1 + L 2   [ 2 , 2 ] ,  
where d represents the largest distance between two points, x(R) denotes the center of the R in the domain, and L 2 denotes the average distance between the center of R in the domain and the individual objects.
The precipitation objects are defined based on a given threshold. The choice of the threshold is critical to the performance of SAL. According Wernli (2008), the definition of threshold is taken as T H = R 95 × 1 15 , where R 95 denotes the 95th percentile of all grid point values in the domain. In this study, the 2 mm/h has been chosen to identify the precipitation in the SAL verification. Also, in the following figures, single forecasts are represented as a point in coordinates S (horizontal axis) and A (vertical axis), and colors indicate the values of L. A perfect forecast has all of the component values close to zero [36].

3. Data

The SPLK method was used to forecast the precipitation in next 2 h with the multi-radar multi-sensor (MRMS) QPE products. The MRMS system is developed by the National Severe Storms Laboratory (NSSL) and recently implemented at the National Centers for Environmental Prediction (NCEP) [37]. MRMS is developed using severe weather product components from the Warning Decision Support System–Integrated Information (WDSS-II) and using QPE product components from the National Mosaic and Multi-Sensor QPE (NMQ) system. The MRMS integrates about 180 radars, about 7000 gauges, and atmospheric environmental data across the Conterminous United States (CONUS), and provides a suite of QPE products with high spatial resolution of 0.01° × 0.01° and temporal resolution of 2 min. The MRMS provides four types of QPE products which include radar-based QPE, gauge-based QPE, local gauge bias-corrected radar QPE, and gauge-and-precipitation climatology-merged QPE. A detailed description of these four types of QPE products can be found in the study by Jian Zhang [37]. In this study, considering the high-resolution and rapid update estimation of spatial precipitation distributions, we use the radar based QPE (Q3rad) produce, which uses multiple R–Z relationships and provides surface precipitation rate (mm/h) every 2 min in the CONUS. Considering the consumption of computation, this study applied 600 × 600 grid images with a resolution of 0.01° × 0.01° for each 6 min interval, to evaluate the use of SPLK in the storm areas.
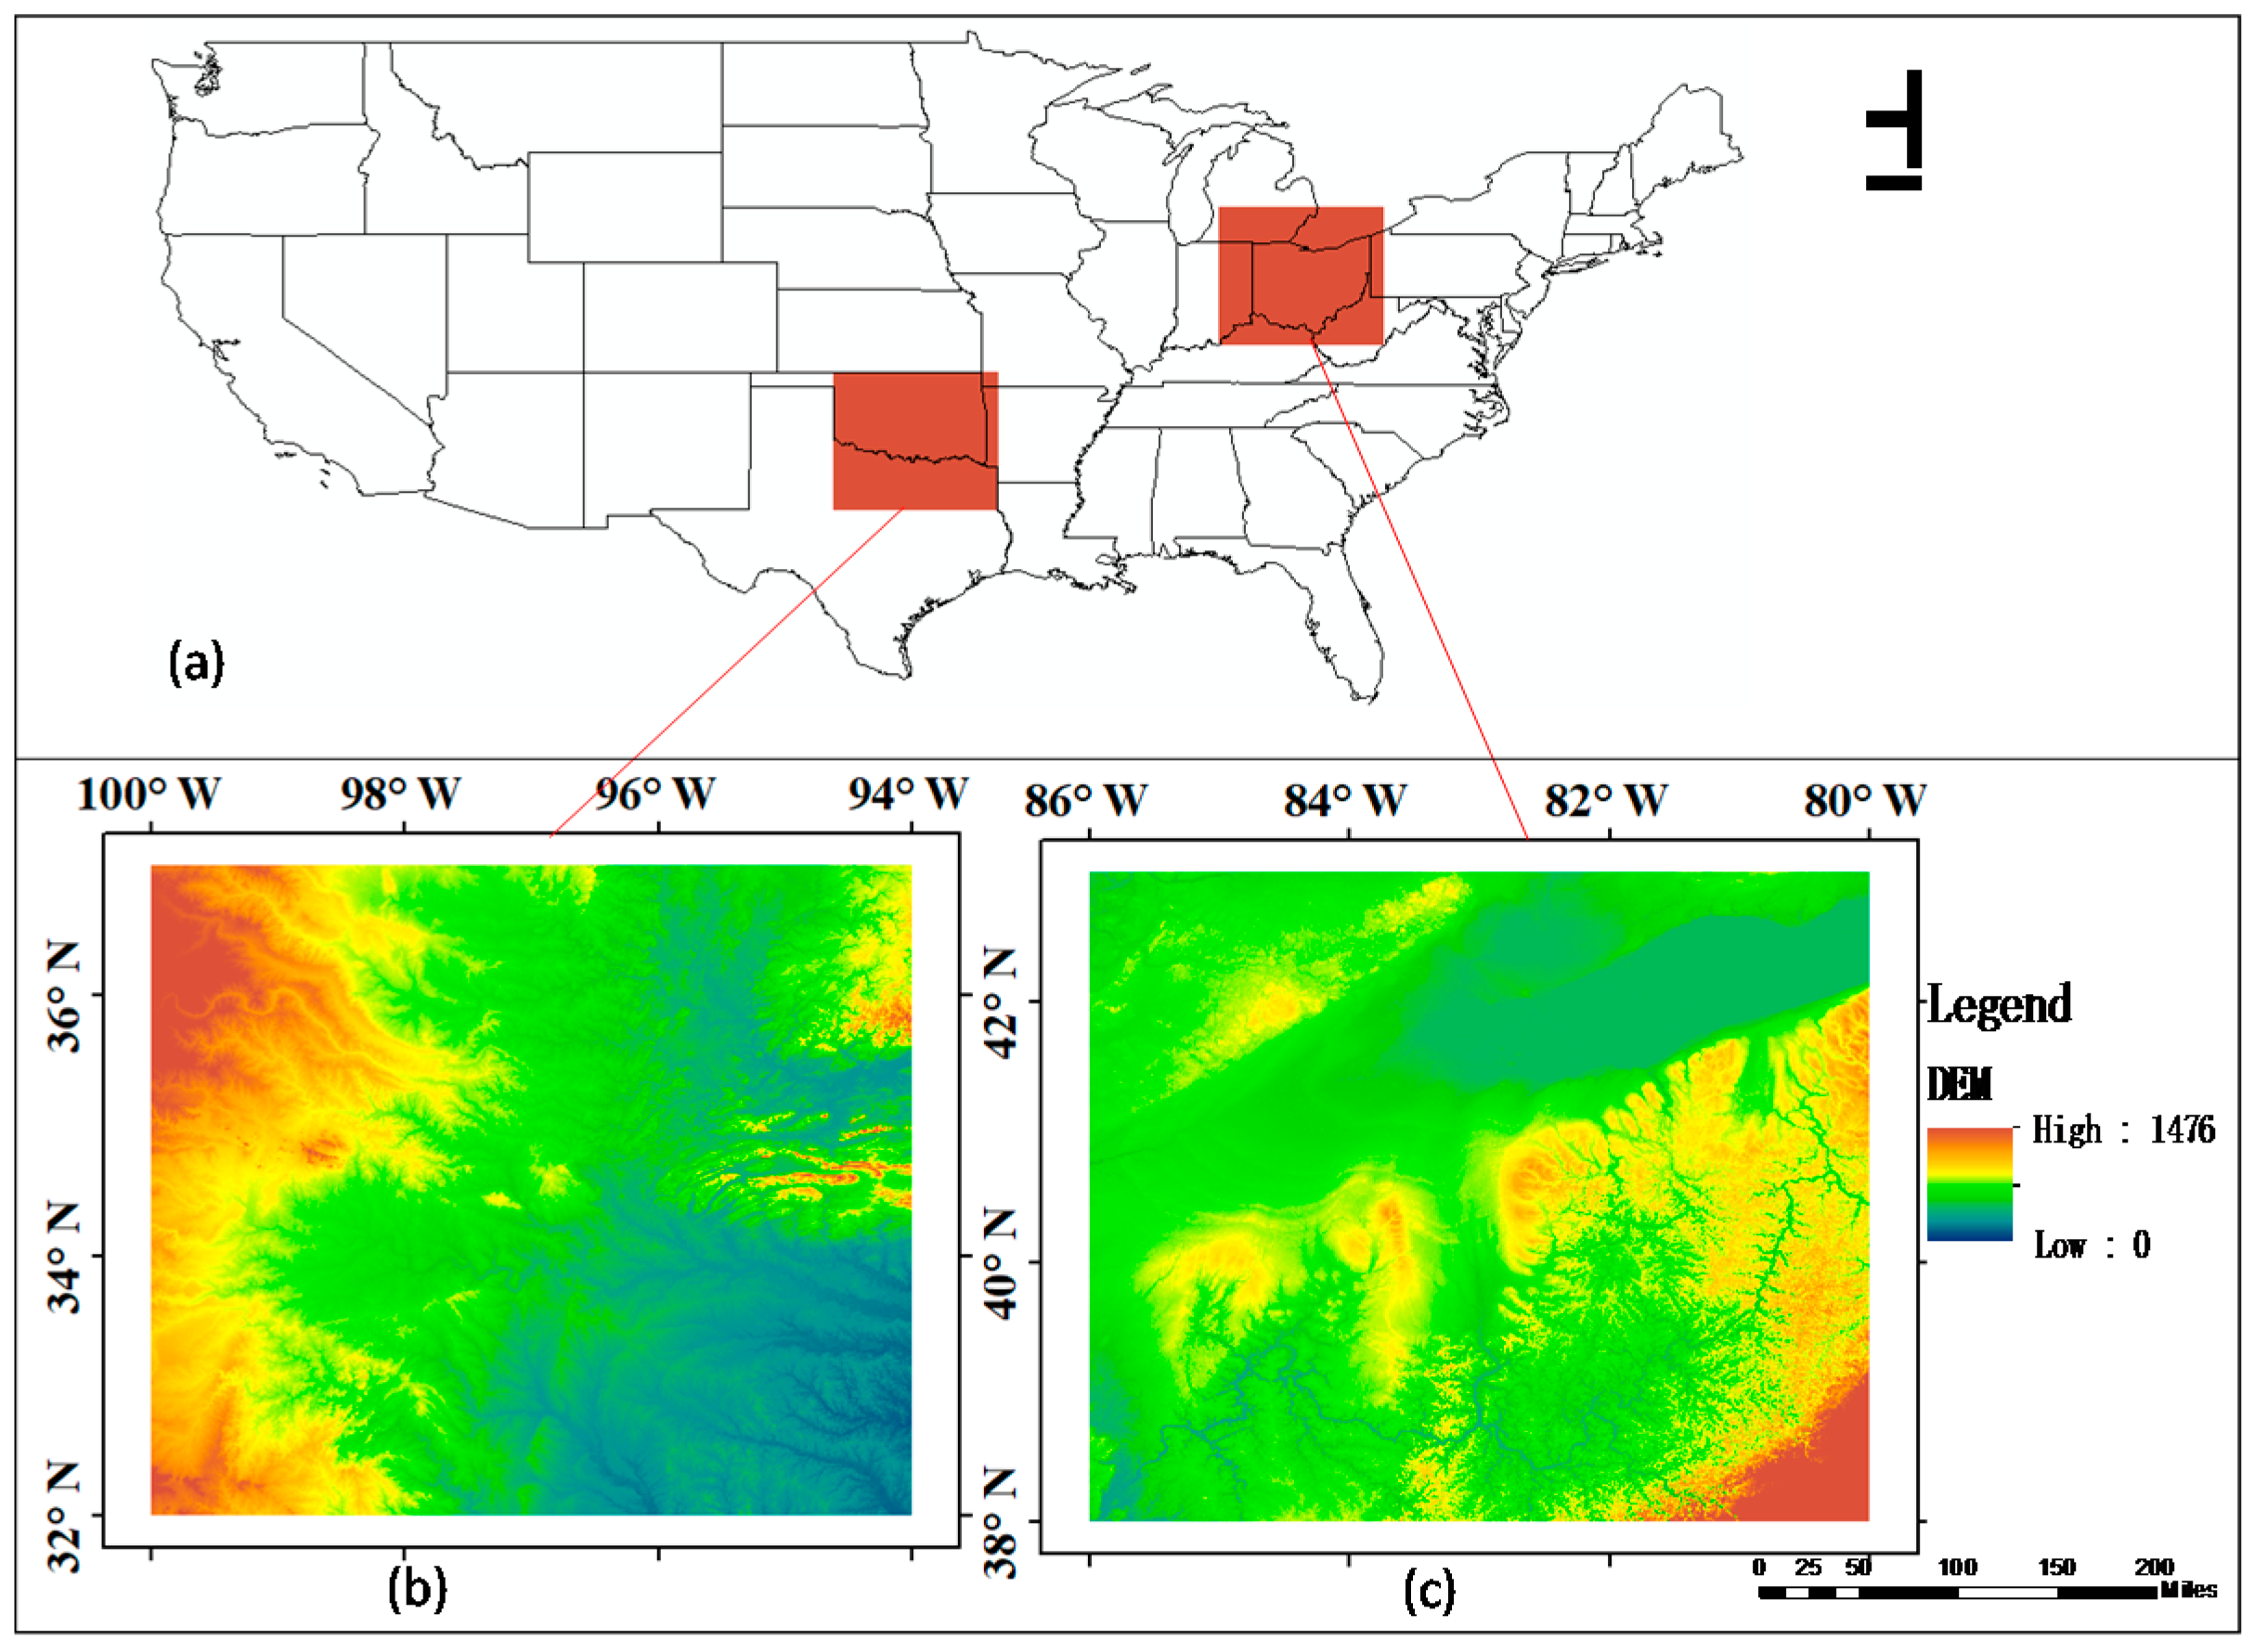
To assess the efficiency and robustness of the proposed method, we chose two study areas in COUNS, as follows (Figure 5).
The first study region is Oklahoma State. This region extends between 80 °   W 86 °   W and between 38 °   N 43 °   N , and usually suffers from severe weather (e.g., severe thunderstorms, large hail and tornadoes). Since Oklahoma lies between zones of differing prevailing temperature and winds, weather patterns within the state can vary widely over relatively short distances, and can change drastically in a short time.
The second study region is Ohio State. It extends between 94 °   W 100 °   W in longitude and between 32 °   N 37 °   N in latitude. The highest temperature in the state is 38 °C in summer and the lowest temperature in winter is −29 °C. The frequent contact between the dry and cold air in Canada, and the warm and humid air in the Gulf of Mexico leads to the frontal precipitation in this region. The annual precipitation is 965 mm.
In this study, eight significant precipitation events within the CONUS area between 2015 and 2016 were selected to test the proposed algorithm. The main features of these events can be seen in Table 1. These storm events all cause damage to life or property with the severe winds, flash flooding, and so on. Moreover, these storms are diverse geographically and in terms of the storm types, including large scale and small scale, slow movement and fast movement. Considering the efficiency and typicality, four storm events are highlighted according to their specific features (Figure 6). The first event (18 October 2015) is a fast-moving, large-scale frontal precipitation storm. An intense low-pressure system was located over Oklahoma. Warm and cold fronts moved and led to widespread precipitation in Oklahoma. The shape of the precipitation system changes rapidly. Due to the complicated structure, it is difficult to track and forecast (Figure 6a). The second storm (3 June 2016) was large-scale but moved slowly (Figure 6b). This storm, with a pronounced warm sector, has led to intense precipitation in the area with as much as 100 mm of the rain falling in 14 h. The maximum temperature was about 33   C . The third event (15 August 2015) is a small-scale and fast-moving convection event with heavy rainfall in a few hours. This storm led to serious flash-flood in the local area (Figure 6c). The fourth storm (1 August 2015), started with a localized convective precipitation system, and broke into several smaller parts that moved, rotated, and disappeared rapidly in a few hours (Figure 6d).

4. Results and Discussion

The performance of the proposed SPLK algorithm is evaluated with two approaches. The first approach evaluates the performance of the proposed algorithm to forecast four highlight events. The other approach represents the SPLK comparison with two nowcasting methods (TREC and PPLK). The results of the experiment will be discussed below.

4.1. The Performance of SPLK in the Selected Events

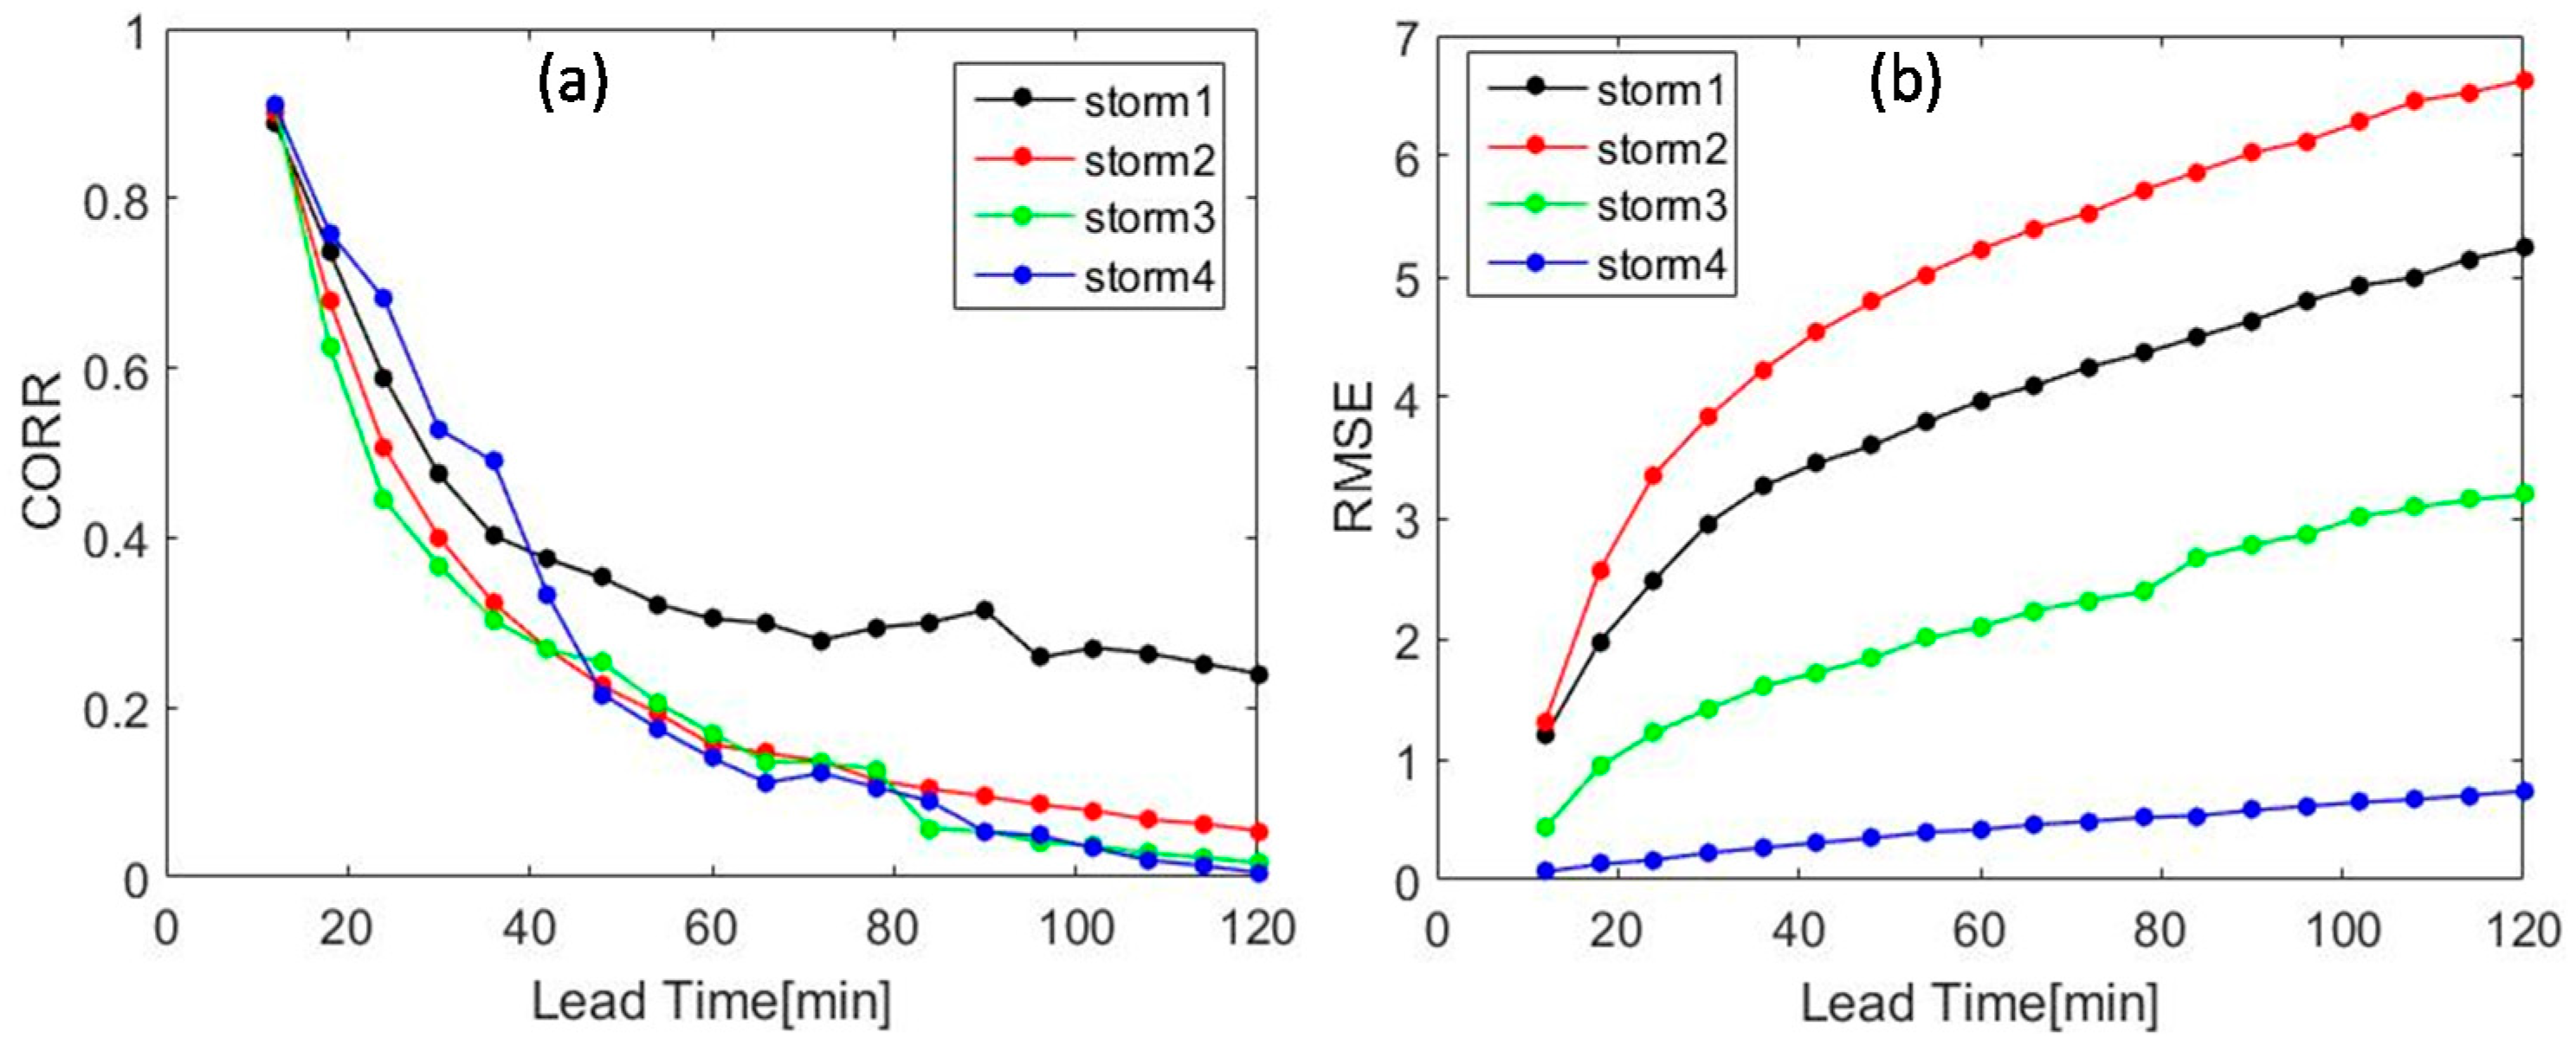
The performance of proposed SPLK in the selected events is presented in the Figure 7 and Figure 8. A major concern regarding any nowcasting algorithm would be its ability to accurately predict storm advection and the so-called position. To quantify the skill of the SPLK algorithm regarding its accuracy to predict storm position, CORR and RMSE indexes are used.
Figure 7 presents the CORR and RMSE of SPLK in four selected storms events. SPLK algorithm shows decreasing CORR and increasing RMSE as the leading time pass. It is noted that the CORR reaches 0.7 and the RMSE is less than 3 mm in the first 30 min for storm1, storm3, and storm4. With the lead-time increasing, the forecasts became less skillful. Particularly, it is clear that the SPLK performs best in the first 30 min in storm4, and SPLK shows highest CORR after 40 min in storm1. This indicates that the SPLK method is more skillful in nowcasting the small-scale and fast-moving storms in very short time (e.g., 30 min), and the SPLK is suitable for the large-scale, fast-moving characteristic of storm in the whole forecast time, especially after 30 min. The storm2 and storm3 have shown a similar trend of scores in the forecast time. The storm2 data demonstrates a slightly better CORR than storm3. The RMSE of storm2 is the highest during the whole forecast period, almost reaching 7 mm/h in 120 min. Generally, these results suggest that SPLK algorithm is skillful in the fast-moving and small-scale storms with complicated processes, but a little poor for the large-scale storms. This result also confirms the strong points of the pyramid Lucas–Kanade optical flow algorithm in tracking the fast-moving objects.
Figure 8 presents the three statistical indexes (POD, FAR, CSI) of the average of the four events using the SPLK method at +30, +60, +90, +120 min lead time with different rain-intensity thresholds (1, 5, 10, 20 mm/h). As shown in the figure, SPLK has a good performance in the whole forecast time with the minimum threshold (1 mm/h) with the index of POD all over 0.5. With the increasing of the threshold, the precipitation detection skills diminish, especially for the maximum threshold (20 mm/h), the POD only 0.2. This is because high intensity precipitation usually connects with tropical cyclones or convective storm development in a highly unstable atmosphere. This is typically on a smaller scale, and more unpredictable than low intensity precipitation [15]. In terms of the forecast time, the SPLK algorithm provides promising predictions in the first 30 min (Figure 8a). The POD with different thresholds reach 0.45 to 0.7, indicating that the rainfall patterns are well captured at the beginning of the forecast period, especially at thresholds less than 5 mm/h. It may be that the deformation of shape is too large to predict. As the threshold and lead time increase, the FAR increases rapidly (Figure 8b), which means that during intense precipitation events, it is easy to overestimate the rainy pixels. In terms of CSI (Figure 8c), with the increasing of the forecast time, the value decreases sharply, especially in a high threshold. This is because that intensity of rainfall is usually associated with tropical cyclones or convective development in highly unstable atmosphere, and thus, difficult to predict when compared to low-intensity rainfall [15].
Table 2 presents the SAL values for the four selected events with the threshold of 2 mm/h in various forecast time. It can be seen that all components of SAL are fairly small for the first half hour, indicating a high-quality forecast in all cases. As the lead time increases, the value of SAL increases quickly, indicating that SPLK overestimates the occurrence of precipitation. It is noted that in all case studies, the value location (L) is low in the whole forecast period (average L = 0.105), which means that the SPLK captures the location of the precipitation accurately. The structure (S) values are all greater than 0, and the mean value reaches 1, which indicates that the SPLK forecast does not capture the localized, and rather peaked characteristics of the storms. Also, there is a general overestimation of the precipitation amount (average A = 1.06). In terms of the average scores, storm3 shows the best performance, where most of the components are lower than others, and the worst is storm4.
As shown in the previous result, the SPLK has a good performance in the selected events, especially in the first 30 min, but decreased very quickly in the last lead time. It is confirmed that the extrapolation-based QPF forecast skill decreases quickly with the increasing of forecast time [1], and the decrease in skill is because of the characteristic and developing process of the rainfall [38].

4.2. Comparison of the SPLK with TREC and PPLK Method

To demonstrate advantage of the SPLK over other QPF algorithms, three nowcasting algorithms (i.e., the SPLK, TREC, and PPLK) are selected for experiments. The comparison results are displayed in Figure 9, Figure 10, Figure 11, Figure 12 and Figure 13.
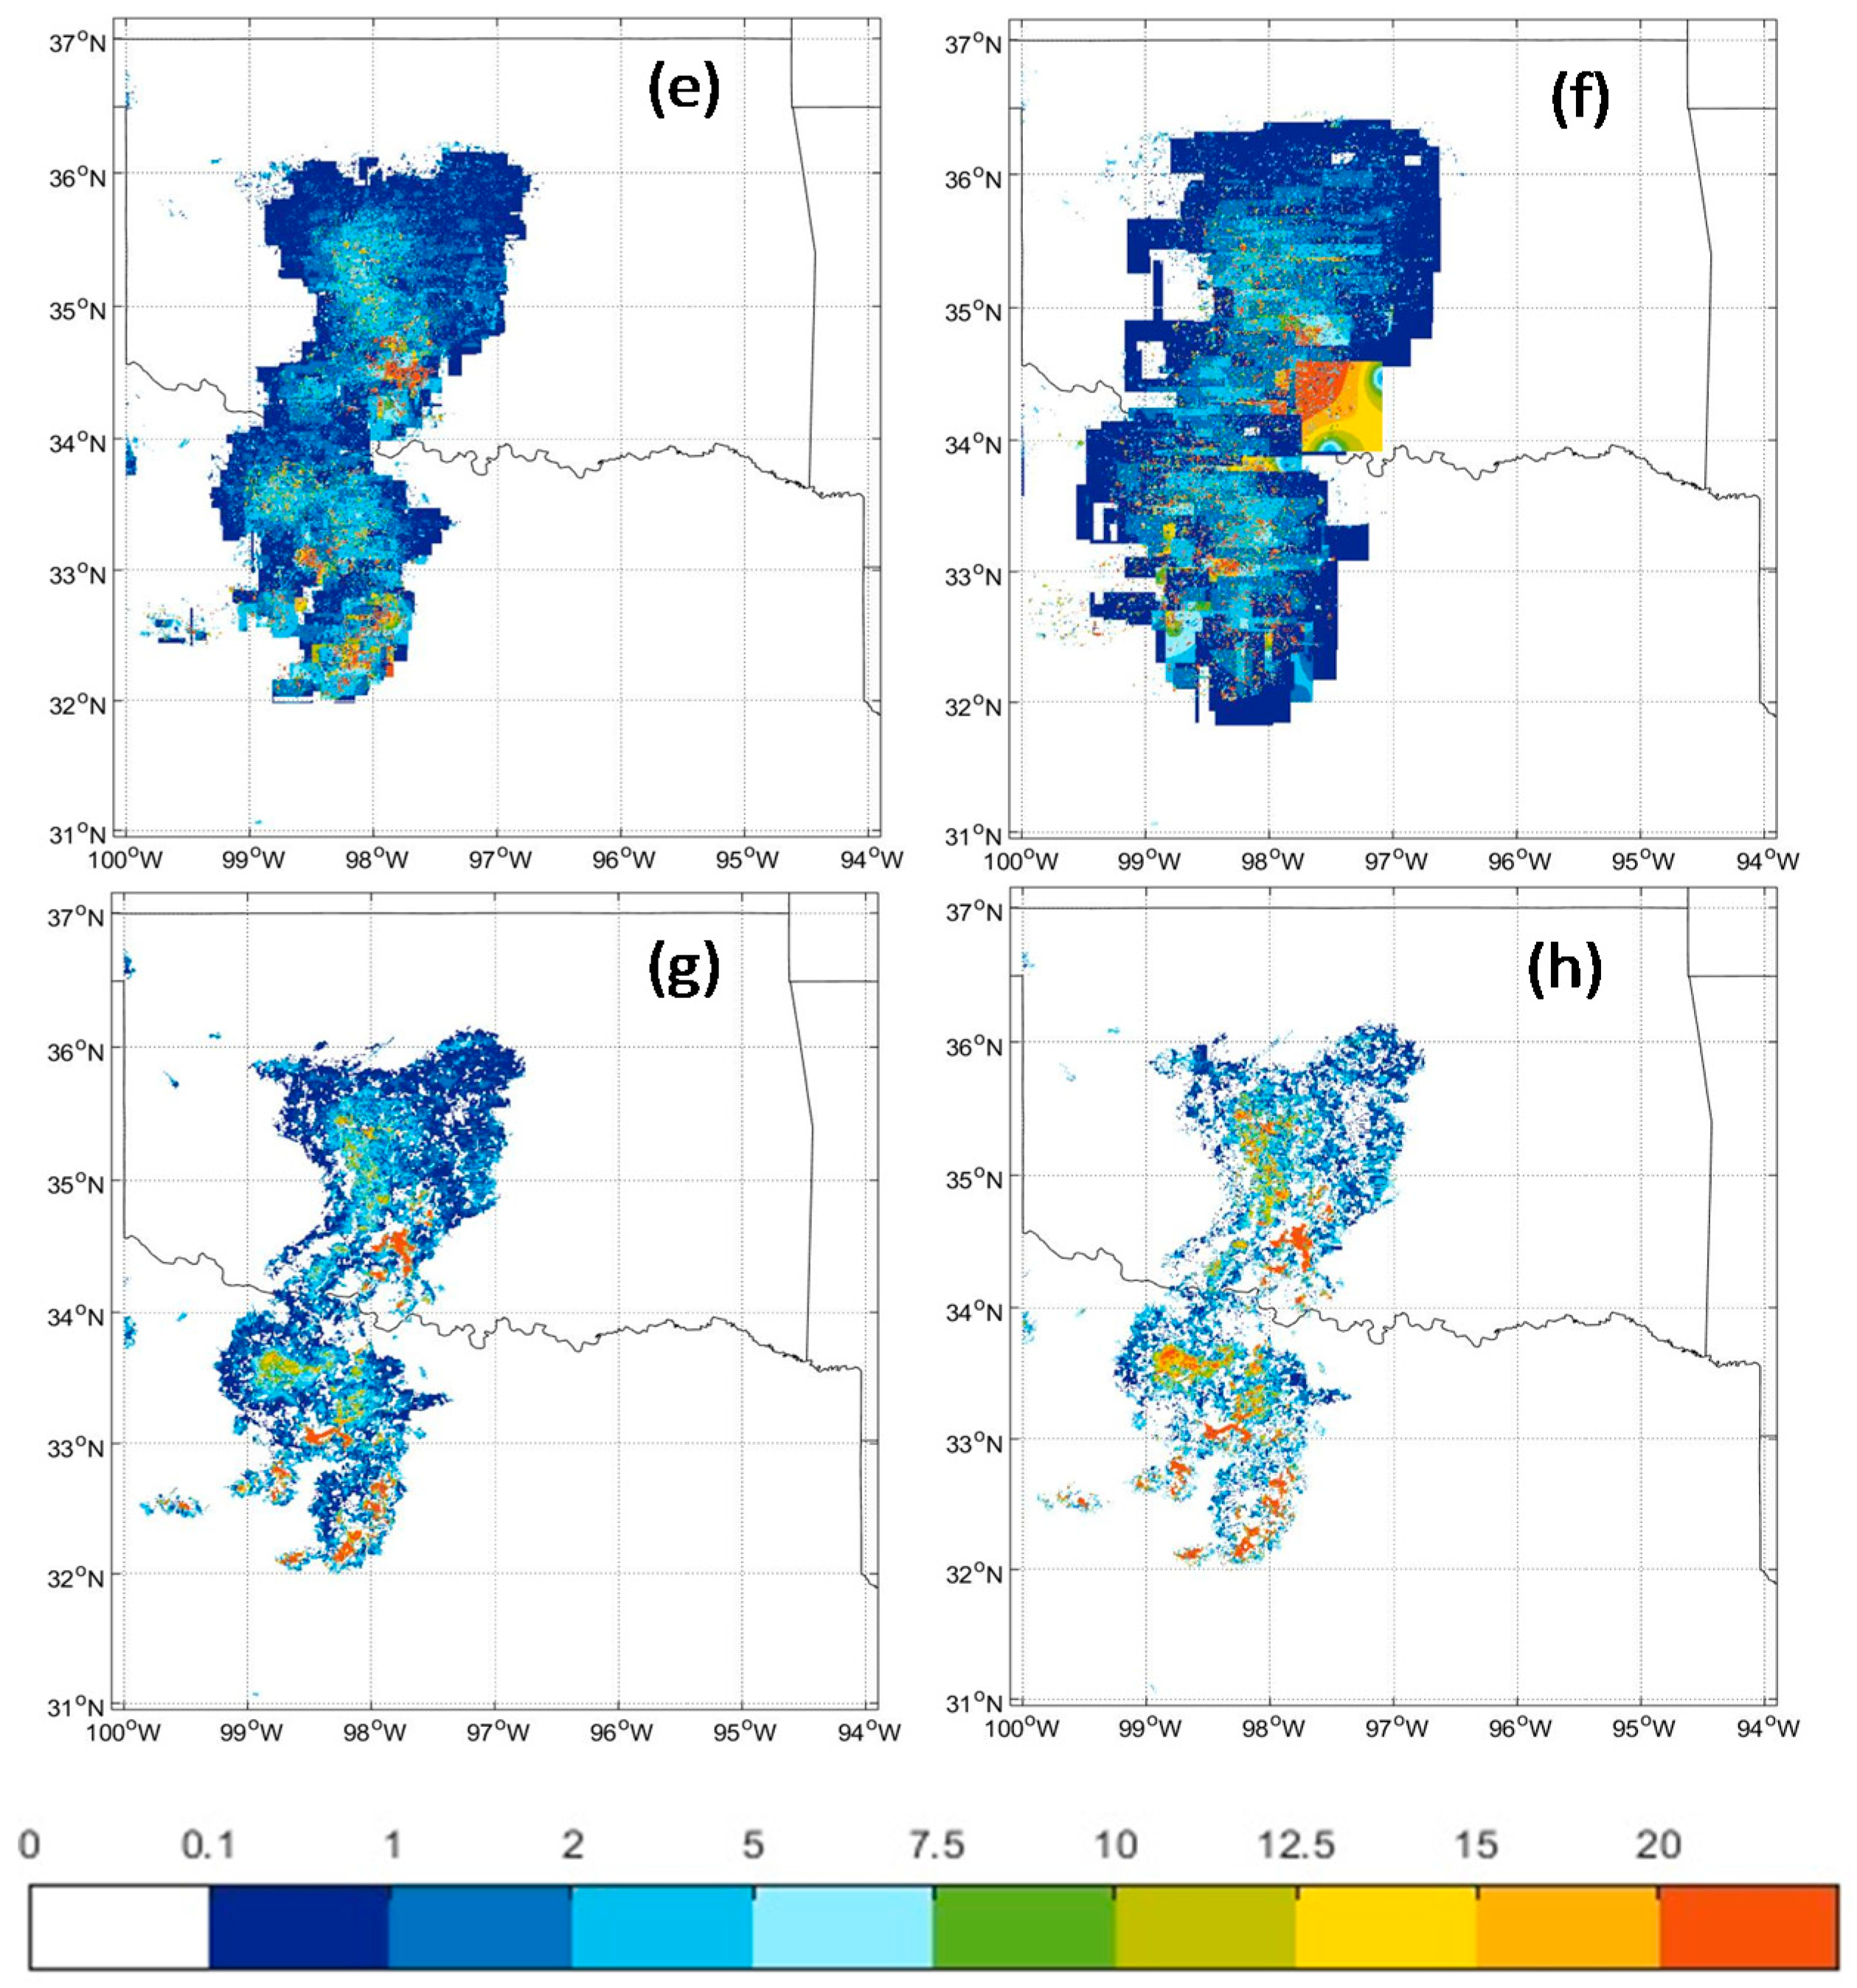
Figure 9 shows the observed images and the forecast precipitation images derived by three models (SPLK, TREC, PPLK) at the lead times 12 min and 30 min. The forecast began at 3:00 UTC on 18 October 2015 (Figure 6a) and the time interval is 6 min. The results show that SPLK and PPLK track advection cell without deformation at the first 12 min, because both of them are using PLKOF to track the storm. It is clear that the forecast image by SPLK is closer to the original image (Figure 6a), and the result from PPLK shows more “holes” in the forecast image. The reason may stem from the spatial interpolation process (Section 2.2.4). The PPLK method estimates the non-date pixels just considering the condition that non-date pixels located in the square of four rainy pixels as vertices, and the SPLK method used the two rainy pixels that are located in the 3 × 3 windows. The TREC method using the correlation coefficient usually overestimated the intensity and location, especially in the intensity area. However, the forecast images in the 30 min using the SPLK and PPLK method still has the “aperture” problem, which is an inherent problem from the optical flow.
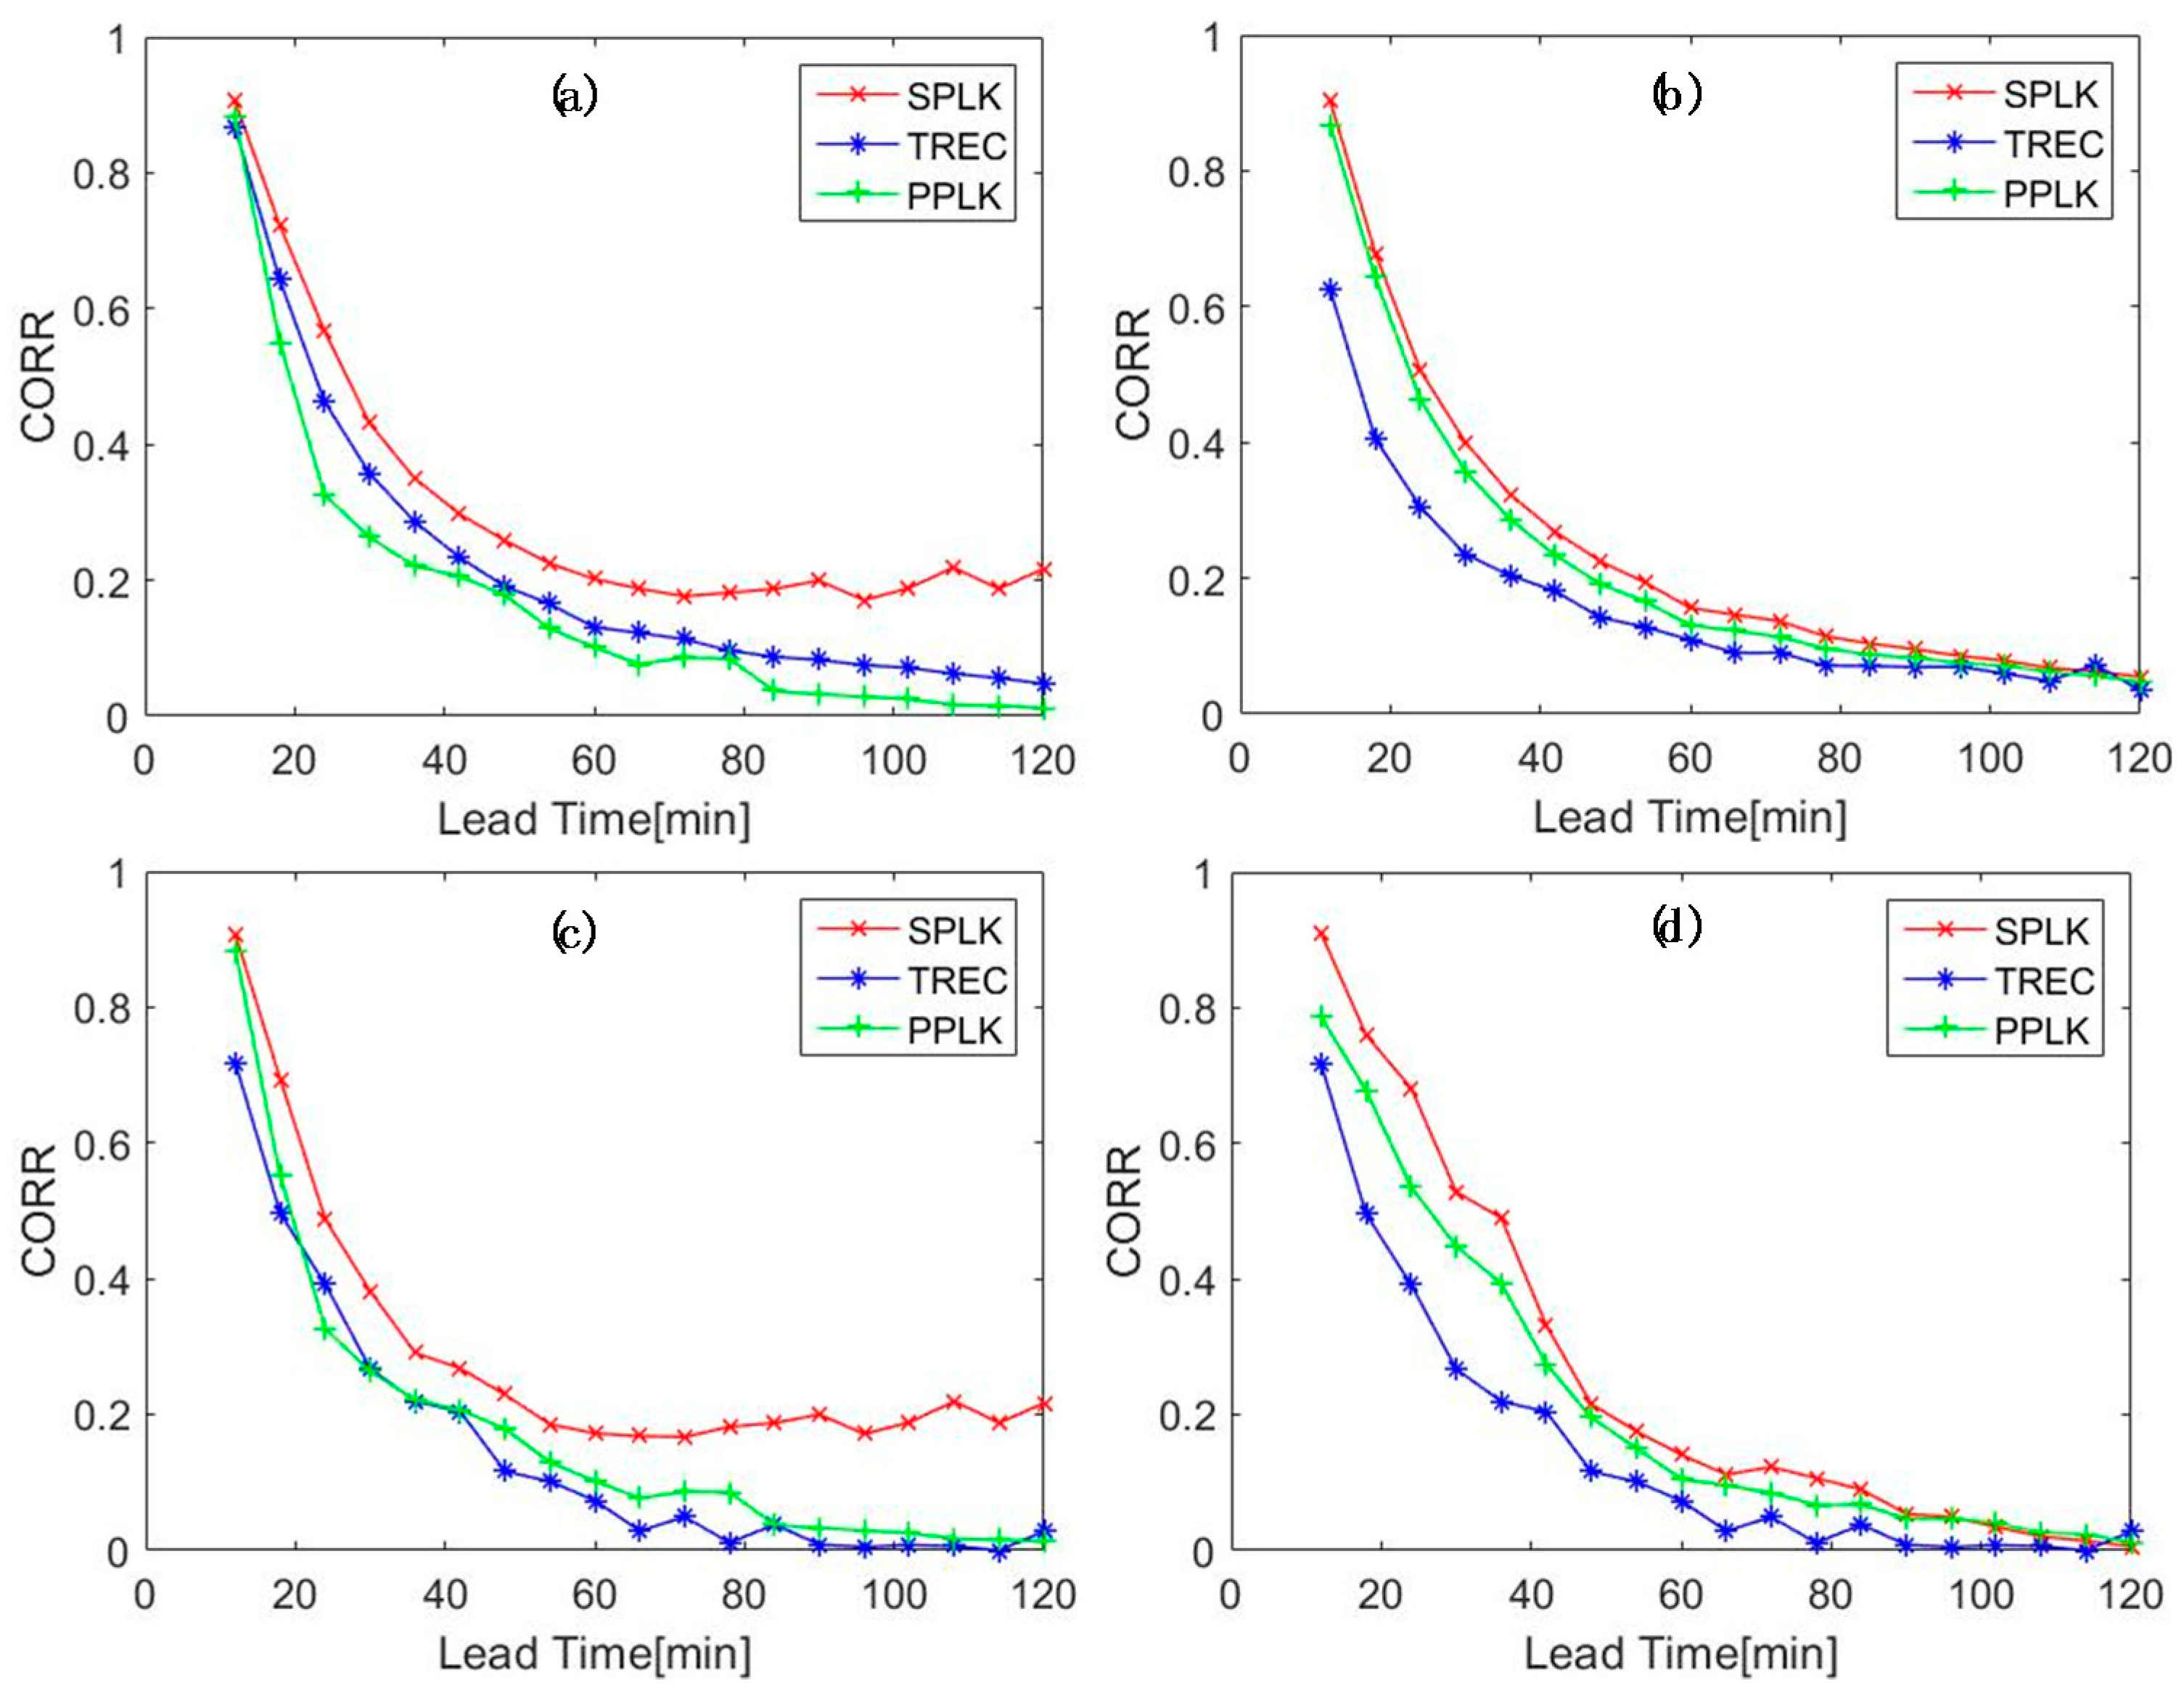
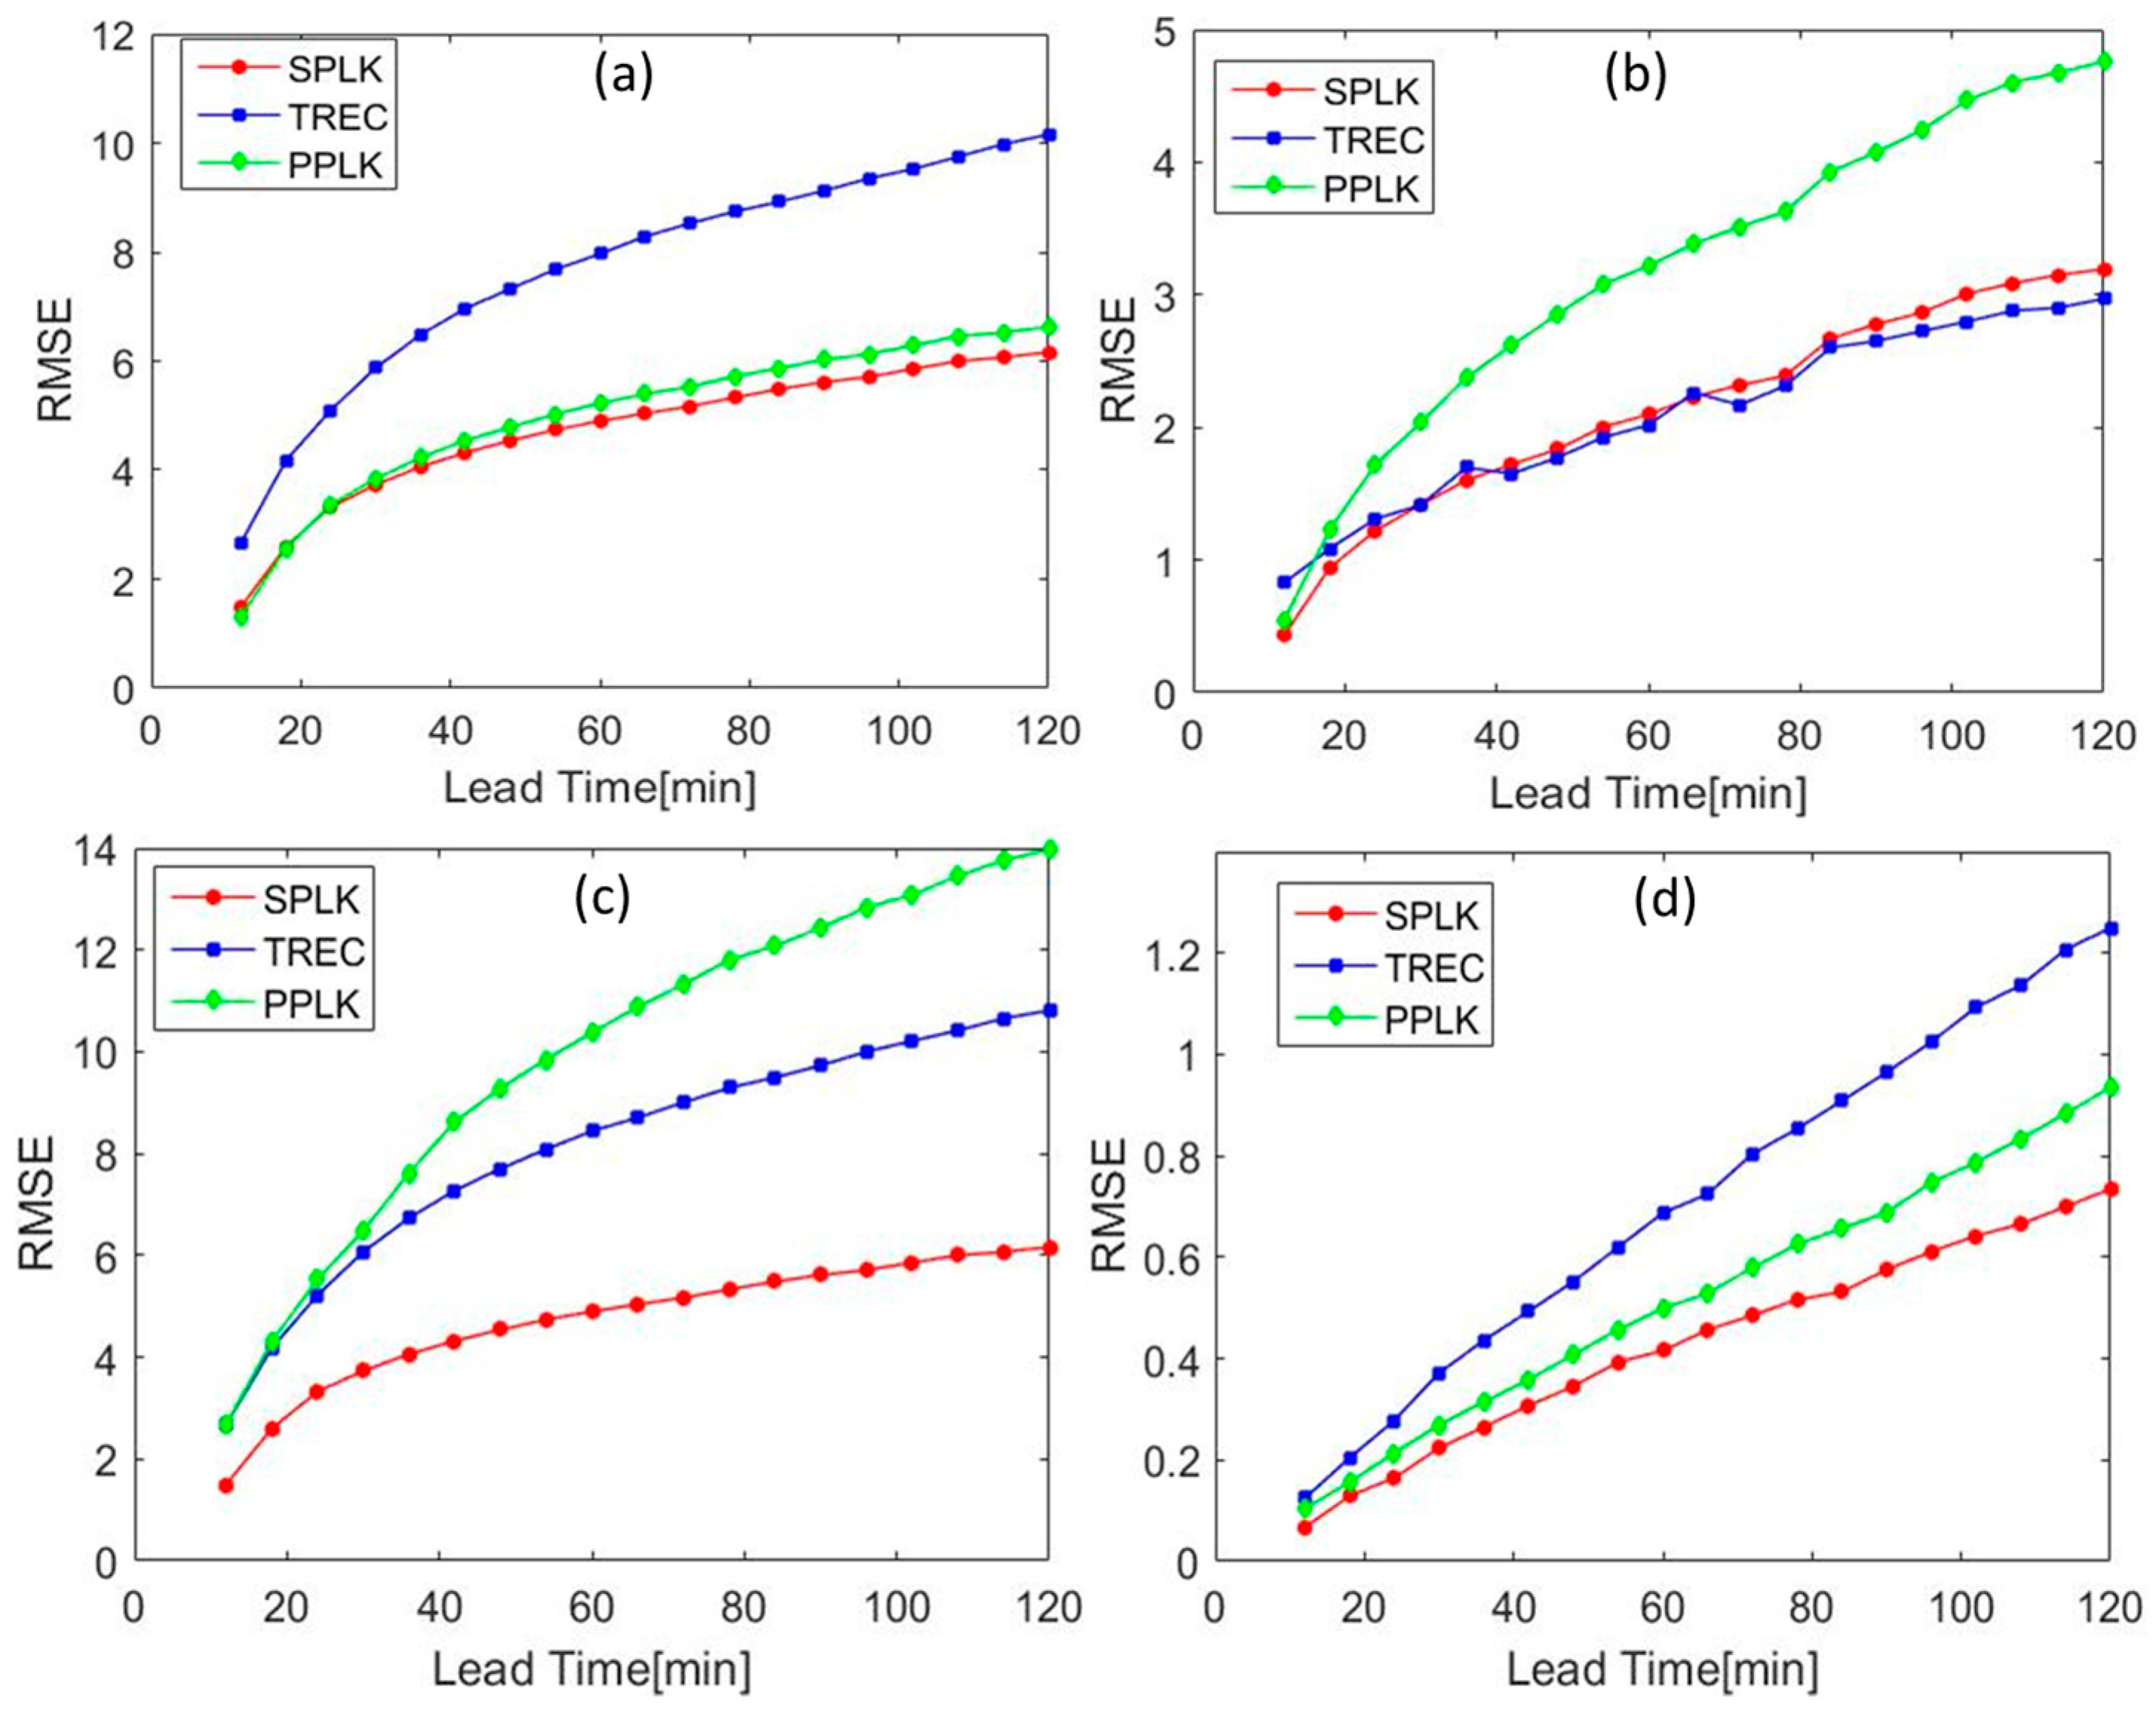
Figure 10 and Figure 11 show the comparison results for the CORR and RMSE of the four selected events using three nowcasting methods. According to Figure 10 and Figure 11, the SPLK shows improved performance in the forecasting time, especially in the first 30 min. Compared with the other algorithms, the SPLK algorithm performs best, the PPLK is second, and the TREC last.
As shown in Figure 10, SPLK has better CORR than other algorithms in the four storms, especially in storm1, storm3, and storm4. This indicates that the SPLK method has pretty good performance in most of the precipitation events.
Figure 11 presents the RMSE of three nowcasting algorithms (SPLK, PPLK, and TREC) in four precipitation storms. All of the methods show prediction skill decreasing rapidly over the forecast time. In each case, the RMSE always increased with lead time for all the forecasting methods. Comparing with the other two methods, the RMSE of SPLK is the lowest among three nowcasting algorithms for storm1, storm3, and storm4 (Figure 11a,c,d), and especially for storm4, the RMSE only reached 1.2 for 2 h forecast time. This illustrates that SPLK outperforms PPLK and TREC. In Figure 11b, the SPLK and TREC methods perform compatibly, with very close RMSE values, and show much better skill than PPLK. Overall, the SPLK algorithm has better performances than PPLK and TREC.
Figure 12 provides the results of the statistical indexes at different intensity levels by comparing the skill of SPLK and PPLK for the four selected events. It is noted that the ability of the SPLK to capture the location of rainfall events is superior to PPLK at different intensity levels.
As shown in Figure 12a–c, it is clear to see that the SPLK is more skillful than the PPLK for the different thresholds. In general, the POD and bias all decrease with increasing lead time (Figure 12a,c). Furthermore, both SPLK and PPLK show a little improvement with the lower threshold for all the cases at the first one hour of lead time. This is because the lower threshold can decrease the number of misses and increase the number of hits. Therefore, the POD and bias with lower threshold are higher than the larger one. In terms of FAR (Figure 12b) both of two technologies increase sharply in a higher threshold, and almost reach to 1, because the extrapolation-based QPF tends to overestimate the intensity and the area of the precipitation events, and leads to a worse index, as shown.
Table 3 presents the average scores of three statistics indexes (POD, FAR, CSI) for all eight events at different lead times (12 min, 30 min, 60 min, 90 min, 120 min), with a threshold of 1 mm/h. The results indicate that SPLK performs best compared with the other two methods, with POD improving 20% compared to PPLK, and 5% compared to TREC for the whole forecast time. The improvement was obvious for the first hour, based on the POD and the average of POD reaching 0.761, compared to 0.57 of SPLK and 0.719 of TREC. However, beyond 60 min, the performance of SPLK and PPLK are worse when compared with the TREC, and the average POD of SPLK and PPLK are 0.411 and 0.399, respectively, slightly lower than the average POD of TREC (0.416). This is because SPLK and PPLK use the spatial interpolation process, and led to a lot of “holes” regarded as no rain, and led to the rate of “hits” decreasing while the “false alarms” increased.
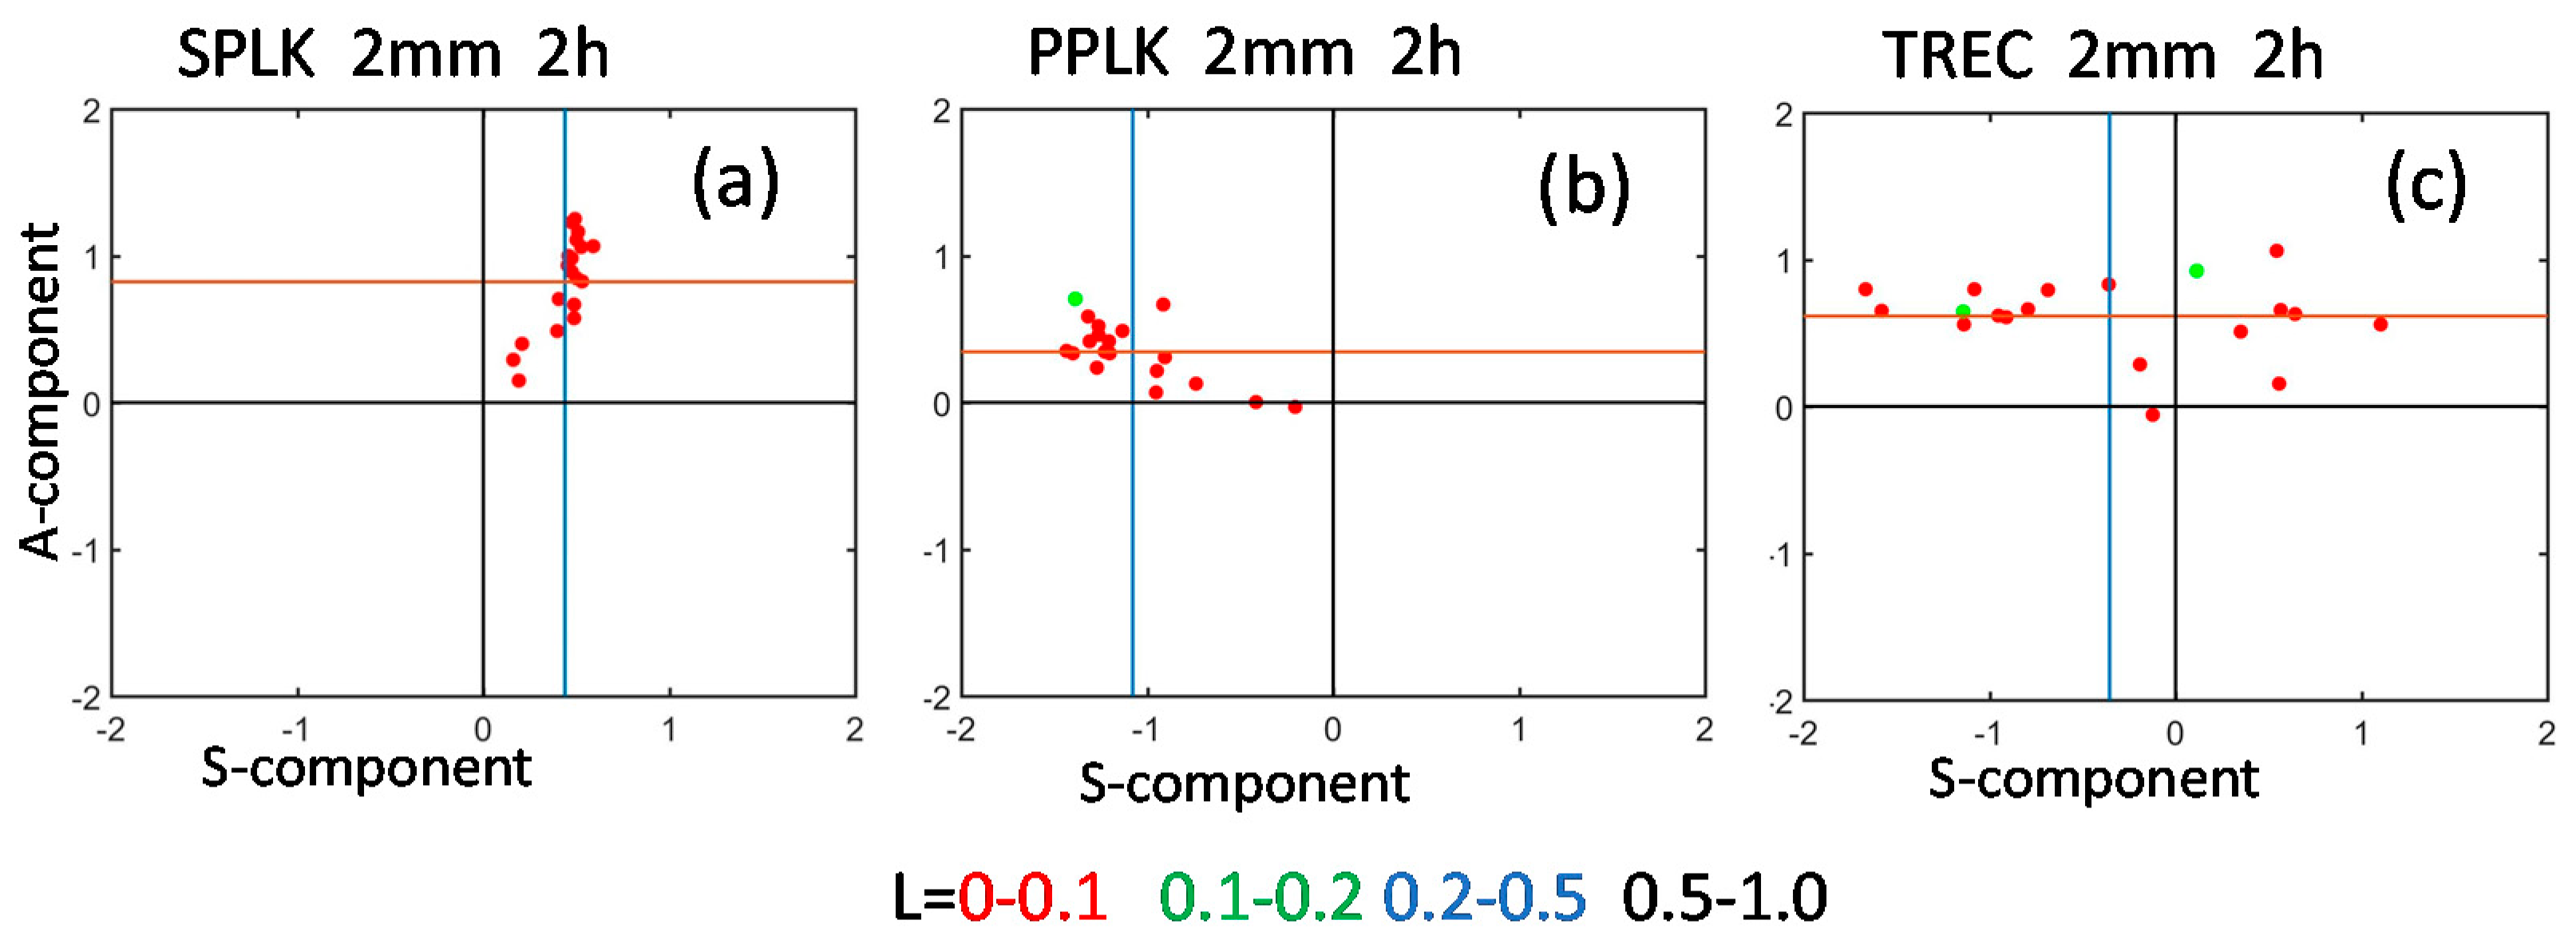
Figure 13 shows the variation results with SAL for the threshold of 2 mm/h with 2 h lead time using the three nowcasting models SPLK, PPLK, and TREC, respectively. It can be seen that the three models captured the precipitation location (L) quite accurately in the whole forecast time, and the parameters of L are low in all cases. The SPLK performs best in decreasing the displacement errors. According to the parameter A (>0), three models all slightly overestimated the precipitation, which is due to these models using the linear extrapolation schema in the initial process. In terms of S, the results of three models are varied. The SPLK is best with the mean structure (S) <0.4, suggesting that SPLK is better capable of capturing information about size and shape of precipitation than other models. The S of PPLK is negative, with mean value around −1, indicating that PPLK is not good at the prediction of precipitation structure, and slightly underestimates the precipitation band. TREC shows both negative and positive S values with median values of S close to −0.4. This indicates the TREC is not stable in capturing the precipitation. Above all, the SPLK forecast shows the best results in the three nowcasting models in terms of SAL, with the capability of capturing the precipitation location and structure.
The above analysis reveals that the proposed algorithm SPLK is able to better handle and track the precipitation events’ efficiency. It can be concluded that SPLK is a reliable precipitation forecast tool, especially for fast-moving and large-scale events.

5. Summary and Conclusions

Short-term high-resolution quantitative precipitation forecasting (SQPF) at high spatial and temporal resolutions is critical to the flash-flood warning, navigation safety, and other hydrological applications. In this study, a high-resolution SQPF algorithm called SPLK has been developed by using the subpixel method and extrapolation technology. The SPLK model uses the subpixel-based pyramid optical flow technology to track the convection cell and extrapolate the rainy by liner schema with subpixel accuracy. Different types of storm events between 2015 and 2016 in CONUS are selected in this study to evaluate the performance of this model. Both the pixel-to-pixel-based and objective-based verification methods are used for verification of SPLK. The performance of SPLK was compared with two other extrapolation-based methods (TREC and PPLK). The results illustrated, so far, indicate the maximum achievable performance of SPLK for the given case study.
The main finding of this study showed that the proposed SPLK algorithm is suitable for the short-term high-resolution forecast, and can produce a reliable nowcasting product. Main conclusions are drawn as follows:
(1)
The SPLK can improve the accuracy of precipitation forecasting within the 2 h lead time. The experiment results (Figure 7 and Figure 8, Table 2) indicate that SPLK has the capability of improving the predictability of storm positions and intensities with high CORR, and low RMSE and SAL components. The SPLK shows good performances in complicated storms, especially in the small-scale and fast-moving storms.
(2)
The SPLK achieved better performance than both TREC and PPLK. Compared with the TREC, SPLK improves the predictability about 15–20% with the measured CORR and RMSE (Figure 10 and Figure 11), especially in the small-scale severe storms. Compared with PPLK, SPLK shows better accuracy in both heavy rain events (>20 mm/h) and light rain events (<10 mm/h) with the better POD, FAR, and CSI during the 2 h lead time (Figure 12).
(3)
The SAL verification results indicate that SPLK is superior to PPLK in capturing the precipitation location (L) and structure (S) with the component values close to zero, and more stable to the TREC in capturing the precipitation band.
The proposed algorithm SPLK shows good performance in nowcasting selected storm events with varied characteristics. However, the results also showed that the model contains some challenges. The main weakness of the model was overestimation of heavy rain. Moreover, this study only focuses on the algorithm SPLK itself, and this algorithm needs more testing in more complex forecasting scenarios in different regions, time periods, and weather regimes, with the aim to keep the algorithm more robust. More work will be put on the deployment of the SPLK in a real-time nowcasting system for operational tests, and provide the public with better weather service in the near future.

Author Contributions

S.C., Z.H. and L.L. conceived and designed the experiments; X.M. performed the experiments; A.Z. prepared the data and proofread the paper, B.H. analyzed the data; Z.L. and X.T. helped analysis the results; L.L. and S.C. wrote the paper.

Funding

This work was supported by the National Natural Science Foundation of China under Grants 41661021\2016YFC0502400\61562008, the State Key Laboratory of Geohazard Prevention and Geoenvironment Protection Independent Research Project (SKLGP2017Z005), “100 Top Talents Program” (74110-52601108) at Sun Yat-Sen University, “100 Top Talents Program” of Guangxi Zhuang Autonomous Region, and by the State Key Laboratory of Hydraulics and Mountain River Engineering under Open Fund SKHL1310.

Acknowledgments

The authors thank the anonymous reviewers for their constructive and helpful comments. Thanks are also given to Zhenqing Liang from Key Laboratory of Environment Change and Resources Use in Beibu Gulf (Guangxi Teachers Education University) for his help in processing DEM data.

Conflicts of Interest

The authors declare no conflict of interest.

References

  1. Sun, J.; Xue, M.; Wilson, J.; Ballard, P.S.; Onvlee, J.; Joe, P.; Barker, M.; Li, P.-W.; Golding, B.; Xu, M.; et al. Use of NWP for nowcasting convective precipitation: Recent progress and challenges. Bull. Am. Meteorol. Soc. 2014, 95, 409–426. [Google Scholar] [CrossRef]
  2. Zahraei, A.; Hsu, K.-l.; Sorooshian, S.; Gourley, J.J.; Lakshmanan, V.; Hong, Y.; Bellerby, T. Quantitative precipitation nowcasting: A lagrangian pixel-based approach. Atmos. Res. 2012, 118, 418–434. [Google Scholar] [CrossRef]
  3. Golding, B. Nimrod: A system for generating automated very short range forecasts. Meteorol. Appl. 1998, 5, 1–16. [Google Scholar] [CrossRef]
  4. Ganguly, A.R.; Bras, R. Distributed quantitative precipitation forecasting using information from radar and numerical weather prediction models. J. Hydrometeorol. 2002, 4, 1168–1180. [Google Scholar] [CrossRef]
  5. Wiener, M.D.G. Titan: Thunderstorm identification, tracking, analysis, and nowcasting—A radar-based methodology. J. Atmos. Ocean. Technol. 1993, 10, 785–797. [Google Scholar] [CrossRef]
  6. Zahraei, A.; Hsu, K.-l.; Sorooshian, S.; Gourley, J.J.; Hong, Y.; Behrangi, A. Short-term quantitative precipitation forecasting using an object-based approach. J. Hydrol. 2013, 483, 1–15. [Google Scholar] [CrossRef]
  7. Liu, Y.; Xi, D.-G.; Li, Z.-L.; Hong, Y. A new methodology for pixel-quantitative precipitation nowcasting using a pyramid lucas kanade optical flow approach. J. Hydrol. 2015, 529, 354–364. [Google Scholar] [CrossRef]
  8. Sokol, Z.; Pesice, P. Nowcasting of precipitation—Advective statistical forecast model (sam) for the czech republic. Atmos. Res. 2012, 103, 70–79. [Google Scholar] [CrossRef]
  9. Johnson, J.L.; MacKeen, P.; Witt, A.; De Wayne Mitchell, E.; Stumpf, G.; Eilts, M.; Thomas, K.W. The storm cell identification and tracking algorithm: An enhanced WSR-88d algorithm. Weather Forecast. 1998, 13, 263–276. [Google Scholar] [CrossRef]
  10. Yeung, L.H.; Wong, W.K.; Chan, P.K.; Lai, E.S. Applications of the Hong Kong Observatory nowcasting system SWIRLS-2 in support of the 2008 Beijing Olympic Games. BMJ 2009, 2, 1977. [Google Scholar] [CrossRef]
  11. Mueller, C.; Saxen, T.; Roberts, R.; Wilson, J.; Betancourt, T.; Dettling, S.; Oien, N.; Yee, J. Ncar auto-nowcast system. Weather Forecast. 2003, 18, 545–561. [Google Scholar] [CrossRef]
  12. Haiden, T.; Kann, C.; Wittmann, A.; Pistotnik, G.; Bica, B.; Gruber, C. The Integrated Nowcasting through Comprehensive Analysis (INCA) System and Its Validation over the Eastern Alpine Region. Weather Forecast. 2011, 26, 166–183. [Google Scholar] [CrossRef]
  13. Wang, G.; Hong, Y.; Liu, L.; Wong, W.K.; Zahraei, A.; Lakshmanan, V. Inter-comparison of radar-based nowcasting schemes in the jianghuai river basin, china. Meteorol. Appl. 2015, 22, 289–300. [Google Scholar] [CrossRef]
  14. Grecu, M.; Krajewski, W.F. A large-sample investigation of statistical procedures for radar-based short-term quantitative precipitation forecasting. J. Hydrol. 2000, 239, 69–84. [Google Scholar] [CrossRef]
  15. Woo, W.-C.; Wong, W.-K. Operational application of optical flow techniques to radar-based rainfall nowcasting. Atmosphere 2017, 8, 48. [Google Scholar] [CrossRef]
  16. Novo, S.; Martínez, D.; Puentes, O. Tracking, analysis, and nowcasting of cuban convective cells as seen by radar. Meteorol. Appl. 2014, 21, 585–595. [Google Scholar] [CrossRef]
  17. Germann, U.; Zawadzki, I. Scale-dependence of the predictability of precipitation from continental radar images. Part I: Description of the methodology. Mon. Weather Rev. 2002, 130, 2859. [Google Scholar] [CrossRef]
  18. Diamond, D.H.; Heyns, P.S.; Oberholster, A.J. Accuracy evaluation of sub-pixel structural vibration measurements through optical flow analysis of a video sequence. Measurement 2017, 95, 166–172. [Google Scholar] [CrossRef]
  19. Wang, P.; Li, J.; Li, J.; Li, Z.; Schmit, T.J.; Bai, W. Advanced infrared sounder subpixel cloud detection with imagers and its impact on radiance assimilation in nwp. Geophys. Res. Lett. 2014, 41, 1773–1780. [Google Scholar] [CrossRef]
  20. Javh, J.; Slavič, J.; Boltežar, M. The subpixel resolution of optical-flow-based modal analysis. Mech. Syst. Signal Process. 2017, 88, 89–99. [Google Scholar] [CrossRef]
  21. Horn, B.K.P.; Schunck, B.G. Determining optical flow. Artif. Intell. 1981, 17, 185–203. [Google Scholar] [CrossRef] [Green Version]
  22. Lucas, B.D.; Kanade, T. An iterative technique of image registration and its application to stereo. In Proceedings of the 7th International Joint Conference on Artificial intelligence, Vancouver, BC, Canada, 24–28 August 1981; Volume 73, pp. 674–679. [Google Scholar]
  23. Bowler, N.E.H.; Pierce, C.E.; Seed, A. Development of a precipitation nowcasting algorithm based upon optical flow techniques. J. Hydrol. 2004, 288, 74–91. [Google Scholar] [CrossRef]
  24. Wolfson, M.; Forman, B.; Hallowell, R.; Moore, M. The growth and decay storm tracker. In Proceedings of the 8th Conference on Aviation, Range, and Aerospace Meteorology, Dallas, TX, USA, 10–15 January 1999. [Google Scholar]
  25. Lakshmanan, V.; Smith, T. Data mining storm attributes from spatial grids. J. Atmos. Ocean. Technol. 2009, 26, 2353–2365. [Google Scholar] [CrossRef]
  26. Bellon, A.; Lovejoy, S.; Austin, G. Combining satellite and radar data for the short-range forecasting of precipitation. Mon. Weather Rev. 2003, 108, 1554–1566. [Google Scholar] [CrossRef]
  27. Tuttle, J.D.; Foote, B. Determination of the boundary layer airflow from a single doppler radar. J. Atmos. Ocean. Technol. 1990, 7, 218–232. [Google Scholar] [CrossRef]
  28. Laroche, S.; Zawadzki, I. A variational analysis method for retrieval of three-dimensional wind field from single-doppler radar data. J. Atmos. Sci. 1994, 51, 2664–2682. [Google Scholar] [CrossRef]
  29. Bouguet, J.Y. Pyramidal implementation of the Lucas Kanade feature tracker description of the algorithm. OpenCV Doc. 1999, 22, 363–381. [Google Scholar]
  30. Barron, J.L.; Fleet, D.J.; Beauchemin, S.S. Performance of optical flow techniques. Int. J. Comput. Vis. 1994, 12, 43–77. [Google Scholar] [CrossRef] [Green Version]
  31. Bouguet, J.-Y. Pyramidal implementation of the affine lucas kanade feature tracker description of the algorithm. OpenCV Doc. 2001, 22, 363–381. [Google Scholar]
  32. Lyu, Y.; Yang, Y.; Ru, J. Gesture motion detection algorithm based on optical flow method. In Proceedings of the 2015 IEEE International Conference on Computer and Communications (ICCC), Chengdu, China, 10–11 October 2015; pp. 128–132. [Google Scholar]
  33. Ulbrich, U.; Fink, A.; Klawa, M.; Pinto, J. Three extreme storms over europe in december 1999. Weather 2012, 56, 70–80. [Google Scholar] [CrossRef]
  34. Behrangi, A.; Khakbaz, B.; Jaw, T.C.; AghaKouchak, A.; Hsu, K.; Sorooshian, S. Hydrologic evaluation of satellite precipitation products over a mid-size basin. J. Hydrol. 2011, 397, 225–237. [Google Scholar] [CrossRef]
  35. Ebert, E.E.; Wilson, L.J.; Brown, B.G.; Nurmi, P.; Brooks, H.E.; Bally, J.; Jaeneke, M. Verification of nowcasts from the wwrp sydney 2000 forecast demonstration project. Weather Forecast. 2004, 19, 73–96. [Google Scholar] [CrossRef]
  36. Wernli, H.; Paulat, M.; Hagen, M.; Frei, C. SAL—A novel quality measure for the verification of Quantitative Precipitation Forecasts. Mon. Weather Rev. 2008, 136, 4470–4487. [Google Scholar] [CrossRef]
  37. Zhang, J.; Howard, K.; Langston, C.; Kaney, B.; Qi, Y.; Tang, L.; Grams, H.; Wang, Y.; Cocks, S.; Martinaitis, S.; et al. Multi-radar multi-sensor (MRMS) quantitative precipitation estimation: Initial operating capabilities. Bull. Am. Meteorol. Soc. 2016, 97, 621–638. [Google Scholar] [CrossRef]
  38. Wilson, J.; Roberts, R. Summary of convective storm initiation and evolution during IHOP: Observational and modeling perspective. Mon. Weather Rev. 2006, 134, 23–47. [Google Scholar] [CrossRef]
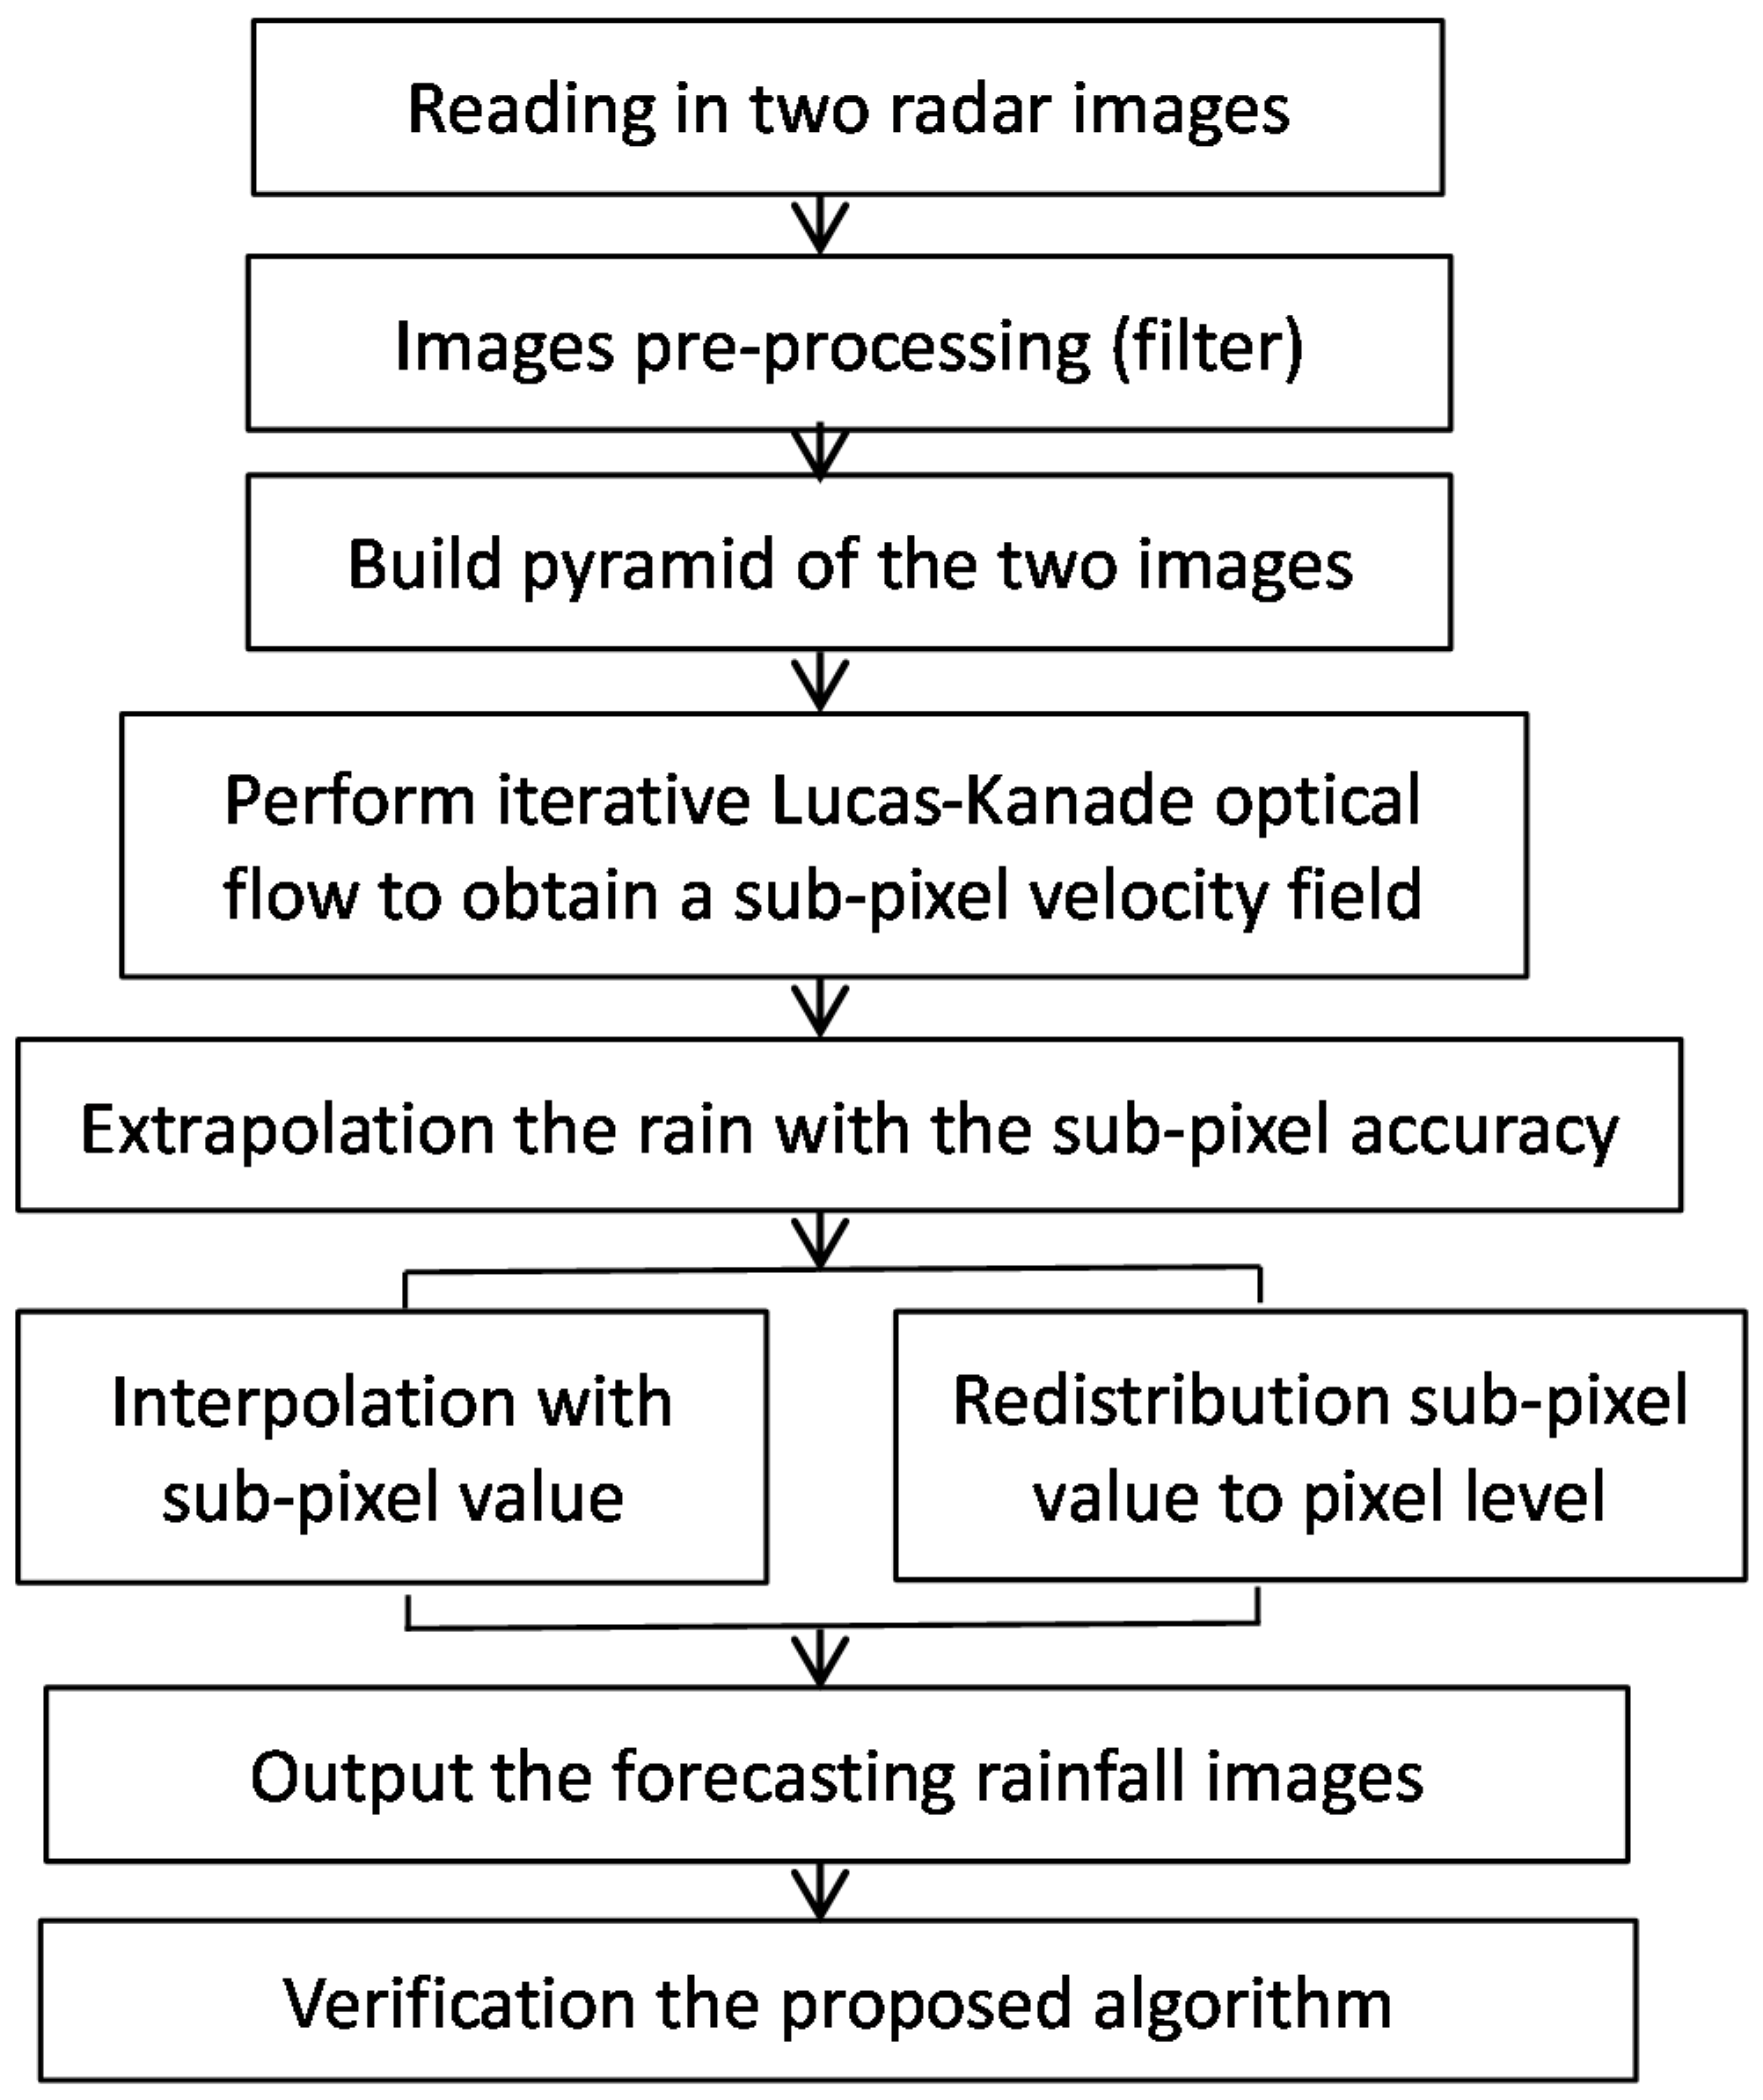
Figure 1. Flow chart of the SPLK algorithm.
Atmosphere 09 00260 g001
Figure 2. The constructs of Gaussian pyramid in which an image in high-resolution (L = 0) is sampled into low-resolution images (L = 1, 2, 3). The pyramid images built in a recursive pattern using the function (7) as computing I 1 from I 0 , then computing I 2 from I 1 , and so on. I 0 is the original image with the highest resolution.
Atmosphere 09 00260 g002
Figure 3. The schematic of extrapolation for three time level advection based on the liner method. The black solid curve trajectory denotes that from point O at time t Δ t to point P, and reaches Q at time t + Δ t . The point P is an integer pixel, but the point O and Q often are not integer pixels.
Atmosphere 09 00260 g003
Figure 4. The redistribution process of the SPLK algorithm. The blue dot and red dot denotes an integer pixel in forecast image, and the green diamond is the extrapolation points. (a) There is only an extrapolation point around the red point; (b) There are two extrapolation points around the red point; (c) There are three extrapolation points around the red point.
Atmosphere 09 00260 g004
Figure 5. Study areas in the CONUS, (a) the boundary of the United States and the location of the study areas, (b) the DEM (Digital Elevation Model) of Ohio, (c) the DEM of Oklahoma.
Atmosphere 09 00260 g005
Figure 6. Four selected severe storms: (a) Storm 1: 0300 UTC 18 October 2015, (b) Storm 2: 1150 UTC 3 July 2016, (c) Storm 3: 1450 UTC 15 August 2015, (d) Storm 4: 0000 UTC 1 August 2015.
Atmosphere 09 00260 g006
Figure 7. CORR and RMSE of SPLK in four selected storms. (a) The CORR versus lead time, in which the larger values represent a better prediction; (b) The RMSE versus lead time, in which the smaller values represent a better prediction.
Atmosphere 09 00260 g007
Figure 8. Contingency statistics of SPLK for (a) probability of detection (POD); (b) false-alarm ratio (FAR); and (c) critical success index (CSI). These indexes measure the agreement between observed and nowcasting rainfall estimates.
Atmosphere 09 00260 g008
Figure 9. The forecast images obtained by three nowcasting methods with lead time of 12 min and 30 min. (a,b) are the radar images at the lead time 12 min and 30 min; (c,d) are the forecast images using the SPLK methods at the lead time of 12 min and 30 min, respectively; (eh) are the same as (c,d) but using the TREC and PPLK methods, respectively.
Atmosphere 09 00260 g009aAtmosphere 09 00260 g009b
Figure 10. Performance of SPLK, PPLK, TREC in terms of correlation coefficient (CORR) versus lead time (min) for the four selected precipitation storms : (a) storm1; (b) storm2; (c) storm3; (d) storm4.
Atmosphere 09 00260 g010
Figure 11. RMSE versus lead time [min] for the four selected precipitation events: (a) storm1; (b) storm2; (c) storm3; (d) storm4, using SPLK, PPLK, and TREC.
Atmosphere 09 00260 g011
Figure 12. The average statistical scores for eight events. (a) POD; (b) FAR; (c) bias versus lead time using SPLK and PPLK, with the thresholds 1, 10, and 20 [mm/h].
Atmosphere 09 00260 g012
Figure 13. The verification results of the forecast with SAL method for the threshold of 2 mm/h and 2 h lead time. The horizontal and vertical axes of subfigures are S and A parameters, respectively. Single forecast is represented by marks. Colors show the magnitude of the L parameter (red: L ≤ 0.1, green: 0.1 ≤ L ≤ 0.2, blue: 0.2 ≤ L ≤ 0.5, black: L > 0.5). The median values for the S and A components are shown as colored lines.
Atmosphere 09 00260 g013
Table 1. Summary of precipitation event data collected in the experiment used for nowcasting evaluation.
Storm EventStart-Time (yyyymmdd-hhmm)Spatial CoverageMean VelocityDescription
T120151018-0300 94 °   W 100 °   W ,   32 °   N 37 °   N 30 km/hFrontal rain
T220160603-1150 80 °   W 86 °   W ,   38 °   N 43 °   N 40 km/hConvective rain
T320150815-1450 94 °   W 100 °   W ,   32 °   N 37 °   N 60 km/hOrganized thunderstorm
T420150801-0000 94 °   W 100 °   W ,   32 °   N 37 °   N 10 km/hcyclonic
T520150920-2030 94 °   W 100 °   W ,   32 °   N 37 °   N 50 km/hFrontal rain
T620150801-1200 94 °   W 100 °   W ,   32 °   N 37 °   N 20 km/hConvective rain
T720160816-1240 94 °   W 100 °   W ,   32 °   N 37 °   N 36 km/hConvective rain
T820160619-0840 94 °   W 100 °   W ,   32 °   N 37 °   N 40 km/hLocalized thunderstorms
Table 2. The SAL values for the four selected storms with the threshold of 2 mm/h. The lead time including 30 min, 60 min, 90 min, and 120 min. The last four rows are the average values.
Lead TimeCaseSAL
30 minstorm10.26600.50220.0604
storm20.39960.48640.0235
storm30.34980.50750.0104
storm40.49080.93720.0839
60 minstorm11.10440.99940.1276
storm21.73400.95270.0760
storm30.50130.84880.0532
storm41.22691.11930.1347
90 minstorm11.53391.39320.1587
storm21.65501.06250.1382
storm30.52771.06150.0635
storm41.57841.43120.1480
120 minstorm11.48401.63120.1506
storm21.79111.26280.2407
storm30.49451.25030.0552
storm41.55611.65780.1779
averagestorm11.09711.13150.1243
storm21.38250.94640.1163
storm30.48080.91180.0489
storm41.21311.28640.1361
Table 3. The average scores of SPLK, PPLK, and TREC in terms of POD, FAR, and CSI in different lead time intervals for eight events for the threshold 1 mm/h.
Lead TimeSPLKPPLKTREC
PODFARCSIPODFARCSIPODFARCSI
12 min0.8480.1820.7130.7350.2270.6040.6920.2530.561
30 min0.7460.4470.6300.5330.3630.4090.7230.4350.464
60 min0.6890.5370.5270.4340.4660.3150.7430.5870.361
90 min0.4520.7930.3560.4270.5800.2690.5040.7500.201
120 min0.3700.9040.0600.3720.7280.1920.3290.8260.158
average0.6210.5730.4570.5000.4730.3580.5980.5700.349