Article

Estimation of the Personal Deposited Dose of Particulate Matter and Particle-Bound Metals Using Data from Selected European Cities

by
Eleftheria Chalvatzaki
1,
Sofia Eirini Chatoutsidou
1,
Eleni Mammi-Galani
1,
Susana Marta Almeida
2,
Maria I. Gini
3,
Konstantinos Eleftheriadis
3,
Evangelia Diapouli
3 and
Mihalis Lazaridis
1,*
1
School of Environmental Engineering, Technical University of Crete, Chania 73100, Greece
2
Centro de Ciências e Tecnologias Nucleares, Instituto Superior Técnico, Universidade de Lisboa, Estrada Nacional 10, Km 139.7, 2695-066 Bobadela LRS, Portugal
3
Institute of Nuclear & Radiological Sciences & Technology, Energy & Safety, Environmental Radioactivity Lab, N.C.S.R. “Demokritos”, Agia Paraskevi, Athens 15310, Greece
*
Author to whom correspondence should be addressed.
Atmosphere 2018, 9(7), 248; https://doi.org/10.3390/atmos9070248
Submission received: 12 June 2018 / Revised: 29 June 2018 / Accepted: 29 June 2018 / Published: 3 July 2018
(This article belongs to the Section Aerosols)

Abstract

:
The present study focused on the estimation of the personal dose of airborne particles using an exposure dose model (ExDoM2). Input data from three European cities (Athens, Kuopio, Lisbon) were selected to implement the model that calculates the deposited dose and retention of particles in the respiratory tract, the mass transferred to the oesophagus and the absorption to blood as well as the dose for five particle-bound metals. Model results showed that after one day exposure higher deposited dose in the respiratory tract was obtained for Lisbon as a direct consequence of the higher PM concentration measured in this city. Moreover, the activity profile and the physical characteristics of the exposed subject had strong impact on the estimated deposited dose. Thus, light activity corresponded to higher deposited dose compared to no activity as well as an adult male exhibited higher dose, both findings associated with increased inhalation rate. Regarding the internal dose for particle-bound metals higher dose for four out of the five metals was obtained in lungs followed by the muscles for As, the gastrointestinal tract for Cr, the other tissues for Mn, the intestines for Cd and finally for Pb higher dose was found in bones and blood.

1. Introduction

Air pollution associated with airborne particles (especially fine particles) and particle-bound heavy metals has gained great interest in the scientific community [1,2,3,4,5]. Particulate matter (PM) is recognized by the specialist in aerosol sciences as a major pollutant that has harmful effects on human health [6]. Studies [4,7,8,9,10,11,12,13] that focused on PM exposure and the consequent effects on human health associated high concentrations of airborne PM with increased mortality and morbidity. Pope and Dockery [13] claimed that an increase of 10 μg/m3 in PM2.5 concentration is associated with 1% increase in mortality. In addition, there is evidence that exposure to PM causes adverse health outcomes on human health [14,15] associated predominantly with cardiovascular and respiratory diseases [4,10,16,17]. Moreover, several studies [10,16,18,19,20] concluded that exposure to PM2.5 is associated with increased hospital admission due to respiratory and cardiovascular diseases. As a result of these findings, the European Union (EU) has established air quality standards for PM concentrations (Directives 1999/30/EC and 2008/50/EC). Accordingly, the EU air quality standard sets an annual limit for PM2.5 equal to 25 μg/m3 while for PM10 the annual limit is 40 μg/m3 and the 24-h limit is 50 μg/m3. Additionally, the International Agency for Research on cancer (IARC) [21,22] has classified PM originating from outdoors as carcinogenic to humans (Group 1) with elevated PM exposure leading to an increasing risk for lung cancer.
Other studies [1,23,24,25] claim that PM enriched in heavy metals is associated with human health effects. In particular, the metal content of PM contributes to the toxicity of PM [26,27] and increases the possibility of lung or cardiopulmonary injuries [24,28]. Inhalation of particles enriched in lead (Pb) could lead to renal damage, neurological dysfunction and anaemia [29,30] while arsenic (As) and cadmium (Cd) particles are susceptible for inducing carcinogenic effects in humans and animals [26,31,32,33]. Moreover, inhalation of manganese (Mn) particles can induce severe neurotoxical impairments [27,34]. Due to the toxicity of particles enriched with heavy metals, EU has established air quality standards for As, Cd and Pb in the PM10 fraction with the annual limit values for the protection of human health being at 6 ng/m3, 5 ng/m3 and 500 ng/m3 for As, Cd and Pb respectively (Directives 2004/107/EC and 2008/50/EC).
Particle size is a key factor regarding the deposition in the respiratory tract such that coarse particles due to their large size deposit mainly in the extrathoracic region (ET) while fine particles penetrate easier in the Alveolar (AI) region [35,36,37,38]. Particles deposited in the ET region are swallowed and transferred to the gastrointestinal tract (GI-tract), while, particles deposited in the AI region remain in the lungs. Therefore, the most important properties of particles in order to determine their potential impacts on human health are their size and chemical composition [39,40,41,42,43,44].
Particle size distribution and hence regional deposition in the human respiratory tract is essential to assess the possible consequences and the magnitude of hazard associated with the inhalation of PM [45]. For these reasons, respiratory tract deposition of PM has attracted considerable interest in the scientific community. Many dosimetry models [46,47,48,49,50,51,52] have been developed aiming to estimate the regional deposited dose of PM in the human respiratory tract. The most widely available dosimetry models are the Human Respiratory Tract Model (HRTM) of the International Commission on Radiological Protection (ICRP) model [48,49] and the multiple path particle dosimetry model (MPPD) of the Chemical Industry Institute of Toxicology (CIIT) and the Dutch National Institute of Public Health and Environment (RIVM).
Herein, the personal deposited dose of particles in the human respiratory tract was determined using an exposure dose model (ExDoM2 [47]). The data from three European cities were implemented in order to estimate the deposited and retained dose of PM as well as the internal dose of specific metals (As, Cd, Cr, Mn and Pb) using Physiologically-Based PharmacoKinetic (PBPK) modules. The aim of this study was to evaluate the deposited and internal dose of PM and metals at different regions of the human respiratory tract.

2. Materials and Methods

2.1. Overview

In this work the internal dose of airborne particles and particle-bound metals were estimated using data sampled in three European cities (Athens, Kuopio and Lisbon). For Kuopio and Lisbon published data were implemented whereas for Athens the data incorporated are unpublished.
Intrinsically the present model incorporated data from different periods for each study location thus PM exposure in terms of comparison between the cities is meaningless however our study aims to provide estimates for the deposited dose in the human respiratory tract using as input PM concentrations measured at several residential areas within the European region. Subsequently, detailed description of the study locations and model specifications follows.

2.2. Sampling Sites and Experimental Data

Athens is the capital of Greece a densely populated city with the metropolitan area covering approximately 3.7 million inhabitants. The measurement campaign was conducted at the suburban Global Atmosphere Watch (GAW) and Aerosols Clouds and Trace Gases Research Infrastructure (ACTRIS) measurement station “Demokritos” (DEM), which is located at the grounds of the National Centre for Scientific Research “Demokritos” in Athens, Greece (37.995° N, 23.816° E, at 270 m a.s.l.). The station is situated at the foot of Hymettus mountain (~7.0 km North from the centre of Athens) and can be considered as representative of the atmospheric aerosol in the suburbs. The measurement campaign was conducted during the period from November 2014 to May 2015. The mass size distributions were measured using low pressure Berner cascade impactor. Aerosol particles were collected on Tedlar foils, at 24 h sampling intervals. The collection substrates were greased with apiezon-L dissolved in toluene in order for the particle bounce off to be avoided and the metal content of airborne particles was determined by means of X-ray fluorescence system, Epsilon 5 by PANalytical [53].
The city of Kuopio is located in the south mainland of Finland having approximately 95,000 inhabitants. Field measurements were conducted by Sippula et al. [54] in a suburban area of Kuopio with PM measurements performed in the backyard area of a house. Major sources of the sampling location included biomass burning for heating purposes and limited traffic [54]. Sippula et al. [54] used a Harvard high-volume cascade impactor (HVCI) for collection of particles into different size categories. In addition, the metal content of airborne particles was determined by inductively coupled plasma–mass spectrometer (ICP-MS). The measurements were performed during 2010 with 2–3 weeks sampling in each season and average values of PM and metal concentrations were implemented in the present model.
Lisbon is the capital of Portugal with the metropolitan area of the city having approximately 3 million residents. The particle size distribution was measured in a suburban area by Almeida et al. [55,56] using a Berner Impactor (Hauke LPI 30/0.06/2) while the chemical analysis (metal content) of PM was performed by Instrumental Neutron Activation Analysis (INAA). PM collection conducted during 2001 for 3 days in each season therefore average values were used.

2.3. Exposure Dose Model 2 (ExDoM2)

The ExDoM2 is a model that calculates the dose and retention of particulate matter mass in the human respiratory tract as well as the mass transferred to the oesophagus and the absorption to blood. The ExDoM2 [47] is a revised version of ExDoM [46] whereby new material/data from ICRP [49] and a Physiologically-Based PharmacoKinetic (PBPK) modules for specific metals were incorporated.
ExDoM2 estimates the deposited dose in five regions of the respiratory tract. The regional deposited dose is classified in the present work into the extrathoracic (ET) and lung regions. The extrathoracic region includes the anterior nose (ET1) and the posterior nasal passages (ET2) whilst lung region includes the bronchial (BB), bronchiolar (bb) and alveolar-interstitial (AI) regions. Dose in the human body (e.g., liver, brain) was estimated for the following five particle-bound metals: As, Cd, Cr, Mn and Pb.
The deposition efficiency in region j of the human respiratory tract was obtained using the equation [48]:
n j = ( n a e 2 + n t h 2 ) 1 / 2
where n a e is the aerodynamic deposition efficiency and n t h is the thermodynamic deposition efficiency. The deposition efficiencies ( n a e and n t h ) are expressed as [48]:
n a e   or   n t h = 1 e x p ( a R p )
where a and p are dimensionless constants whilst R has a characteristic functional form that is different in each region and depends on particle size (aerodynamic diameter for n a e whilst thermodynamic diameter for n t h ) and the relevant respiration parameters.
Overall, the respiratory tract clearance model of ICRP [49] consists of 13 compartments: ET1 region, ET2 region (two compartments), BB region (two compartments), bb region (two compartments), AI region (alveolar and interstitial), Lymph nodes (extrathoracic region), Lymph nodes (thoracic region), oesophagus and blood. ICRP [49] considers two compartments for the regions ET2, BB and bb due to the calculation of the retained mass in the airway walls ( E T s e q , B B s e q , and b b s e q ). Accordingly, the retained dose of particles in each compartment j and the mass transferred to the oesophagus, Lymph nodes and blood was estimated by Equation (3) for rapidly dissolving particles whereas Equation (4) was used for particles dissolving slowly [46,47]:
d I j ( t ) d t = k = 1 13 [ m k , j × I k ( t ) ( m j , k + s r ) × I j ( t ) ] + f r × H j ( t )
d T j ( t ) d t = k = 1 13 [ m k , j × T k ( t ) ( m j , k + s s ) × T j ( t ) ] + ( 1 f r ) × H j ( t )
where m k , j is the mechanical movement rate of particles from compartment k to j , m j , k is the mechanical movement rate of particles from compartment j to k , f r is the fraction of particles dissolved rapidly, s r is the rapid dissolution rate, s s is the slow dissolution rate, H j is the deposited dose in the compartment j , I j and I k are the retained doses of particles dissolving relatively rapidly in the compartment j and k respectively and T j and T k are the retained doses of particles dissolving slowly in the compartment j and k respectively.
Absorption of particle-bound metals in blood has different rates. Particularly, absorption for particle-bound Cd and Cr (for oxide and hydroxide compounds) is slow, for As (all compounds) and Mn (oxide, hydroxide, halide and nitrate compounds) is moderate and for Pb (all compounds) is fast [57]. For moderate and slow absorption, the model adopted the default values of ICRP [49]. Thus, f r , s r and s s for moderate absorption were set equal to 0.2 d−1, 3 d−1 and 0.005 d−1 respectively, whereas, for slow absorption the values were set equal to 0.01 d−1, 3 d−1 and 0.0001 d−1 respectively. On the contrary, for fast absorption ICRP [49] suggests that s r is element specific with ICRP [58] proposed a value of 100 d−1 for Pb as well as additional parameters for the bound state (the material in the bound state is not cleared by particle transport but only by uptake into body fluids [48]). Therefore, s r for Pb was set equal to 100 d−1 whilst ExDoM2 did not take into account the bound state of materials. Furthermore, the oxidation state of arsenic and chromium was assumed as that of As(III) and Cr(III).
The dose of As, Pb and Mn in each organ or tissue group i of the human body was estimated by [46,59,60]:
d A i , m d t = Q i × ( C a , m C v , m ) M e t a b o l i s m i , m E l i m i n a t i o n i , m
where A i , m is the dose of chemical m in tissue group i (μg), Qi is the blood flow rate to tissue group i (L/h), C a , m is the arterial concentration (μg/L) of chemical m and C v , m is the venous concentration of chemical m (μg/L).
The metabolism parameter ( M e t a b o l i s m i , m ) is zero for Pb and Mn while inorganic As is metabolized to monomethylarsonic (MMA) and dimethylarsinic (DMA). In particular, the methylation of inorganic arsenite (As(III)) in MMA and DMA appears mainly in the liver and kidney according to Michaelis–Menten kinetics [59]. In addition, oxidation/reduction reactions that take place in the human body (e.g., kidney, liver) interconvert the arsenate (AS(V)) and arsenite (As(III)) and are modelled as a first-order oxidation/reduction reaction [59,60,61,62].
The blood flow in L/h is given by:
  Q i ( L / h ) = b l o o d   f l o w i ( % ) × C O   ( L / h )
where C O represents the cardiac output and is the amount of blood pumped per unit of time [63] with b l o o d   f l o w i in each tissue group i estimated as the % percentage of C O . The values for both variables during sleep/rest and light activity are listed in Table 1. Accordingly, sleep/rest values were based on ICRP [64] whereas during light activity the values of ICRP were modified. More specifically, C O was modified according to Plowman and Smith [63] where the authors suggested an increase of 62% (348 to 564 L/h) during light activity. Herein, the same % increase was adopted therefore C O during light activity was set equal to 632 L/h. For b l o o d f l o w i the values of skin, kidney, liver, muscles and heart were modified according to Lenz [65]. For example, b l o o d f l o w i for muscles was set equal to 40% due to an increase of 135% proposed in [65] (20% to 47%). Regarding the Gastrointestinal (GI) tract the same decrease with liver was used due to the connection of organs with the portal vein whilst b l o o d f l o w i for fat was increased by the same percentage with skin. For bones b l o o d f l o w i was decreased by the same percentage with other tissues proposed in Lenz [65]. Lastly, for the bronchial tissues the b l o o d f l o w i of ICRP [64] was used. On the other hand, Plowman and Smith [63] pointed out that the b l o o d f l o w i to the brain decreases while the absolute amount of brain blood flow remains constant. Therefore, Q i for the brain was set equal to 46.8 L/h [64] which corresponds to a 7.4% for b l o o d f l o w i .
Lastly, the dose of Cr in each organ or tissue group i was calculated by [66]:
d A i d t = K I N × C p l a s m a K O U T ×   C i R e d u c t i o n i E l i m i n a t i o n i
where A i is the dose of Cr in tissue group i (μg), K I N is the clearance of Cr from plasma into tissue (L/h), K O U T is the clearance of Cr from tissue into plasma (L/h), C p l a s m a is the concentration of Cr in plasma (μg) and C i is the concentration of Cr in tissue group i (μg/L). The reduction of hexavalent chromium (Cr(VI)) to trivalent chromium (Cr(III)) is modelled as a first-order process [66].

2.4. Input Data

ExDoM2 requires the following input data: (1) particle concentration; (2) particle size distribution; (3) exposure duration; (4) particle density and shape factor; (5) wind speed; (6) age and gender of exposed subject; (7) breathing type and activity level of exposed subject.
Particles were considered spherical thus the shape factor was set equal to 1. However, particle density may vary considerably with diurnal variations or even seasonal variations that alter the measured density [67]. Reported values of particle density range from <1 gr/cm3 and up to 3 gr/cm3 with particle size, origin, chemical composition and ambient environment playing significant role on the measured densities [68,69,70]. Herein, we assumed particle density equal to 1.5 g/cm3 which is a reasonable value based on these studies. On the other hand, the density for the particle-bound metals was derived from the Centers of Disease Control and Prevention (CDC; https://www.cdc.gov/) and the values of 3.95, 6.95, 5.22, 4.8 and 9.5 gr/cm3 were used for As(III), Cd, Cr(III), Mn and Pb, respectively. The metal oxide densities (e.g., chromium (III) oxide) were used in the calculations.
Wind speed is a necessary input data for ExDoM2 due to its influence to the inhalability of particles. The nasal inhalability was calculated from the Equation (8) when wind speed ranged from 1 to 9 m/s whereas Equation (9) was used for wind speed less than 1 m/s [46,48]:
I n h a l a b i l i t y = 1 0.5 [ 1 ( 7.6 × 10 4 × d a e 2.8 + 1 ) 1 ] + 10 5 × u 2.75 × e x p ( 0.055 d a e )
I n h a l a b i l i t y = 1 [ 1 + e x p ( 13.56 + 0.4343 × ( 4.88 ) ×   l o g d a e ) ] 1
where u is the wind speed (m/s) and d a e is the aerodynamic diameter (μm). The yearly average wind speed used for all under study locations (2015 for Athens, 2010 for Kuopio, 2009 for Lisbon). (http://meteosearch.meteo.gr/; https://www.worldweatheronline.com).
The exposed subject was considered adult male and nose breather under three different activity levels (sleeping, sitting awake (rest) and light exercise) spending time both indoors (no sources) and outdoors. Table 2 presents the daily activity profile that was considered in the present model. Due to the unavailability of indoor PM data for the same sampling period with outdoor PM concentrations, the indoor PM particle concentration was approximated from the outdoor concentration using an indoor/outdoor (I/O) ratio that represents the no indoor-sources environment of the present model. Morawska and Salthammer [71] found that I/O ratio ranged between 0.5 to 0.98 with a median value of 0.7 for naturally ventilated buildings without indoor sources. Likewise, Aleksandropoulou [72] found that the median I/O ratio was equal to 0.7 for an apartment located in Chania whilst Lazaridis et al. [73] found that the I/O ratio in Oslo ranged from 0.41 to 1.59 with a median value of 0.7. Consequently, a 0.7 I/O ratio was adopted in the present model.

3. Results and Discussion

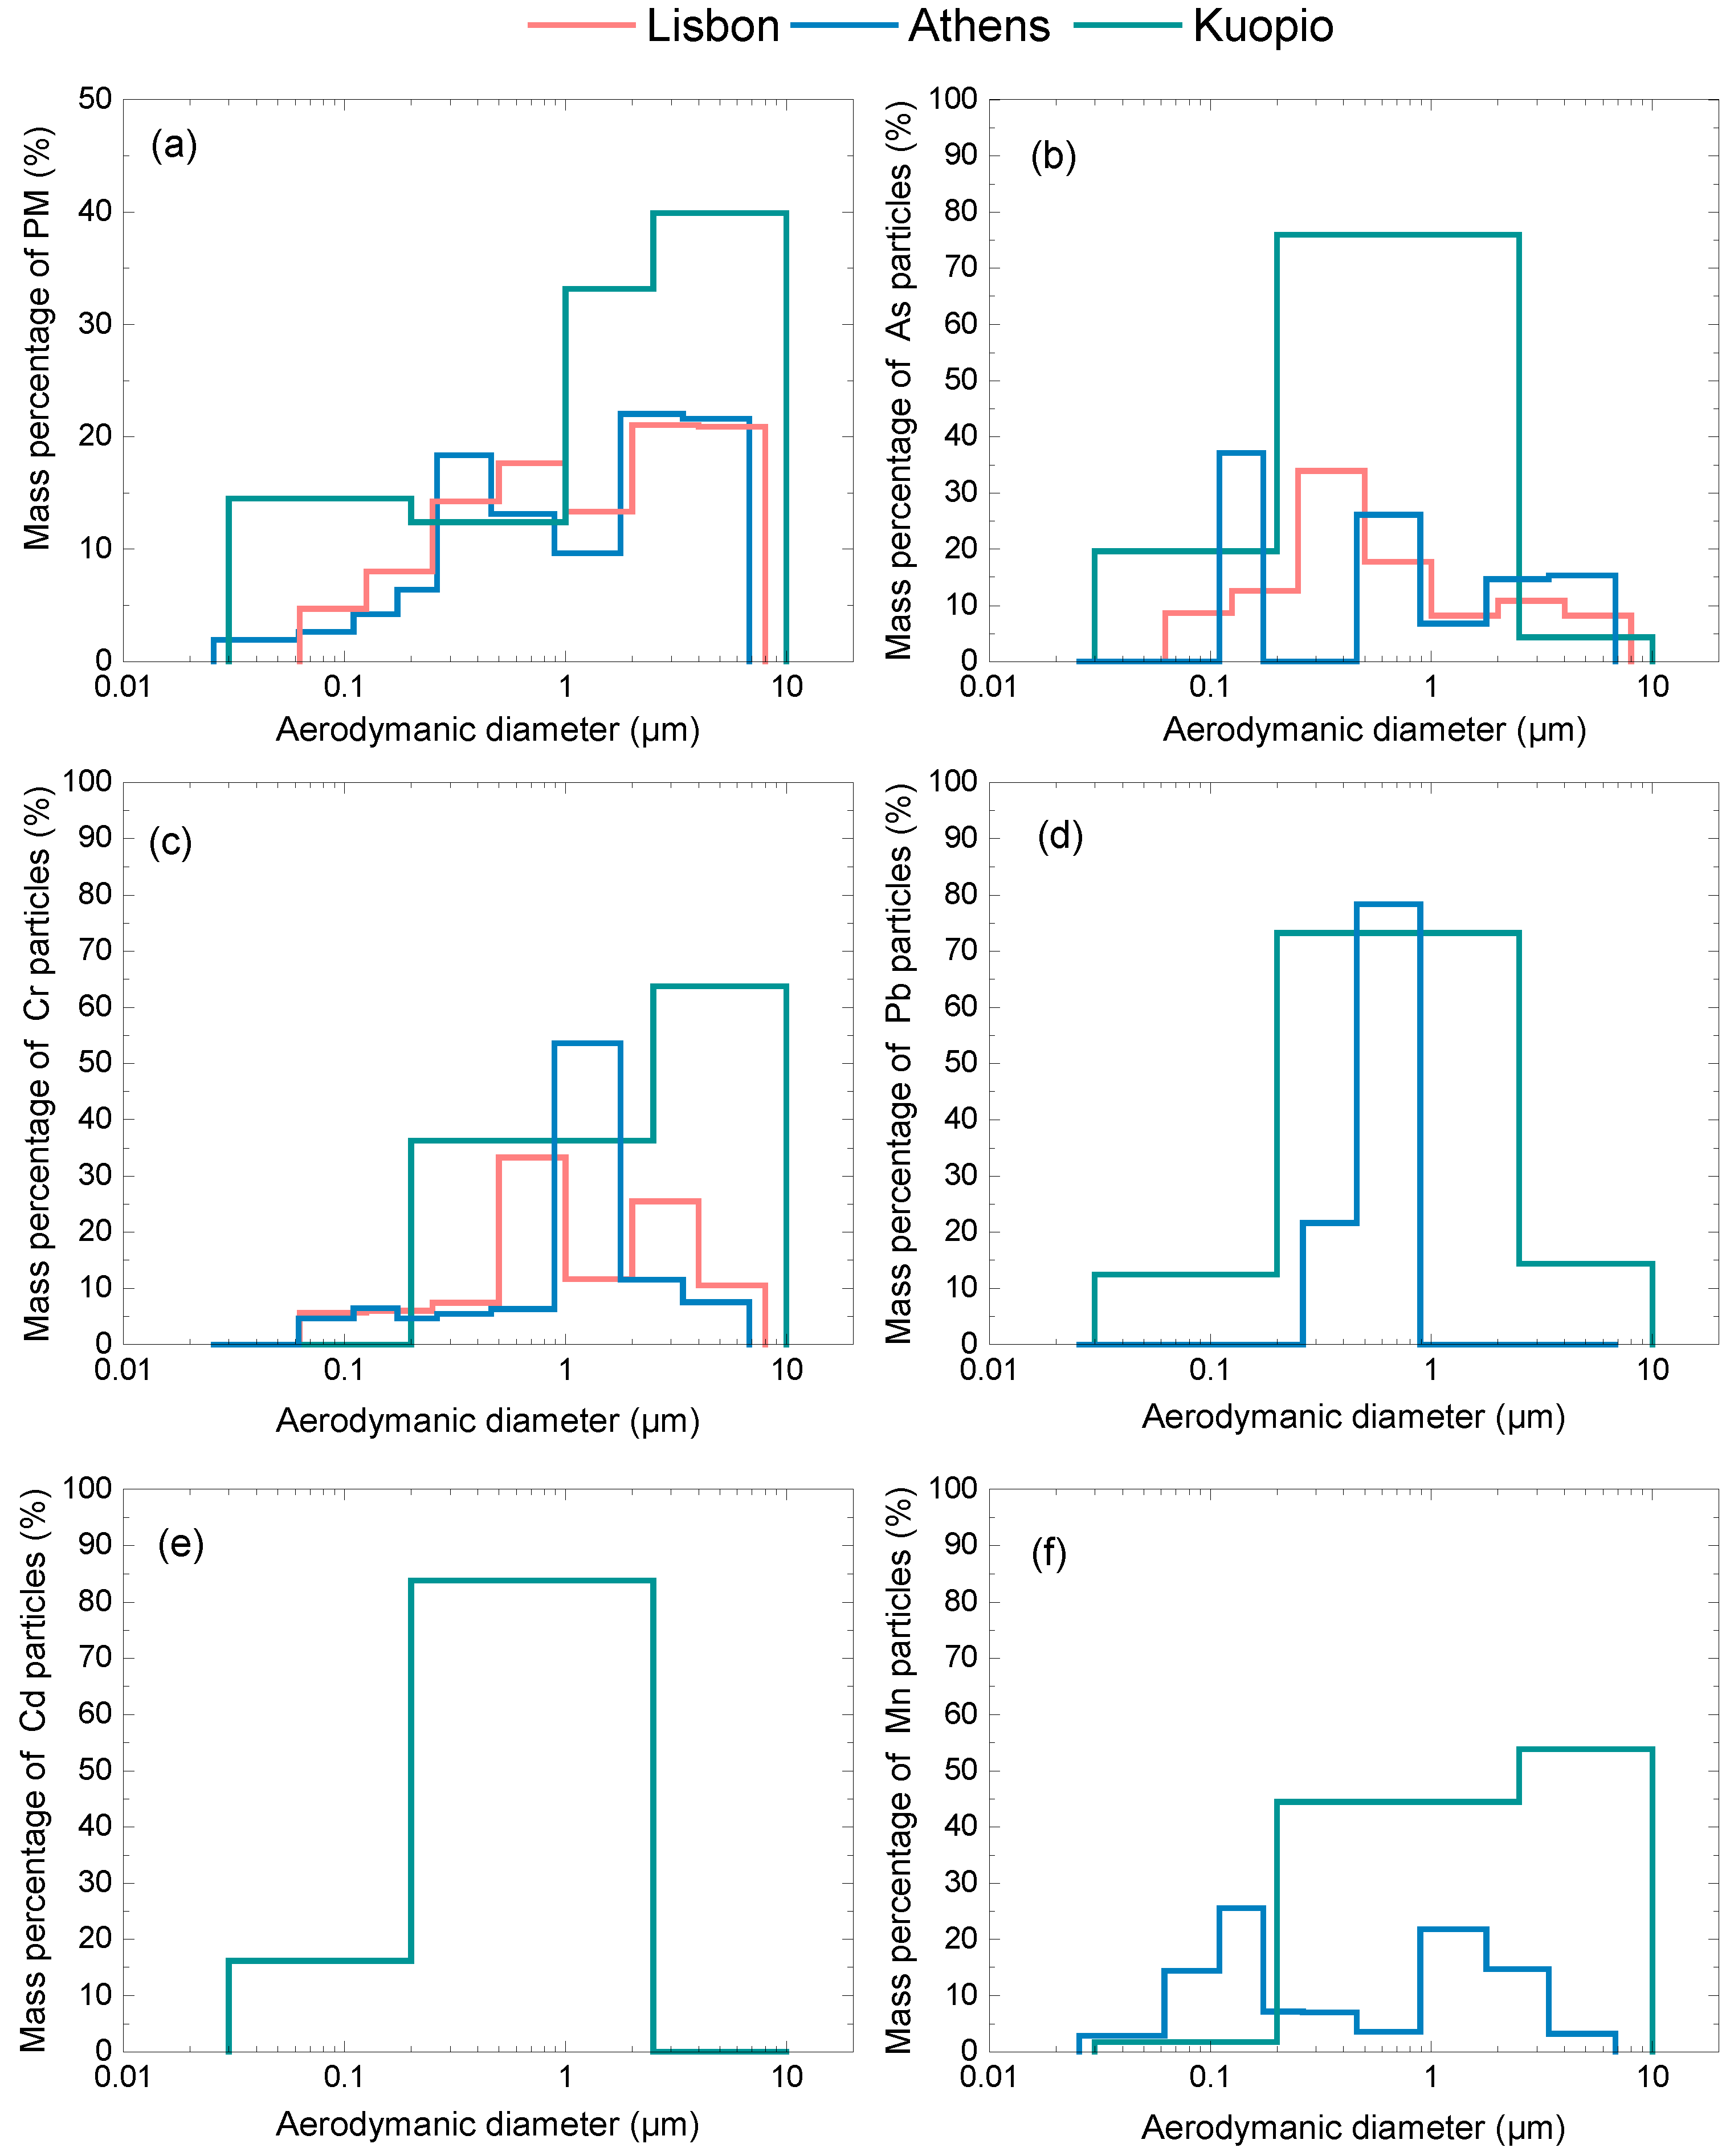
3.1. Particulate Matter Concentration and Size Distribution Data

Table 3 lists the PMx and particle-bound concentrations measured in each city. Due to the different campaigns incorporated in the present model the particle mass size distribution differs in each city, therefore, Athens corresponds to PM6.8, Kuopio to PM10 and Lisbon to PM8. Accordingly, discussion for the obtained concentrations is done in terms of higher or lower measured concentrations. As such, higher PMx concentration was measured in Lisbon (37 μg/m3) while lower concentration was found in Kuopio (10 μg/m3). Similar level of ambient PM concentration with Lisbon is reported for Frankfurt (36 μg/m3) and Zabrze (39 μg/m3) [74,75], whilst Katowice-street canyon (20 μg/m3 for PM10 and 19 μg/m3 for PM6.8) showed same level of ambient PM concentration with Athens [76].
Regarding particle-bound metals As, Mn and Pb concentrations were higher in Athens (2.9, 6.0 and 15.0 ng/m3 respectively) while for Cr the concentration was higher in Lisbon (23.8 ng/m3). Cd was measured only in Kuopio and corresponds to the lower concentration of particle-bound metals in Table 3. Rogula-Kozłowska et al. [75] found that the concentration of Cd and Mn particles in Zabrze was 1.2 and 97.9 ng/m3, respectively. In addition, Canepari et al. [77] found that the concentration of As, Cd and Mn particles in Rome was equal to 0.4, 0.3 and 11.9 ng/m3 respectively. These findings suggest that particle-bound metal concentrations within European urban environments present higher concentrations for Cr, Mn and Pb whereas significantly lower concentrations were obtained for As and Cd.
Subsequently, the mass percentage of the particle size distributions and distributions of particle-bounds metals for each city are shown in Figure 1. Figure 1a indicates that the mass percentage for fine particles (PM2.5 for Kuopio; PM2.0 for Lisbon and PM1.77 for Athens) was slightly higher than coarse particles (PM2.5–10 for Kuopio; PM2.0–8.0 for Lisbon and PM1.77–6.8 for Athens) for all three cities. More specifically, fine particles in Athens corresponded to 56% of the total measured mass, 58% in Lisbon and 60% in Kuopio. These values are in close agreement with the contribution of fine particles in Rome (57%) [77]. Almeida et al. [55] suggested that vehicle exhaust and secondary aerosol are the main sources of fine particles in Lisbon. Likewise, the high percentage of fine particles in Rome was attributed to traffic emissions [77]. Regarding Kuopio [54] the contribution of fine particles to PM10 was affected by biomass burning (winter) and wildfire smoke plumes (summer) whilst Eleftheriadis et al. [78] suggests that common anthropogenic sources apply for the background site in Athens with traffic emissions constitute a major contributor to PM concentrations.
Moreover, Figure 1b,e imply that As (96% for Kuopio, 81% for Lisbon and 70% for Athens) and Cd (100% for Kuopio) were predominantly associated with fine particles. These results are in agreement with Alvarez et al. [1] where it was found that As and Cd were accumulated in fine particles in Seville (Spain). In addition, Cr (Figure 1c) was predominantly present in the coarse mode in Kuopio (64%) while lower contribution was found in Lisbon (36%) and Athens (19%). Several studies [79,80] have shown that Cr particles are related with emissions from brake wear. Accordingly, the fillers in the brake linings are consisted of chromium oxides with the majority of break wear particles being predominantly in the coarse mode [79]. However, other studies [81,82] claim that break wear particles correspond mainly to fine particles. Figure 1d shows the vast majority of the mass distribution of Pb is located in the fine fraction (86% and 100% for Kuopio and Athens, respectively). This finding is linked with biomass burning in Kuopio. In addition, Figure 1f demonstrates that 54% of the mass size distribution of Mn corresponds to coarse particles in Kuopio which is associated with a source enriched with crustal materials. Davis [83] found that Mn originated from natural sources such as soil dust and was almost equally distributed in the two modes (coarse and fine mode).

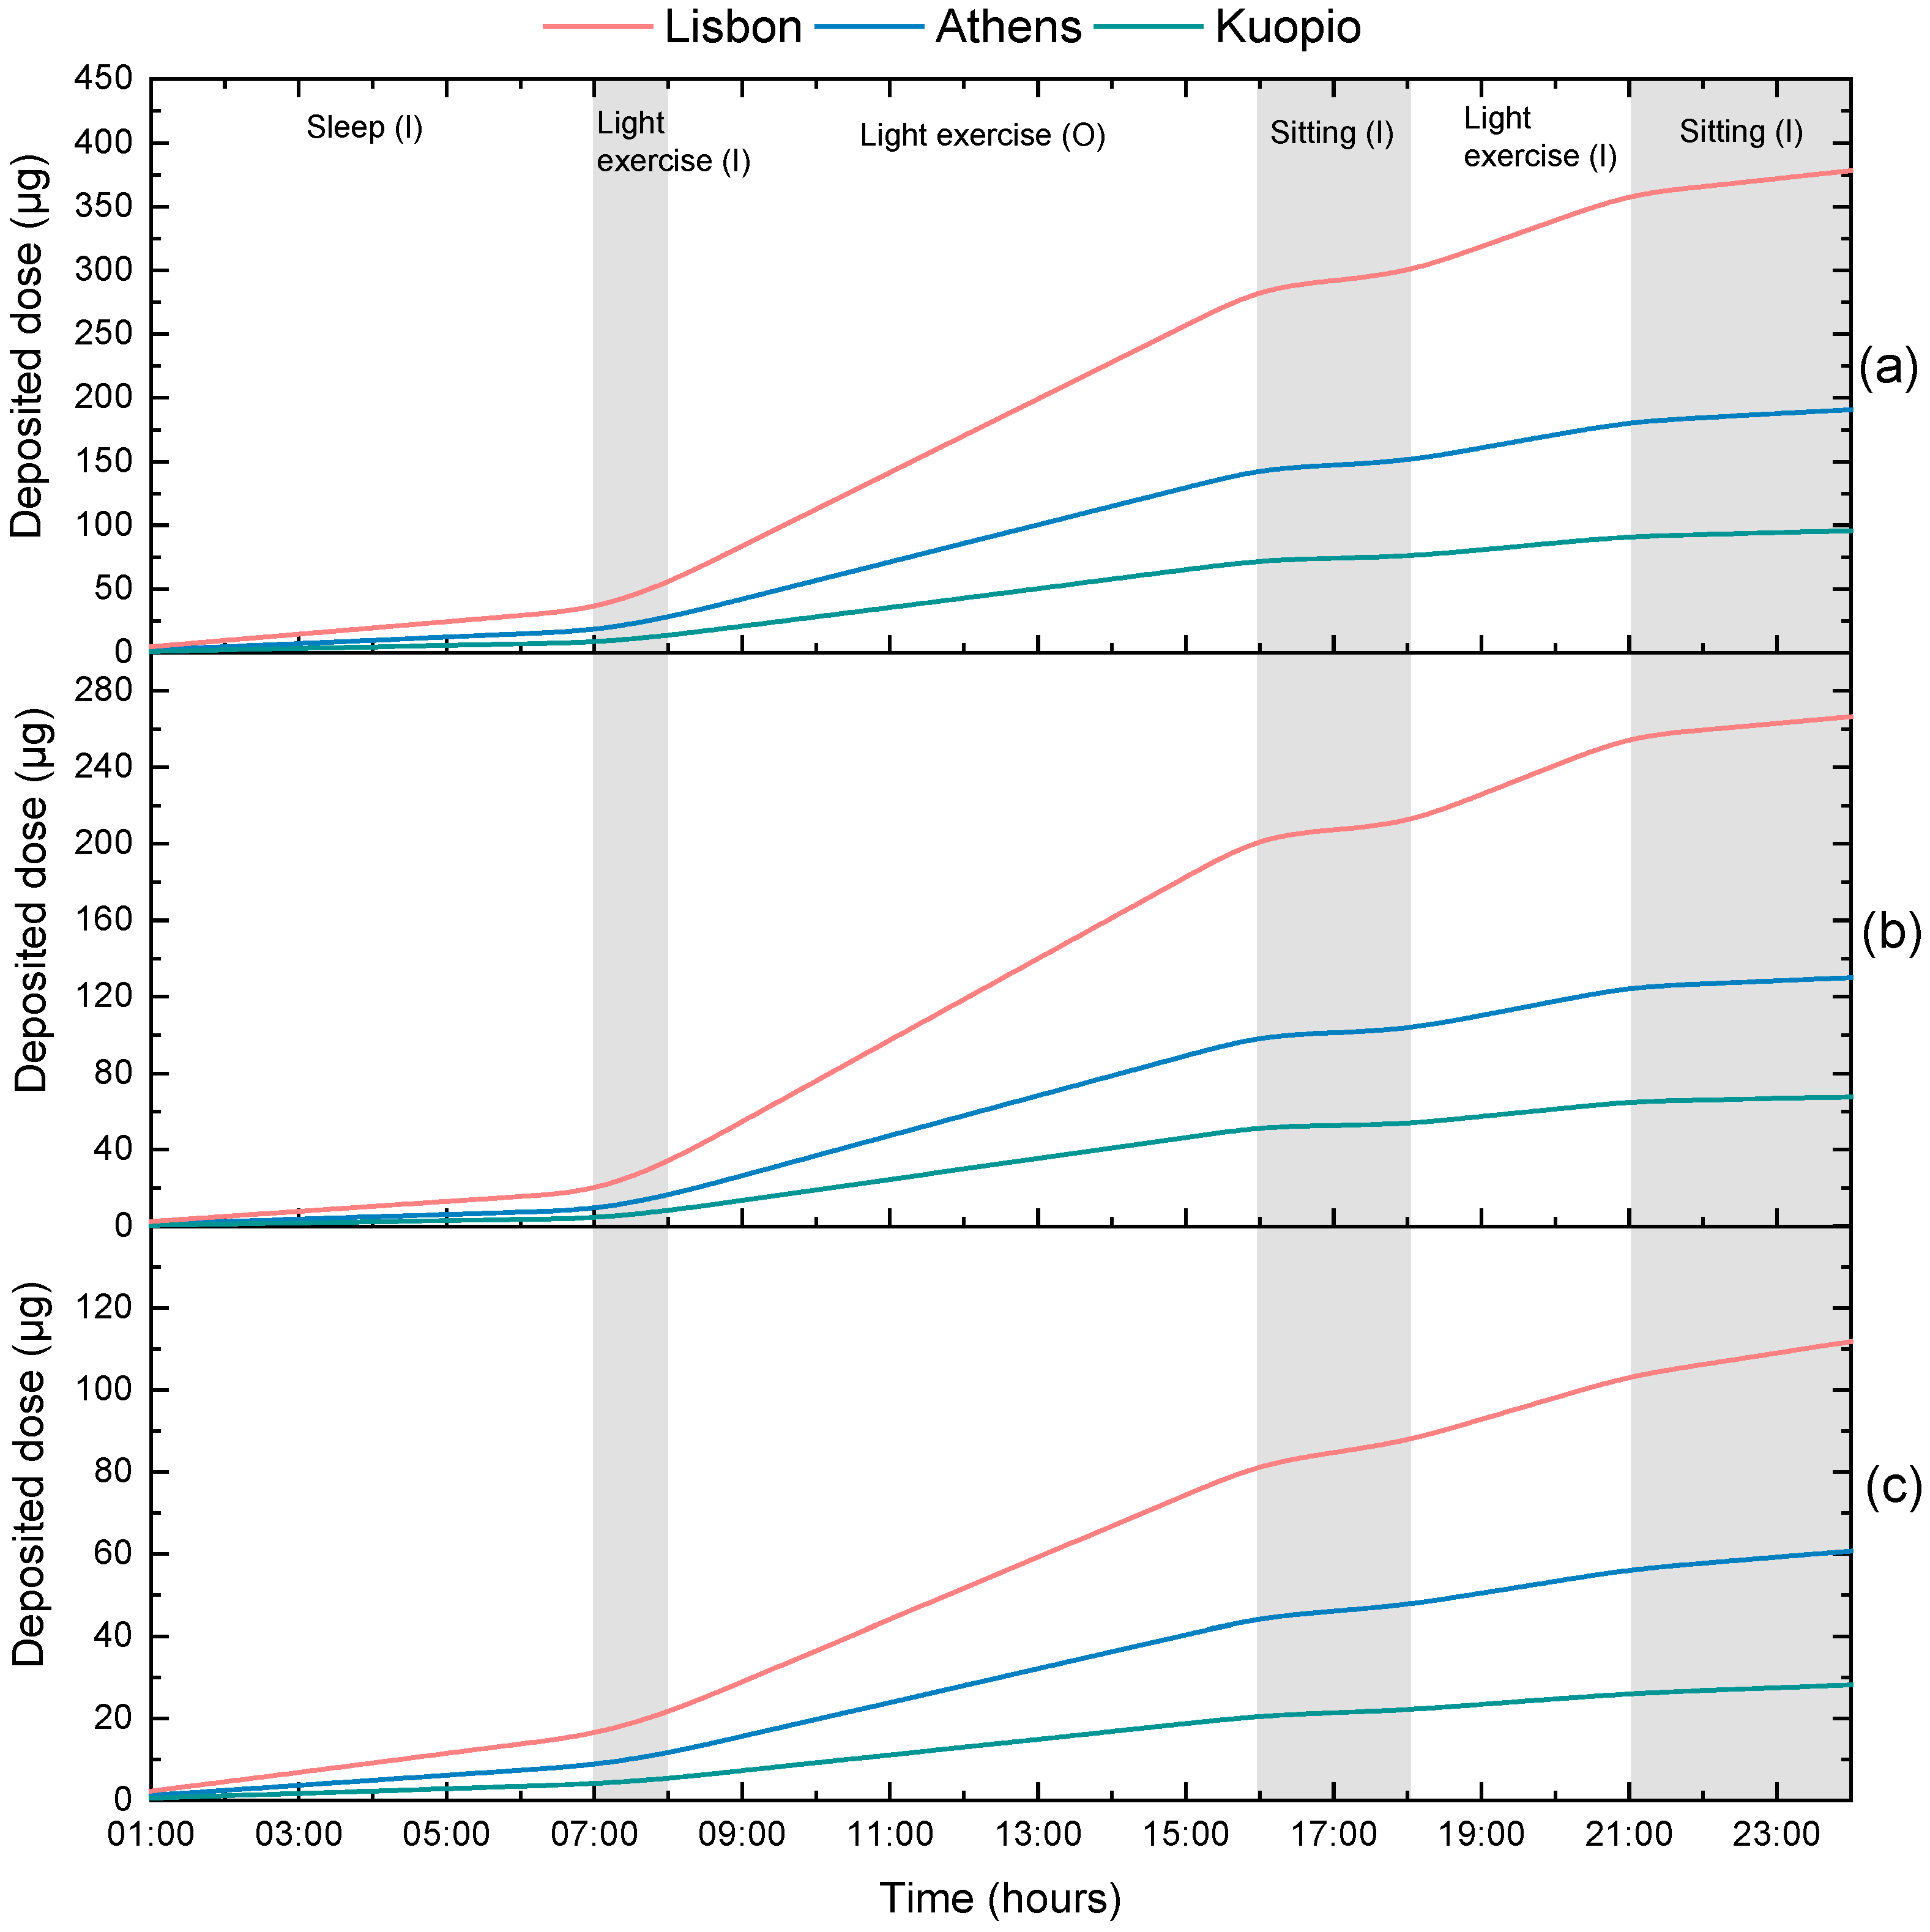
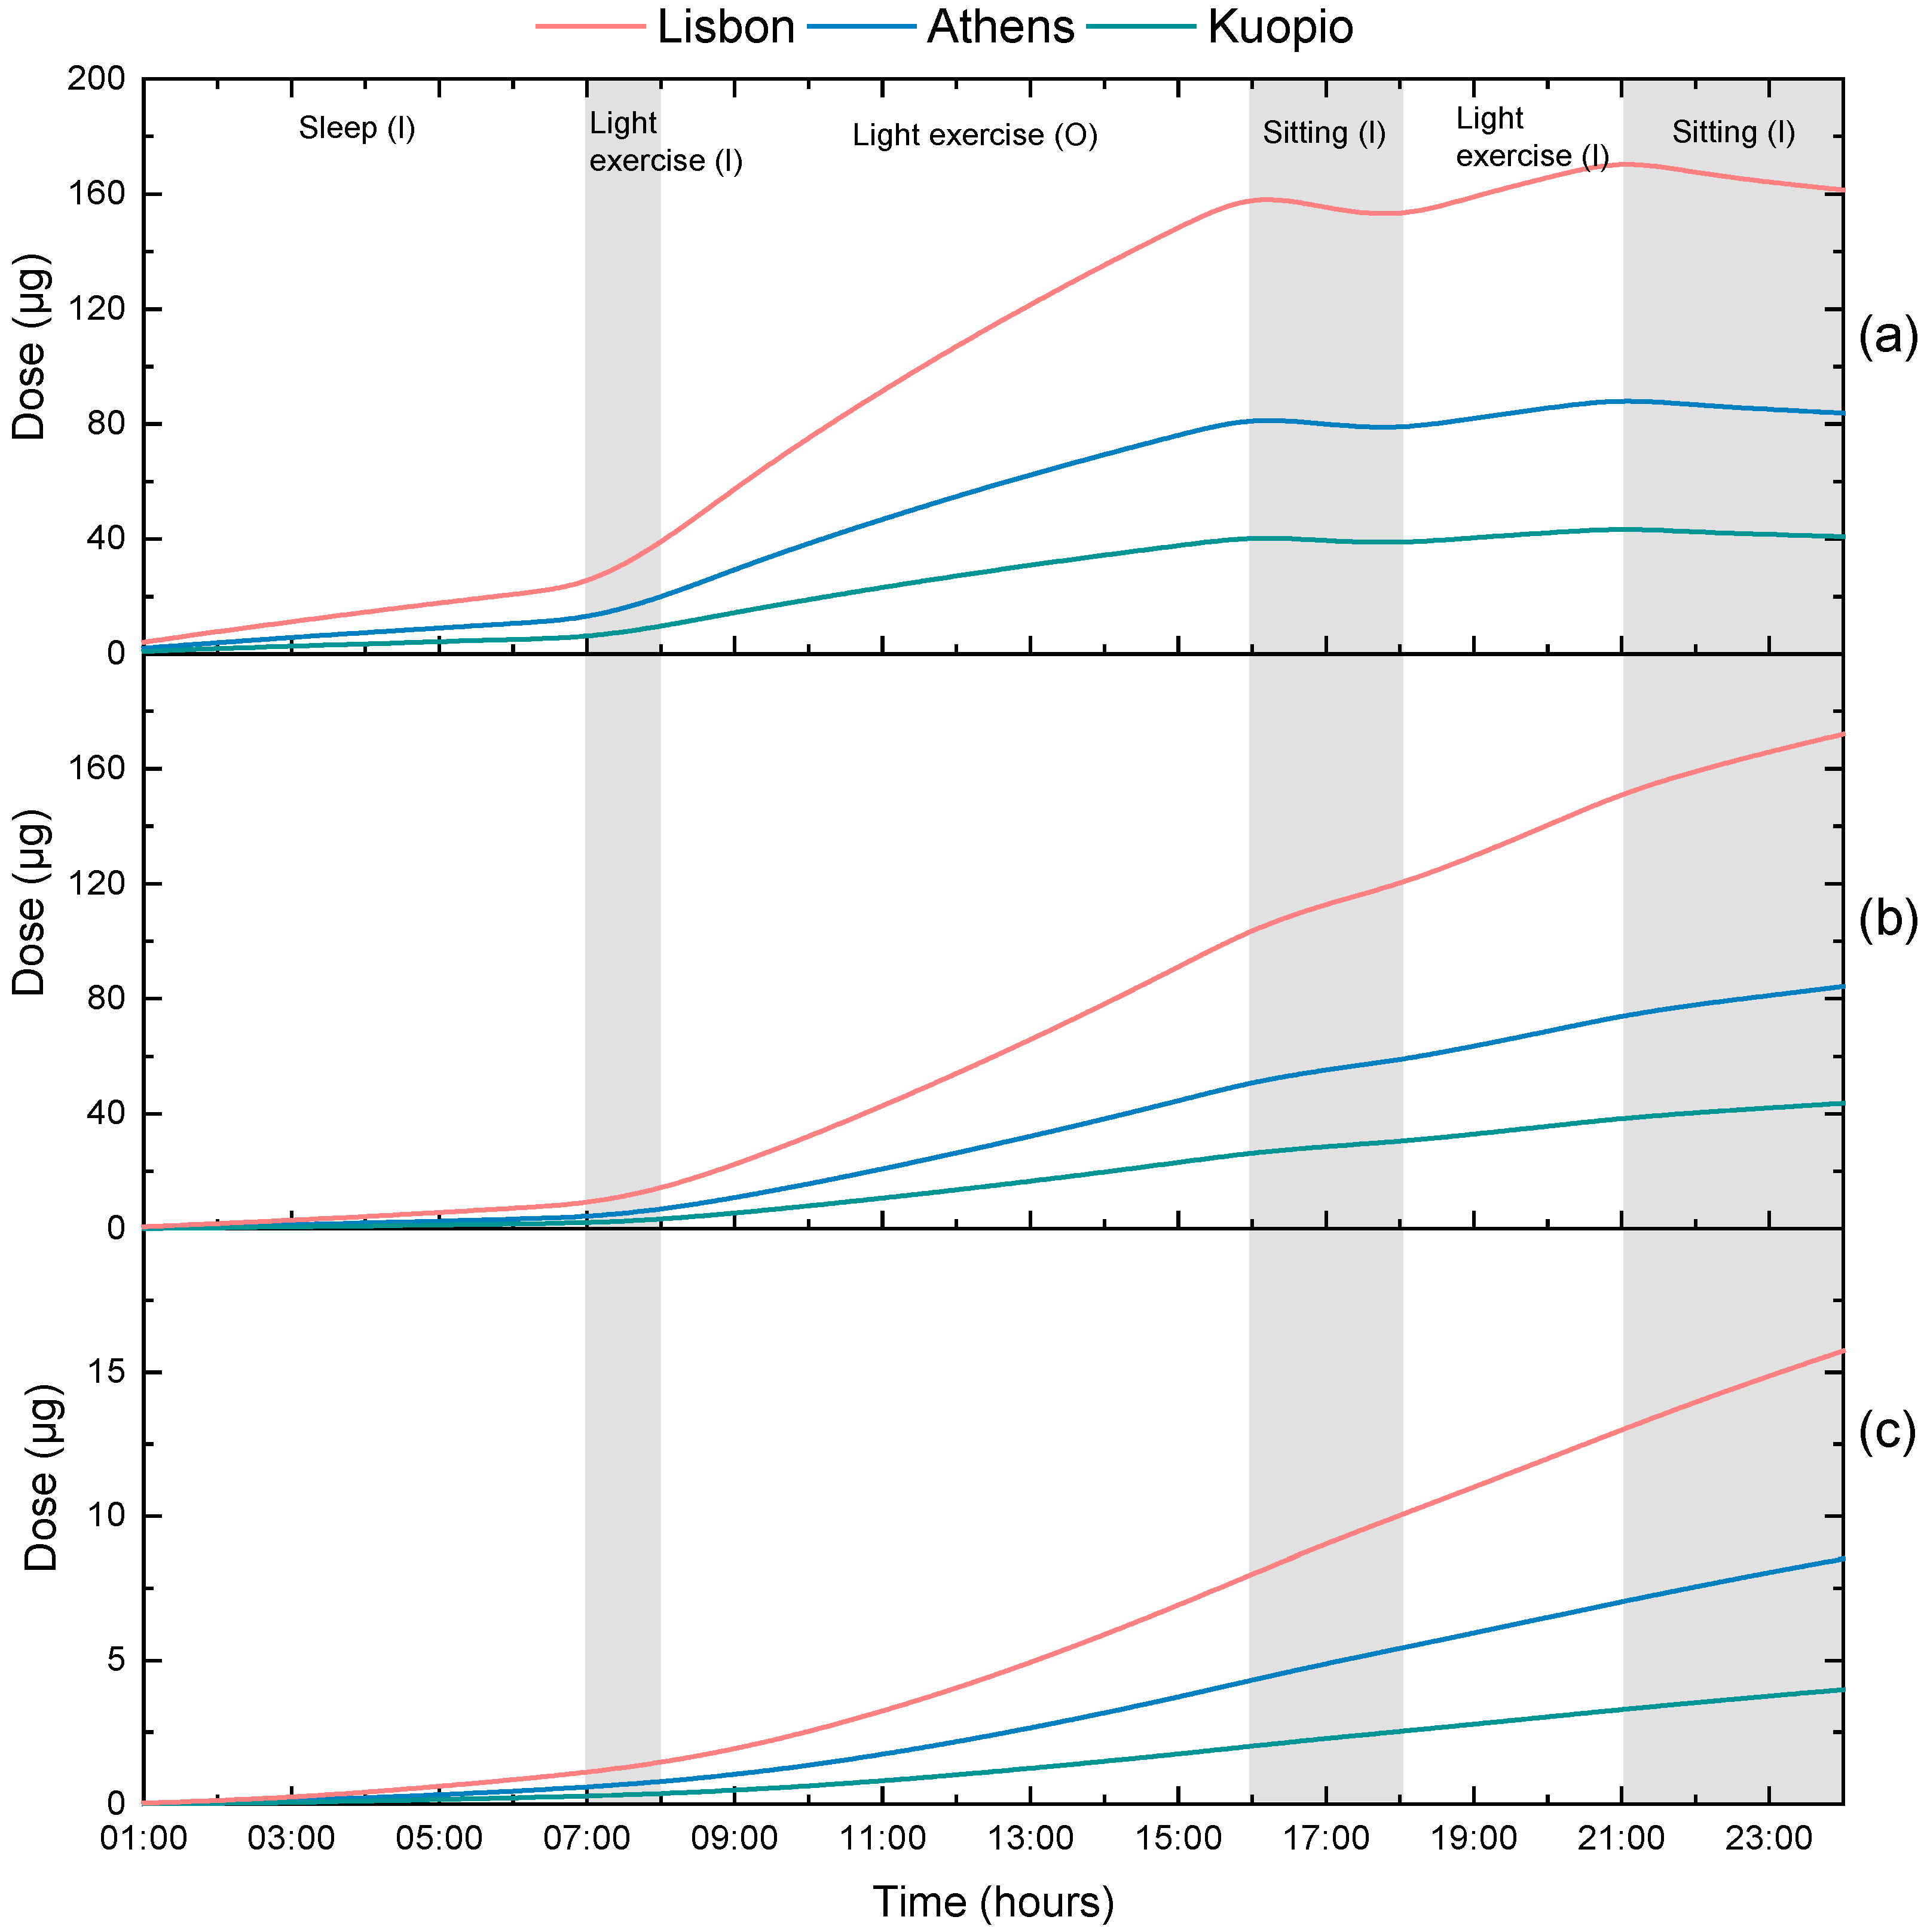
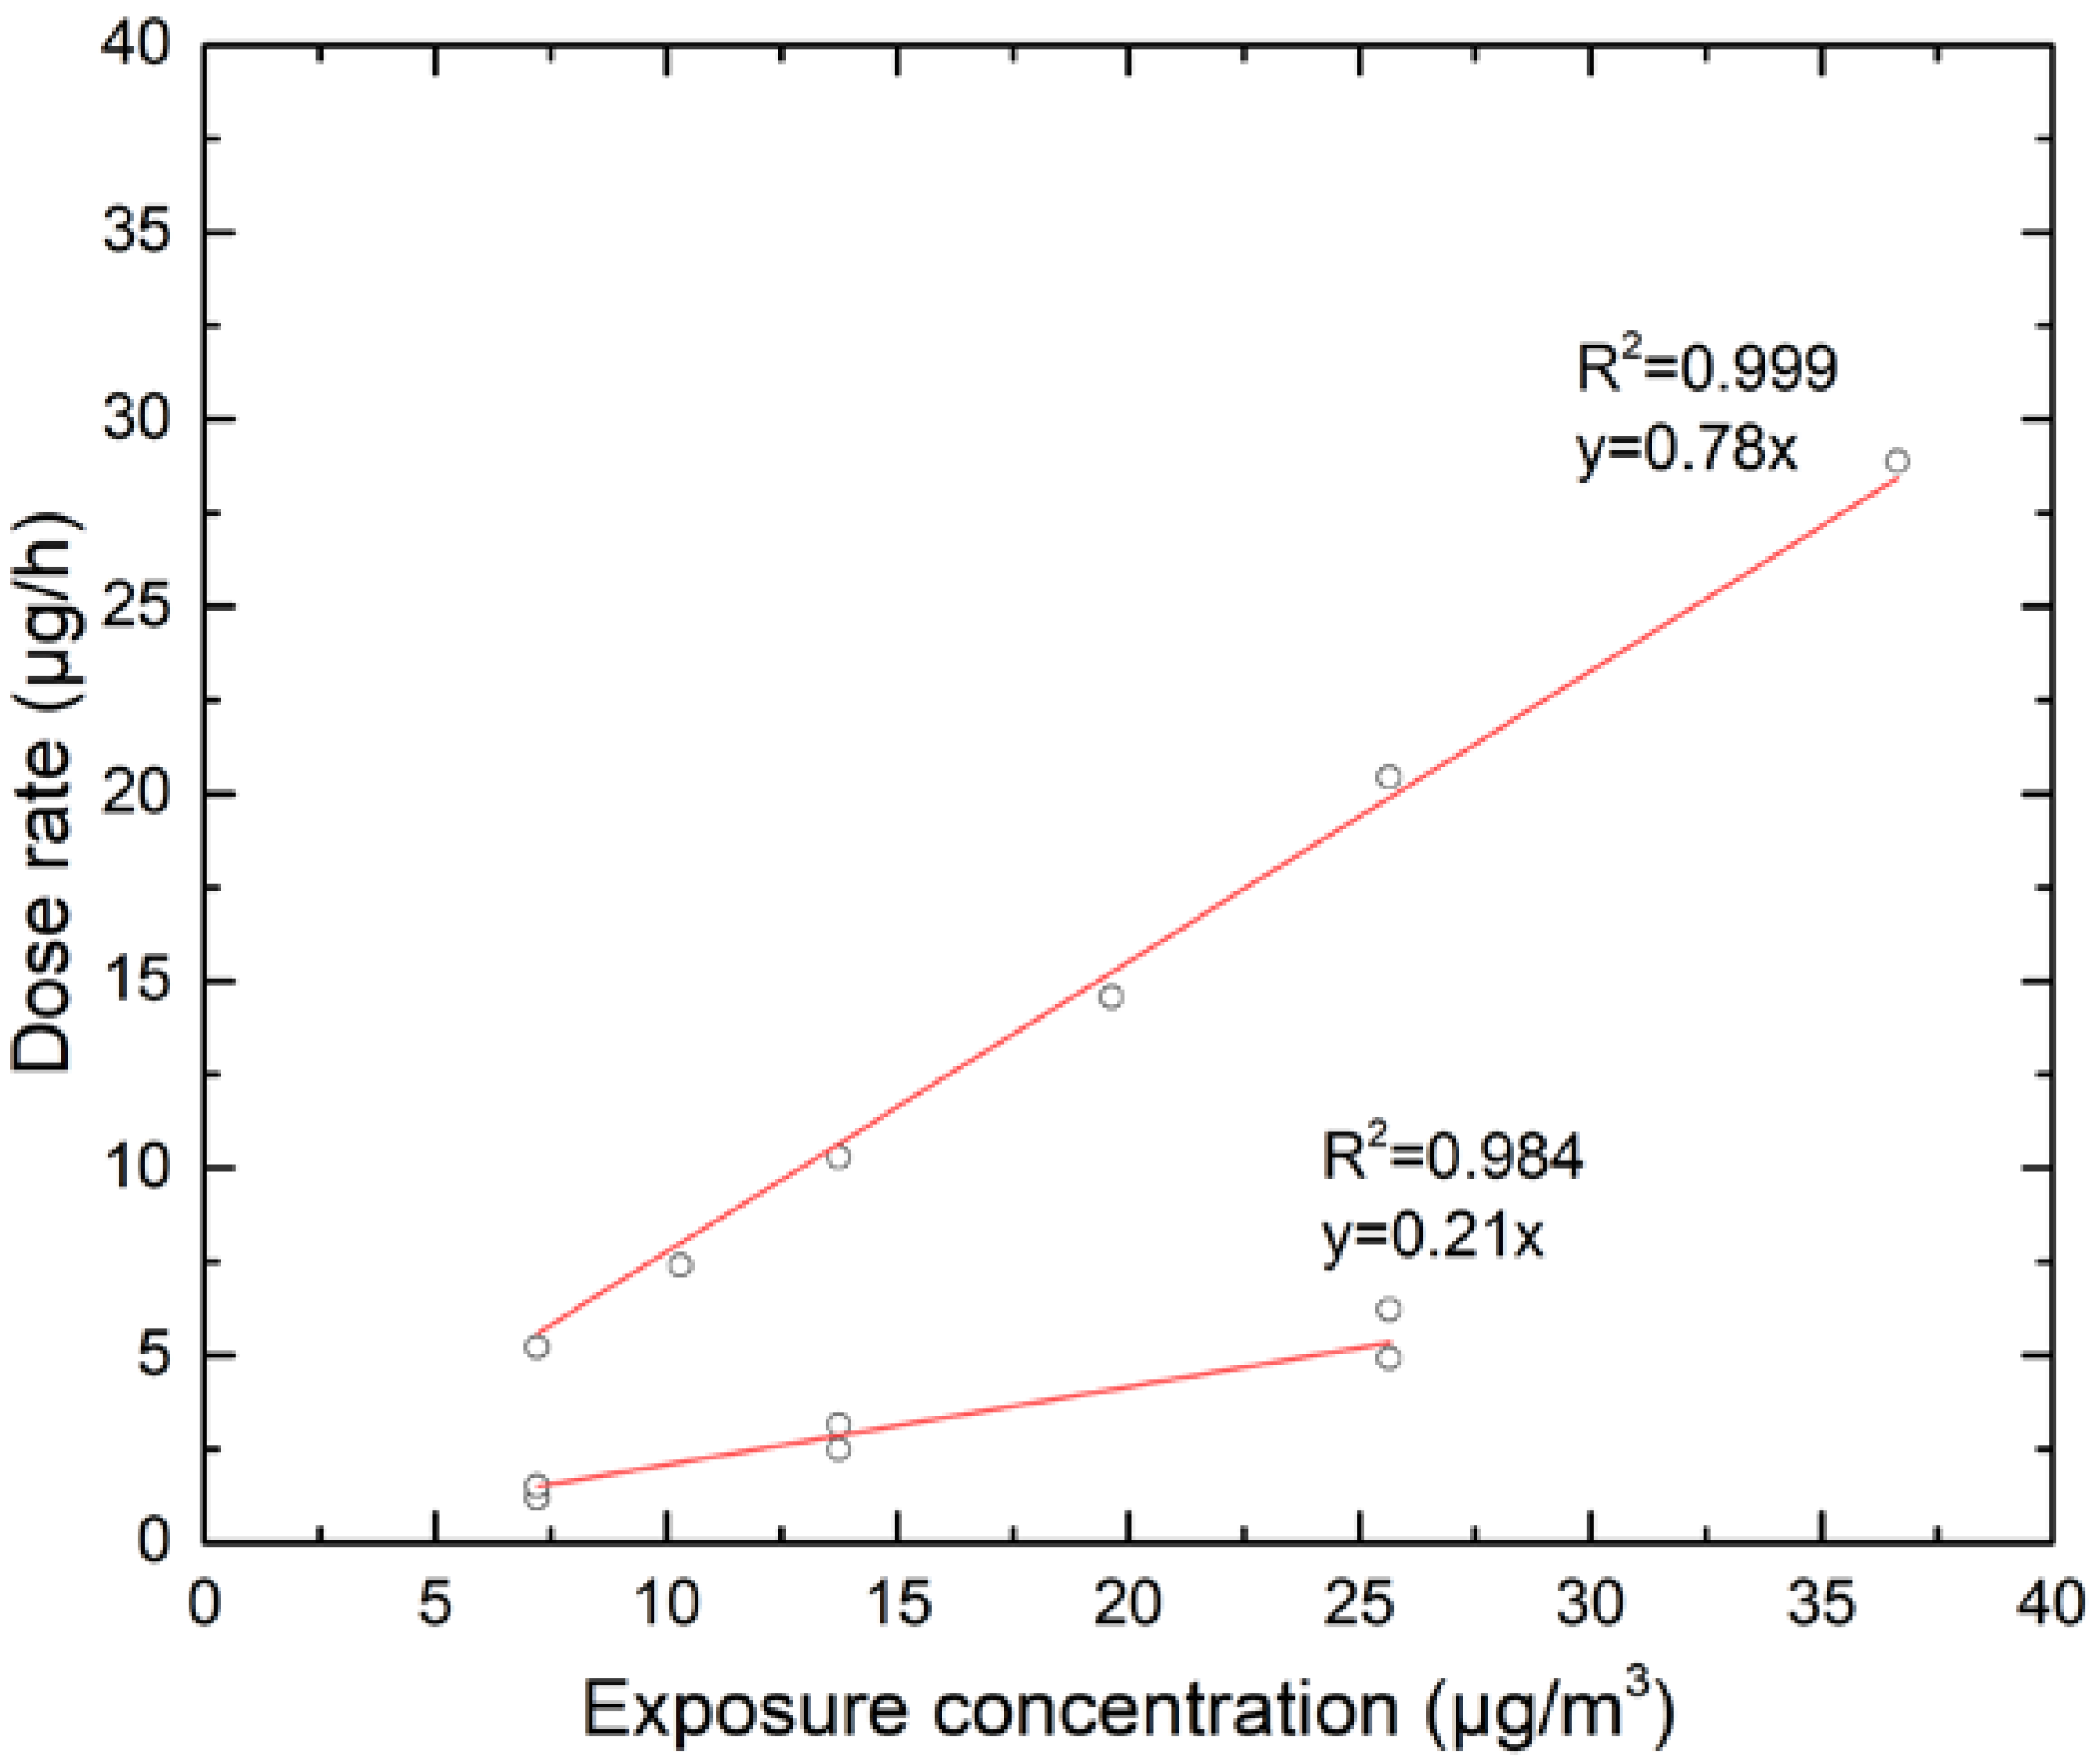
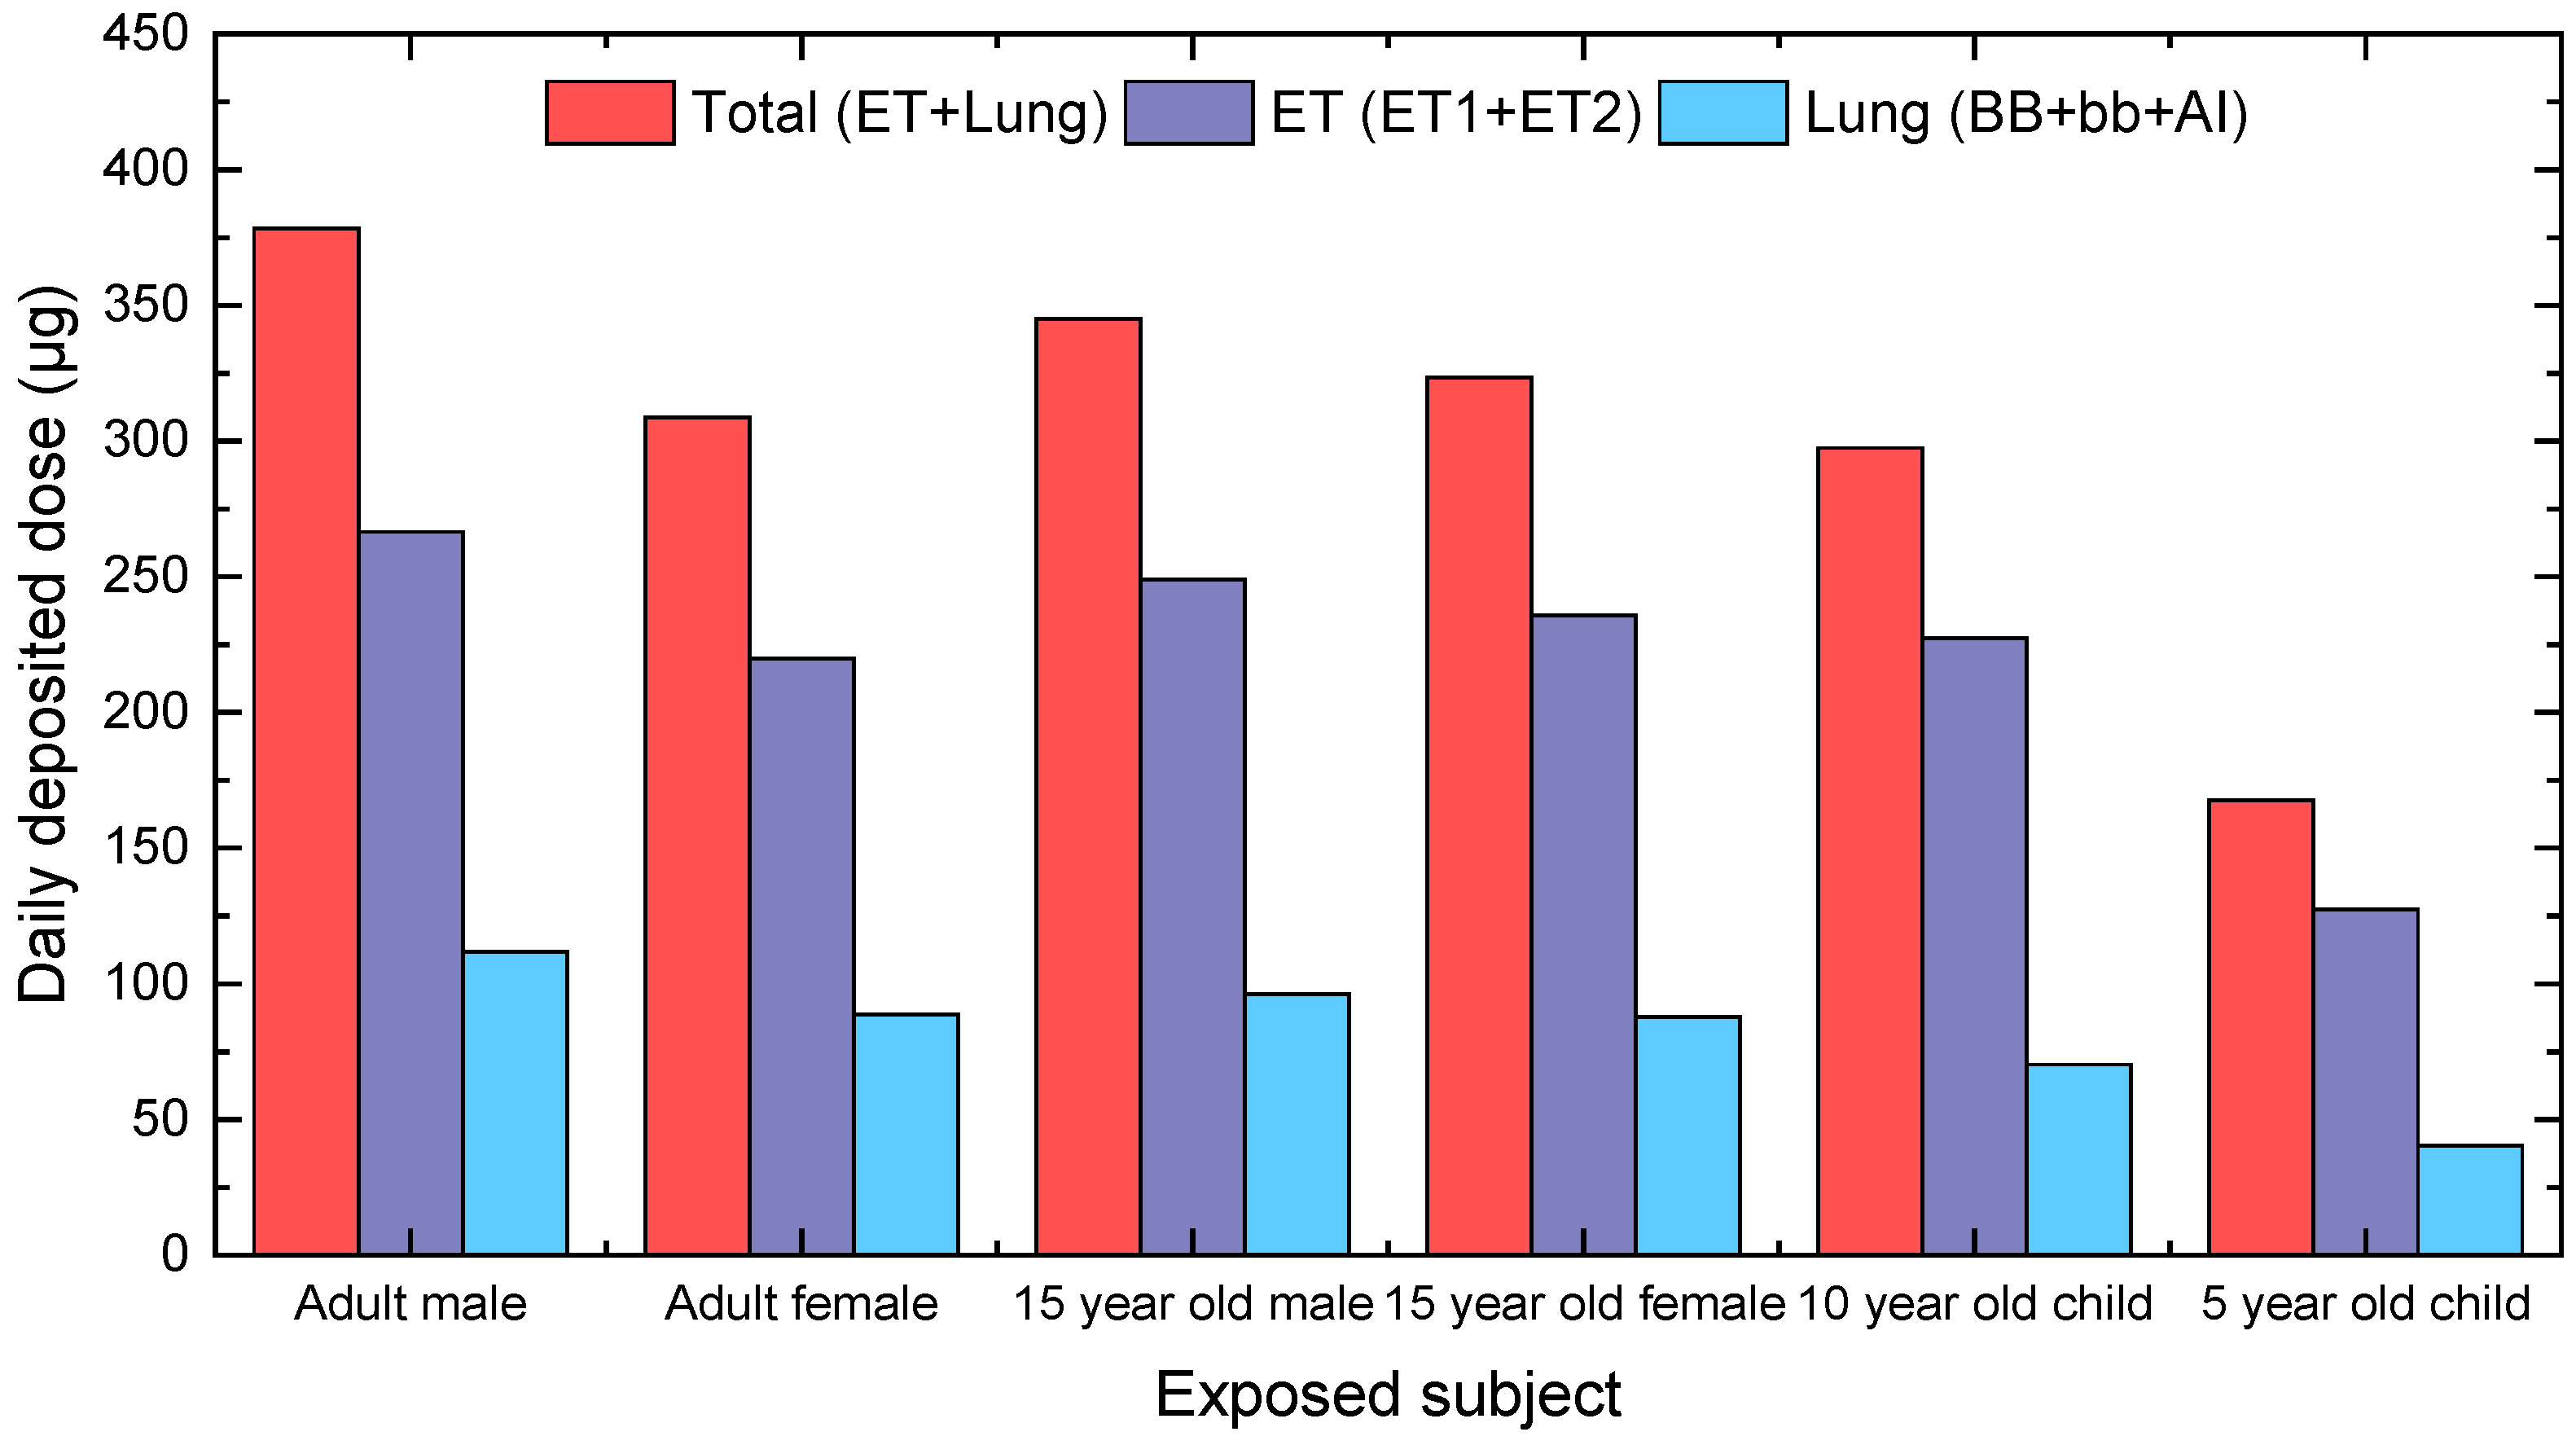
3.2. Calculation of Personal Deposited Dose and Internal Dose of Airborne Particles

Figure 2 presents the deposited dose in the human body at different regions of the respiratory tract. All three plots indicate a sharp increase of the deposited dose at 07:00 and afterwards for all modeled cases. This finding is associated with the change of the activity level (from sleep to light exercise) of the exposed subject as well as the change of the particle concentration due to the different microenvironment (especially after 08:00: indoors to outdoors). During working hours (outdoors, light exercise) the exposed subject received approximately 61% of the total deposited mass while during sleep (indoors) only 9% of the deposited mass was received. Moreover, all plots suggest that higher daily dose was received by a recipient in Lisbon (378 μg, 266 μg, 112 μg for total, ET and lung regions respectively) followed by a recipient in Athens (191 μg, 130 μg, 61 μg for total, ET and lung regions respectively) whilst lower daily dose was received by a recipient in Kuopio (96 μg, 68 μg, 28 μg for total, ET and lung regions respectively). This characteristic is directly linked with the PM concentrations measured in each location. More specifically, higher dose was obtained for Lisbon due to the higher PM concentration that was measured in this city (37 μg/m3) and lower dose found for Kuopio due to the lower ambient PM concentration at 10 μg/m3 (Table 3).
Furthermore, all plots in Figure 2 indicate that the deposited dose decreases while moving deeper into the human respiratory tract, thus, lower dose was obtained for lung region compared to ET region. This finding is associated with particle size. Brown [84] found that particles in the range 0.1–1.0 μm show minimal deposition in the respiratory tract (total) with a large amount of these particles exhaled. Furthermore, coarse particles deposit predominantly in the ET region [38,48,84,85,86]. For example, 75% of deposited mass in the ET region in the case of Lisbon corresponds to coarse particles. Zwozdziak et al. [38] pointed out that coarse particles are responsible for the majority of the inflammatory response, a fact that could be detrimental to susceptible populations. Ferguson et al. [87] and Becker et al. [88] found that coarse particles are mainly responsible for inflammatory response. Furthermore, Voutilainen et al. [86] showed that exposure in same PM10 levels but with different particle size distributions gave different regional deposition of particles in the human respiratory tract. Thus, the deposited dose is dependent not only to the ambient concentration but also to particle size.
The retained dose in the respiratory tract and the mass transferred to the oesophagus and blood are shown in Figure 3. For the calculation of the retained dose (Figure 3), the ExDoM2 takes into account that the deposited particles in the respiratory tract (results of Figure 2) are cleared due to particle transport (e.g., nose blowing, mucociliary action) and absorption to blood. Higher dose in the respiratory tract and blood was received by a resident in Lisbon (161 μg and 16 μg respectively) in agreement with Figure 2 due to the higher particle concentrations measured in this location. Likewise, higher total dose was transferred to the oesophagus of a resident in Lisbon (172 μg) due to higher deposited dose in the ET region (Figure 2b) in comparison with the other cities. According to ICRP [48,79] particles that are deposited to the ET region are transferred to the oesophagus while particles deposited to the other regions of the respiratory tract require more time to reach the ET2 region (where they are swallowed to the gastrointestinal tract) via mucociliary clearance. Hence, it is more likely to remain in the respiratory tract and absorbed to blood. In addition, Hayes [89] pointed out that the clearance of particles in the upper respiratory tract is faster in comparison to the lower respiratory tract and Kelly et al. [90] indicated that particles deposited in the AI region have easier access to the blood stream than particles deposited in the ET region. In particular, the absorption to blood takes place in all regions of the human respiratory tract with exception the ET1 region for which it is considered that no absorption occurs [48,49].
Figure 4 presents the correlation between the exposure concentration and the dose rate. The results indicate a linear increase of the dose rate with the exposure concentration distinguished into two groups: a group with lower estimated dose and a group with higher estimated dose. Accordingly, the first group corresponds to no activity (sitting, sleeping) profile during the exposure scenario whereas the second group corresponds to light activity profile. Similar observation is found in [91]. The results also suggest a steeper increase (0.78 vs. 0.21) of the dose rate during light activity, a characteristic that is associated with increased inhalation rate during light exercise. The majority of health effect assessment studies assumed a linear relationship with Neuberger et al. [92] point out that the relationship between particulate matter and respiratory admissions are empirically linear. Likewise, Qiu et al. [93] found that the concentration-response between coarse particles and emergency hospital respiratory admissions was almost linear. Finally, the World Health Organization (WHO) [94] claimed that the results from short-term epidemiological studies [95] suggest that linear models are appropriate for estimating the influence of PM10 on mortality and morbidity.
Furthermore, the impact of the age and gender of the exposed subject to the total and regional deposited dose was investigated using as case study the concentrations measured in Lisbon. The residents of Lisbon were selected due to the higher PM concentration in comparison with the other cities. The same daily activity pattern was considered for all exposed subjects and the results are shown in Figure 5.
Figure 5 shows that the regional and total deposited dose was higher in adult males than in adult females by 23, 21 and 26% for total, ET and lung region respectively. Bennett et al. [96] found that the deposition rate was 30% greater in males due to the higher ventilation rate although the deposition fraction was greater in females than in males. In addition, the regional and total deposited dose for an adult male was higher than under aged children, whilst, the regional and total deposited dose for a 15-year-old male was higher than that of an adult female by 12, 13 and 8% for total, ET and lung region respectively. This finding is attributed to the higher inhalation rate and tidal volume of a 15-year-old male in comparison with an adult female. Considering that the respiratory tract of a growing child is more vulnerable special attention must be given to children exposure [97]. Therefore, the present results demonstrate that the deposited dose in the human respiratory tract strongly depends on the inhalation rate with the age and gender of the exposed subject playing an important role.

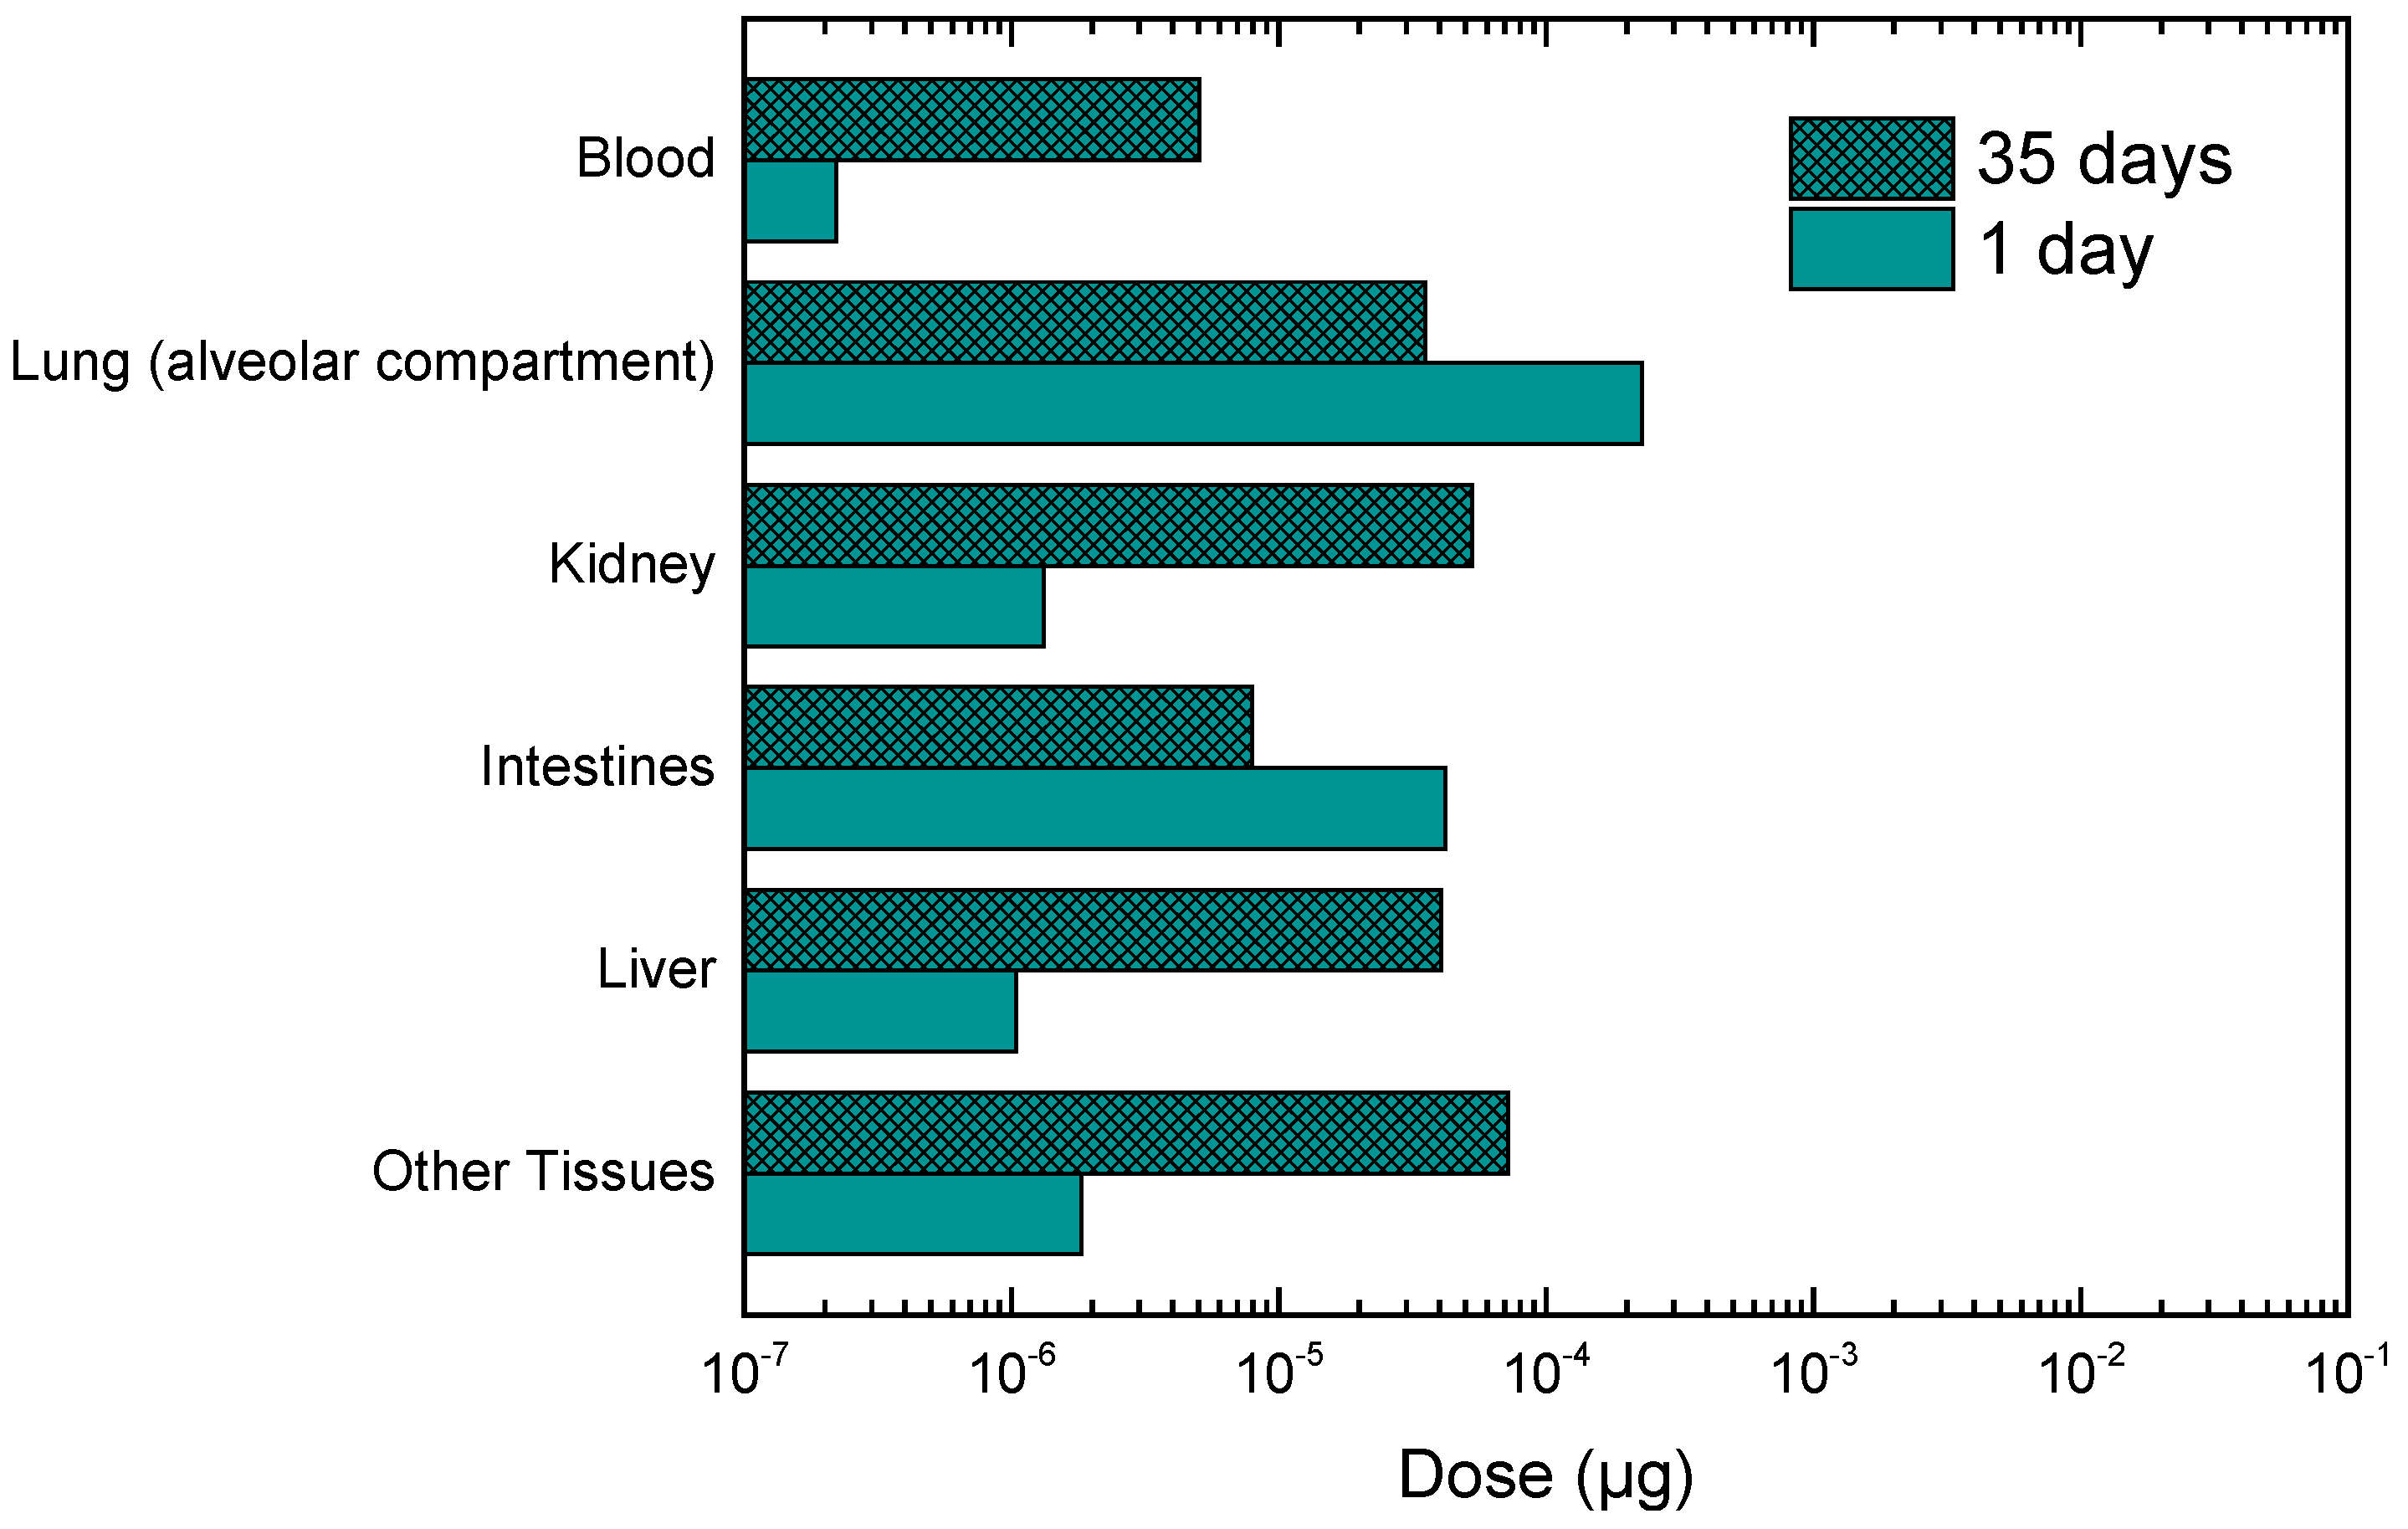
3.3. Calculation of Personal Deposited Dose and Internal Dose of Particle-Bound Metals

Table 4 lists the cumulative deposited dose estimated for the particle-bound metals in the three sites. Overall, the deposited dose ranged between 0.17 × 10⁻²–25 × 10−2 μg with the variability of the obtained results associated with the measured concentration of the metals in each location (Table 3). Therefore, higher dose for As, Pb and Mn (3.5 × 10⁻², 4.1 × 10⁻² and 18 × 10−2 μg respectively) was obtained for a recipient in Athens, whereas, higher dose for Cr was obtained for a recipient in Lisbon (25 × 10−2 μg).
The results of Table 4 were used as input data for the respiratory tract clearance module of ExDoM2 to estimate the retained dose in the lungs and the mass transferred to oesophagus, blood and lymph nodes which were subsequently used as input data for the PBPK module of As, Pb, Cr and Mn. The PBPK module for Cd incorporates a respiratory tract model only for cadmium particles [98]. The results from the PBPK module are presented in Figure 6 for As, Pb, Cr and Mn and in Figure 7 for Cd.
According to Figure 6a at the end of the exposure period higher dose of As is present in lungs (7.5 × 10⁻⁴ μg for Kuopio; 2.0 × 10⁻³ μg for Lisbon; 1.6 × 10⁻² μg for Athens) and in the muscles (2.4 × 10⁻⁴ μg for Kuopio; 5.7 × 10⁻⁴ μg for Lisbon; 4.8 × 10⁻³ μg for Athens) followed by the other tissues and liver compared to the rest tissues under investigation. The European Commission [31] proposes that As accumulates in the muscles, bones, kidneys, liver and lungs (autopsy data). Higher dose of As is received in the lung region due to the moderate absorption of As particles to blood based on ICRP and lung’s larger tissue/blood partition coefficient compared to other tissues (except liver). The elevated dose in muscles is due to high blood flow during light activity while the high dose in liver is due to the larger tissue/blood partition coefficient in comparison with other organs [59,60,61,62,99]. In particular, greater tissue/blood partition coefficient means greater retention of metals in organs [47,99]. However, tissues with a high blood flow (e.g., muscle during light activity) can receive high dose of metals even though the tissue/blood partition coefficient is lower in comparison with other organs [47]. Chou et al. [59] found that the liver and lung tissues received the highest dose after chronic exposure to arsenic particles whilst Saha et al. [100] proposed that As accumulated in liver is responsible for liver disease in humans. Likewise, Falk et al. [101] and ATSDR [102] claimed that chronic inhalation of As can cause lung and liver cancer.
Figure 6b demonstrates that Cr particles accumulate mainly in the GI-tract (ranged from 1.9 × 10⁻³ μg (Kuopio) to 7.1 × 10⁻² μg (Lisbon)) and in the lung region (ranged from 5.7 × 10⁻⁴ μg (Kuopio) to 8.9 × 10⁻² μg (Lisbon)). The significantly higher accumulation in the GI-tract and lung region occurs due to the mucociliary clearance and the slow absorption to blood. O’Flaherty et al. [66] claimed that chromium particles are transferred to the GI-tract via mucociliary clearance. It should be noted that the particle mass deposited in the ET region is transferred relatively fast to the GI-tract while particle mass deposited in the lung region needs more time to reach the ET2 region via mucociliary clearance and hence more time to get transferred to the GI-tract.
Figure 6c implies that the highest dose of Mn at the end of the day was found in the other tissues (3.1 × 10⁻² μg for Kuopio; 6.0 × 10⁻² μg for Athens) and the lung region (7.2 × 10⁻³ μg for Kuopio; 9.2 × 10⁻² μg for Athens). The WHO [103] proposes that inhalation exposure to manganese particles affects the lung region and nervous system whilst ATSDR [34] suggests that inhalation of manganese particles cause inflammatory response in the lung region. Regarding Pb, Figure 6d suggests that higher accumulation occurs in the bones (1.8 × 10⁻² μg for Athens; 5.8 × 10⁻³ μg for Kuopio) and blood (5.7 × 10⁻³ μg for Athens; 1.9 × 10⁻³ μg for Kuopio). Several studies propose that [104,105,106,107,108] Pb accumulates in the bones while Pb in blood reflects recent exposure to lead particles. This occurs due to the fast absorption (based on ICRP) of Pb particles to blood. In addition, the WHO [108] suggests that Pb remains in teeth and bones for years.
Lastly, the internal dose for Cd was calculated for 1-day exposure as well as 1-day exposure but 35 days after initial intake. Figure 7 indicates that after 1-day exposure Cd was primarily accumulated in lungs (2.3 × 10⁻⁴ μg) and in intestines (4.2 × 10⁻⁵ μg) whereas after 35 days from initial intake accumulation was higher in other tissues (7.2 × 10⁻⁵ μg), in kidney (5.3 × 10⁻⁵ μg) and in liver (4.4 × 10⁻⁵ μg). Several studies [98,109,110] found that Cd accumulates in kidney and liver. In addition, the WHO [110] suggests that the half-life of Cd in kidney is about 10–20 years with kidney damage being a primary health concern [109] because it is considered a critical target organ [32].

4. Conclusions

The ExDoM2 was applied for an adult male considering one day exposure activity profile with input data from three selected European cities (Athens, Kuopio, Lisbon). Higher PM concentration among the three cities was measured in Lisbon, thus, higher deposited dose (total and regional) was obtained for this city. Besides the measured concentration, the deposited dose in the human respiratory tract was significantly dependent on particle size and the activity level of the exposed subject. Therefore, during working hours (outdoors, light exercise) the exposed subject received approximately 61% of the total deposited mass while during sleep (indoors) only 9% of the deposited mass was received. In addition, the results indicated a linear relationship between the exposure concentration and the dose rate with a clear distinguish between light activity and no activity values. Model results also demonstrated that the age and gender of the exposed subject play significant role in the calculation of the deposited dose in the human respiratory tract with higher estimates corresponding to adult males.
The major difference of the ExDoM2 model compared to other dosimetry models (e.g., MPPD) is that it incorporates PBPK modules for specific particle-bound metals (As, Cd, Cr, Mn and Pb) thus estimates the internal dose of metals in the human body (e.g., kidney, liver). The PBPK module of the ExDoM2, that takes into account the blood flow distribution to various organs, varies according to the physical exertion level of the exposed individual. The accumulation of particle-bound metals in the human tissues depends strongly on the tissue/blood partition coefficient and blood flow. Therefore, it was found that As is primarily accumulated in the lungs and muscles while Pb in bones and blood. Likewise, Cr was accumulated in the lung and GI-tract while Mn was accumulated in the other tissues and lung region. Finally, Cd was accumulated in lungs and intestines but after 35 days from initial uptake the accumulation was located mainly in other tissues, kidney and liver. The results presented here can provide an important scientific basis for the study of human health effects arising from exposure to particles and particle-bound metals.

Author Contributions

E.C. implemented the ExDoM2 and prepared the manuscript; S.E.C. assisted in the preparation/writing of the manuscript; E.M.-G. implemented the ExDoM2; S.M.A. analyzed the input data for Lisbon and provided important suggestions for the final manuscript; K.E., M.I.G. and E.D. conceived the experiments and analyzed the input data for Athens and M.L. supervised the preparation of the paper.

Funding

This work was supported by the European Union’s LIFE Programme in the framework of the Index-Air LIFE15 ENV/PT/000674 project.

Conflicts of Interest

The authors declare no conflict of interest.

References

  1. Alvarez, F.F.; Rodriguez, M.T.; Espinosa, A.J.F.; Daban, A.G. Physical speciation of arsenic, mercury, lead, cadmium and nickel in inhalable atmospheric particles. Anal. Chim. Acta 2004, 524, 33–40. [Google Scholar] [CrossRef]
  2. Pope, C.A.; Burnett, R.T.; Thun, M.J.; Calle, E.; Krewski, D.; Ito, K.; Thurston, G.D. Lung cancer, cardiopulmonary mortality, and long-term exposure to fine particulate air pollution. J. Am. Med. Assoc. 2002, 287, 1132–1141. [Google Scholar] [CrossRef]
  3. Samet, J.M.; Dominici, F.; Curriero, F.C.; Coursac, I.; Zeger, S.L. Fine particulate air pollution and mortality in 20 U.S. Cities, 1987–1994. N. Engl. J. Med. 2000, 343, 1742–1749. [Google Scholar] [CrossRef] [PubMed]
  4. Wang, G.; Gu, S.; Chen, J.; Wu, X.; Yu, J. Assessment of health and economic effects by PM2.5 pollution in Beijing: A combined exposure–response and computable general equilibrium analysis. Environ. Technol. 2016, 37, 3131–3138. [Google Scholar] [CrossRef] [PubMed]
  5. WHO. Ambient (Outdoor) Air Quality and Health. 2016. Available online: http://www.who.int/mediacentre/factsheets/fs313/en/ (accessed on 3 June 2018).
  6. US EPA. Air Quality Criteria for Particulate Matter. EPA Report No. EPA/600/P-95/001Af; 1996. Available online: https://cfpub.epa.gov/ncea/risk/recordisplay.cfm?deid=2832 (accessed on 3 June 2018).
  7. Kelly, F.J.; Fussell, J.C. Air pollution and public health: Emerging hazards and improved understanding of risk. Environ. Geochem. Health 2015, 37, 631–649. [Google Scholar] [CrossRef] [PubMed]
  8. Dockery, D.W.; Pope, C.A.; Xu, X.; Spengler, J.D.; Ware, J.H.; Fay, M.E.; Ferris, B.G.; Speizer, F.A. An association between air pollution and mortality in six U.S. cities. N. Engl. J. Med. 1993, 329, 1753–1759. [Google Scholar] [CrossRef] [PubMed]
  9. Dockery, D.W.; Pope, C.A. Acute respiratory effects of particulate air-pollution. Annu. Rev. Public Health 1994, 15, 107–132. [Google Scholar] [CrossRef] [PubMed]
  10. Dominici, F.; Peng, R.D.; Bell, M.L.; Pham, L.; McDermott, A.; Zeger, S.L.; Samet, J.M. Fine particulate air pollution and hospital admission for cardiovascular and respiratory diseases. JAMA 2006, 295, 1127–1134. [Google Scholar] [CrossRef] [PubMed]
  11. Pope, C.A. Respiratory hospital admission associated with PM10 pollution in Utah, Salt Lake, and Cache Valleys. Arch. Environ. Health 1991, 46, 90–97. [Google Scholar] [CrossRef] [PubMed]
  12. Pope, C.A.; Bates, D.V.; Raizenne, M.E. Health effects of particulate air pollution: Time for reassessment? Environ. Health Perspect. 1995, 103, 472–480. [Google Scholar] [CrossRef] [PubMed]
  13. Pope, C.A., III; Dockery, D.W. Health effects of fine particulate air pollution: Lines that connect. J. Air Waste Manag. Assoc. 2006, 56, 709–742. [Google Scholar] [CrossRef] [PubMed]
  14. Adar, S.D.; Filigrana, P.A.; Clements, N.; Peel, J.L. Ambient Coarse Particulate Matter and Human Health: A Systematic Review and Meta-Analysis. Curr. Environ. Health Rep. 2014, 1, 258–274. [Google Scholar] [CrossRef] [PubMed] [Green Version]
  15. Buonanno, G.; Stabile, L.; Morawska, L. Personal exposure to ultrafine particles: The influence of time-activity patterns. Sci. Total Environ. 2014, 468–469, 903–907. [Google Scholar] [CrossRef] [PubMed]
  16. Bell, M.L.; Ebisu, K.; Peng, R.D.; Walker, J.; Samet, J.M.; Zeger, S.L.; Dominici, F. Seasonal and regional short-term effects of fine particles on hospital admissions in 202 US Counties, 1999–2005. Am. J. Epidemiol. 2008, 168, 1301–1310. [Google Scholar] [CrossRef] [PubMed]
  17. Kroll, A.; Gietl, J.K.; Wiesmüller, G.A.; Günsel, A.; Wohlleben, W.; Schnekenburger, J.; Klemm, O. In vitro toxicology of ambient particulate matter: Correlation of cellular effects with particle size and components. Environ. Toxicol. 2013, 28, 76–78. [Google Scholar] [CrossRef] [PubMed]
  18. Kloog, I.; Ridgway, B.; Koutrakis, P.; Coull, B.A.; Schwartz, J.D. Long- and short-term exposure to PM2.5 and mortality: Using novel exposure models. Epidemiology 2013, 24, 555–561. [Google Scholar] [CrossRef] [PubMed]
  19. Samek, L. Overal human mortality and morbidity due to exposure to air pollution. IJOMEH 2016, 29, 417–426. [Google Scholar] [CrossRef] [PubMed]
  20. Xing, Y.F.; Xu, Y.H.; Shi, M.H.; Lian, Y.X. The impact of PM2.5 on the human respiratory system. J. Thorac. Dis. 2016, 8, 69–74. [Google Scholar]
  21. IARC. Outdoor Air Pollution a Leading Environmental Cause of Cancer Deaths. 2013. Available online: https://www.iarc.fr/en/media-centre/iarcnews/pdf/pr221_E.pdf (accessed on 3 June 2018).
  22. IARC. Outdoor Air Pollution. In IARC Monographs on the Evaluation of Carcinogenic Risks to Humans; IARC: Lyon, France, 2016; Volume 109, Available online: http://monographs.iarc.fr/ENG/Monographs/vol109/index.php (accessed 3 June 2018).
  23. Behera, S.N.; Betha, R.; Huang, X.; Balasubramanian, R. Characterization and estimation of human airway deposition of size-resolved particulate-bound trace elements during a recent haze episode in Southeast Asia. Environ. Sci. Pollut. Res. 2015, 22, 4265–4280. [Google Scholar] [CrossRef] [PubMed]
  24. Costa, X.; Dreher, X. Bioavailable transition metals in particulate matter mediate cardiopulmonary injury in healthy and compromised animal models. Environ. Health Perspect. 1997, 105, 1053–1060. [Google Scholar] [CrossRef] [PubMed]
  25. Molinelli, A.R.; Madden, M.C.; McGee, J.K.; Stonehuerner, J.G.; Ghio, A.J. Effect of metal removal on the toxicity of airborne particulate matter from the Utah valley. Inhal. Toxicol. 2002, 14, 1069–1086. [Google Scholar] [CrossRef] [PubMed]
  26. Jaishankar, M.; Tseten, T.; Anbalagan, N.; Mathew, B.B.; Beeregowda, K.N. Toxicity, mechanism and health effects of some heavy metals. Interdiscip. Toxicol. 2014, 7, 60–72. [Google Scholar] [CrossRef] [PubMed] [Green Version]
  27. Vaio, P.D.; Magli, E.; Caliendo, G.; Corvino, A.; Fiorino, F.; Frecentese, F.; Saccone, I.; Santagada, V.; Severino, B.; Onorati, G.; et al. Heavy Metals Size Distribution in PM10 and Environmental-Sanitary Risk Analysisin Acerra (Italy). Atmosphere 2018, 9, 58. [Google Scholar] [CrossRef]
  28. Ruzer, L.S.; Harley, N.H. Aerosols Handbook: Measurement, Dosimetry and Health Effects, 2nd ed.; CRC Press, Taylor and Francis Group: Boca Raton, FL, USA, 2013; p. 666. ISBN 9781439855102. [Google Scholar]
  29. ATSDR. Toxicological Profile for Lead; Agency for Toxic Substance and Disease Registry, Division of Toxicology and Environmental Medicine/Applied Toxicology Branch: Atlanta, Georgia, 2007. Available online: https://www.atsdr.cdc.gov/toxprofiles/tp13.pdf (accessed on 3 June 2018).
  30. Flora, G.; Gupta, D.; Tiwari, A. Toxicity of lead: A review with recent updates. Interdiscip. Toxicol. 2012, 5, 47–58. [Google Scholar] [CrossRef] [PubMed]
  31. European Commission. Ambient Air Pollution by As, Cd and Ni Compounds-Position Paper; Office for Official Publications of the European Communities: Luxembourg, 2001; Available online: http://ec.europa.eu/environment/air/pdf/pp_as_cd_ni.pdf (accessed on 3 June 2018).
  32. IPCS. Cadmium. In Environmental Health Criteria 134; WHO: Geneva, Switzerland, 1992; Available online: http://www.inchem.org/documents/ehc/ehc/ehc134.htm (accessed on 3 June 2018).
  33. WHO. Air Quality Guidelines for Europe, 2nd ed.; WHO Regional Publications, Regional Office for Europe: Copenhagen, Denmark, 2000; Available online: http://www.euro.who.int/__data/assets/pdf_file/0005/74732/E71922.pdf (accessed on 13 June 2018).
  34. ATSDR. Toxicological Profile for Manganese; Agency for Toxic Substance and Disease Registry, Division of Toxicology and Environmental Medicine/Applied Toxicology Branch: Atlanta, Georgia, 2012. Available online: https://www.atsdr.cdc.gov/toxprofiles/tp151.pdf (accessed on 3 June 2018).
  35. Bi, X.; Sheng, G.; Peng, P.; Chen, Y.; Fu, J. Size distribution of n-alkanes and polycyclic aromatic hydrocarbons (PAHs) in urban and rural atmospheres of Guangzhou, China. Atmos. Environ. 2005, 39, 477–487. [Google Scholar] [CrossRef]
  36. Hussain, M.; Madl, P.; Khan, A. Lung deposition predictions of airborne particles and the emergence of contemporary diseases Part-I. Health 2011, 2, 51–59. [Google Scholar]
  37. Oberdorster, G. Effects and Fate of Inhaled Ultrafine Particles. In Nanotechnologyand the Environment; ACS Symposium Series, Chapter 7; American Chemical Society Publications: Washington, DC, USA, 2004; Volume 890, pp. 37–59. [Google Scholar]
  38. Zwozdziak, A.; Gini, M.I.; Samek, L.; Rogula-Kozlowska, W.; Sowka, I.; Eleftheriadis, K. Implications of the aerosol size distribution modal structure of trace and major elements on human exposure, inhaled dose and relevance to the PM2.5 and PM10 metrics in a European pollution hotspot urban area. J. Aerosol Sci. 2017, 103, 38–52. [Google Scholar] [CrossRef]
  39. Chan, Y.C.; Vowles, P.D.; McTainsh, G.H.; Sompson, R.W.; Cohen, D.D.; Bailey, G.M.; McOrist, G.D. Characterization and source identification of PM10 aerosol samples collected with a high volume cascade impactor in Brisbane (Australia). Sci. Total Environ. 2000, 262, 5–19. [Google Scholar] [CrossRef]
  40. Griffin, D.W.; Garrison, V.H.; Herman, J.R.; Shinn, E.A. African desert dust in the Caribbean atmosphere: Microbiology and public health. Aerobiologia 2001, 17, 203–213. [Google Scholar] [CrossRef]
  41. Harrison, R.M.; Yin, J. Particulate matter in the atmosphere: Which particle properties are important for its effects on health? Sci. Total Environ. 2000, 249, 85–101. [Google Scholar] [CrossRef]
  42. Hetland, R.B.; Cassee, F.R.; Refsnes, M.; Schwarze, P.E.; Lag, M.; Boere, A.J.F.; Dybing, E. Release of inflammatory cytokines, cell toxicity and apoptosis in epithelial lung cells after exposure to ambient air particles of different size fractions. Toxicol. Vitr. 2004, 18, 203–212. [Google Scholar] [CrossRef]
  43. Hinds, W.C. Aerosol Technology: Properties, Behavior and Measurement of Airborne Particles, 2nd ed.; John Wiley & Sons Inc.: Hoboken, NJ, USA, 1999; p. 504. ISBN 978-0-471-19410-1. [Google Scholar]
  44. Kim, K.H.; Kabir, E.; Kabir, S. A review on the human health impact of airborne particulate matter. Environ. Int. 2015, 74, 136–143. [Google Scholar] [CrossRef] [PubMed]
  45. Koehler, K.A.; Volckens, J. Development of a Sampler to Estimate Regional Deposition of Aerosol in the Human Respiratory Tract. Ann. Occup. Hyg. 2013, 57, 1138–1147. [Google Scholar] [PubMed] [Green Version]
  46. Aleksandropoulou, V.; Lazaridis, M. Development and application of a model (ExDoM) for calculating the respiratory tract dose and retention of particles under variable exposure conditions. Air Qual. Atmos. Health 2013, 6, 13–26. [Google Scholar] [CrossRef]
  47. Chalvatzaki, E.; Lazaridism, M. Development and application of a dosimetry model (ExDoM2) for calculating internal dose of specific particle bound metals in the human body. Inhal. Toxicol. 2015, 27, 308–320. [Google Scholar] [CrossRef] [PubMed]
  48. ICRP. Human Respiratory Tract Model for Radiological Protection. ICRP Publication 66. Ann. ICRP 1994, 24. Available online: http://www.icrp.org/publication.asp?id=icrp%20publication%2066 (accessed on 3 June 2018).
  49. ICRP. Occupational Intakes of Radionuclides: Part 1. ICRP Publication 130. Ann. ICRP 2015, 44. Available online: http://www.icrp.org/publication.asp?id=ICRP%20Publication%20130 (accessed on 3 June 2018).
  50. Mitsakou, C.; Helmis, C.; Housiadas, C. Eulerianmodeling of lung deposition with sectional representation of aerosol dynamics. J. Aerosol Sci. 2005, 36, 75–94. [Google Scholar] [CrossRef]
  51. RIVM. Multiple Path Particle Dosimetry Model (MPPD v 1.0): A Model for Human and Rat Airway Particle Dosimetry; RIVA Report 650010030; RIVM: Bilthoven, The Netherlands, 2002.
  52. Salma, I.; Balashazy, I.; Winkler-Heil, R.; Hofmann, W.; Zaray, G. Effect of particle mass size distribution on the deposition of aerosols in the human respiratory tract. J. Aerosol Sci. 2002, 33, 119–132. [Google Scholar] [CrossRef]
  53. Manousakas, M.; Diapouli, E.; Papaefthymiou, H.; Kantarelou, V.; Zarkadas, C.; Kalogridis, A.C.; Karydas, A.G.; Eleftheriadis, K. XRF characterization and source apportionment of PM10 samples collected in a coastal city. X-Ray Spectrom. 2017, 47, 190–200. [Google Scholar] [CrossRef]
  54. Sippula, O.; Rintala, H.; Happo, M. Characterization of chemical and microbial species from size-segregated indoor and outdoor particulate samples. Aerosol Air Qual. Res. 2013, 13, 1212–1230. [Google Scholar] [CrossRef]
  55. Almeida, S.M.; Pio, C.A.; Freitas, M.C.; Reis, M.A.; Trancoso, M.A. Approaching PM2.5 and PM2.5–10 source apportionment by mass balance analysis, principal component analysis and particle size distribution. Sci. Total Environ. 2006, 368, 663–674. [Google Scholar] [CrossRef] [PubMed]
  56. Almeida, S.M.; Freitas, M.C.; Reis, M.; Pinheiro, T.; Felix, P.M.; Pio, C.A. Fifteen years of nuclear techniques application to suspended particulate matter studies. J. Radioanal. Nucl. Chem. 2013, 297, 347–356. [Google Scholar] [CrossRef]
  57. ICRP. Dose Coefficients for Intake of Radionuclides by Workers. ICRP Publication 68. Ann. ICRP 1994, 24. Available online: http://www.icrp.org/publication.asp?id=ICRP%20Publication%2068 (accessed on 3 June 2018).
  58. ICRP. Occupational Intakes of Radionuclides: Part 3. ICRP Publication 137. Ann. ICRP 2017, 46. Available online: http://www.icrp.org/publication.asp?id=ICRP%20Publication%20137 (accessed on 3 June 2018).
  59. Chou, W.C.; Chio, C.O.; Liao, C.M. Assessing airborne PM-bound arsenic exposure risk in semiconductor manufacturing facilities. J. Hazard. Mater. 2009, 167, 976–986. [Google Scholar] [CrossRef] [PubMed]
  60. Liao, C.M.; Lin, T.L.; Chen, S.C. A Weibull-PBPK model for assessing risk of arsenic related children skin lesions. Sci. Total Environ. 2008, 392, 203–217. [Google Scholar] [CrossRef] [PubMed]
  61. Chen, B.C.; Chou, W.C.; Chen, W.Y.; Liao, C.M. Assessing the cancer risk associated with arsenic-contaminated seafood. J. Hazard. Mater. 2010, 181, 161–169. [Google Scholar] [CrossRef] [PubMed]
  62. Liao, C.M.; Shen, H.H.; Chen, C.L.; Hsu, L.I.; Lin, T.L.; Chen, S.C.; Chen, C.J. Risk assessment of arsenic-induced internal cancer at long-term low dose exposure. J. Hazard. Mater. 2009, 165, 652–663. [Google Scholar] [CrossRef] [PubMed]
  63. Plowman, S.A.; Smith, D.L. Exercise Physiology for Health, Fitness and Performance, 3rd ed.; Baltimore: Lippincott Williams & Wilkins: Philadelphia, PA, USA, 2011; p. 750. ISBN 978-0-7817-7976-0. [Google Scholar]
  64. ICRP. Basic Anatomical and Physiological Data for Use in Radiological Protection: Reference Values. ICRP Publication 89. Ann. ICRP 2003, 32. Available online: http://www.icrp.org/publication.asp?id=icrp%20publication%2089 (accessed on 3 June 2018).
  65. Lenz, T.L. Pharmacokinetic drug interactions with physical activity. Pharmacy review. Am. J. Lifestyle Med. 2010, 4, 226–229. [Google Scholar] [CrossRef]
  66. O’Flaherty, E.J.; Kerger, B.D.; Hays, S.M.; Paustenbach, D.J. A physiologically based model for the ingestion of chromium (III) and Chromium (VI) by humans. Toxicol. Sci. 2001, 60, 196–213. [Google Scholar] [CrossRef] [PubMed]
  67. Pitz, M.; Cyrys, J.; Karg, E.; Wiedensohler, A.; Wichmann, H.E.; Heinrich, J. Variability of Apparent Particle Density of an Urban Aerosol. Environ. Sci. Technol. 2003, 37, 4336–4342. [Google Scholar] [CrossRef] [PubMed]
  68. DeCarlo, P.F.; Slowik, J.G.; Worsnop, D.R.; Davidovits, P.; Jimenez, J.L. Particle morphology and density characterization by combined mobility and aerodynamic diameter measurements. Part 1: Theory. Aerosol Sci. Technol. 2004, 38, 1185–1205. [Google Scholar] [CrossRef]
  69. Geller, M.; Biswas, S.; Sioutas, C. Determination of Particle Effective Density in Urban Environments with a Differential Mobility Analyzer and Aerosol Particle Mass Analyzer. Aerosol Sci. Technol. 2006, 40, 709–723. [Google Scholar] [CrossRef] [Green Version]
  70. Malloy, Q.G.J.; Nakao, S.; Qi, L.; Austin, R.; Stothers, C.; Hagino, H.; Cocker, D.R., III. Real-time aerosol density determination utilizing a modified scanning mobility particle size aerosol particle mass analyzer system. Aerosol Sci. Technol. 2009, 43, 673–678. [Google Scholar] [CrossRef]
  71. Morawska, L.; Salthammer, T. Indoor Environment: Airborne Particles and Settled Dust; Wiley-VCH: Weinheim, Germany, 2003; p. 450. [Google Scholar]
  72. Aleksandropoulou, V. Development of an Integrated Decision Support Tool for Estimation of Human Exposure to Airborne Particulate Matter and their Effect in Human Health. Ph.D. Thesis, Technical University of Crete, Chania, Greece, 2010. (In Greek). Available online: http://dias.library.tuc.gr/view/16655 (accessed on 3 June 2018).
  73. Lazaridis, M.; Aleksandropoulou, V.; Smolík, J.; Hansen, J.E.; Glytsos, T.; Kalogerakis, N.; Dahlin, E. Physico-chemical characterization of indoor/ outdoor particulate matter in two residential houses in Oslo, Norway: Measurements overview and physical properties—URBAN-AEROSOL Project. Indoor Air 2006, 16, 282–295. [Google Scholar] [CrossRef] [PubMed]
  74. Zereini, F.; Alt, F.; Messerschmidt, J.; Wiseman, C.; Feldmann, I.; von Bohlen, A.; Müller, J.; Liebl, K.; Püttmann, W. Concentration and distribution of heavy metals in urban airborne particulate matter in Frankfurt am Main, Germany. Environ. Sci. Technol. 2005, 39, 2983–2989. [Google Scholar] [CrossRef] [PubMed]
  75. Rogula-Kozłowska, W.; Kozielska, B.; Klejnowski, K. Hazardous compounds in urban PM in the central part of upper Silesia (Poland) in Winter. Arch. Environ. Prot. 2013, 39, 53–65. [Google Scholar] [CrossRef]
  76. Widziewicz, K.; Rogula-kozlowska, W. Urban environment as a factor modulating metals deposition in the respiratory track and associated cancer risk. Atmos. Pollut. Res. 2017. [Google Scholar] [CrossRef]
  77. Canepari, S.; Perrino, C.; Olivieri, F.; Astolfi, M.L. Characterisation of the traffic sources of PM through size-segregated sampling, sequential leaching and ICP analysis. Atmos. Environ. 2008, 42, 8161–8175. [Google Scholar] [CrossRef]
  78. Eleftheriadis, K.; Oschenkuhn, K.; Lymperopoulou, T.; Karanasiou, A.; Razos, P.; Ochsenkuhn-Petropoulou, M. Influence of local andregional sources on the observed spatial and temporal variability of, size resolved atmospheric aerosol mass concentrations and water-solublespecies in the Athens metropolitan area. Atmos. Environ. 2014, 97, 252–261. [Google Scholar] [CrossRef]
  79. Grigoratos, T.; Martini, G. Brake wear particle emissions: A review. Environ. Sci. Pollut. Res. Int. 2015, 22, 2491–2504. [Google Scholar] [CrossRef] [PubMed] [Green Version]
  80. Wahlin, P.; Berkowicz, R.; Palmgren, F. Characterisation of traffic-generated particulate matter in Copenhagen. Atmos Environ. 2006, 40, 2151–2159. [Google Scholar] [CrossRef]
  81. Garg, B.D.; Cadle, S.H.; Mulawa, P.A. Brake wear particulate matter emissions. Environ. Sci. Technol. 2000, 34, 4463–4469. [Google Scholar] [CrossRef]
  82. Iijima, A.; Sato, K.; Yano, K.; Kato, M.; Tago, H.; Kato, M.; Kimura, H.; Furuta, N. Particle size and composition distribution analysis of automotive brake abrasion dusts for the evaluation of antimony sources of airborne particulate matter. Atmos. Environ. 2007, 4, 4908–4919. [Google Scholar] [CrossRef]
  83. Davis, E.B. Trends in Environmental Research; Nova Science Publishers, Inc.: New York, NY, USA, 2006; ISBN 1-59454-485-9. [Google Scholar]
  84. Chalvatzaki, E.; Aleksandropoulou, V.; Glytsos, T.; Lazaridis, M. The effect of the dust emissions from open storage piles to particle ambient concentration and human exposure. Waste Manag. 2012, 32, 2456–2468. [Google Scholar] [CrossRef] [PubMed]
  85. Chalvatzaki, E.; Kopanakis, I.; Lazaridis, M. Size distribution and metal composition of airborne particles in a waste management facility. J. Mater. Cycles Waste Manag. 2017, 20, 323–335. [Google Scholar] [CrossRef]
  86. Voutilainen, A.; Kaipio, J.P.; Pekkanen, J.; Timonen, K.L.; Ruuskanen, J. Theoretical analysis of the influence of aerosol size distribution and physical activity on particle deposition pattern in human lungs. J. Work Environ. Health 2004, 30, 73–79. [Google Scholar]
  87. Ferguson, M.D.; Migliaccio, C.; Ward, T. Comparison of how ambient PMc and PM2.5 influence the inflammatory potential. Inhal. Toxicol. 2013, 25, 766–773. [Google Scholar] [CrossRef] [PubMed]
  88. Becker, S.; Mundandhara, S.; Devlin, R.B.; Madden, M. Regulation of cytokine production in human alveolar macrophages and airway epithelial cells in response to ambient air pollution particles: Further mechanistic studies. Toxicol. Appl. Pharmacol. 2005, 207, 269–275. [Google Scholar] [CrossRef] [PubMed]
  89. Hayes, A.W. Principles and Methods of Toxicology, 5th ed.; Informa Healthcare: New York, NY, USA, 2007; p. 748. ISBN 9781420005424. [Google Scholar]
  90. Kelly, J.T.; Avise, J.; Cai, C.; Kaduwela, A.P. Simulating particle size distributions over California and impactor on lung deposition fraction. Aerosol Sci. Technol. 2011, 45, 148–162. [Google Scholar] [CrossRef]
  91. Alexandropoulou, V.; Mitsakou, C.; Housiadas, C.; Lazaridis, M. Particulate Matter exposure and dose relationships derived from realistic exposure scenarios. Indoor Built Environ. 2008, 17, 237–246. [Google Scholar] [CrossRef]
  92. Neuberger, M.; Schimekc, M.G.; Horak, F., Jr.; Moshammerb, H.; Kundib, M.; Frischerd, T.; Gomisceka, B.; Puxbauma, H.; Hauck, H.; AUPHEP-Team. Acute effects of particulate matter on respiratory diseases, symptoms and functions: Epidemiological results of the Austrian Project on Health Effects of Particulate Matter (AUPHEP). Atmos. Environ. 2004, 38, 3971–3981. [Google Scholar] [CrossRef]
  93. Qiu, H.; Yu, I.T.; Tian, L.; Wang, X.; Tse, L.A.; Tam, W.; Wong, T.W. Effects of coarse particulate matter on emergency hospital admissions for respiratory diseases: A time-series analysis in Hong Kong. Environ. Health Perspect. 2012, 120, 572–576. [Google Scholar] [CrossRef] [PubMed] [Green Version]
  94. WHO. Health Aspects of Air Pollution with Particulate Matter, Ozone and Nitrogen Dioxide. In Report on a WHO Working Group; WHO: Bonn, Germany, 2003; Available online: http://www.euro.who.int/__data/assets/pdf_file/0005/112199/E79097.pdf (accessed on 3 June 2018).
  95. Daniels, M.J.; Dominici, F.; Samet, J.M.; Zeger, S.L. Estimating particulate matter-mortality dose-response curves and threshold levels: An analysis of daily time-series for the 20 largest US cities. Am. J. Epidemiol. 2000, 152, 397–406. [Google Scholar] [CrossRef] [PubMed]
  96. Bennett, W.D.; Zeman, K.L.; Kim, C. Variability of fine particle deposition in healthy adults: Effect of age and gender. Am. J. Respir. Crit. Care Med. 1996, 153, 1641–1647. [Google Scholar] [CrossRef] [PubMed]
  97. Oravisjärvi, K.; Pietikäinen, M.; Ruuskanen, J.; Rautio, A.; Voutilainen, A.; Keiski, R.L. Effects of Physical Activity on the Deposition of Traffic-Related Particles into the Human Lungs in Silico. Sci. Total Environ. 2011, 409, 4511–4518. [Google Scholar] [CrossRef] [PubMed]
  98. Kjellstrom, T.; Nordberg, G.F. A kinetic model of cadmium metabolism in the human being. Environ. Res. 1978, 16, 248–269. [Google Scholar] [CrossRef]
  99. Mammi-Galani, E.; Chalvatzaki, E.; Lazaridis, M. Personal exposure and dose of inhaled ambient particulate matter bound metals in five European cities. Aerosol Air Qual. Res. 2016, 16, 1452–1463. [Google Scholar] [CrossRef]
  100. Saha, J.C.; Dikshit, A.K.; Bandyopadhyay, M.; Saha, K.C. A review of arsenic poisoning and its effects on human health. Crit. Rev. Environ. Sci. Technol. 1999, 29, 281–313. [Google Scholar] [CrossRef]
  101. Falk, H.; Caldwell, G.G.; Ishak, K.G.; Thomas, L.B.; Popper, H. Arsenic-Related Hepatic Angiosarcoma. Am. J. Ind. Med. 1981, 2, 43–50. [Google Scholar] [CrossRef] [PubMed]
  102. ATSDR. Medical Management Guidelines for Arsenic Trioxide; Agency for Toxic Substances and Disease Registry: Atlanta, GA, USA, 2014. Available online: https://www.atsdr.cdc.gov/MMG/MMG.asp?id=1200&tid=279 (accessed on 3 June 2018).
  103. WHO. Manganese and Its Compounds. Concise International Chemical Assessment Document 12. 1999. Available online: http://whqlibdoc.who.int/publications/1999/924153012X.pdf (accessed on 3 June 2018).
  104. O’Flaherty, E.J. Physiologically based models for bone seeking elements: IV Kinetics of lead disposition in humans. Toxicol. Appl. Pharmacol. 1993, 118, 16–29. [Google Scholar] [CrossRef] [PubMed]
  105. Sharma, M.; Maheshwari, M.; Morisawa, S. Dietary and inhalation intake of lead and estimation of blood lead levels in adults and children in Kanpur, India. Risk Anal. 2005, 25, 1573–1588. [Google Scholar] [CrossRef] [PubMed]
  106. IPCS. Inorganic Lead. World Health Organization, International Programme on Chemical Safety. Environmental Health Criteria 165. Geneva. 1995. Available online: http://www.inchem.org/documents/ehc/ehc/ehc165.htm (accessed on 3 June 2018).
  107. Rabinowitz, M.B. Toxicokinetics of bone lead. Environ. Health Perspect. 1991, 91, 33–37. [Google Scholar] [CrossRef] [PubMed]
  108. WHO. Lead Poisoning and Health. 2016. Available online: http://www.who.int/mediacentre/factsheets/fs379/en/ (accessed on 3 June 2018).
  109. Sasso, A.F.; Isukapalli, S.S.; Georgopoulos, P.G. A generalized physiologically-based toxicokinetic modelling system for chemical mixtures containing metals. Theor. Biol. Med. Modell. 2010, 7, 1–17. [Google Scholar] [CrossRef] [PubMed]
  110. WHO. Cadmium and Cadmium Compounds. World Health Organization, International Agency for Research on Cancer. 2007. Available online: http://www.inchem.org/documents/iarc/vol58/mono58-2.html (accessed on 3 June 2018).
Figure 1. Size distribution of mass percentage for (a) particulate matter, (b) arsenic, (c) chromium, (d) lead, (e) cadmium and (f) manganese for the three European cities [54,55,56]. The size distribution data of Athens are unpublished.
Atmosphere 09 00248 g001
Figure 2. Cumulative deposited dose (μg) of particulate matter in the (a) respiratory tract, (b) ET (ET1+ET2) region and (c) lung (BB+bb+AI) region for an adult male in the three under study cities. (I) represents indoors and (O) outdoors.
Atmosphere 09 00248 g002
Figure 3. Cumulative dose (μg) of inhaled particulate matter in the (a) respiratory tract (retained dose), (b) Oesophagus and (c) blood for an adult male in the three cities. (I) represents indoors and (O) outdoors.
Atmosphere 09 00248 g003
Figure 4. Correlation between exposure concentration (μg/m3) and deposited dose rate (μg/h). The red lines represent linear regression between the variables.
Atmosphere 09 00248 g004
Figure 5. Total and regional cumulative deposited particle dose (μg) in the human respiratory tract for different characteristics of the exposed subject. The results were obtained using Lisbon data.
Atmosphere 09 00248 g005
Figure 6. Internal dose (μg) of metals (a) As, (b) Cr (c) Mn and (d) Pb at different tissues in the human body estimated for an adult male at the end of one day.
Atmosphere 09 00248 g006
Figure 7. Internal dose (μg) of Cd at different tissues in the human body for an adult male in Kuopio after one day exposure. Also shown the internal dose for one day exposure but after 35 days from initial intake.
Atmosphere 09 00248 g007
Table 1. Cardiac output ( C O ) and b l o o d   f l o w i distribution during rest and light exercise [63,64,65].
Sleep/RestLight Activity
Cardiac output (L/h)390632
blood   flow i (%CO)
Skin512.5
Kidney198.6
GI tract198.4
Liver6.5 (hepatic artery) + 19 (portal vein)2.9 (hepatic artery) + 8.4 (portal vein)
Muscle1740
Heart44
Brain127.4
Fat512.5
Bronchial tissues2.52.5
Bone1.50.9
Other tissues 100 b l o o d   f l o w 100 b l o o d   f l o w
Table 2. Daily activity profile used in ExDoM2.
ActivityTimeEnvironment
Sleep12 p.m.–7 a.m.Indoors
Light exercise7 a.m.–8 a.m.Indoors
Work (light exercise)8 a.m.–4 p.m.Outdoors
Sitting awake (rest)4 p.m.–6 p.m.Indoors
Light exercise6 p.m.–9 p.m.Indoors
Sitting awake (rest)9 p.m.–12 p.m.Indoors
Table 3. Ambient PMx concentration (μg/m3) and concentration of particle-bound metals (ng/m3) measured in each city [54,55,56].
CityPMxAsCdCrMnPb
Athens (PM6.8)202.9-2.415.06.0
Kuopio (PM10)100.20.10.34.21.6
Lisbon (PM8)370.5-23.8--
Table 4. Cumulative deposited dose (10−2 μg) of particle-bound metals in the respiratory tract for an adult male at the end of one day exposure.
CityAsPbCrMn
Athens3.54.12.518
Kuopio0.171.50.55.7
Lisbon0.42-25-

