Abstract
Climatic conditions and the solar and circulation features in the Lake Baikal basin are analyzed. The relationship between the heat balance and surface temperature of slopes is shown, taking into account each features’ physical state. The dependence of the heat balance values and the underlying surface temperature were revealed. The quantitative material allowed us to reveal regional patterns of geomorphological regimes, seasonal rhythm, and the dynamics of processes. In Cisbaikalia, within the denudation cycle, semi-humid states under water erosion and aeolian processes of moderate intensity predominate. The semi-arid state manifests itself under decreasing humidification. In these years, the probability of extreme manifestations of aeolian processes is high. The humid states occur in 1% of cases, primarily in extremely wet years, when fluvial processes are dramatically activated. In Cisbaikalia, climate warming and an increase in mean annual temperature have been observed in recent years. Depending on the moisture amplitude and heat availability, the intensity and direction of water erosion and aeolian processes is changing now. The dynamics of relief-forming processes cause an increase in loose substance in the lake and the exacerbation of the ecological situation.
1. Introduction
Climate is one of the most important factors for relief formation. Geomorphological systems coincide with climatic and water systems [1,2]. The relationship between climate and relief is diverse [3]. Climate considerably determines weathering processes, denudation features, and the structure and intensity of existing exogenous processes. In addition, climate controls bedrock weathering and lithostreams along the slopes. The main indicators of climate are as follows: seasonal thermal distribution, precipitation, and wind regime. Given the trends, it is of great interest to analyze the development of geomorphological systems under climate change [4]. The increased research on this issue is reflected in the prevention and prediction of dangerous and catastrophic natural (climatic and geomorphological) situations. This issue has been discussed at the 9th International Conference on Geomorphology in New Delhi [5]. In the last few years, we have witnessed a trend towards climate warming and aridization within the Lake Baikal basin, which resulted in a related triggered denudation mechanism involving fluvial and aeolian processes [6]. The present work analyzes the climatic features of the south of the Lake Baikal basin, and identifies the interrelations between climate and relief-forming processes.
2. Methods
The unique natural features of the Baikal region are formed under the influence of the mountain–basin effect and atmospheric processes. The walls of the basin are formed by a combination of contrasting landscapes, according to the natural conditions—the East Siberian goletz, light coniferous taiga, dark coniferous South Siberian taiga, and Central Asian steppes. There are intrazonal patches of marsh, meadow, and river channel geosystems here. The proximity of different types of natural landscapes determines their close interaction and interpenetration.
The study of climatic and geomorphological systems at the regional level was carried out by stationary and route methods on the southwestern coast of Baikal (reference field stations at the mouth of the Goloustnaya and Sarma rivers and Olkhon island) since 2000 (Figure 1).
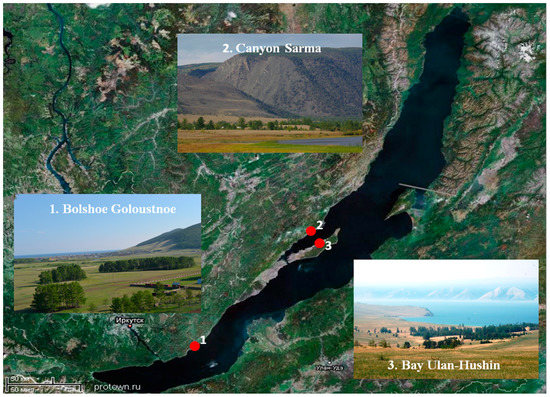
Figure 1.
Location of the field stations at Lake Baikal. (1) Bolshoe Goloustnoe; (2) Sarma; (3) Ulan-Khushin.
Long-term observations of exogenous relief formation have allowed us to establish regional regularities of geomorphological regimes, seasonal rhythm, and dynamics of processes, and to reveal several trends. In this process we used various methods and instruments.
The field experimental studies were part of complex physical and geographical works, carried out according to a unified methodology at the field stations of the V.B. Sochava Institute of Geography SB RAS by several generations of researchers, under the leadership of Professor L.N. Ivanovskii [7]. The monitoring of slope runoff and flushing on the steppe slopes was carried out using metal frames (surveyor’s arrows) (Figure 2a). They were installed to cover the main slope elements of different exposures. The arrows, 30 cm high, rose above the ground by 15 cm. The tops of the arrows were leveled. The height reduction marked the accumulation of fine earth, and the raising meant indicated ablation. The use of surveyor’s arrows made it possible to reveal the general direction of redistribution of matter on the surface of slopes, as well as the order of ablation and accumulation magnitude. The monitoring of aeolian processes (deflation, transit of matter, and aeolian accumulation) were conducted year-round, using dust collectors installed on different relief forms. The most commonly used dust collectors had the following construction: a metal square box (56 × 56 cm), with the height of 10 cm; the walls had limited bumpers on three sides, 4 cm wide, covered with slots, and cut parallel to their edges to avoid the wind removal of fine earth from the dust collector. The monitoring was conducted throughout the year; the fine earth brought here was removed from the boxes every month, weighed, and analyzed. To determine the saturation of the wind flow with dust, we used a deflameter, which consisted of a body, flywheels, and five intake cylinders, rotating under the influence of wind changes (Figure 2b). The material accumulated in the intake cylinders was extracted from them at the end of each season. We carried out parallel calculations and the estimation of dust storms, including their duration, energy flows, climatic deflation index, change by months, etc. Snow and phytoscopy allowed for expanding research areas. The spatial studies of the dynamics of aeolian processes were carried out by sampling aeolian material from snow and flushing dust from the grass stand. Snow sampling was carried out according to a system of key sites and routes, taking into account the sources of atmospheric pollution and the wind streamline. The samples of snow were collected in early March, with the VS-43 snow gauge at the full depth of the snow cover to define height and density. Analytical work for determination the content of solid matter (dust) and its chemical composition was carried out in laboratories of the V.B. Sochava Institute of Geography SB RAS, using standard methods on modern equipment. The methods worked out at the Siberian field stations are widely used now in other parts of Russia [8]. These methods of field experiments are constantly being improved. To determine the nature and activity of the movement of substance on the slopes in the Baikal region (the Goloustnenskii site), the following experiment has been carried out since 2006. On the steep steppe slope of the southern exposition, sites 0.5 × 0.5 m were chosen, from the surface of which the detrital material is removed annually. According to the amount of newly appeared detritus, we can judge the intensity of the surface transformation. During route studies, the observations of natural processes were carried out through a landscape profile, using motor vehicles [9]. For measurements on the routes, we used relatively simple portable devices. The observations were often carried out according to a shortened program, but the area of the research increased significantly.
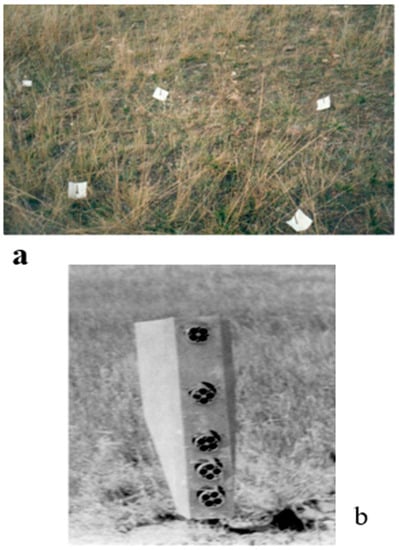
Figure 2.
Instruments for studying the substances on slopes: (a) pins (pieces of white paper are put on for shooting), and (b) soil deflation measuring device.
For determining the weathering rate dependences, we estimated thermal stability of slopes with calculation methods, assessing the redistribution nature of incoming solar radiation (direct and total) to different surfaces, such as slopes of different exposures and steepness, slopes covered with vegetation or bare, slopes that were either forested and treeless, and slopes that accumulated snow in the cold season or those that were snowless. Taking into account that the slopes of the area do not exceed 60°, we chose for calculation the slopes that were a multiple of 10° and oriented along eight bearings, both the main and intermediate ones. The calculations were made for the entering of direct solar radiation. The following formulas were used:
where Sv is the direct solar radiation entering the vertical surface, Ssl is the direct solar radiation entering the inclined surface, S is the direct solar radiation entering the surface perpendicular to the rays, S′ is the direct solar radiation entering the horizontal surface, h is the height of the sun, A is the sun’s azimuth, A is the azimuth of the normal to the vertical surface, and α is the steepness of slopes (angle that the inclined surface makes with the horizontal plane) [10]. Sv, the direct solar radiation for vertical surfaces oriented along intermediate bearings of southwest (SW) and northeast (NE), was calculated by the formula [11]:
Sv = S Cos h Cos (A − A);
Ssl = Sv Sin α + S′ Cos α,
S SW, NE = ±0.707 S (Cos h Sin A − Cos h Cos A)
S for the northwest (NW) and southeast (SE) was calculated as:
S NW, SE = ±0.707 S (Cos h Sin A + Cos h Cos A)
The height of the sun above the horizon was calculated using the well-known formula:
where: φ is the latitude of the site and δ is the declination of the sun (tabular value).
h = 90° − φ ± δ,
The entering of solar radiation onto the horizontal surface was registered at the actinometric station Khuzhir, the closest to the latitude and located within the Lake Baikal basin. When calculating heat fluxes, taking into account the general and local air circulation, we recognized that the values at mean cloudiness were close to the true values.
3. General Climate Regularities of the Southwestern Cisbaikalia
The southern part of Lake Baikal is located at an altitude of 456 m above sea level. The Primorskii Range extends along the southwestern basin side, with absolute peak altitudes of 700–1500 m.
The ridges of the eastern coast (1300–2370 m) are separated from the coast by gently sloping coastal plains. The climate of the Baikal coast is formed under the direct influence of the basin processes. The circulation features and thermal conditions are determined not only by the entering of solar radiation, but also by the large mass of lake water and by the relief of coastal slopes.
The mean long-term values of air temperature (the weather station Bolshoe Goloustnoe) are as follows: −1.1 °C annually, −14.2 °C in January, and 18.2 °C in August [12]. Monthly changes in temperature and precipitation are presented in the following climatogramme (Figure 3).
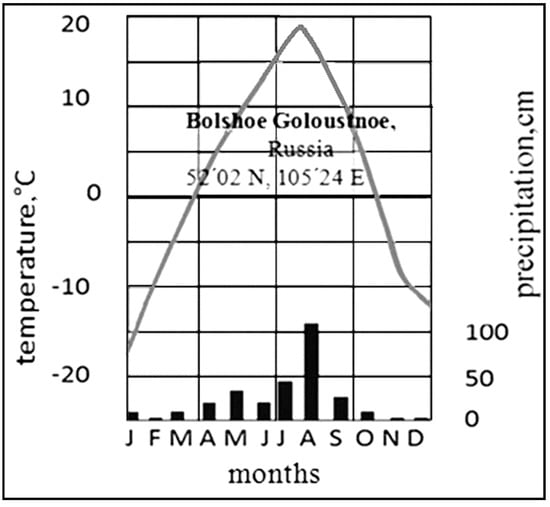
Figure 3.
Mean monthly temperature and precipitation for a representative location of the marine climate in the Southern Cisbaikalia.
The air above the lake surface is 6–8° colder in summer and 5°–15° warmer in late autumn and early winter than the surrounding land. The annual amplitude of air temperature over the lake (30°–38°) is much lower than outside the basin (41°–50°) [13]. In summer, far from the shores in the centre of the lake, the air temperature decreases, then increases in autumn and early winter. The minimum temperature of the open part of Lake Baikal is 4°–6° for most of the year. This leads to temperature inversions in summer, late spring, and early autumn, and to low air humidity.
The intra-annual distribution of soil surface temperature in the southern part of the Baikal depression includes three periods. One has positive temperatures, the maximum duration of which is 97 days but in certain years can be reduced by 15–20 days, because negative night temperatures of the soil surface can be quite often observed in early June and late August. The duration of the period with negative temperatures is about 200 days, but can reach 230 days. This period is divided into two parts: before the lake freezes at the end of January, less often in early February, and after the freeze-up.
The duration of the periods with the temperature transition through 0° averages about 45 days in autumn and 32 days in spring, with the mean daily temperature of the soil surface being either positive or negative; the amplitude of the temperature fluctuation can reach 15 °C–20 °C. This period is of great interest, since the soil surface experiences the greatest thermal loads, cooling to negative temperatures at night, and heating up to positive values during the day.
The highest temperature on the soil surface is observed in July, when the mean value is 20°. That is 6° above the mean air temperature. By noon, the temperature of the soil surface rises up to 30°–35°, and on certain clear days even higher. On such hot days, the soil temperature can be 15°–25° above the air temperature.
At night, the temperature is low, and can decrease 10° or more in relation to the daytime. Summer amplitude of temperature fluctuation can reach 40°.
In the first half of June and the last decade of August, there is a high probability of soil freezing, especially during the invasion of cold cyclones from the northwest.
Within the lake basin, the maximum temperatures and maximum values of the temperature fluctuation amplitude always remain lower than those at the same latitudes outside the basin, as a result of the softening effect of cold water mass of the lake in summer.
Before the freeze-up of the lake, the heating effect of water mass raises the daily mean soil temperature by about 3° compared to the outside temperature of the basin. After the freeze-up, this difference is 1° (probably cooling inertia). The mean long-term value of the soil surface temperature in winter is −19°, and the minimum is −34°.
Since the area of the Goloustnenskaya alluvial plain lies in the wind shadow of the northeastern transfer of air masses, the total amount of precipitation here is inconsiderable, and the long-term mean value is only 264 mm, with the maximal fall during the period from April to October: 250 mm (95%). In winter this amount is only 14 mm. Liquid, solid, and mixed precipitation are distributed as follows: most falls in liquid form (219 mm), with solid and mixed falling almost equally at 23 and 22 mm, respectively.
The snowpack usually appears on 17 October and is reliable by 2 December. The melting begins prevalently on 3 March, and the final loss is on 24 April. However, in some years the snow cover may appear as early as 26 September, and may sometimes remain until 20 May. The number of days with snow cover averages 107, but can increase under certain circulating conditions to 190 [14].
Changes in seasonal and perennial climatic factors and conditions manifest themselves in the dynamics of the relief formation, as well as in abnormal situations and in the relief reorganization.
The morphogenetic effect of long-term, low-contrast processes is recorded in the sections of slope and valley fill, which are difficult to identify due to multiple overlaps and convergence of the final effect of different processes. Very often, the final morphogenetic effect of typical processes is obscured by the lithomorphic nature of the relief.
4. Results
The climatic processes in the study area are characterized by an intensity that varies within usual limits and is caused by biometeoenergetics within the seasonal and long-term rhythm of the region’s landscapes. The magnitude of the impact of these processes is determined by the energy level. The solar radiation in the southern part of the Baikal basin is the highest in the whole of Eastern Siberia.
This is connected to the high transparency of the atmosphere within the lake basin, and to the distribution of the pressure field, which contributes to the formation of downward air currents that prevent cloud formation.
Thus, in the heat balance of the territory, a great importance is given to the entering of direct solar radiation, which is of predominant importance. The scattered radiation with high transparency of the atmosphere can be considered isotropic and, in the first approximation, is the same for all types of surfaces, regardless of orientation and incline.
The results of the calculations are given in Table 1.

Table 1.
Daily amounts of direct solar radiation (MJ/m2) for the slopes of different steepness and exposure at the field station in Bolshoe Goloustnoye, at the mean values of cloudiness (calculated values).
The annual values of direct solar radiation were calculated using the same technology (Table 2).
Table 2.
The annual sums of direct solar radiation (MJ/m²) for the slopes of different steepness and exposure at the field station in Bolshoe Goloustnoe at the mean values of cloudiness (calculated values).
The calculation was carried out for the mean daily sums of direct solar radiation for the middle of the season. Therefore, the average months of each season were selected: January, April, July, and October. The maximum height of the sun above the horizon for the indicated months, referring to the 15th day in July at true noon for the settlement Bolshoe Goloustnoe, is 59°30′, and the minimum is 16°32′ in January. Consequently, an increase in the incline of the slope under consideration to 30° and its orientation toward the sun in summer significantly increases the heating of the surface. In addition, in summer months, the eastern and southeastern slopes have an advantage with regards to the entering of direct radiation, in comparison with the western and southwestern slopes. The greatest amount of radiation is received by the southeastern slopes from May to August, especially if they are steep. The remaining slopes follow in decreasing order: southwestern, eastern, western, and the southern.
Considering the day length (about 8 h in winter and 11 h in summer), as well as the azimuth of sunrise and sunset, it can be said that the actual time for the beginning and end of irradiation with solar radiation of the southern slopes coincides with sunrise and sunset. In summer, the period of the beginning and the end of irradiation of the southern surfaces coincides with the end of irradiation of the northern surfaces, and vice versa. The time of the beginning of irradiation of the eastern slopes coincides with the sunrise, and the end of irradiation is observed at 12 h of the true solar time. The time of the end of irradiation of the western surfaces coincides with sunset, and the beginning of irradiation occurs at 12 h of true solar time.
To solve problems of the heat supply for slopes, it is not enough to only estimate the direct solar radiation, since along with the direct radiation the scattered solar radiation (D) enters the surfaces under consideration. On separate days with dense clouds, the scattered solar radiation may exceed the direct one. However, there are few such days on Lake Baikal.
In our case, with high transparency of the atmosphere and little cloudiness, especially in summer, as well as the absence of powerful sources (both natural and artificial) contributing to the turbidity of the atmosphere, the scattered radiation is usually lower in magnitude than the direct. Assuming that scattered radiation propagates in space isotropically, and is not represented by specific directions, we can say that its propagation in all directions is the same and does not depend on the orientation. Thus, the daily values of the total solar radiation (Q) can be expressed by the values given in Table 3.
Table 3.
Daily sums of total solar radiation (MJ/m2) for the slopes of different steepness and exposure at the field station in Bolshoe Goloustnoe, at the mean values of cloudiness (calculated values).
The annual values of the total solar radiation are presented in Table 4.
Table 4.
Annual sums of total solar radiation (MJ/m2) for the slopes of different steepness and exposure at the field station in Bolshoe Goloustnoe at the mean values of cloudiness (calculated values).
Given that not all incoming solar radiation is going to heat the underlying surface, the afterheat was calculated, i.e., the amount of heat that remains after the reflection of the incoming radiation. The reflecting ability of the surfaces most often encountered in Bolshoe Goloustnoe, which have different physical properties, fluctuates from 12% to 90%. The following physical surfaces were chosen:
- -
- surfaces with green motley grass, whose reflectivity is 17%;
- -
- surfaces covered with snow (dry freshly fallen snow, caked dry snow, porous wet gray snow)-- the reflectivity of such surfaces is, respectively, 85–90%, 60%, and 40–45%;
- -
- surfaces with gray-brown withered grass, with a reflectivity of 19%;
- -
- stony surfaces—reflectivity of 12–14%.
Using the data of the given tables, we can calculate the afterheat for different slope surfaces.
In autumn and winter, the incoming heat from the sun is insufficient to maintain the positive temperature of the active surface, due to the ever-increasing night cooling. When the residual heat reaches 3.5 MJ/m2 in autumn, the daily radiation balance becomes negative. The negative temperatures accumulate and soil freezes. In spring, with the increasing sunshine duration, the radiation balance tends to 0, and then shifts to positive values. However, if in autumn 3.5 MJ/m2 were enough for the radiation balance to shift from positive to negative values, then in spring 9.6 MJ/m2 are necessary for the transition from negative values to positive residual heat. This discrepancy can be explained by the additional arrival of heat from the water mass, heated during the summer period, which gives heat to the surrounding area throughout the autumn up to freeze-up, increasing the thermal background.
Using the calculated soil surface temperatures at the station Bolshoe Goloustnoye, we obtained a dependence of numerical characteristics of the heat balance values and underlying surface temperature. This has enabled us to determine the heating degree of various slopes (Figure 4).
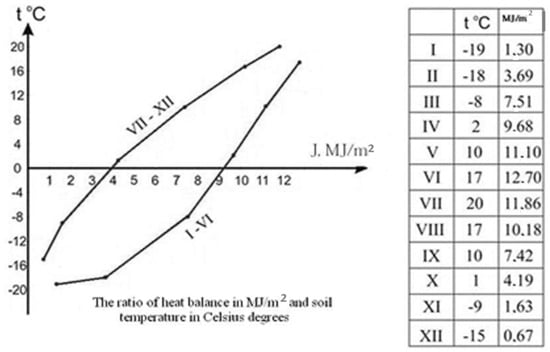
Figure 4.
The ratio of heat balance in MJ/m2 and soil temperature, in Celsius degrees.
The proposed model can be used to calculate the intensity of exogenous processes, not only in the southern part of the Baikal basin, but also in the territory located in the latitudinal zone indicated or close to it.
The calculated materials show that the rocks in the Baikal region are actively destroyed under the influence of a sharp change in the insolation regime. In the arid areas with clear air, the surface of the rocks can have the extreme diurnal temperature range (over 50°) and high day values (over 70°) [15]. In the settlement Bolshoe Goloustnoe, the extreme air temperature difference can reach 36° (November), and the extreme soil temperature difference can be as high as 55° (May). The mean weathering speed is as follows: granites—0.11 cm/year, gneiss—0.6, crystalline shales—0.6–1.9, and plagiogneiss—1.9 cm/year [16]. As a result, the surface of the steppe slopes, especially those of the southern exposure, is overlapped by detrital material of different sizes, dominated by fragments of 1–10 mm. The fine earth, serving as filler, is subsequently blown out and washed away, and an erosion pavement is formed. Therefore, the system of exogenous processes reshaping the geomorphological surfaces is multifactorial. The main processes forming the lithostreams on slopes are gravitational, Aeolian, and water erosional.
The wind regime within the Baikal region is complex. There are 50 to 150 stormy days a year. This includes about 20 cases of hurricane winds, when the wind speed reaches 40 m/s. In the delta of the Goloustnaya River, the number of days in a year with a strong wind is on the average 52, with the mean annual wind speed of 5.6 m/s. In the annual regime of wind loads, three seasonal peaks are revealed: winter (December–January), spring (April–May), and early autumn (September). The winds of the northwestern, north-northwestern, and northern directions, known locally as “Gornaya” (mountainous), are especially strong. “Gornaya” are characterized by exceptional gustiness; they always blow across the lake, and in comparison with other Baikal winds have the longest duration—from August to December. According to T.T. Taisayev, because of “Sarma”, the same desiccating mountain wind, those dry stony steppes have a hollow-ridge relief, with basins of blowing and sulphate lakes along the western coast of Baikal [17]. In the valley of the Bugul’deika River, the northwestern wind with destructive power can blow for up to four days straight. It brings dust and alluvium, sweeping people to the ground. When the “Bugul’deika” wind is blowing, the cattle is not driven to the pasture.
All accidents on Lake Baikal took place during the winds of the northwestern quarter. For example, the sinking of a research vessel, in the area of Cape Krasnyi Yar, occurred on the morning of 2 August 1983, a kilometer from the shore and in front of numerous eyewitnesses. Against the background of a strong “Gornaya” wind on the water, with the simultaneous action of longitudinal winds, an extreme whirlwind rarely observed on the Baikal formed, which turned the ship that was unstable in high waves. For some time the ship kept floating, with its keel upwards, making circular motions until it sank. So the researchers pay now special attention to the analysis of the origin and forecast of these winds [18]. Dust storms are also associated with the strong winds. In the area of the village of Bolshoe Goloustnoye, 1–4 dust storms are recorded annually. In some years, if the snow cover was small and there were foci of deflation (according to the materials from long-term snow surveys of 15% of the delta plain of the Goloustnaya region), dust storms and dust drifts were observed even in winter (in November and December). Weak winds are typical for the late winter period (February) and summer (July–August). In July and August, the easterly winds (B, NE) with a weak eroding ability dominate in Southern Cisbaikalia. The local Baikal anticyclones are formed over Baikal during this period. From May to August, when the temperature contrast of the land and the lake is great, favorable conditions are created for the development of breeze circulation [19]. The breeze flows on the Baikal are intensified by mountain–valley winds blowing upwards in the daytime, and at night down the slopes of mountains, the feet of which are close to the shore of the lake or 2–4 km from the water’s edge. In summer, the capacity of the night breeze on the lake is less than in daytime. In the afternoon, the flows originating from the lake and blowing to the shore predominate, but at night they flow from the land to the lake. Sometimes, at night, westerly winds occur as a result of the passage of frontal systems. Thus, for about a third of a year, strong winds are blowing, connected to global transport and local circulation.
The active influence of wind currents on coastal geosystems in the basin of Lake Baikal led to the formation of aeolian facies [20,21,22]. If deflation surfaces prevail on the western shore of the Southern and Middle Baikal, on the opposite site, the west coast of Olkhon Island and the eastern shore of Lake Baikal, there are extensive fields of quaternary aeolian sands. These are located in the bays. The largest of them are Saraiskaya and Nyurganskaya Guba. For instance, the volume of modern aeolian deposits on the coast of Nyurganskaya Guba, as calculated by B.P. Agafonov, reaches 3 million m3 [23].
The sand stratum is represented by whitish, light gray sands. They are constantly dispersed by storm winds, and transferred from the lowered parts of the bays to the interior of the island. These sands are devoid of stratification; in addition, they are massive and possess oligomictic quartz–feldspar composition. Their power varies, from the first centimeters near the coastal zone to the first tens of meters on the aeolian shaft, which outlines the sand fields.
The transfer of sand strata promotes the formation of signs of ripples, blowing basins, deflationary remains on the surface, etc. The speed at which the flank of aeolian sands moves is from a few centimeters to 6–8 m per year.
During an aeolian event (dust storm), the wind flow behaves selectively: deflation dominates in some areas, and accumulation in others. The aeolian stream consists of dust and sand. Pelitic (less than 10 μm) and aleuritic (less than 20 μm) particles predominate. Larger sand particles are moved by saltation in the surface part of the stream. During the wind transfer, the material is sorted according to the size, shape, and specific gravity of the particles. Large and heavy particles remain on the loose sediments, armoring the surface and protecting it from further dispersal. The aluminosilicate substance containing the main rock-forming elements (Si, Al, Fe, Ca, etc.) dominates the mineral composition. The material of dust storms is enriched with phosphorus, nickel, cobalt, etc. [24]. As a result, there is a change in the micro-relief of the earth’s surface. If wind blows from water to land, then loose material moves up to the slope of the Primorskii Range [25]. Active dust accumulation is observed on leaves and grass. For example, the reserves of green phytomass in the middle of July in 2008, in the polygon transect, varied from 35 g/m2 (wormwood–thyme petrophytic facies) to 155 g/m2 (mixed grass–cereal facies). The dust accumulation on plants during the growing season was 1.5 to 2.0 g/m2. The intensity of removal of fine earth from experimental sites varied from 1 mm/year to 5 mm/year. With the direction of the wind towards Baikal, the smallest particles are carried away and settle on the water surface. An experiment conducted in the area of the Akademicheskii Range showed that suspended solids in the snow of aeolian winter transfer of 45% consist of particles from the rocks of the western coast [26]. The aeolian transfer is one of the sources of pollutants entering Baikal [27,28]. Along the valleys of the rivers Angara, Anga, Goloustnaya, and Bugul’deika, the polluting impurities from the industrial areas of the Upper Angara are carried out continuously into Baikal. In 2000, up to 130,000 tons of solid impurities entered the atmosphere above the Baikal water from the Irkutsk-Cheremkhovo industrial complex [29].
Atmospheric pollution was recorded near the coastal settlements of Listvyanka, Kultuk, Baikal’sk, and Slyudyanka, as well as in the estuary part of the river valleys where they flow into Baikal, and within the steppe slopes of the coast. In 2010, the mean snow pH varied from 5.0 (forest facies) to 6.4 (steppe facies). Mineralization of thawed water reached 0.87 mg/L. The chloride content in the meltwater was 2.59 to 5.25 mg/L; the sodium ranged from 0.23 to 2.68, the potassium from 0.2 to 2.1, the calcium from 1.19 to 10.84, and the magnesium from 0.21 to 1.52 mg/L. In 2015, there was a slight increase in the content of some heavy metals, with a slight decrease in the concentration of calcium, magnesium, and potassium. In the coastal zone of Priolkhonye, there was an increased content of chemical elements in the snow, which is associated not only with anthropogenic load, but also with a terrigenous dust of rocks and soils transported from steppe slopes by strong winds to the Baikal water area. The maximum concentration coefficients of chemical elements in the snow cover of the Middle Hollow of Lake Baikal, with respect to the background, have the following values: F is 2.1, SO4 is 4.4, NO3 is 9, K is 7, Na is 3.8, Mn is 6.8, Ba is 2.3, and Al is 3.5 (Table 5).
Table 5.
The content of chemical elements and substances, as well as the pH value in snow water of the Baikal water area.
There are several pollutants also entering the lake during summer showers and floods. The suspension brought by the rivers during floods spreads locally in the rivers’ mouth areas. It should be noted that these processes occasionally affect the lake locally, and cause water turbidity in some areas for a short time. The ecosystem of Lake Baikal has time to self-clean the main part of the alien anthropogenic pollutants. However, in several areas (the coastal part of the Middle and Southern Baikal), the inflow of dissolved substances has a negative impact on water quality and biota. In general, though, the geochemical studies of different authors have shown a relatively satisfactory current state of the environment for the central ecological zone of the Baikal Natural Territory.
Along the aeolian processes, the appearance of lithostreams on the sites is facilitated by water erosion [30]. Due to the fact that the southwest coast is in the shadow of the Primorskii Range, a small amount of precipitation falls here. Only during heavy rains are temporary watercourses formed, which leads to the formation of swamps and swashes. Over the summer, about five cases of erosion-hazardous showers, with precipitation of 10 mm each and an intensity of more than 0.1 mm/min, are observed in the study area. Usually, once per summer, there is a shower with precipitation exceeding 20 mm and a mean intensity of 0.1–0.5 mm/min. The most erosion-threatening are heavy rainfalls with a sum of precipitation of more than 30 mm and an intensity of more than 1 mm/min, but they are rare.
For instance, in 2014 and 2015 there were no showers, and only one rainfall in June in 2012, with 12.9 mm of precipitation and a maximum intensity of 0.38 mm/min. In July, there were three showers, with 11–14 mm of precipitation per rainfall. The maximum intensity was 0.62 mm/min, when 11.4 mm of precipitation fell for 1 h. The total duration of the rainfall in 2012 was 20 h. In 2013, intensive precipitation was observed only in July (twice), with a maximum precipitation amount of 23.6 mm and a maximum intensity of 0.10 mm/min. The duration of rainfall this year was 14 h 47 min. Thus, given this precipitation amount, the water flows are small and continue briefly, the storm runoff does little work, and the fine-earth particles are transported for a small distance. On the surface of the soil, debris appears, with a depth of several mm to the first cm.
In general, the surface of the slopes of the Baikal basin is in a state of mobile equilibrium. An experiment involving the removal the detrital material from experimental sites showed that during the following year, until the following June, as a result of exogenous processes, the slopes’ surface was covered with colluvia again (Figure 5).
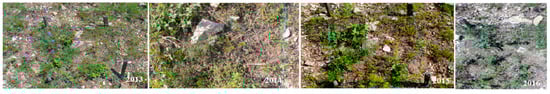
Figure 5.
Dynamics of detrital material on the surface of the experimental field (middle part of the slope of southern exposition). Observation years were 2013, 2014, 2015, and 2016.
Analysis of detrital material showed that considering the quantitative composition, small fragments predominate on the sites (Table 6). The largest fragments were removed in the first year of the experiment, e.g., 11 pieces 51–100 mm in size. In subsequent years, those fragments appeared singly. The debris up to 10–20 mm with fine earth is the basis of surface lithostream. The clastic material with a size greater than 50 mm consisted of limestone with siliceous veins of thin-layered texture. In the fraction from 20 to 50 mm, along with the limestone there were carbonate sandstone, siltstone, and marl. The land waste was represented mainly by fragments of limestone, sandstone, and siltstone carbonate, with an admixture of pebbles of granite, quartz, granite gneiss, and effusive. The intensity of movement of the loose substance is moderate. In wet years, the activity of water erosion and its contribution to lateral flows of matter increases. As a result, the year of 2008 on the southwestern coast of Baikal was not only the wettest (324 mm of precipitation), but also had the highest deflation load. Analysis of the filling of the surface on experimental sites with debris material showed that in this year, the maximum of debris occurrence was noted, i.e., 5–7 times more than in normal years of humidification. The substance on the slopes moves locally in portions on individual vectors. The events that occur at a moderate frequency have the highest value for erosion rate.
Table 6.
The size and amount of detrital material collected from the site on the slope of the Podkamennaya Mountain near the settlement of Bolshoe Goloustnoe.
The activation of matter within the delta plain is facilitated by an increase in the anthropogenic load. The steppe plots are used for the grazing of cattle and sheep in the warm season, and year-round for horses. In addition, there are numerous country roads along the plain.
The resulting dust-like fine earth is quickly swept away by the wind, and the soil surface is compacted again. Thus, the delta plain of the Goloustnaya river is a deflationary surface at the regional level. In the landscape, at the topological level, an insignificant change in the intensity of aeolian processes is observed, depending on the micro- and nanoforms of the relief.
5. Discussion
The coupled analysis of climatic features of the southwestern Cisbaikalia and exomorphogenesis showed that exogenous, relief-forming processes are closely related to processes similar in dynamism in the air and water systems. Within the nival belt, extreme temperature conditions cause intense physical weathering, which is accompanied by the sedimentation of rock blocks, collapses, solifluction, talus, wind-drift, etc. On sub-horizontal surfaces, as they accumulate sand and rotted rocks, the weathering products are completely carried away by the wind, and the denudation velocity reaches 2 mm/year [31]. Above the forested slopes, where the dynamism of air masses, precipitation, and water flow are sharply weakened by vegetation, such exogenous processes as erosion in river beds, creep, deflation, and landslides are expressed. They subside on the accumulative trains of mountain slopes; individual floods and mudflows pass through them in transit. In the Baikal steppe, with a rare low grass stand, intensive wind drift and flushing carry down solid matter up to 5.5 kg/year through the slopes, with a steepness of 44°. Thus, in the Baikal basin, the zone of the prevailing ablation is changing in the forest and steppe by zones of transit and ablation of various intensity, and is then turning into the transit-accumulative foothill zone, and finally some substances are being transferred to the lake; the other remains for a long time.
Natural processes on mountain slopes are closely linked to the lake basin. It is the conjugate development of these natural processes that determines their dynamics and development features. Besides, the natural processes take place in unstable tectonic conditions. High seismicity affects the intensity of processes, which can have a catastrophic manifestation locally and momentary [32]. The active functioning of various natural processes is observed in the coastal zone. Intensive lithostreams contribute to the introduction of solid matter into the Baikal region. In recent years, intensive overgrowth of the bottom has been observed in many areas of Lake Baikal, and even some serious structural changes in phytobenthos, i.e., particular replacement of dominant species, including endemics, with green filamentous algae previously not recorded in the lake. Across the perimeter of the lake, at depths of 0 to1 m, an increase in the biomass of native algal species was observed [33]. A significant proportion of the macrophytobenthos composition in Lake Baikal is now made up of representatives of the spirogyra genus (Spirogyra Link). The result of this development is the rotting masses of algae that accumulate on the shore during the entire period of open water.
The spectrum of exogenous relief processes in the Baikal region is determined by the climatic conditions during observation years. According to climatic features, the years of observation were classified (Table 7). Over the past 20 years, the most frequently repeated years are moderately warm, moderately humid (37%), and dry years with different degrees of heat supply (29%), which are often repeated during the last 20 years. Cold and very dry years were observed once in the last 20 years. Thus, in the Cisbaikalia, semi-humid states predominate within one denudation cycle for the last 20 years. This phase is characterized by the development of water erosion and aeolian processes of moderate intensity. When the humidification decreases (climatic coefficient of erosion less than 10), the semi-arid states manifest themselves actively. In these years, the probability of anomalous and extreme manifestations of aeolian processes is very high. Deflation is observed on emergent landforms (brows and turfed surfaces of convex slopes, vertex areas, non-deserted dunes in the coastal zone, etc.). The erosion ranges from a few millimeters to 1–10 cm or greater [34].
Table 7.
Formation of variable states of geomorphological systems under various combinations of heat and moisture (Bolshoe Goloustnoe).
Humid states occur in 1% of cases. They form in extremely wet years, when the fluvial processes are dramatically activated. It is established that the intensity of rainfall has a greater impact than the total precipitation per year [35]. The wet phases are characterized by a higher frequency of extreme events. Thus, when on 10–11 August 2016 a heavy rain brought 60 to 110 mm of precipitation to the Baikal area, with a maximum intensity over the interval of 0.48–0.65 mm/min, it led to the formation of temporary streams and even mudflows (Figure 6), and consequently to the intensification of erosion-accumulative processes.
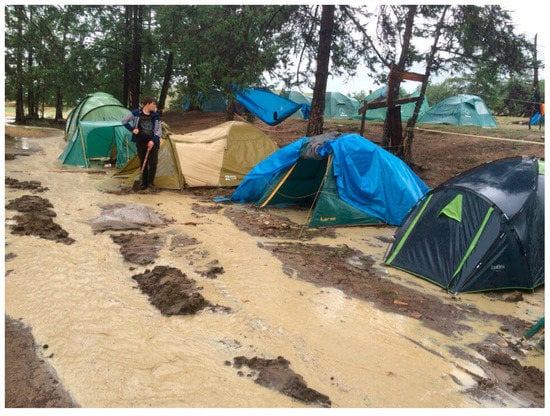
Figure 6.
Rainfall stream in the creek valley (Ulan-Khushin Harbour, Olkhon Island) as of 11 August 2016.
In Cisbaikalia, a trend of climate warming is associated with global temperature increase and an increase in mean annual temperature, at a rate of 0.45 °C over 10 years [36]. The warmest period was in 2015, when the deviation from the mean temperature was 3.5 °C. In Khuzhir (Olkhon Island), on 9 August 2015, the absolute maximum temperature was +30 °C. However, that autumn was extremely severe, especially in October, when temperature at several stations near Lake Baikal was up to −5 °C. In addition, throughout Russia an increase in annual precipitation also prevailed. The trend is 2.1% per 10 years, with a contribution to the dispersion of 31%. In Cisbaikalia, this trend is insignificant (1.2% per 10 years), with a 2% contribution to the dispersion. The calculated climatic coefficient of erosion shows its increase above 10, as well as the resulting water erosion; thus, a decrease below 10 indicates activation of aeolian processes.
6. Conclusions
In the basin of Lake Baikal, a rather peculiar climate is formed. Its features are determined by the significant arrival of solar radiation. The calculation methods were used to determine the heat balance and the afterheat. This allows us to assess the degree of heating on various surfaces. In the warm period there is a heat accumulation. Soil freezing is observed in cold period. Significant temperature changes in the annual regime lead to destabilization of the upper soil horizons and to an increase in the thickness of loose cover.
The regional climate features determine the structure of exogenous processes. The intensity and direction of water erosion and aeolian processes change depending on the amplitude of moisture and heat availability. Water erosion is actively manifested itself in humid phases during arid aeolian processes. The maximum dynamism is characterized by surface sediments with a thickness of 1 to 5 cm. The removal of fine earth by deflation and flushing leads to sanding of soils and debris covering of the surface.
The active relief-forming processes contribute to the introduction of loose substances into the lake and exacerbation of the ecological situation.
Southern Cisbaikalia is a zone of high environmental risk, which is characterized by a high frequency of extreme events. Further studies of the interrelationship between climatic and geomorphological systems will help identify quantitative patterns, and create a set of measures to conserve the favorable environment in the Baikal basin.
Author Contributions
The experiments in the assessment of the variation of solar radiation on different slope surfaces were conceived and designed by Galina Orel. Experiments on mechanics, functions, dynamics and forecast of development of natural processes in the region were conceived, designed and performed by Elizaveta Tyumentseva. Elizaveta Tyumentseva analyzed the entire data, contributed materials and analysis tools, and wrote the paper.
Conflicts of Interest
The authors declare no conflict of interest.
References
- Simonov, Y.G. The main problems of climatic geomorphology. In Problems of Climatic Geomorphology; Pacific Institute of Geography: Vladivostok, Russia, 1978; pp. 6–30. (In Russian) [Google Scholar]
- Ufimtsev, G.F. Mountains of the Earth. Climatic Types and Phenomena of the Newest Orogeny; Nauchnyi Mir: Moscow, Russia, 2008; p. 351. (In Russian) [Google Scholar]
- William, M.M.; Kaufman, M.M. Physical Geography: Great Systems and Global Environments; Cambridge University Press: New York, NY, USA, 2013; pp. 113–171. [Google Scholar]
- Schoonover, J.E.; Crim, J.F. An Introduction to Soil Concepts and the Role of Soils in Watershed Management. J. Contemp. Water Res. Educ. 2015, 154, 21–47. [Google Scholar] [CrossRef]
- Crozier, M. Geomorphology and Society. In Proceedings of the 9th International Conference on Geomorphology, New Delhi, India, 6–11 November 2017. [Google Scholar]
- Bazhenova, O.I.; Tyumentseva, E.M.; Tukhta, S.A. Extreme Phases of Denudation and Issues of Geomorphological Safety of the Upper Angara Region. Geografia Prirodnye Resursy 2016, 3, 118–129. [Google Scholar]
- Ivanovsky, L.N.; Titova, Z.A. Main Results of Modern Exogenous Processes on the Experimental Field of the Institute of Geography of Siberia and the Far East Academy of Sciences of the USSR, Methods of Geomorphological Field Experiments in the Soviet Union; Nauka: Moscow, Russia, 1986; pp. 136–149. (In Russian) [Google Scholar]
- Evseeva, N.S. Modern Morpholithogenesis in the Southeast Part of West Siberian Plain; NTL: Tomsk, Russia, 2009; p. 484. (In Russian) [Google Scholar]
- Zhuchkova, V.K.; Rakovskaya, E.M. Methods of Complex Physical and Geographical Studies; Publishing Center “Academy”: Moscow, Russia, 2004; p. 368. [Google Scholar]
- Scientific and Applied Handbook on the Climate of the USSR; Irkutsk Region and the Western Part of the Buryat ASSR; Gidrometeoizdat: Leningrad, Russia, 1966; p. 218.
- Pivovarova, Z.I. Characterization of the radiation regime in the territory of the USSR in relation to the requests for construction. In Proceedings of the Voeikov Main Geophysical Observatory; Gidrometeoizdat: Leningrad, Russia, 1973; p. 128. [Google Scholar]
- Scientific and Applied Handbook on the Climate of the USSR; Irkutsk Region and the Western Part of the Buryat ASSR; Gidrometeoizdat: Leningrad, Russia, 1991; p. 603.
- Rusynek, O.T.; Takhteev, V.V.; Gladkochub, D.P.; Khodzher, T.V.; Budnev, N.M.; Bezrukova, E.V.; Galkin, V.V.; Galkina, V.I.; Granina, L.Z.; Goryunova, O.I.; et al. Baikal Studies: In 2 Books; Nauka: Novosibirsk, Russia, 2012; Volume 1, pp. 124–134. [Google Scholar]
- Tyumentseva, E.M. Conditions for the Development of Aeolian Processes in the Baikal region. Bull. Dep. Geogr. VSGAO 2011, 1, 24–33. [Google Scholar]
- Goudie, A.S. Arid and Semi-Arid Geomorphology; Cambridge University Press: New York, NY, USA, 2013; 454p. [Google Scholar]
- Agafonov, B.P. Exolithodynamics of the Baikal Rift Zone; Nauka: Novosibirsk, Russia, 1990; 175p. [Google Scholar]
- Taisaev, T. Aeolian Processes in Priolkhonie and Olkhon Island (Western Transbaikalia). In Doklady of the Academy of Sciences U.S.S.R. Earth Science Sections; 1982; Volume 265, pp. 984–951. [Google Scholar]
- Lut, L.I. Typical Baikal winds and their stability. In Climatic Resources of Lake Baikal and Its Basin; Nauka: Novosibirsk, Russia, 1976; pp. 31–49. [Google Scholar]
- Misandrontseva, K.N. About Breezes on Lake Baikal. In Climate and Climatic Resources of Baikal and Baikal Region; Nauka: Moscow, Russia, 1970; Volume 15, pp. 26–39. [Google Scholar]
- Vika, S.; Ovchinnikov, G.I.; Snytko, V.A.; Shchipek, T. Aeolian Facies of the Eastern Coast of Lake Baikal; Publishing House of the Institute of Geography SB RAS: Irkutsk, Russia, 2002; p. 56. [Google Scholar]
- Vika, S.; Imetkhenov, A.B.; Ovchinnikov, G.I.; Snytko, V.A.; Shchipek, T. Aeolian Processes of the Coasts near the Proval Gulf on Lake Baikal; Publishing House of the Institute of Geography SB RAS: Irkutsk, Russia, 2006; p. 56. [Google Scholar]
- Snytko, V.A.; Shchipek, T. Experience in determining the local directions of winds on the eastern shore of Lake Baikal. Geografia i Prirodnye Resursy 2006, 4, 46–48. [Google Scholar]
- Akulov, N.I.; Agafonov, B.P. The Behavior of Heavy minerals in Lithostream. Geol. Geophys. 2007, 48, 344–349. [Google Scholar] [CrossRef]
- Koroleva, G.P.; Kosov, A.A.; Geleti, V.F.; Vologina, Y.G. Geochemical Characteristics of the Aeolian Material other of the Akademicheskii Range of Lake Baikal and its sources. Geol. Geophys. 2001, 42, 258–266. [Google Scholar]
- Agafonov, B.P. Sandy Aeolian Streams from Baikal; Rossiiskaya Nauka, Oktopus: Moscow, Russia, 2003; pp. 270–276. [Google Scholar]
- Vologina, E.G.; Potemkin, V.L. Characteristics of Aeolian Transport in winter in the Region of the Akademicheskii Range of Lake Baikal. Geol. Geophys. 2001, 42, 254–257. [Google Scholar]
- Khodzher, T.V.; Sorokovikova, L.M. Assessment of incoming solutions from the atmosphere with the river runoff into Lake Baikal. Geografia Prirodnye Resursy 2007, 3, 185–191. [Google Scholar]
- Belozertseva, I.A.; Vorobyeva, I.B.; Vlasova, N.V.; Yanchuk, M.S.; Lopatina, D.N. Chemical composition of snow in the water area of Lake Baikal and on the adjacent territory. Geografia Prirodnye Resursy 2017, 1, 90–99. [Google Scholar] [CrossRef]
- Agafonov, B.P. Ecological and Geographical Zoning of Lake Baikal on Contamination Grade, Izvestiia RAN. Seriia Geograficheskaia 2008, 6, 70–76. [Google Scholar]
- Bazhenova, O.I.; Lyubtsova, E.M.; Ryzhov, Y.V.; Makarov, S.A. Spatio-Temporal Analysis of the Dynamics of Erosion Processes in the South of Eastern Siberia; Nauka, Sib. Predpriyatie RAN: Novosibirsk, Russia, 1997; p. 208. [Google Scholar]
- Agafonov, B.P. System-Structural Basis of Predictive-Exolithodynamic Studies of the Baikal Basin. In Relief and Slope Processes in the South of Siberia; Publishing House of the Institute of Geography SB RAS: Irkutsk, Russia, 1988; pp. 149–156. [Google Scholar]
- Ufimtsev, G.F.; Skovitina, T.M.; Filinov, I.A.; Shchetnikov, A.A. Features of the Relief of Priolkhonie. Geografia Prirodnye Resursy 2010, 4, 56–61. [Google Scholar]
- Timoshkin, O.A.; Samsonov, D.P.; Yamamuro, M.; Moore, M.V.; Belykh, O.I.; Malnik, V.V.; Sakirko, M.V.; Shirokaya, A.A.; Bondarenko, N.A.; Domysheva, V.M.; et al. Rapid Ecological Change in the Coastal Zone of Lake Baikal (East Siberia): Is the site of the world’s greatest freshwater biodiversity in danger? J. Great Lakes Res. 2016, 42, 487–497. [Google Scholar] [CrossRef]
- Vyrkin, V.B. Aeolian Relief Formation in the Baikal and Transbaikalia. Geografia Prirodnye Resursy 2010, 3, 25–32. [Google Scholar]
- Nearing, M.A.; Pruski, F.F.; O’Neal, M.R. Expected Climate Change Impacts on Land Erosion Rates: A review. J. Soil Water Conserv. 2004, 59, 43–50. [Google Scholar]
- A Report on Climate Features on the Territory of the Russian Federation in 2016; ROSHYDROMET: Moscow, Russia, 2017; p. 70.
© 2018 by the authors. Licensee MDPI, Basel, Switzerland. This article is an open access article distributed under the terms and conditions of the Creative Commons Attribution (CC BY) license (http://creativecommons.org/licenses/by/4.0/).