Abstract
In this paper we use 20 Hz wind measurements on three levels (2, 5, and 10 m) to investigate the differences in micro-scale properties of different bora types, i.e., deep and shallow bora with further subdivision to cyclonic and anticyclonic bora cases. Using Fourier spectral analysis, we investigate a suitable turbulence averaging scale and bora gust pulsations. The obtained data set is further used to test the Monin–Obukhov similarity theory, the surface layer stratification, the behavior of the terms in the prognostic turbulence kinetic energy equation, and the wind profiles. One of our main goals is to identify possible micro-scale differences between shallow and deep bora types because of the possible different mountain wave dynamics in those flows. We found that a turbulence averaging scale of 30 min is suitable for this location and is in agreement with previous bora studies. The wind speed power spectral densities of all selected bora episodes showed pulsations with periods of 2–8 min. This suggests that mountain wave breaking was present in all cases, regardless of flow depth and synoptic type. The stability parameter analysis confirmed the near-neutral thermal stratification of bora; a consequence of intensive mechanical mixing. No significant differences related to bora type were observed in other micro-scale parameters.
1. Introduction
Bora is a gusty downslope wind blowing from the northeast in the lee of the Dinaric Alps and other dynamically similar parts of the world []. It is dynamically generated by the interaction of airflow and orography []. Bora macro-scale characteristics have been investigated since the middle of the 20th century []. Early mesoscale research focused on the katabatic model of bora [], which was later shown to be deficient in explaining stronger bora events. A major breakthrough in bora mesoscale research started with the ALPEX (Alpine Experiment) project in 1981 [] and the subsequent findings by Smith [], which showed that bora is essentially a dynamically generated wind, best explained by the hydraulic and wave breaking theory [,]. In recent years, bora’s mesoscale characteristics have been extensively studied during the Mesoscale Alpine Programme (MAP) project [,,]. A recent review of bora mesoscale properties at the northeastern Adriatic can be found in [].
With respect to the synoptic setup, three types of bora have been identified in the past: cyclonic, anticyclonic [], and frontal []. The typical setup for cyclonic bora is when a mid-latitude cyclone moves to the southern Adriatic, pulling colder air from the continent to the eastern Adriatic coast. Anticyclonic bora blows when there is an anticyclone situated over Central Europe, extending over the Dinaric Alps []. Frontal bora is characterized by a sudden increase in wind speed and short duration, following the passage of a cold front [].
Both cyclonic and anticyclonic bora can be either deep or shallow, depending on the depth of synoptic flow over the mountains (e.g., []). For example, a common feature above a mature mid-latitude cyclone is the southwesterly flow in the divergent (eastern) flank of the upper-level trough (i.e., the flow from positive vorticity maximum to negative vorticity maximum at 300 hPa). This is why most cyclonic boras are shallow [,,,]. However, in the case of an occluded cyclone, there is usually a cut-off low in the upper levels, sometimes favorably aligned with the surface cyclone, thus providing deep NE (northeasterly) to N (northerly) flow throughout the troposphere.
Anticyclonic deep bora occurs when a deep positively tilted trough passes and the upper N or NE flow in its western flank is above the southeastern quadrant of a surface anticyclone. Alternatively, the northwestern quadrant of a cut-off low can also provide deep NE flow above the surface anticyclonic bora. Anticyclonic deep bora seems to be the most frequent among deep bora types [] because its synoptic setup is more common than that of cyclonic deep bora. Since strong anticyclones can persist for days, it is not uncommon for this type of bora to last up to a week.
Deep bora is associated with vertically propagating mountain waves [], while shallow bora is associated with wave breaking and violent downslope windstorms []. Shallow bora does not allow significant vertical propagation of wave energy, thus generating strong downslope windstorms in the lee. Vertical wind shear plays a significant role in the vertical propagation of waves in deep bora. In the case of positive wind shear (wind speed increasing with height), wave breaking does not occur at least until tropopause, because of the linearizing effect of the increasing wind speed []. In the case of weak vertical shear or wind speed decrease with height, wave breaking is likely to happen in the lower or middle troposphere, again reflecting mountain wave energy to lower levels and generating violent downslope windstorm.
Regardless of more than a century of intensive research of bora climatology (e.g., [,,]) and bora macro- and mesoscale properties (e.g., [,,,]), some important details about bora micro-scale properties are not yet known. One of them includes detailed characteristics of severe bora episodes. The most severe bora episodes (downslope windstorms), with gusts reaching up to 70 m·s−1, are caused by wave breaking when there is a critical level above the mountaintop []. The critical level is usually marked by strong inversion [] and a decrease in wind speed or change in wind direction by height, thus acting as an efficient reflector of wave energy. The critical level can be imposed by synoptic scale or generated by wave breaking itself—caused by wave amplitude increasing with height [].
Severe bora typically induces shooting flow in the lee of coastal mountains [] that may extend out over the sea in the form of multiple low-level jets behind mountain passes, while lee wakes (weaker flow regions) occur behind mountaintops []. Sea surface SAR (Synthetic Aperture Radar) data analysis by Kuzmić et al. [] revealed the existence of secondary bora jets—caused by smaller mountain and island features (gaps and flanks)—that are only a few kilometers apart and several kilometers long. Moreover, they documented fine-scale convective cells pertaining to cold bora outbreak over relatively warm sea.
Bora pulsations with periods of 3–4 min were first mentioned in the work of Watanabe [], based on the experience of local fishermen. The first confirmation of those observations in the measured data was in the work of Petkovšek [,], who found pulsations with periods between 3 and 11 min. Although the existence of pulsations has been known for a long time, the detailed physics behind the gustiness and pulsations of bora has been addressed only recently. Belušić et al. [] also found that the pulsations occur with periods between 3 and 11 min in the town of Senj, a location well known as a bora maximum site (Figure 1). Furthermore, this was also confirmed by using fine-scale numerical modeling [], and measurements at the Pometeno Brdo (in a free translation, Pometeno Brdo means Swept Away Hill) []—a bora site upwind of the city of Split (Figure 1) that is about 200 km southeast from Senj. The former study found that the generation of gust pulsations was associated with mountain wave breaking and Kelvin-Helmholtz shear instability (KHI) above the bora shooting flow. This mechanism was first demonstrated by Peltier and Scinocca [] for mountain windstorms in Boulder, CO, USA. Measurements and numerical modeling studies [,,] also showed that the pulsations disappear in the presence of positive vertical wind shear above the mountaintop (e.g., the presence of an upper-tropospheric jet stream).
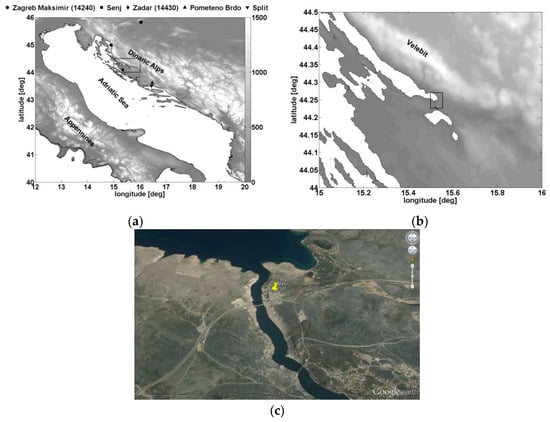
Figure 1.
(a) The Adriatic coast with locations of previous bora studies marked (Senj and Pometeno Brdo near the city of Split). The Zadar and Zagreb Maksimir sounding stations are also marked. The box represents the area of this study. (b) shows the zoomed in view of that area, while (c) shows the zoomed in view of the measurement site at the Maslenica Bridge (shown as the box in b). The Velebit Mountain is mostly north of the site.
Micro-scale characteristics of severe turbulence in the wave breaking region are the focal point of current bora research. In order to improve turbulence parameterization schemes in numerical models, Večenaj et al. [] evaluated turbulence kinetic energy (TKE) and its dissipation rate for a bora event in the town of Senj. Večenaj et al. [] estimated the turbulence dissipation rate along the Adriatic sea coast, using 4 Hz aircraft and dropsonde data obtained during the MAP project. For the Pometeno Brdo site, Lepri et al. [] analyzed bora wind speed profiles from 5 Hz data and found that they agreed with commonly used empirical power-law and the logarithmic-law profiles. They also found that thermal stratification of the surface layer is near neutral due to strong mechanical mixing. Using the same data, Lepri et al. [,] further investigated turbulence intensity, Reynolds shear stress and turbulence length scale profiles for the mentioned location.
Without such high-frequency in situ measurements of wind speed in space (e.g., aircraft measurements) and in time (single-point ground-based measurements on, e.g., meteorological towers/masts), the exploration of bora micro-scale properties would not be possible. For a more comprehensive insight into the nature of bora turbulence, even higher sampling frequency (e.g., >10 Hz) measurements are needed. This also hints at the goal of this study.
Bora has a major influence on all forms of transportation, engineering structures, electrical and telecommunication grids, agriculture, sea dynamics, air pollution, tourism, and firefighting. Engineering structures in areas prone to severe downslope windstorms must be strong enough to withstand these hurricane force winds. Agriculture in those areas must also be adapted to such harsh conditions. Transportation is the most vulnerable human activity, since severe bora episodes can completely shut down all road traffic to and from the coast. In some extreme cases, even the air traffic at the whole eastern Adriatic coast can be completely suspended.
The Maslenica Bridge is a very important transportation route, connecting the southern and central Croatian coast—the northeastern Adriatic coast—with inland parts of Croatia. The purpose of this study is to test whether some of the previous results obtained for different measuring sites apply to the Maslenica Bridge location. Namely, the turbulence averaging time scale, bora pulsations, thermal stratification, TKE budget, and wind speed profiles. Furthermore, we aim to identify possible differences in those micro-scale properties of different bora types. As this has not been attempted before, it could give new insights into the turbulence characteristics of bora wind. For this purpose, we classify bora episodes by the flow depth and the synoptic type. As already mentioned, the flow depth is important in defining the mountain wave dynamics. We think that the synoptic type (i.e., cyclonic, anticyclonic or frontal) can influence the micro-scale properties of bora mainly because of different wind speeds, but also with different vertical wind and temperature profiles (e.g., stronger inversions in anticyclones), which additionally define mountain wave dynamics. The maximum wind speeds depend on the synoptic type because anticyclones have horizontal pressure gradient limit (inertial instability) and thus can never have wind speeds as high as very deep cyclones. Finally, the flow depth itself is also dependent on synoptic situation. In the following sections, we will explain all the methods and data used, show and discuss the obtained results, summarize the main findings, and provide conclusions.
2. Methods and Data
2.1. Measurement Site and Instruments
The measurement site (15.53° E, 44.24° N, 78 m ASL) is settled ≈30 km northeast of the city of Zadar and ≈200 m northeast from the Maslenica Bridge on the A1 section of the Croatian motorway (Figure 1). High-frequency data were collected on a 10 m mast. WindMaster Pro ultrasonic anemometers (Gill Instruments Ltd., Lymington, UK) measured the 3D wind speed and sonic temperature at 2, 5, and 10 m levels above the ground during the period from 8 October 2015 to 11 February 2016. The data were sampled with a frequency of 20 Hz. This is the highest sampling rate for any prolonged bora in situ measurements that exist today. The anemometers were connected to a CR3000 data logger (Campbell Scientific Inc., Logan, UT, USA) and the whole system was powered by two 60 W solar panels. The ground in the immediate vicinity of the mast is characteristic for the Adriatic coastline, with prevailing bare rocks and some herb cover in the form of garrigue (low, shriveled, light scrub) and maquis (dense hard-leaf shirk).
2.2. Data Quality Check
The measured data were quality checked and despiked using two methods described in []. Unrealistic data values were detected by using absolute limits (100 m·s−1 for the wind speed and 100 °C for the temperature) and linearly interpolated. Spikes were identified as three or fewer consecutive points in the time series with an amplitude larger than 3.5 standard deviations from the moving mean with a window length of 6000 data points (5 min). Spikes were also linearly interpolated and the process was repeated after increasing the standard deviation factor by 0.1 until no more spikes were detected. While interpolating the removed unrealistic data values and spikes, we kept a record of where those missing data points were located. We did this because we noticed that the interpolated continuous blocks of missing data had a negative influence on the spectral analysis (random missing data did not have such large influence). After despiking, we downsampled the data to 10 Hz by averaging two consecutive data points in order to reduce the number of missing data points. After these procedures, the missing data were reduced to less than 1% for all analyzed episodes, with an exception of one episode where there was 3.9% of missing data at the 5 m level.
2.3. Criteria for Bora Episode Detection and Selection
To identify bora episodes in the recorded data, we used 10-min averages of u and v wind components from the 10 m level. The wind direction distributions of different wind speed categories visualized as the wind rose (Figure 2) clearly indicate the dominant wind directions of stronger bora events during the measurements.
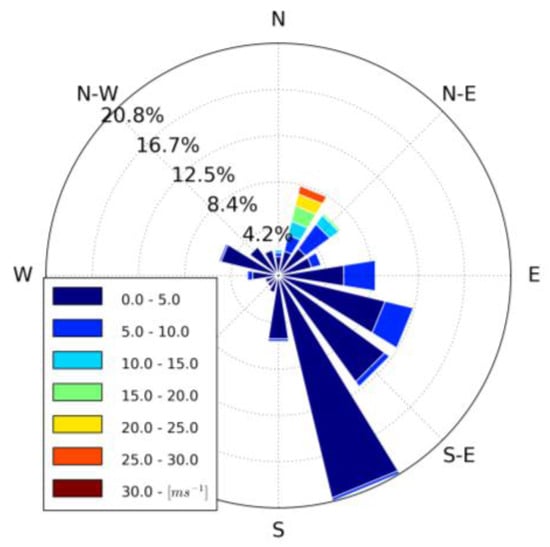
Figure 2.
The wind rose from 10-min wind averages of all data. The wind speed category limits are in m·s−1, and the numbers on the plot indicate the relative frequency of occurrence.
The highest relative frequency of wind speed >10 m·s−1 is from directions 15°–60°. Thus, we decided to set the wind direction criterion to 40° ± 40°. The lowest wind speed limit was set to 4 m·s−1 in order to filter out weaker katabatic or other thermally driven flows, while still being able to catch certain feeble onsets of bora. A similar threshold (5 m·s−1) was used by Lepri et al. []. Furthermore, the detection algorithm required that these conditions must be satisfied for at least 6 h, with an allowed discontinuity of 1 h. This is to allow for possible weaker periods or even wind reversals within the bora episodes caused by lee rotor formation or low-level flow separation [,,]. Bora episodes detected in this way were also visually checked (not shown). We also tried varying the detection settings, which confirmed that the stated settings were optimal because they caused minimal fragmentation of seemingly whole bora episodes.
Using these criteria, a total of 14 bora episodes were detected. For each of these episodes, the synoptic situation was analyzed using surface analysis [], 500 hPa geopotential and mean sea level pressure analysis [] (NCEP GDAS/FNL—National Centers for Environmental Prediction Global Data Assimilation System/Final 0.25° × 0.25° analysis), and soundings from Zadar and Zagreb stations [] (University of Wyoming database). Figure 1 shows the position of the sounding stations in relation to the measurement site. According to this analysis, we classified all bora episodes and selected the ones that unambiguously fell into one of the main bora type categories (Table 1).

Table 1.
The main bora type categories.
To emphasize the relevance of the flow depth in defining the mountain wave and bora dynamics, in this work, we propose a classification of bora episodes first by flow depth and then by its synoptic setup. The criterion for determining the depth of bora flow from sounding data was that the upper wind direction must be from the direction 40° ± 45°, which is similar to the one used by Smith []. An episode was classified as deep if this criterion was satisfied at least up to 500 hPa. Since the sounding data were available only at 00 UTC (Coordinated Universal Time) and 12 UTC, a 500 hPa geopotential height analysis was also used to subjectively assess the flow depth. Many episodes are transitional, and so may include change from cyclonic to anticyclonic (e.g., SC to SA; see Table 1). In some cases, this is also accompanied by change of the flow depth (e.g., SC to DA). In transitional episodes with one dominant type, that type is emphasized with bold font (see Table 2 in the Results and Discussion Section).
2.4. Bora Turbulence Spectra
Before analyzing the turbulent characteristics of the selected bora episodes, an appropriate averaging time scale needs to be determined. The averaging time scale is needed to separate turbulent perturbations from the mesoscale and synoptic atmospheric motions. To separate the signals into mean and fluctuating components, we used Reynolds decomposition. The basic assumption of Reynolds decomposition is the existence of a local minimum (spectral “gap”) in the power spectral densities of various turbulence quantities, such as wind speed or potential temperature [,].
Before Reynolds decomposition, the mean wind direction was determined for each bora episode and the coordinate system was rotated, so the x-axis points downstream of this mean wind speed. The power spectral densities were calculated for the horizontal components (u and v) of wind speed using the Welch algorithm [] and then smoothed using the frequency window that expands in width with frequency []. This frequency smoothing is needed to obtain representative spectral curve from the estimates, which exhibit excessive crowding and large scatter at the high-frequency end on a logarithmic scale.
Since datasets of bora episodes contain blocks of missing data, the calculation of power spectral densities was not simple. For blocks of missing data shorter than 1 s (10 data points), the missing data were replaced by linearly interpolated values. If an episode contained blocks of missing data larger than 1 s, the episode was split into smaller segments with a minimum length of 3 h and without missing data. Then the power spectral densities were calculated for every segment using a window length equal to half the length of the smallest segment of one bora episode. Finally, a spectrum for a single bora episode was created by averaging spectral estimates of every segment in the episode.
2.5. Taylor Hypothesis
After finding a suitable averaging period by spectral analysis, the time series was divided into non-overlapping block intervals with the length of the mentioned period. All intervals were checked for missing data, which may corrupt the time series. Sporadic and random missing data do not appear in groups and therefore do not corrupt the time series after interpolation. If any of those intervals had more than 50% of data missing, the interval was excluded for all measurement levels.
The remaining intervals were tested for Taylor’s hypothesis (TH), which allows us to transform from the space domain (wavenumber, k) to the time domain (frequency, f). The criterion for the validity of TH is σ < 0.5U, where U is the mean horizontal wind speed and σ is the standard deviation (e.g., []). If the ratio of the standard deviation to mean horizontal wind speed was greater than or equal to 0.5, the corresponding intervals were omitted.
2.6. Stability Parameter and Friction Velocity
In order to analyze thermal stratification of each bora episode, dimensionless height ζ, or stability parameter (e.g., []) was calculated for each block interval using the following equation:
Here, z represents the height of the observation level and L is the Obukhov length defined as the height where dynamical-mechanical turbulence generation is approximately equal to the thermal-buoyancy contribution to the turbulence generation or destruction:
where k = 0.4 is the von Karman constant (e.g., []), g = 9.81 m·s−2 is acceleration due to gravity, is the mean virtual potential temperature, is local (at each measurement height) vertical kinematic heat flux, and is the local friction velocity calculated as:
Since the relative humidity measurements were not available, we used ultrasonic temperature values instead of potential virtual temperature for determining turbulence heat flux. According to some authors [,,], the ultrasonic temperature is a good approximation of the potential temperature.
The negative stability parameter implies statically unstable stratification; a positive stability parameter implies stable stratification, while the stratification is neutral when the stability parameter is equal to zero. Here, we took block intervals with absolute values of the stability parameter less than 0.02 as near-neutral, which is the same criterion that was used in [].
2.7. Monin–Obukhov Similarity Functions
Due to the intensive mechanical mixing during bora episodes, the thermal stratification of the atmosphere is generally very close to neutral () []. However, there are periods when the value of the stability parameter deviates from zero, which means that in those periods the atmosphere is not neutrally stratified. According to the Monin–Obukhov similarity theory, during those periods, the wind shear should satisfy the following relationship
where is the mean value of the streamwise wind speed () and represents the following similarity function:
In order to check the applicability of the similarity theory in bora wind cases, the block intervals were divided according to the thermal stratification of the atmosphere into stable and unstable intervals. The experimental value of the similarity function appropriate for each block interval was calculated using the measurement data as follows:
where is the experimental value of the similarity function, is the stability parameter at the 2 m height, and is the friction velocity, also at the 2 m height. Since the measurement data were available at measurement heights of 2, 5, and 10 m, two layers were analyzed: 2–5 m and 5–10 m. The height was calculated as the arithmetic mean for each layer and the wind shear () was calculated with finite differences.
2.8. Turbulence Kinetic Energy Budget
TKE is a measure of turbulence intensity. Therefore, it is one of the most important variables in micrometeorology. The equations needed to examine the TKE budget and individual terms are implemented following Equations (1) and (2) in []. The individual terms in the TKE budget equation (e.g., []) describe the physical processes that generate, transport, or suppress turbulence.
After rotating the coordinate system in the mean wind direction, V is globally zero for each episode. The standard assumption is that there is no subsidence (W = 0). We checked and confirmed that W was small compared to U and could be neglected. The one-dimensional, nearly horizontally homogeneous TKE budget equation can be written as (hereafter in the text ē will be referred to as TKE for simplicity):
where U is the mean value of the streamwise wind speed, u’ and w’ are the corresponding turbulent values. Variable represents the dissipation of TKE into heat by molecular viscosity, and Rs is the residual. In theory, the overbars represent suitable spatial (instead of ensemble) averaging. Since we require the validity of TH, in practice, the overbars are considered as time averaging on block intervals.
Term I represents a local storage of TKE, which is equal to the increase or decrease of TKE in time at a given location due to all of the TKE production, transport, or redistribution and destruction terms. The production and destruction terms include the buoyant production/consumption (term II), which depends on the sign of the heat flux; the mechanical (shear) production (term III), which is typically positive in the surface layer because of opposite signs of the horizontal momentum fluxes and vertical wind shear; the vertical turbulent transport or redistribution of TKE by turbulent eddies (term IV); the dissipation of TKE into heat by molecular viscosity (); and the residual Rs containing term that describes the pressure transport of TKE.
All the TKE terms, besides the dissipation rate (ε), can easily be calculated directly from the measured u, v, and w components. The local change of TKE is calculated using the central finite difference scheme. Term II is calculated for 2 m, 5 m, and 10 m separately, and the middle level (3.5 m and 7.5 m) values are obtained by averaging between the two heights. Similarly, all terms that require values from upper and lower levels are calculated for the corresponding middle level using the central finite difference scheme. In order to evaluate ε, the inertial dissipation method (IDM)—provided by Kolmogorov’s 1941 hypothesis—can be employed following Equations (7)–(9) in []. The same method was used by Večenaj in [,].
Finally, the residual term is calculated using all known terms by assuming the balance between the left- and right-hand sides of Equation (8).
2.9. Wind Profiles
In order to investigate the agreement of the experimental data with the logarithmic-law approximation for neutral wind speed vertical profiles in the surface layer [], statically near-neutral block intervals during bora episodes were studied. These intervals are defined as the intervals during which is valid for all three levels []. For every interval the profile friction velocity and roughness length are calculated as follows:
where and are the heights, while and are time-averaged mean wind speeds in the x-direction at the highest (10 m) and the lowest (2 m) levels. The vertical wind profile is reconstructed with mean and median values of these parameters as:
Equations (9)–(11) are derived from the Equation (3), using certain approximations and parameterizations []. Thus, they are related to the mean, low-frequency measurements, in contrast to local friction velocity, which is related to high-frequency measurements.
3. Results and Discussion
3.1. Selected Bora Episodes
Table 2 shows all the detected bora episodes, classified by their types. Synoptic maps and soundings analyses indicate that four episodes are transitional with respect to flow depth (B02, B07, B08, and B11 in Table 2), while in two episodes (B03 and B12) the synoptic flow changes from cyclonic to anticyclonic without significant change of the flow depth. Three episodes (B05, B10, and B14) also include passages of occluded or warm fronts, but none of the episodes exhibit typical characteristics of frontal bora type. Episode B05 is very short and partially caused by cold air advection as the surface cyclone progressed southeast, but the surface analysis did not show the corresponding surface cold front. The shortest and also the weakest episode (B10) has some characteristics of frontal bora, although surface analysis did not show a typical cold front passage, but merely a slow transition of a quasi-stationary front, as the cold air mass slowly advected from the northwest. Due to the low wind speeds and untypical character of these episodes, they were not included in our micro-scale turbulence analysis.

Table 2.
All detected bora episodes. Times are in UTC. “Avg U” is the average 10-min wind speed at 10 m, “max U” is the maximum 10-min wind speed value, and “max G” is the 1-s maximum gust. All wind speeds are in m·s−1. The chosen episodes and dominant bora type are marked with bold font.
Bora B14 was predominantly of a shallow cyclonic (SC) type with a warm front passage and cold air advection following the cyclone. Non-transitional deep cyclonic (DC) bora was not detected in the recorded data. Thus, for further micro-scale analysis, we chose the following episodes: B01 (SC), B09 (DA), and B13 (SA), because they represent typical cases throughout the episode. Although B04 (SA) was longer and had a higher maximum wind speed than B13 (SA), the sounding data were missing for part of the episode, so B13 (SA) was chosen instead. Episode B13 actually had a higher average wind speed than B04. Additionally, note from Table 2 that 1-s gust maxima are usually two to three times larger than the related 10-min speed averages at 10 m.
Figure 3 shows the surface analysis (NCEP GDAS/FNL) at 12 UTC on 10 October 2015, which represents the synoptic situation after the beginning of the B01 (SC) episode.
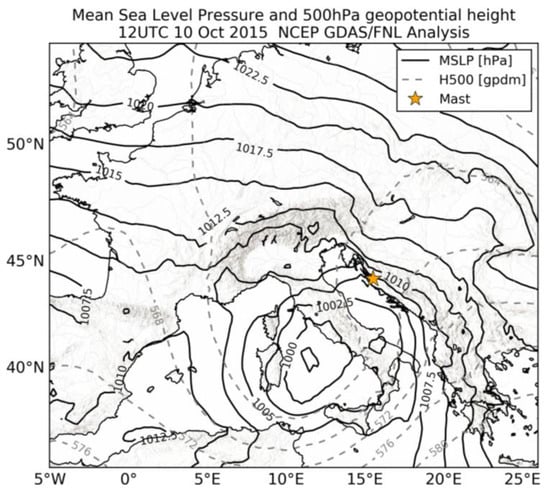
Figure 3.
The surface analysis (NCEP GDAS/FNL) mean sea level pressure (solid line) and geopotential height at 500 hPa (dashed line) for 12 UTC on 10 October 2015. The bora episode B01 (SC). The measurement site is marked with the orange star.
The surface cyclone, with its center situated over the Tyrrhenian Sea, influences the eastern Adriatic coast with its northeastern quadrant. A more detailed analysis of the surface and upper-level features reveal strong surface pressure gradients over the Dinaric Alps and an upper-level trough at 500 hPa with winds from the south. This is a typical situation for SC bora type.
The Zagreb 12 UTC sounding for the same day (Figure 4a) is not ideally upstream from the measuring tower (it is more to the north compared to low-level wind, which is more from the east), but it still reflects the vertical structure of upstream bora conditions in lower levels. At the same time, the Zadar sounding (Figure 4b) shows that the bora layer ends above 850 hPa, which corresponds to an inversion visible at around 800 hPa.
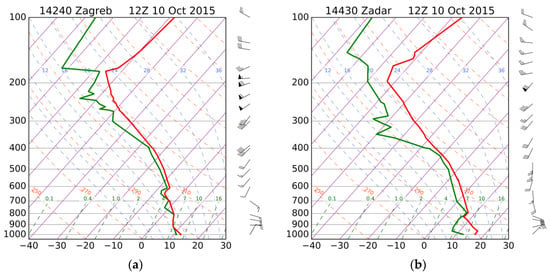
Figure 4.
The skew-T log-P graph of sounding data from the Zagreb (a) and Zadar (b) stations at 12 UTC on 10 October 2015. Bora episode B01 (SC). The vertical axis (pressure) is in hPa and horizontal axis (temperature) is in °C.
Figure 5a shows the time series of 10 Hz streamwise wind speed (u) at the 10 m level for the bora B01.
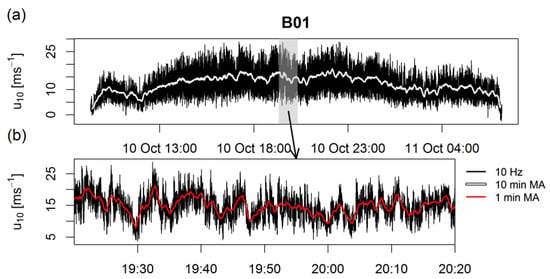
Figure 5.
(a) Bora episode (B01) streamwise wind speed (u) downsampled to 10 Hz. The white line is the 10-min moving average. (b) The zoomed 60 min of the same data with 1-min moving average is in red color.
The zoomed wind speed data with a 1-min moving average (Figure 5b) shows the pulsations with an amplitude of more than 10 m·s−1 and varying periods on a scale of around 5 min.
For episode B09 (DA) surface analysis at 12 UTC on 30 December 2015 (Figure 6) features a strong anticyclone (1045 hPa at the center) influencing most of Europe (a larger-area surface analysis can be found at []).
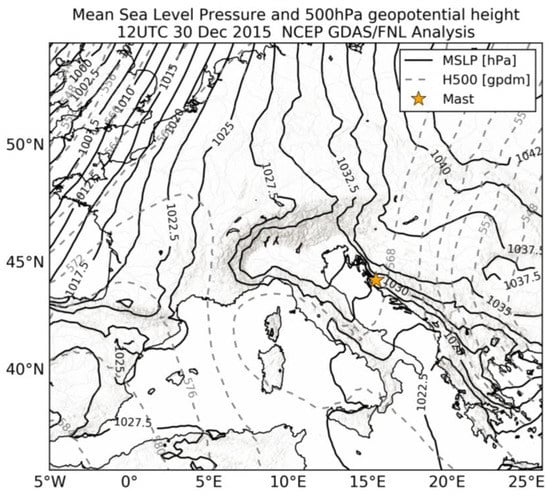
Figure 6.
As with Figure 3, but for B09 (DA); 12 UTC on 30 December 2015.
At the same time, which is approximately 2 h after the beginning of the B09 episode, 500 hPa geopotential height (Figure 6) shows the western flank of an upper-level trough, passing over the Black Sea region. This combination of the surface and upper level features provides N/NE winds throughout the troposphere.
Deep N/NE flow can also be seen in the Zagreb sounding (Figure 7a), together with strong subsidence inversion at 800 hPa—a typical signature of such a strong anticyclone. The Zadar sounding (Figure 7b) features a similar wind profile, with somewhat weaker subsidence inversion.
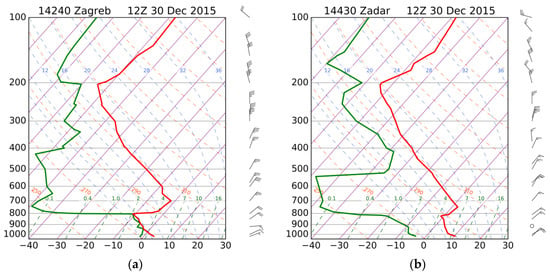
Figure 7.
As with Figure 4, but for the bora episode B09 (DA); 12 UTC on 30 December 2015.
Figure 8 shows the time series of streamwise wind speed (u) at the 10 m level for bora B09.
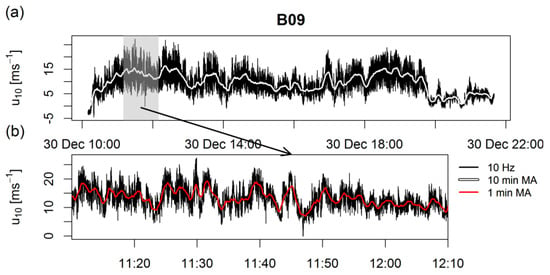
Figure 8.
As with Figure 5, but for the bora episode B09 (DA).
The bora episode B09 has somewhat lower wind speeds in the middle and higher wind speeds after the beginning and before the weaker end of the episode. The zoomed data (Figure 8b) with 1-min moving average shows the superposition of pulsations with varying periods (around 3–5 min). Some of the pulsations have estimated amplitudes over 10 m·s−1.
The surface analysis at 00 UTC on 22 January 2016 (Figure 9), 11 h after the beginning of the B13 episode (SA), shows a weak anticyclone with the center over Central Europe.
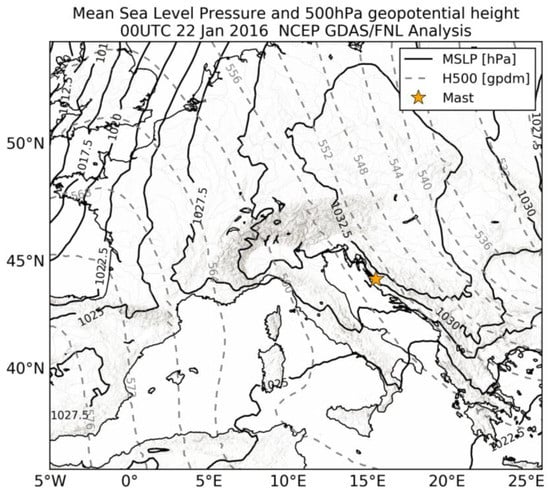
Figure 9.
As with Figure 3, but for B13 (SA); 00 UTC on 22 January 2016.
A more detailed analysis shows that the strongest surface pressure gradients are over the Dinaric Alps, while the 500 hPa NW (northwesterly) winds at the western flank of the upper-level trough dominate the area.
The Zagreb sounding at 00 UTC on 22 January 2016 (Figure 10a) displays a shallow NE wind layer, capped by an inversion at 850 hPa, with NW winds throughout the rest of the troposphere. Zadar sounding (Figure 10b) also shows a shallow NE wind layer, capped by a very stable layer and with NW winds above.
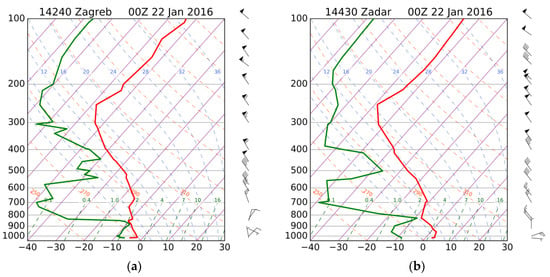
Figure 10.
As with Figure 4, but for B13 (SA); 00 UTC on 22 January 2016.
The time series of streamwise wind speed (u) at the 10 m level for this episode can be seen in Figure 11.
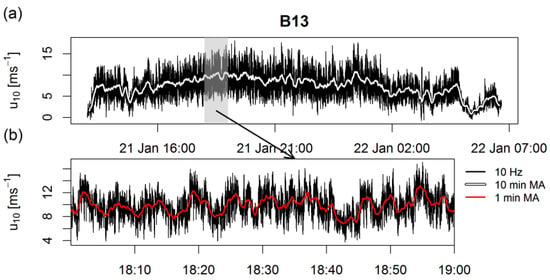
Figure 11.
As with Figure 5, but for the bora episode B13 (SA).
As in the previous two episodes, a 1-min moving average of the zoomed data (Figure 11b) also shows pulsating behavior with estimated amplitudes around 5 m·s−1 and periods around 5 min.
3.2. Bora Spectra
Frequency weighted power spectral densities were calculated and smoothed (Section 2.4) for horizontal wind components at levels 2, 5, and 10 m for all episodes. In Figure 12, the spectra are shown for three selected bora episodes (B01, B09, and B13).
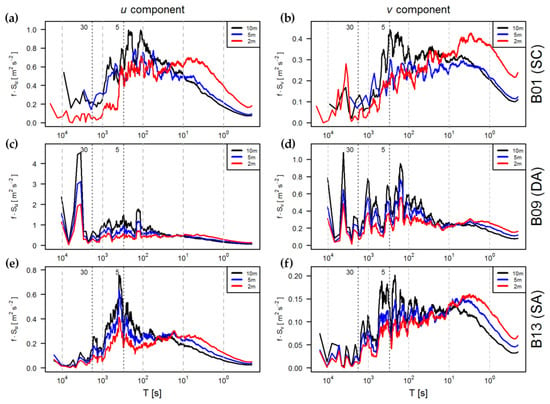
Figure 12.
A log-linear representation of the frequency-weighted power spectral densities of the longitudinal (u) component (a,c,e) and lateral (v) component (b,d,f) of the wind speed at levels 2, 5, and 10 m, for the three selected bora episodes; (a,b) B01 (SC); (c,d) B09 (DA); (e,f) B13 (SA). Thick dashed black vertical lines indicate the 30-min and 5-min periods.
It is clearly visible that the u component contains more energy than the v component for all three types of bora (note the y-axis ranges), which was expected due to the initial rotation of the coordinate system. Additionally, as expected, the data at 10 m contain a higher amount of energy than the data at 5 and 2 m at the lower frequency band. However, the data at 2 m contains a higher amount of energy at a higher frequency band than the data at 10 and 5 m. Differences in spectra between the u and v components are larger for the bora episodes with stronger winds (B01 and B09), depending on a frequency band in which the energy is observed.
The appropriate turbulence averaging time scale had to be estimated in order to proceed with the analysis (Section 2.4). In this study, we have chosen to do it in a subjective way, looking only at the power spectral densities and bearing in mind some most recent bora turbulence research [,]. A minimum of energy (energy “gap”) in frequency-weighted power spectra for bora episodes B01 (SC) and B09 (DA) is located near the frequency corresponding to the 30-min period. Spectra for bora episode B13 (SA) do not show a clear minimum like they did for B01 and B09 or, more precisely, the energy from large-scale motions (the left side of the spectrum) is missing. Regardless of the missing energy, there is a significant difference in the energy between periods of 30 and 5 min, and we can say that there is also an energy gap in the spectra for bora episode B13.
Since the energy gap is located between 15 and 40 min, we may use a 30-min time period following the instructions provided in Section 2.5. This is in accordance with [] for the nocturnal stable boundary layer in the Croatian lowland (town of Kutina), while Babić et al. [] found an energy gap at the 15-min period for bora episodes at Pometeno Brdo, northeast from the city of Split. Hence, all further analyses were performed on block intervals of 30 min length.
There is an energy peak in both the u and v component of the given power spectral densities, between the periods of ≈2 and 8 min. The energy peaks are most likely related to bora pulsations [,,], which can also be seen in the u time series (Figure 5, Figure 8 and Figure 11). The power spectral density of bora episode B09 shows a large peak between periods 104 s and 103 s. This is at the lowest end of the pulsations similar to that in []. Spectral analysis did not show any significant difference in power spectral densities between bora episodes B01 (SC) and B13 (SA). Other than the peak in the B09 (DA) spectra, which could be related to different flow dynamics (deep bora), there is no clear connection between the power spectral densities of different bora episodes and the type of bora.
3.3. Friction Velocity and Stability Parameter
Time series of friction velocity calculated from turbulent fluxes (Section 2.6, Equation (3)), for all three levels of bora B01 (SC) are shown in Figure 13. The friction velocity time series is closely related to the TKE time series (not shown).
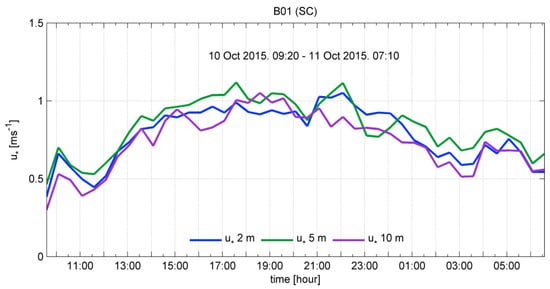
Figure 13.
The time series of friction velocity () for bora B01 (SC). The blue line is at 2 m, the green line is at 5 m, and the magenta line is at 10 m.
Figure 13 shows that lower values of friction velocity appear at the beginning and at the end of the bora episode. Comparing this figure to Figure 5, it can be seen that the friction velocity is closely related to the streamwise wind speed (u). It should also be noted that the friction velocity values are generally highest at the 5 m level. In total, the bora B01 (SC) has 43 30-min blocks, with all blocks satisfying Taylor’s hypothesis (TH, Section 2.5).
The B09 bora (DA) (Figure 14) is relatively short, and thus has only 23 30-min blocks, of which three blocks at the end of the episode did not satisfy TH (Section 2.5). Such invalid blocks are usually located at the beginning or the end of the episode, where turbulence intensity seems to be the highest (i.e., large standard deviation of relatively low wind speed). Nevertheless, Figure 14 shows that friction velocity is closely related to the wind speed for this episode as well (Figure 8). This also explains the lower friction velocity values in the middle of this episode, as the wind speed was also lower in that part of the episode.
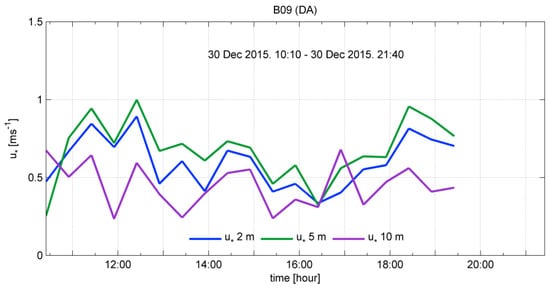
Figure 14.
As with Figure 13, but for the bora episode B09 (DA).
Interestingly, for this episode, the friction velocity at the 5 m level is also higher than at the other two levels.
Bora B13 (SA), in Figure 15, has 35 30-min blocks, of which one block near the end of the episode was discarded.
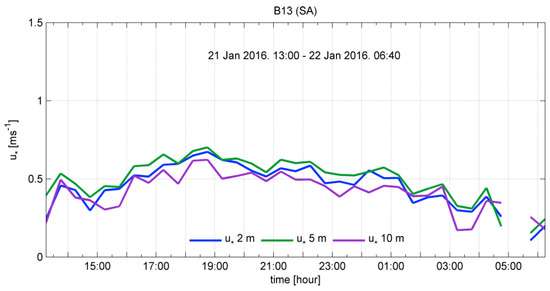
Figure 15.
As with Figure 13, but for the bora episode B13 (SA).
As with the other two episodes (B01 and B09), a close relation between wind speed (Figure 11) and friction velocity can easily be seen. For this episode, the friction velocity at 5 m is also higher than at the other two levels.
The distribution of friction velocity for each bora episode at different vertical levels is shown in Figure 16. For the bora episode B01 (SC), two maxima occur at the lower levels. The first one (located around 0.7–0.8 m·s−1) probably corresponds to the moderate wind speeds at the beginning and the end of the episode, while the other one, which is larger (located around 0.9–1 m·s−1), could be a result of the wind speed increase during the more developed part of the episode.
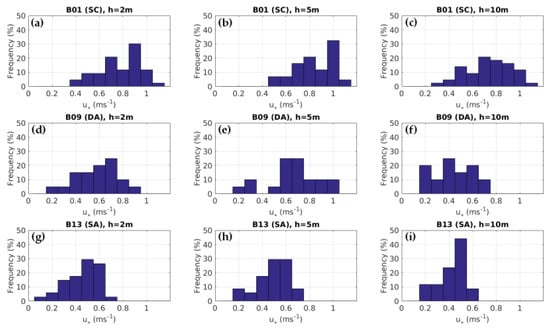
Figure 16.
Frequency distribution of friction velocity for: the B01 (a–c), B09 (d–f), and B13 (g–i) bora episodes; at three different vertical levels: 2 m (a,d,g), 5 m (b,e,h), and 10 m (c,f,i).
This bimodality is less pronounced at the highest level, where the friction velocity distribution tends to look more near-normal with similar mean and median values (Table 3). This shift towards near-normal distribution is in better agreement with the results found in [].

Table 3.
The summary statistics of the friction velocity (m·s–1) for each bora episode at selected vertical levels.
Other two anticyclonic bora episodes seem to have such distribution types shifted towards lower values of friction velocity (maximum located around 0.5 m·s−1) compared to bora B01 (SC). A slight negative skewness can be noticed for those bora episodes, and is also evident as somewhat larger medians compared to the corresponding mean friction velocity.
The stability parameter distribution is shown in Figure 17. In order to compare the stability parameters between different bora episodes, the width of the bin was kept the same (0.02).
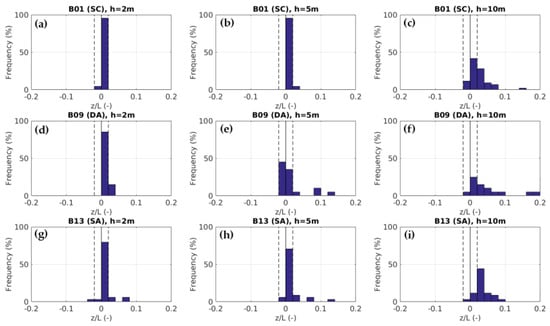
Figure 17.
The stability parameter ζ distribution for the B01 (a–c), B09 (d–f), and B13 (g–i) bora episodes at three different vertical levels: 2 m (a,d,g), 5 m (b,e,h), and 10 m (c,f,i).
The largest number of stability parameter values is grouped around zero, in accordance with the near-neutral thermal stratification of bora due to intensive mechanical mixing. This was also found for a summer bora episode in [] and is especially visible at two lower levels, where most of the ζ are between −0.02 and 0.02. At the 10 m level, the frequency of those quasi-neutral cases is lower compared to the 2 and 5 m level distributions, because more statically stable cases appear. Stable cases occur during nights when the heat flux is negative and the dynamical effects are either not well developed or weakened []. The mean values of stability parameters are in general larger than the corresponding medians for the selected bora episodes (Table 4). No significant difference related to the bora type was observed in the stability parameter distribution.

Table 4.
The summary statistics of the stability parameter ζ for each bora episode at selected vertical levels.
3.4. Monin–Obukhov Similarity Functions
The experimental values of the similarity functions () and the values obtained using the theoretical Equations (5) and (6) in Section 2.7 are shown in Figure 18 with respect to the stability parameter .
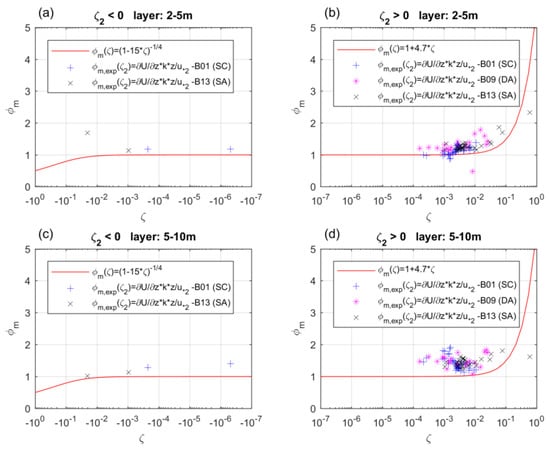
Figure 18.
The experimental similarity function values averaged over 30-min intervals. The blue, magenta, and black markers denote the intervals from episode B01, B09, and B13, respectively, compared to the theoretical values of the similarity functions (red lines), for the statically unstable (a,c) and stable (b,d) surface layer.
The intervals with unstable thermal stratification are shown in the diagrams on the left, and those with stable stratification on the right. There is a significant discrepancy between the experimental and the theoretical values, especially for in the higher layer (5–10 m layer; Figure 18d). Furthermore, the diagrams on the right (Figure 18b,d) showing stable intervals show relatively high dispersion of the experimental values, especially in the higher level. Unfortunately, the diagrams showing the unstable intervals do not contain enough data points for dispersion evaluation. Nevertheless, it can be noticed that the experimental values of the similarity functions are generally close to 1. This is to be expected, since although the stability parameter is positive or negative, its absolute value stays low—meaning that the stratification is mostly close to neutral.
In the lower layer (2–5 m), the experimental values have lower dispersion (Figure 18a,b). Furthermore, they show a reasonable trend of increase when the lowest part of the atmosphere becomes more statically stable, and decrease when it becomes more unstable, which is in accordance with the theoretical expressions. This trend is not so obvious in the upper layer (5–10 m). It can be concluded that the universal similarity functions are relatively successful at describing the wind profile in the lower part of the surface layer, but fail to give reliable results above a certain height. Therefore, the use of the universal similarity functions should probably be avoided in case of bora wind or at least used with caution.
The reason the similarity functions do not give good results in the case of bora wind most probably lies in the failure of the main assumptions on which the similarity theory is based—that the surface layer is quasi-stationary, horizontal, and homogeneous. For a more detailed analysis, it would be necessary to look at a larger number of bora episodes.
3.5. Turbulence Kinetic Energy Budget
Figure 19 represents the TKE budget terms as defined in Equation (8) (Section 2.8) for the three selected bora episodes: B01 (SC; Figure 19a), B09 (DA; Figure 19b) and B13 (SA; Figure 19c).
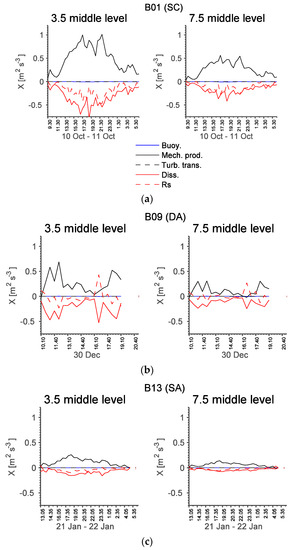
Figure 19.
The turbulence kinetic energy (TKE) terms calculated on the two middle levels: 3.5 m (left) and 7.5 m (right). Term III (mechanical production) in the solid black line, term II (buoyant production) is the solid blue, dissipation is the solid red line, and the residual term is in dashed red. (a) B01 (SC), (b) B09 (DA), and (c) B13 (SA). The correlation coefficient between the mechanical production and dissipation is ~−0.9, and between the buoyancy term and residual is 0.8 and 0.5 on the 3.5 and 7.5 middle levels, respectively.
The shear term dominates in all three episodes (with a maximum magnitude of 1 m2·s−3 during the most intense phase of the selected bora episodes) meaning that the kinetic energy is extracted from the mean flow and transformed into the TKE. To preserve the TKE balance, the residual term (with a minimum magnitude of −0.3 m2·s−3) and dissipation term (with a minimum magnitude of −1 m2·s−3) are mostly negative for all episodes, decreasing the TKE in the layer considered here. Negative mechanical production (and the positive residual term), which is visible in the B09 episode, is probably due to the local non-stationarity of u’ in the corresponding 30-min interval []. We also found a minimum in the TKE (not shown) and time series (Figure 14) corresponding to this block interval with a negative mechanical production.
The other TKE terms together contribute with only a small portion (20%) to balancing the TKE equation. Terms II (the buoyant production/consumption) and IV (vertical turbulent transport) are a few orders of magnitude smaller than other TKE budget terms. Term II is dominantly negative, acting as a weak sink, while term IV is dominantly positive.
These results agree well with the results from [] for a Mountain-Wave event during the T-REX experiment. A new outcome is that the terms only vary in magnitude depending on the bora type, while the signs of the terms do not depend on the synoptic type.
Comparing the two middle levels, absolute values of TKE terms on the lower, 3.5 m, middle level are larger than the corresponding 7.5 m middle-level values. This is due to the fact that turbulent motions are more intense near ground level. The most intense turbulent motions are for B01—shallow cyclonic bora type—followed by B09—deep anticyclonic bora case.
It is interesting to inspect the temporal correlation coefficients between the mechanical production term and dissipation, and between the buoyancy term and residual. The first correlation coefficient is large and negative (~−0.9 on both middle levels), which can also be seen in Figure 19. Furthermore, these two terms dominantly balance the TKE budget equation. This implies that the mechanical production and dissipation are of a similar size and are reciprocal. The second correlation coefficient mentioned is positive (0.8 and 0.5 on the 3.5 m and 7.5 m middle levels, respectively); consequently, for statically stable conditions, the pressure transport is negative, and for statically unstable conditions, it is positive.
3.6. Wind Profiles
The vertical wind speed profiles reconstructed with the mean and median values (Section 2.9) are shown in Figure 20. Both methods of reconstruction gave results with high correlations (between 0.9874 and 0.9995) and small relative errors.
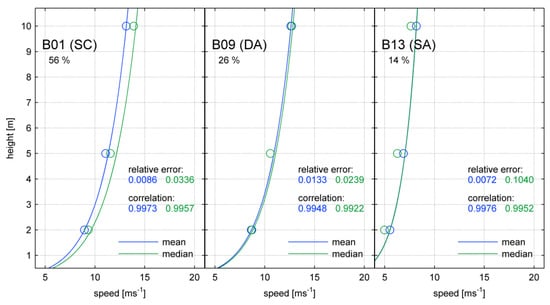
Figure 20.
The measured (circle) and reconstructed (line) vertical wind speed profiles in the x-direction with a percentage of near-neutral 30-min intervals, relative errors, and correlations. The profiles reconstructed with the mean (median) values of (friction velocity estimated from wind profile) and are blue (green). The relative errors and correlations between the measurements and reconstructions are given in the corresponding colors.
In the examples depicted, the reconstructions of the vertical wind speed profiles based on the mean values have slightly better results, but that is not the general case. The efficiency of the method depends on the particular bora episode considered. This seems to be a consequence of wind speed, rather than bora type (different flow depth dynamics). When the vertical profiles shown in Figure 20 are normalized by the maximum average wind speed (not shown), they have the same shape, regardless of the bora type. This does not confirm the findings from [], where different vertical profile shapes were observed for different wind speeds. We also tried reconstructing the wind profiles with the measured values of (calculated from turbulent fluxes using Equation (3)), but since these values are persistently lower than the values of , such profiles underestimate the wind speed at all levels (not shown).
4. Conclusions
We carried out, for the first time, a detailed analysis of high-frequency (20 Hz, downsampled to 10 Hz) wind data for several bora episodes measured at the Maslenica Bridge site in Croatia during autumn and winter 2015/2016 on three vertical levels (2, 5, and 10 m). A total of 14 bora episodes were detected and classified by depth and synoptic type, of which three typical episodes were selected and presented in this study: B01 (shallow cyclonic), B09 (deep anticyclonic), and B13 (shallow anticyclonic).
Our results confirm the majority of the previous results [,,]. The minimum energy (energy “gap”) in the frequency-weighted power spectral density graphs for the majority of the episodes is located at 30 min. We could not find clear evidence that it depends only on the bora type. Furthermore, power spectral densities disclose energy peaks at periods between 2 and 8 min for all three episodes, which are most likely related to bora pulsations. This further implies that mountain wave breaking occurred in all analyzed episodes. The thermal stratification during a bora episode is near-neutral due to intensive mechanical mixing, independent of the type of the episode. Deviations from this can be seen at the 10 m height in the nighttime, when the most statically stable bora cases occur. However, these never go beyond weak stratifications.
The use of similarity functions in the bora surface layer was also tested. We suggest adopting the similarity theory for bora episodes with caution, since they fail to give reliable results, especially above a certain height. This is probably due to the fact that the main assumptions of the similarity theory are violated (i.e., quasi-stationarity and horizontal homogeneity).
The vertical wind speed profiles—reconstructed with mean and median values—agree well with the logarithmic profile for the surface layer during all analyzed bora episodes.
In the TKE equation, the shear term dominates in all three episodes extracting the kinetic energy from the mean flow and transforming into the TKE. The shear term is mainly balanced by the pressure transport (residual) and dissipation term.
In the small set of typical bora types we analyzed (SC, DA, and SA), we found no evidence that possible differences in micro-scale properties are related to different bora types—which was one of the main goals of the study. The inspected elements that explicitly depend on the wind speed (i.e., friction velocity, TKE, and vertical wind profiles) are different, but that is not necessarily a function of bora type. The friction velocity and TKE budget terms increase with the increase of the mean streamwise wind component.
In this paper, we present a novel approach to bora time series analysis, but we are aware of the possible limitations in finding micro-scale differences for different flow depth dynamics. The very sparse time series of sounding data (00 UTC and 12 UTC only) and the one-point measurements at Maslenica are a few of them. In order to further enhance this study (e.g., in the application of the similarity function), future work should aim for a more precise flow depth analysis, and perhaps more complex classification (e.g., by considering vertical wind shear and stability); but above all, more cases and measurements in a denser grid are needed to account for horizontal inhomogeneity. Furthermore, this study showed that the strongest bora episodes are mainly transitional in type (possible change in flow depth dynamics), so to investigate the micro-scale properties of such cases, episodes should be divided into parts according to flow depth and synoptic type, and then analyzed.
Acknowledgments
V.Š. and J.S. acknowledge Croatia Control Ltd. for their support. The work of A.B. has been supported by the Croatian Science Foundation (VITCLIC) project (PKP-2016-06-2975) which is funded by the Environmental Protection and Energy Efficiency Fund under the Government Program (Ministry of Environment and Energy & Ministry of Science and Education) for the Promotion of Research and Development Activities in the Field of Climate Change for the period 2015–2016. K.Š. acknowledges the EKONERG for their support. I.N., S.B., J.S., and M.B. acknowledge the Meteorological and Hydrological Service for their support. This work started as a project assignment within turbulence course at the Department of Geophysics, Faculty of Science, University of Zagreb. The study was partly funded by the Croatian Science Foundation projects CATURBO, No. 09/151 and HRZZ-IP-2016-06-2017 (WESLO).
Author Contributions
All authors made a significant contribution to the data analysis, writing, and revising the manuscript. Vinko Šoljan coordinated the work, while also doing data analysis and writing. Andreina Belušić was responsible for the TKE analysis and writing. Kristina Šarović tested the Monin–Obukhov similarity theory. Irena Nimac analyzed the surface layer stability. Stjepana Brzaj analyzed the wind profiles. Jurica Suhin was responsible for the spectral analysis. Martin Belavić performed the data cleaning and quality control. Željko Večenaj and Branko Grisogono designed and led the project, performed the wind data collection, and contributed to writing the manuscript.
Conflicts of Interest
The authors declare no conflicts of interest.
References
- Lepri, P.; Vecenaj, Z.; Kozmar, H.; Grisogono, B. Bora wind characteristics for engineering applications. Wind Struct. 2017, 24, 579–611. [Google Scholar] [CrossRef]
- Smith, R.B. Aerial observations of the Yugoslavian bora. J. Atmos. Sci. 1987, 44, 269–297. [Google Scholar] [CrossRef]
- Defant, F. Local winds. Compendium of Meteorology; American Meteorological Society: Boston, MA, USA, 1951; pp. 655–672. [Google Scholar]
- Jurčec, V. On mesoscale characteristics of bora conditions in Yugoslavia. In Weather and Weather Maps; Birkhäuser: Basel, Switzerland, 1981; pp. 640–657. [Google Scholar]
- Kuettner, J.; O’ Neill, T. ALPEX-the GARP mountain subprogram. Bull. Am. Meteorol. Soc. 1981, 62, 793–805. [Google Scholar]
- Smith, R.B. On severe downslope winds. J. Atmos. Sci. 1985, 42, 2597–2603. [Google Scholar] [CrossRef]
- Durran, D.R. Another look at downslope windstorms. Part I: The development of analogs to supercritical flow in an infinitely deep, continuously stratified fluid. J. Atmos. Sci. 1986, 43, 2527–2543. [Google Scholar] [CrossRef]
- Bencetić Klaić, Z.; Belušić, D.; Grubišić, V.; Gabela, L.; Ćoso, L. Mesoscale airflow structure over the northern Croatian coast during MAP IOP—A major bora event. Geofizika 2003, 20, 23–61. [Google Scholar]
- Grubišíc, V. Bora-driven potential vorticity banners over the Adriatic. Q. J. R. Meteorol. Soc. 2004, 130, 2571–2603. [Google Scholar] [CrossRef]
- Gohm, A.; Mayr, G. Numerical and observational case-study of a deep Adriatic Bora. Q. J. R. Meteorol. Soc. 2005, 131, 1363–1392. [Google Scholar] [CrossRef]
- Grisogono, B.; Belušić, D. A review of recent advances in understanding the meso-and microscale properties of the severe Bora wind. Tellus A 2009, 61, 1–16. [Google Scholar] [CrossRef]
- Jurčec, V. The Adriatic frontal bora type. Croat. Meteorol. J. 1988, 23, 13–25. [Google Scholar]
- Kuzmić, M.; Grisogono, B.; Li, X.; Lehner, S. Examining deep and shallow Adriatic bora events. Q. J. R. Meteorol. Soc. 2015, 141, 3434–3438. [Google Scholar] [CrossRef]
- Lukšić, I. Tipovi strujanja zraka iznad Zagreba za vrijeme bure na Sjevernom Jadranu (Upper Level Flow Types at Zagreb During the Bora in the Northern Adriatic). In Papers from VII Climatological Conference; Federal Hydrometorological Institute: Belgrade, Serbia, 1972; pp. 111–129. [Google Scholar]
- Gohm, A.; Mayr, G.J.; Fix, A.; Giez, A. On the onset of bora and the formation of rotors and jumps near a mountain gap. Q. J. R. Meteorol. Soc. 2008, 134, 21–46. [Google Scholar] [CrossRef]
- Pullen, J.; Doyle, J.D.; Haack, T.; Dorman, C.; Signell, R.P.; Lee, C.M. Bora event variability and the role of air-sea feedback. J. Geophys. Res. Oceans 2007, 112. [Google Scholar] [CrossRef]
- Poje, D. Wind persistence in Croatia. Int. J. Climatol. 1992, 12, 569–586. [Google Scholar] [CrossRef]
- Pasarić, M.; Orlić, M. Djelovanje atmosfere na Jadran: danas te u uvjetima očekivanih klimatskih promjena. Geofizika 2004, 21, 69–87. [Google Scholar]
- Belušić, A.; Prtenjak, M.T.; Güttler, I.; Ban, N.; Leutwyler, D.; Schär, C. Near-surface wind variability over the broader Adriatic region: Insights from an ensemble of regional climate models. Clim. Dyn. 2017, 1–26. [Google Scholar] [CrossRef]
- Mohorovicic, A. Interesting cloud pictures over the Bay of Buccari (with a comment from the editor J. Hann) (Interessante Wolkenbildung ber der Bucht von Buccari). Meteorol. Z 1889, 24, 56–58. [Google Scholar]
- Yoshino, M. Local Wind Bora; University of Tokyo Press: Tokyo, Japan, 1976. [Google Scholar]
- Stiperski, I.; Ivančan-Picek, B.; Grubišić, V.; Bajić, A. Complex bora flow in the lee of Southern Velebit. Q. J. R. Meteorol. Soc. 2012, 138, 1490–1506. [Google Scholar] [CrossRef]
- Glasnović, D.; Jurčec, V. Determination of upstream bora layer depth. Meteorol. Atmos. Phys. 1990, 43, 137–144. [Google Scholar] [CrossRef]
- Klemp, J.B.; Durran, D.R. Numerical modelling of Bora winds. Meteorol. Atmos. Phys. 1987, 36, 215–227. [Google Scholar] [CrossRef]
- Watanabe, K. Bora and Man: Weather Forecasts and Prognosis of Bora by the Fishermen’s Traditional Way of Observation on the Croatian Coast. In Local Wind Bora; Yoshino, M.M., Ed.; University of Tokyo Press: Tokyo, Japan, 1976; pp. 267–274. [Google Scholar]
- Petkovšek, Z. Gravity waves and bora gusts. Ann. Meteorol. 1982, 19, 108–110. [Google Scholar]
- Petkovšek, Z. Main bora gusts—A model explanation. Geofizika 1987, 4, 41–50. [Google Scholar]
- Belušić, D.; Pasarić, M.; Orlić, M. Quasi-periodic bora gusts related to the structure of the troposphere. Q. J. R. Meteorol. Soc. 2004, 130, 1103–1121. [Google Scholar] [CrossRef]
- Belušić, D.; Žagar, M.; Grisogono, B. Numerical simulation of pulsations in the bora wind. Q. J. R. Meteorol. Soc. 2007, 133, 1371–1388. [Google Scholar] [CrossRef]
- Babić, N.; Večenaj, Ž.; Kozmar, H.; Horvath, K.; De Wekker, S F.; Grisogono, B. On turbulent fluxes during strong winter bora wind events. Bound. Layer Meteorol. 2016, 158, 331–350. [Google Scholar] [CrossRef]
- Peltier, W.R.; Scinocca, J.F. The origin of severe downslope windstorm pulsations. J. Atmos. Sci. 1990, 47, 2853–2870. [Google Scholar] [CrossRef]
- Belušić, D.; Grisogono, B. Disappearance of pulsations in severe downslope windstorms. Croat. Meteorol. J. 2005, 40, 84–87. [Google Scholar]
- Večenaj, Ž.; Belušić, D.; Grisogono, B. Characteristics of the near-surface turbulence during a bora event. Annales Geophysicae 2010, 28, 155–163. [Google Scholar] [CrossRef]
- Večenaj, Ž.; Belušić, D.; Grubišić, V.; Grisogono, B. Along-coast features of bora-related turbulence. Bound. Layer Meteorol. 2012, 143, 527–545. [Google Scholar] [CrossRef]
- Lepri, P.; Kozmar, H.; Večenaj, Ž.; Grisogono, B. A summertime near-ground velocity profile of the Bora wind. Wind Struct. 2014, 19, 505–522. [Google Scholar] [CrossRef]
- Lepri, P.; Večenaj, Ž.; Kozmar, H.; Grisogono, B. Near-ground turbulence of the Bora wind in summertime. J. Wind Eng. Ind. Aerodyn. 2015, 147, 345–357. [Google Scholar] [CrossRef]
- Vickers, D.; Mahrt, L. Quality control and flux sampling problems for tower and aircraft data. J. Atmos. Ocean. Technol. 1997, 14, 512–526. [Google Scholar] [CrossRef]
- Ivančan-Picek, B.; Grubišić, V.; Stiperski, I.; Xiao, M.; Bajić, A. “Zadar calm” during severe Bora. In Proceedings of the 29th International Conference on Alpine Meteorology, Extended Abstracts, Chambery, France, 4–8 June 2007. [Google Scholar]
- Telišman Prtenjak, M.; Belušić, D. Formation of reversed lee flow over the north-eastern Adriatic during bora. Geofizika 2009, 26, 145–155. [Google Scholar]
- Deutscher Wetterdienst (DWD) Surface Analysis Charts. Available online: http://www1.wetter3.de/Archiv/archiv_dwd.html (accessed on 28 November 2016).
- National Centers for Environmental Prediction, National Weather Service and U.S. Department of Commerce. NOAA NCEP GDAS/FNL 0.25 Degree Global Tropospheric Analyses and Forecast Grids. Available online: https://doi.org/10.5065/D65Q4T4Z (accessed on 10 March 2017).
- University of Wyoming Department of Atmospheric Science Sounding Data from University of Wyoming Database. Available online: http://weather.uwyo.edu/upperair/sounding.html (accessed on 28 November 2016).
- Reynolds, O. On the dynamical theory of incompressible viscous fluids and the determination of the criterion. Proc. R. Soc. Lond. 1894, 56, 40–45. [Google Scholar] [CrossRef]
- Stull, R.B. An Introduction to Boundary Layer Meteorology, 1st ed.; Stull, R.B., Ed.; Atmospheric and Oceanographic Sciences Library; Springer: Dordrecht, The Netherlands, 1988; Volume 13, ISBN 978-90-277-2768-8. [Google Scholar]
- Welch, P. The use of fast Fourier transform for the estimation of power spectra: A method based on time averaging over short, modified periodograms. IEEE Trans. Audio Electroacoust. 1967, 15, 70–73. [Google Scholar] [CrossRef]
- Kaimal, J.C.; Finnigan, J.J. Atmospheric Boundary Layer Flows: Their Structure and Measurement; Oxford University Press: New York, NY, USA, 1994. [Google Scholar]
- Albertson, J.D.; Parlange, M.B.; Kiely, G.; Eichinger, W.E. The average dissipation rate of turbulent kinetic energy in the neutral and unstable atmospheric surface layer. J. Geophys. Res. Atmos. 1997, 102, 13423–13432. [Google Scholar] [CrossRef]
- Fortuniak, K.; Pawlak, W.; Siedlecki, M. Integral turbulence statistics over a central European city centre. Bound. Layer Meteorol. 2013, 146, 257–276. [Google Scholar] [CrossRef]
- Večenaj, Ž.; De Wekker, S.F.; Grubišić, V. Near-surface characteristics of the turbulence structure during a mountain-wave event. J. Appl. Meteorol. Climatol. 2011, 50, 1088–1106. [Google Scholar] [CrossRef]
- Tennekes, H.; Lumley, J.L. A First Course in Turbulence; MIT Press: Cambridge, MA, USA, 1972. [Google Scholar]
- Holton, J.R. An Introduction to Dynamic Meteorology, 4th ed.; Dmowska, R., Holton, J.R., Eds.; International Geophysics Series; Elsevier Academic Press: Burlington, MA, USA, 2004; ISBN 978-0-12-354015-7. [Google Scholar]
- Babić, K.; Bencetić Klaić, Z.; Večenaj, Ž. Determining a turbulence averaging time scale by Fourier analysis for the nocturnal boundary layer. Geofizika 2012, 29, 35–51. [Google Scholar]
- Belušić, D.; Pasarić, M.; Pasarić, Z.; Orlić, M.; Grisogono, B. A note on local and non-local properties of turbulence in the bora flow. Meteorol. Z. 2006, 15, 301–306. [Google Scholar] [CrossRef]
- Tampieri, F. Turbulence and Dispersion in the Planetary Boundary Layer; Physics of Earth and Space Environments; Springer International Publishing: Cham, Switzerland, 2017; ISBN 978-3-319-43602-9. [Google Scholar]
- Večenaj, Ž.; De Wekker, S.F. Determination of non-stationarity in the surface layer during the T-REX experiment. Q. J. R. Meteorol. Soc. 2015, 141, 1560–1571. [Google Scholar] [CrossRef]
© 2018 by the authors. Licensee MDPI, Basel, Switzerland. This article is an open access article distributed under the terms and conditions of the Creative Commons Attribution (CC BY) license (http://creativecommons.org/licenses/by/4.0/).