Returning Tea Pruning Residue and Its Biochar Had a Contrasting Effect on Soil N2O and CO2 Emissions from Tea Plantation Soil

 , and
, and
Abstract
1. Introduction
2. Materials and Methods
2.1. Soil and Biochar
2.2. Experimental Design and Incubation Study
2.3. Gas Sampling and Analysis
2.4. Soil Analysis
2.5. Statistical Analysis
3. Results
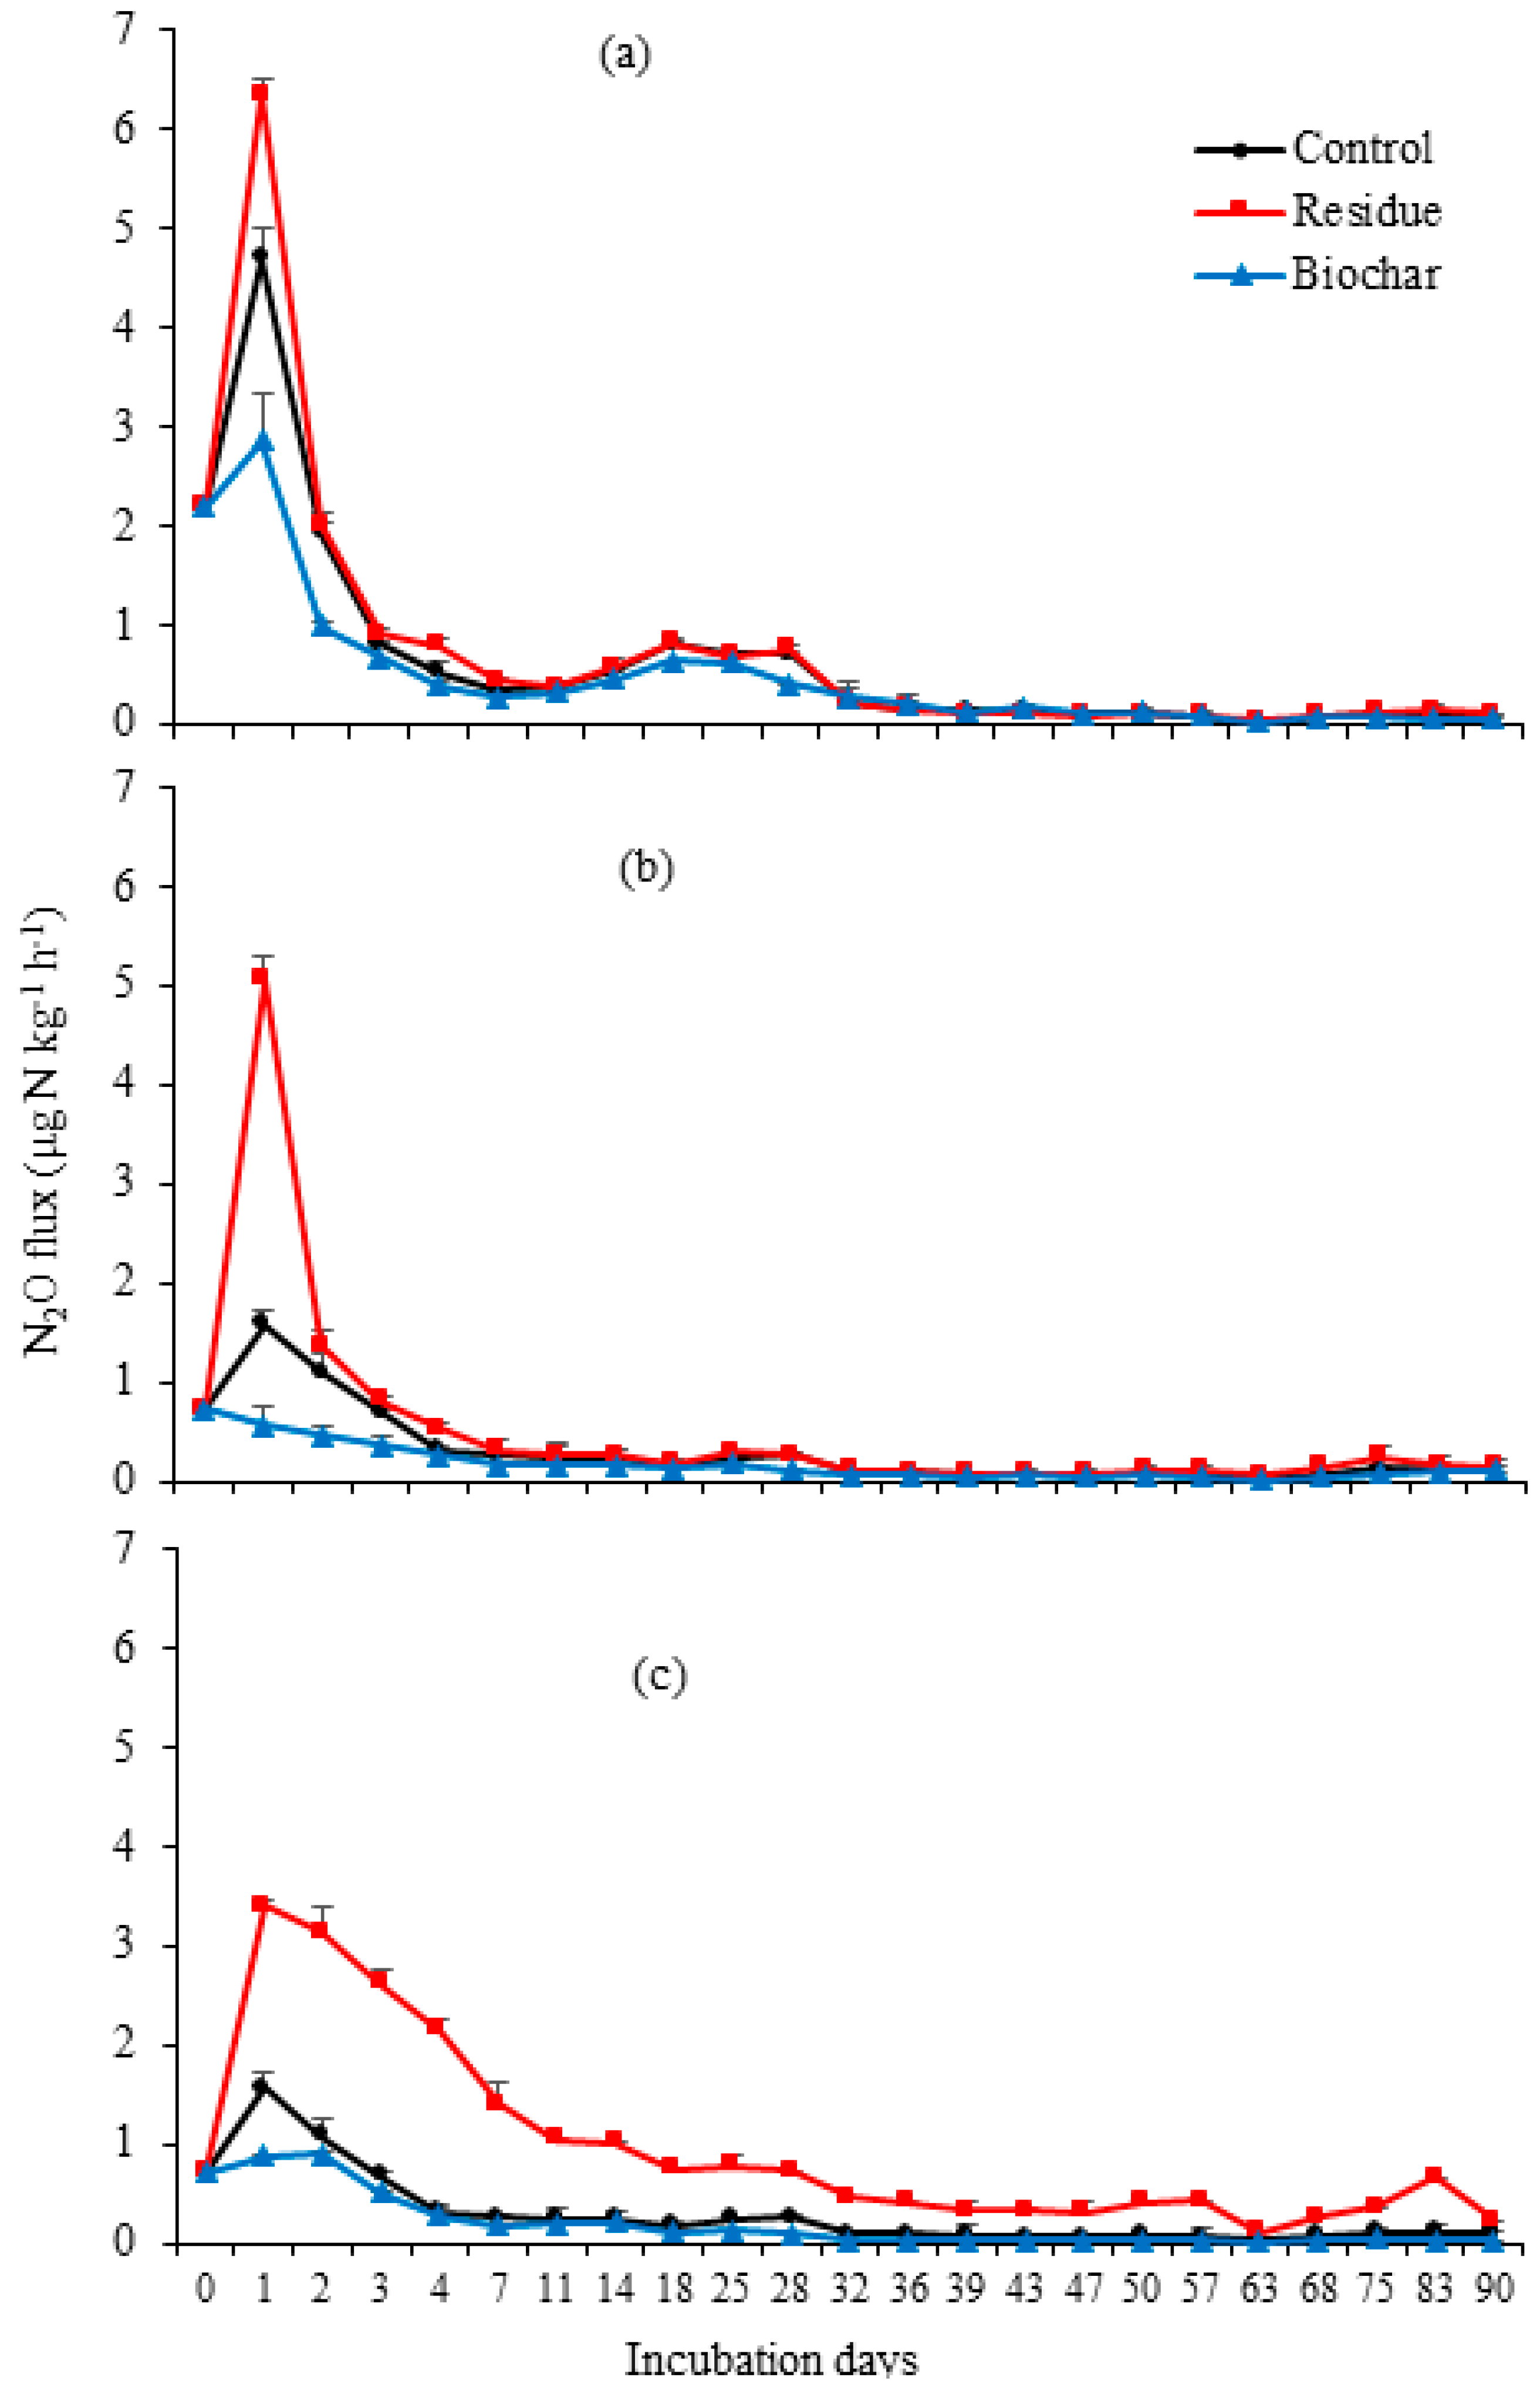
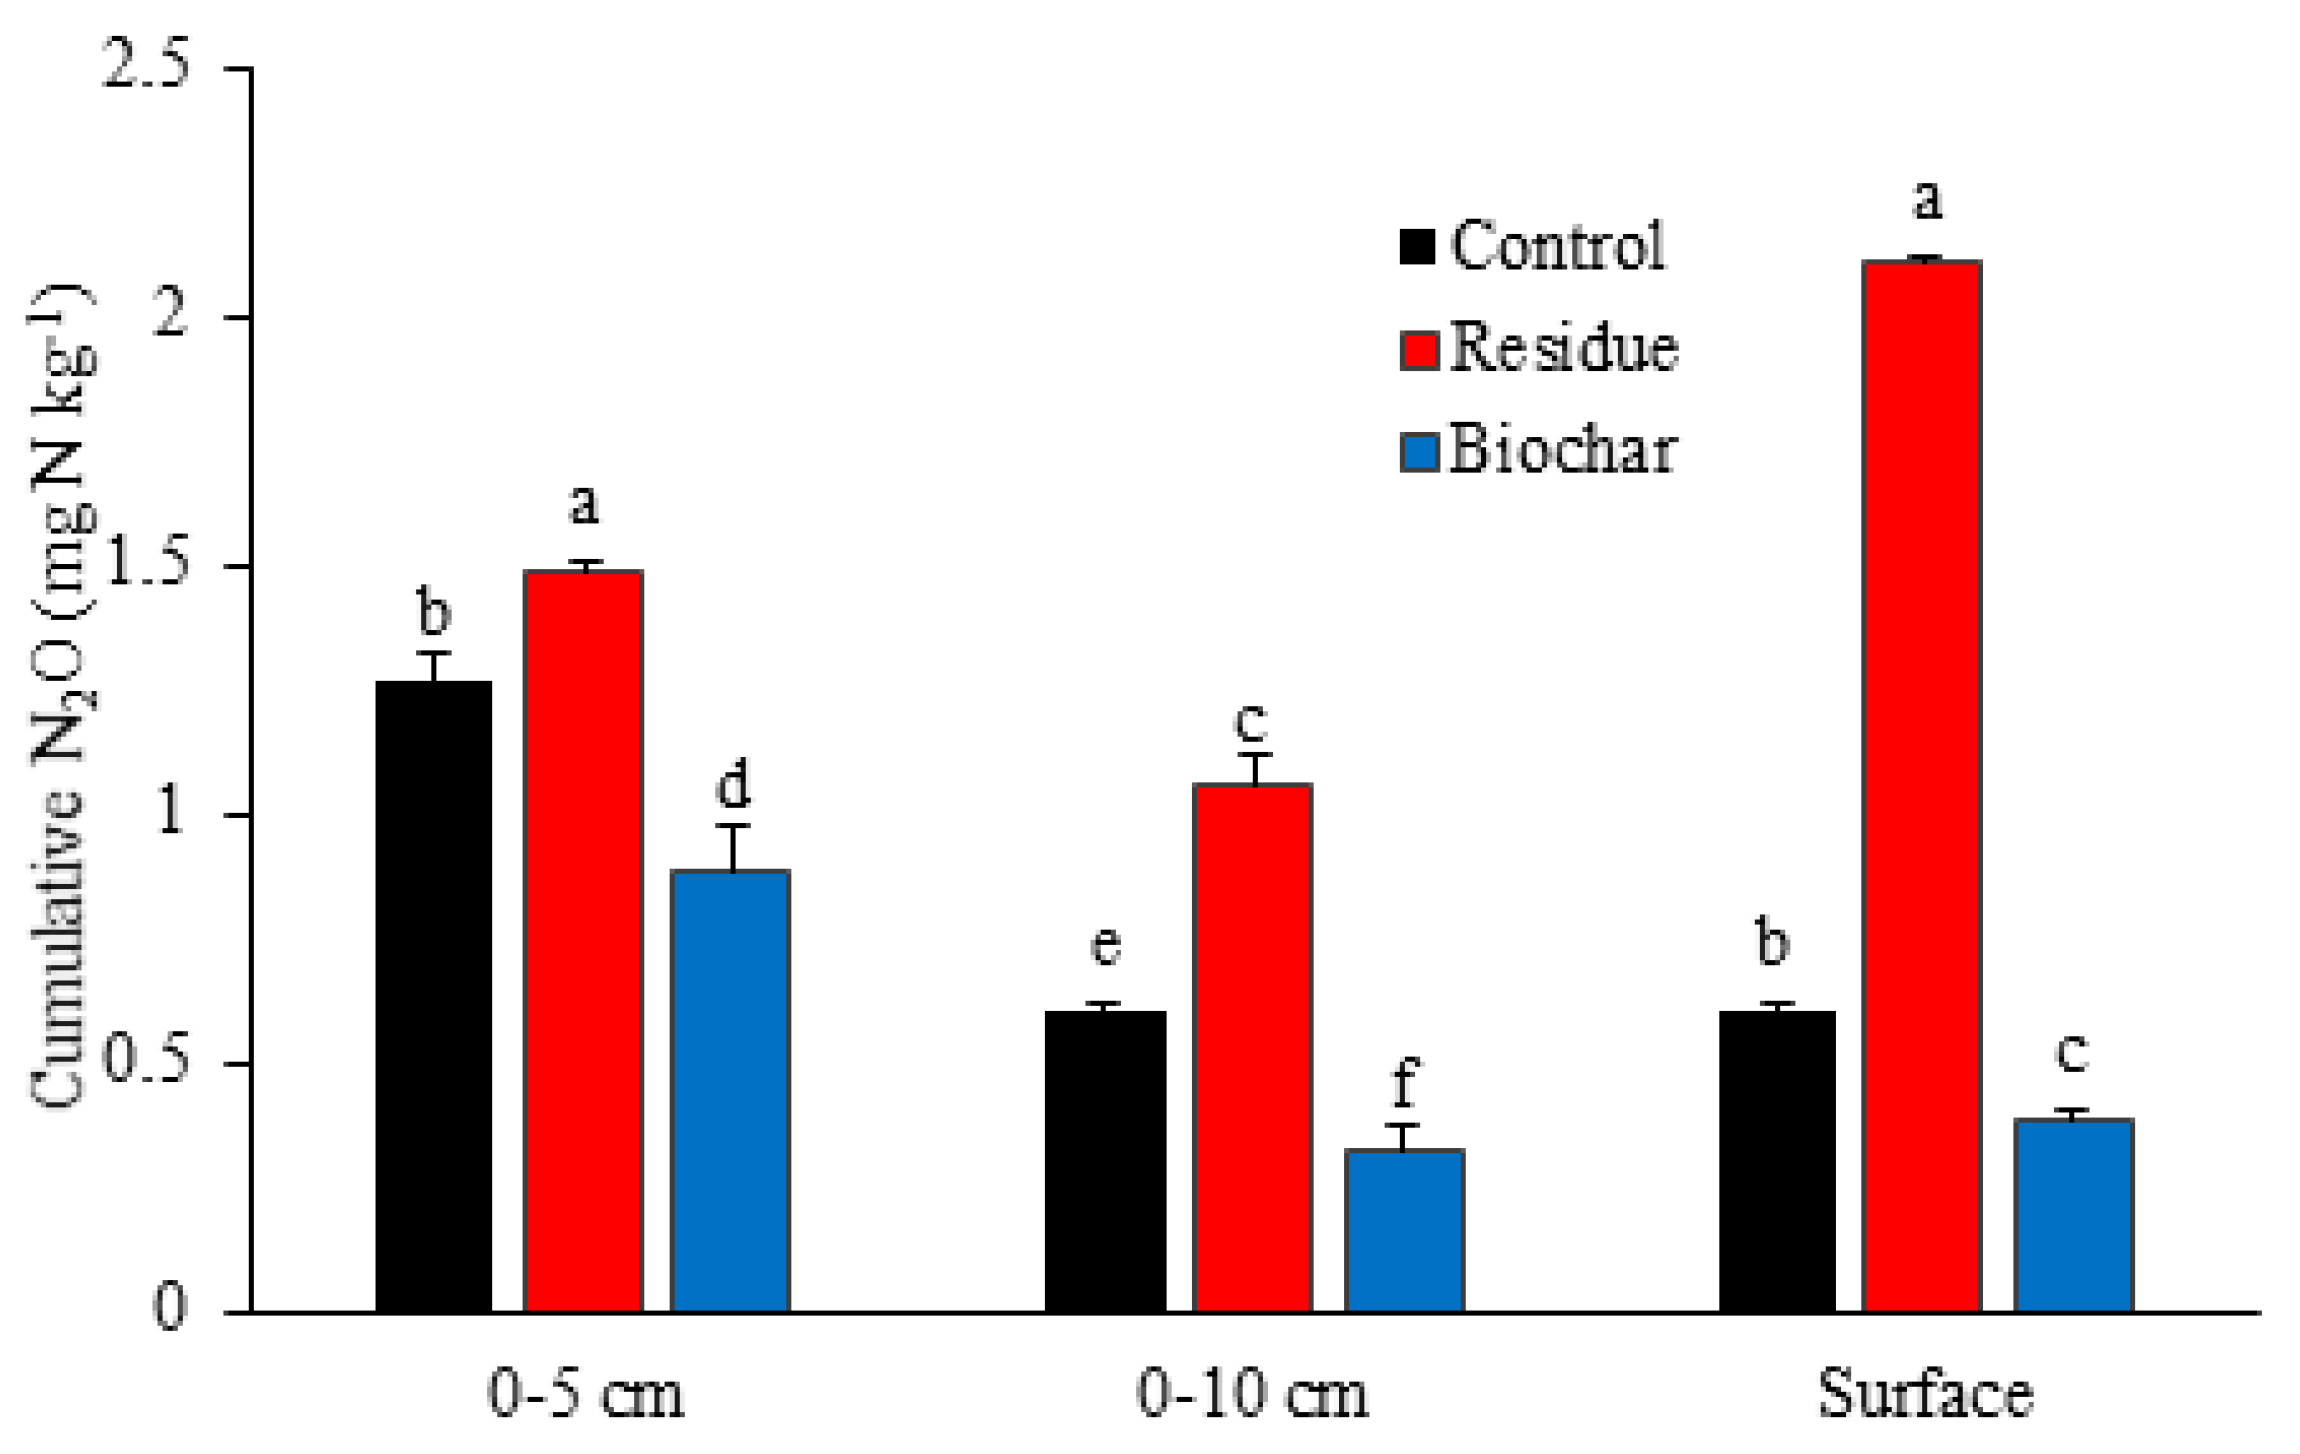
3.1. N2O Emissions
3.2. CO2 Emissions
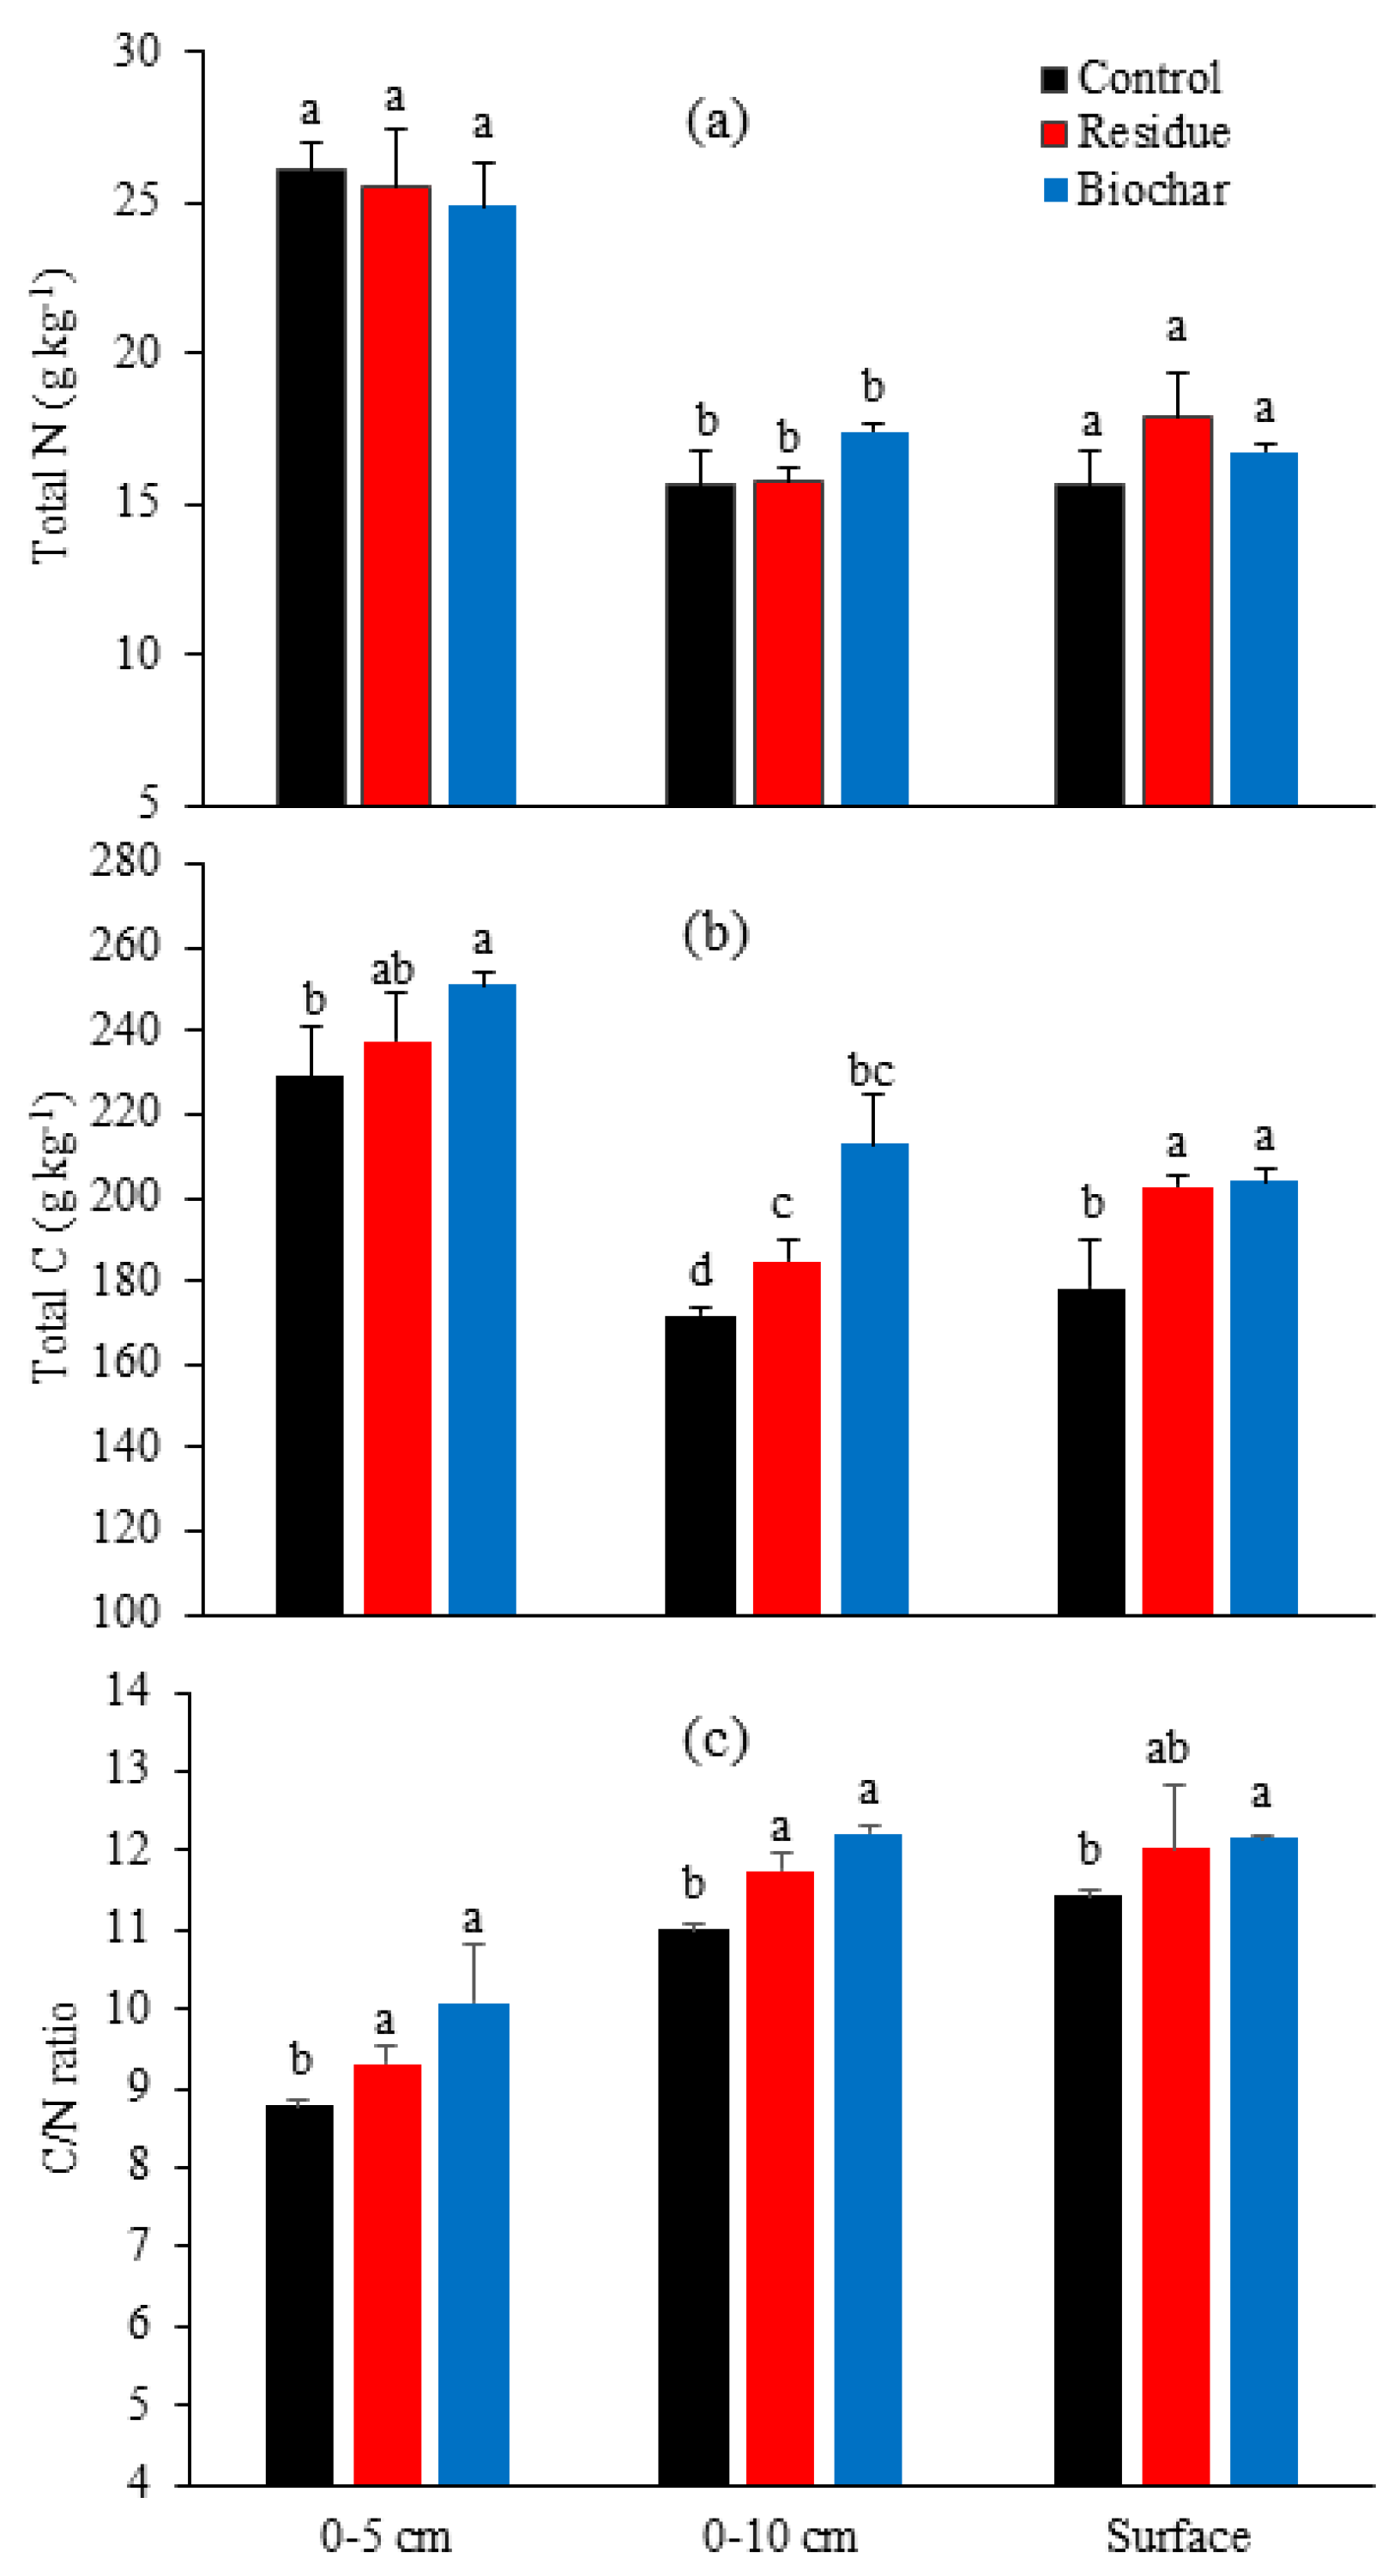
3.3. Soil Properties
3.4. Correlation of Cumulative Gas Emissions and Soil Properties
4. Discussion
4.1. N2O Emissions
4.2. CO2 Emissions
5. Conclusions
Acknowledgments
Author Contributions
Conflicts of Interest
References
- Ravishankara, A.R.; Daniel, J.S.; Portmann, R.W. Nitrous oxide (N2O): The dominant ozone-depleting substance emitted in the 21st century. Science 2009, 326, 123–125. [Google Scholar] [CrossRef] [PubMed]
- World Meteorological Organization 2010: WMO Greenhouse Gas Bulletin: The State of Greenhouse Gases in the Atmosphere Based on Observations through 2009. Available online: http://www.wmo.int/gaw/ (accessed on 24 November 2010).
- Ciais, P.; Sabine, C. Carbon and other biogeochemical cycles. In Climate Change 2013: The Physical Science Basis; Stocker, T.F., Qin, D., Plattner, G.K., Tignor, M., Allen, S.K., Boschung, J., Nauels, A., Xia, Y., Bex, V., Midgley, P.M., Eds.; Contribution of Working Group I to the Fifth Assessment Report of the Intergovernmental Panel on Climate Change; Cambridge University Press: Cambridge, UK; New York, NY, USA, 2013. [Google Scholar]
- Intergovernmental Panel on Climate Change (IPCC). Climate Change 2014: Synthesis Report; Contribution of Working Groups I, II and III to the Fifth Assessment Report of the Intergovernmental Panel on Climate Change; Technical Report; IPCC: Geneva, Switzerland, 2014; Available online: https://www.ipcc.ch/report/ar5/syr/ (accessed on 26 March 2015).
- Bellarby, J.; Foereid, B.; Hastings, A. Cool Farming: Climate Impacts of Agriculture and Mitigation Potential; Greenpeace International: Amsterdam, The Netherlands, 2008. [Google Scholar]
- Lal, R. World crop residues production and implications of its use as a biofuel. Environ Int. 2005, 31, 575–584. [Google Scholar] [CrossRef] [PubMed]
- Li, J.; Zhao, B.; Li, X.; Jiang, R.; Bing, S.H. Effects of long term combined application of organic and mineral fertilizers on microbial biomass, soil enzyme activities and soil fertility. Agric. Sci. China 2008, 7, 336–343. [Google Scholar] [CrossRef]
- Aulakh, M.S.; Khera, T.S.; Doran, J.W.; Bronson, K.F. Denitrification, N2O and CO2 fluxes in rice-wheat cropping system as affected by crop residues, fertilizer N and legume green manure. Biol. Fertil. Soils 2001, 34, 375–389. [Google Scholar] [CrossRef]
- Chen, H.; Li, X.; Hu, F.; Shi, W. Soil nitrous oxide emissions following crop residue addition: A meta-analysis. Glob. Chang. Biol. 2013, 19, 2956–2964. [Google Scholar] [CrossRef] [PubMed]
- Baggs, E.M.; Rees, R.M.; Smith, K.A.; Vinten, A.J.A. Nitrous oxide emission from soils after incorporating crop residues. Soil Use Manag. 2000, 16, 82–87. [Google Scholar] [CrossRef]
- Henderson, S.L.; Dandie, C.E.; Patten, C.L.; Zebarth, B.J.; Burton, D.L.; Trevors, J.T.; Goyer, C. Changes in denitrifier abundance, denitrification gene mRNA levels, nitrous oxide emissions, and denitrification in anoxic soil microcosms amended with glucose and plant residues. Appl. Environ. Microbiol. 2010, 76, 2155–2164. [Google Scholar] [CrossRef] [PubMed]
- Jiang, J.; Huang, Y.; Zong, L. Influence of water controlling and straw application on CH4 and N2O emissions from rice field. China Environ. Sci. 2003, 23, 552–556. [Google Scholar]
- Ma, J.; Li, X.; Xu, H.; Han, Y.; Cai, Z.; Yagi, K. Effects of nitrogen fertilizer and wheat straw application on CH4 and N2O emissions from a paddy rice field. Aust. J. Soil Res. 2007, 45, 359–367. [Google Scholar] [CrossRef]
- Velthof, G.L.; Kuikman, P.J.; Oenema, O. Nitrous oxide emission from soil amended with crop residues. Nutr. Cycl. Agroecosyt. 2002, 62, 249–261. [Google Scholar] [CrossRef]
- Lehmann, J.; Gaunt, J.; Rondon, M. Bio-char Sequestration in Terrestrial Ecosystems—A Review. Mitig. Adapt. Strateg. Glob. Ghang. 2006, 11, 395–419. [Google Scholar] [CrossRef]
- Sohi, S.P.; Krull, E.; Lopez-Capel, E.; Bol, R. A review of biochar and its use and function in soil. Adv. Agron. 2010, 105, 47–82. [Google Scholar] [CrossRef]
- Singla, A.; Iwasa, H.; Inubushi, K. Effect of biogas digested slurry based-biochar and digested liquid on N2O, CO2 flux and crop yield for three continuous cropping cycles of komatsuna (Brassica rapa var. perviridis). Biol. Fertil. Soils 2014, 50, 1201–1209. [Google Scholar] [CrossRef]
- Yanai, Y.; Toyota, K.; Okazaki, M. Effects of charcoal addition on N2O emissions from soil resulting from rewetting air-dried soil in short-term laboratory experiments. Soil Sci. Plant Nutr. 2007, 53, 181–188. [Google Scholar] [CrossRef]
- Clough, T.J.; Bertram, J.E.; Ray, J.L.; Condron, L.M.; O’Callaghan, M.; Sherlock, R.R.; Wells, N.S. Unweathered wood biochar impact on nitrous oxide emissions from a bovine-urine-amended pasture soil. Soil Sci. Soc. Am. J. 2010, 74, 852–860. [Google Scholar] [CrossRef]
- Van Zwieten, L.; Kimber, S.; Morris, S.; Downie, A.; Berger, E.; Rust, J.; Scheer, C. Influence of biochars on flux of N2O and CO2 from Ferrosol. Aust. J. Soil Res. 2010, 48, 555–568. [Google Scholar] [CrossRef]
- Saarnio, S.; Heimonen, K.; Kettunen, R. Biochar addition indirectly affects N2O emissions via soil moisture and plant N uptake. Soil Biol. Biochem. 2013, 58, 99–106. [Google Scholar] [CrossRef]
- Cayuela, M.L.; Sa´nchez-Monedero, M.A.; Roig, A.; Hanley, K.; Enders, A.; Lehmann, J. Biochar and denitrification in soils: When, how much and why does biochar reduce N2O emissions? Sci. Rep. 2013, 3, 1732. [Google Scholar] [CrossRef] [PubMed]
- Fidel, R.B.; Laird, D.A.; Parkin, T.B. Impact of Biochar Organic and Inorganic Carbon on Soil CO2 and N2 O Emissions. J. Environ. Qual. 2017, 46, 505–513. [Google Scholar] [CrossRef] [PubMed]
- Oo, A.Z.; Sudo, S.; Akiyama, H.; Win, K.T.; Shibata, A.; Yamamoto, A.; Sano, T.; Hirono, Y. Effect of dolomite and biochar on N2O and CO2 emissions from acidic tea field soil. PLoS ONE 2018, 13, e0192235. [Google Scholar] [CrossRef] [PubMed]
- Jumadi, S.; Hala, Y.; Inubushi, K. Production and emission of nitrous oxide and responsible microorganisms in upland acid soil in Indonesia. Soil Sci. Plant Nutr. 2005, 51, 693–696. [Google Scholar] [CrossRef]
- Han, W.; Xu, J.; Wei, K.; Shi, Y.; Ma, L. Estimation of N2O emission from tea garden soils, their adjacent vegetable garden and forest soils in eastern China. Environ. Earth Sci. 2013, 70, 2495–2500. [Google Scholar] [CrossRef]
- Akiyama, H.; Yan, X.; Yagi, K. Estimations of emission factors for fertilizer-induced direct N2O emissions from agricultural soils in Japan: Summary of available data. Soil Sci. Plant Nutr. 2006, 52, 774–787. [Google Scholar] [CrossRef]
- Sudo, S. Method and Instrument for Measuring Atmospheric Gas. Industrial Property Digital Library. Japan Patent No. 2006-275844, 12 October 2006. [Google Scholar]
- Shan, J.; Yan, X. Effects of crop residue returning on nitrous oxide emissions in agricultural soils. Atmos. Environ. 2013, 71, 170–175. [Google Scholar] [CrossRef]
- Miller, M.N.; Zebarth, B.J.; Dandie, C.E.; Burton, D.L.; Goyer, C.; Trevors, J.T. Crop residue influence on denitrification, N2O emissions and denitrifier community abundance in soil. Soil Biol. Biochem. 2008, 40, 2553–2562. [Google Scholar] [CrossRef]
- Gillam, K.M.; Zebarth, B.J.; Burton, D.L. Nitrous oxide emissions from denitrification and the partitioning of gaseous losses as affected by nitrate and carbon addition and soil aeration. Can. J. Soil Sci. 2008, 88, 133–143. [Google Scholar] [CrossRef]
- Lehtinen, T.; Schlatter, N.; Baumgarten, A.; Bechini, L.; Krüger, J.; Grignani, C.; Zavattaro, L.; Costamagna, C.; Spiegel, H. Effect of crop residue incorporation on soil organic carbon and greenhouse gas emissions in European agricultural soils. Soil Use Manag. 2014, 30, 524–538. [Google Scholar] [CrossRef]
- Gentile, R.; Vanlauwe, B.; Chivenge, P.; Six, J. Interactive effects from combining fertilizer and organic residue inputs on nitrogen transformations. Soil Biol. Biochem. 2008, 40, 2375–2384. [Google Scholar] [CrossRef]
- Wu, Y.; Lin, S.; Liu, T.; Wan, T.; Hu, R. Effect of crop residue returns on N2O emissions from red soil in China. Soil Use Manag. 2016, 32, 80–88. [Google Scholar] [CrossRef]
- Muhammad, W.; Vaughan, S.M.; Dalal, R.C.; Menzies, N.W. Crop residues and fertilizer nitrogen influence residue decomposition and nitrous oxide emission from a Vertisol. Biol. Fertil. Soils 2011, 47, 15–23. [Google Scholar] [CrossRef]
- Baggs, E.M.; Stevenson, M.; Pihlatie, M.; Regar, A.; Cook, H.; Cadisch, G. Nitrous oxide emissions following application of residues and fertilizer under zero and conventional tillage. Plant Soil 2003, 254, 361–370. [Google Scholar] [CrossRef]
- Signor, D.; Cerri, C.E.P. Nitrous oxide emissions in agricultural soils: A review. Pesq. Agropec. Trop. 2013, 43, 322–338. [Google Scholar] [CrossRef]
- Tokuda, S.; Hayatsu, M. Nitrous oxide emission potential of 21 acidic tea field soils in Japan. Soil Sci. Plant Nutr. 2001, 47, 637–642. [Google Scholar] [CrossRef]
- Oo, A.Z.; Sudo, S.; Win, K.T.; Shibata, A.; Gonai, T. Influence of pruning waste biochar and oyster shell on N2O and CO2 emissions from Japanese pear orchard soil. Heliyon 2018, 4, e00568. [Google Scholar] [CrossRef]
- Liu, B.; Morkved, P.T.; Frostegard, A.; Bakken, L.R. Denitrification gene pools, transcription and kinetics of NO, N2O and N2 production as affected by soil pH. FEMS Microbiol. Ecol. 2010, 72, 407–417. [Google Scholar] [CrossRef] [PubMed]
- Ameloot, N.; De Neve, S.; Jegajeevagan, K.; Yildiz, G.; Buchan, D.; Funkuin, Y.N.; Prins, W.; Bouckaert, L.; Sleutel, S. Short-term CO2 and N2O emissions and microbial properties of biochar amended sandy loam soils. Soil Biol. Biochem. 2013, 57, 401–410. [Google Scholar] [CrossRef]
- Geisseler, D.; Horwath, W.R.; Joergensen, R.G.; Ludwig, B. Pathways of nitrogen utilization by soil microorganisms—A review. Soil Biol. Biochem. 2010, 42, 2058–2067. [Google Scholar] [CrossRef]
- Guo, J.; Peng, Y.; Wang, S.; Ma, B.; Ge, S.; Wang, Z.; Huang, H.; Zhang, J.; Zhang, L. Pathways and organisms involved in ammonia oxidation and nitrous oxide emission. Crit. Rev. Environ. Sci. Technol. 2013, 43, 2213–2296. [Google Scholar] [CrossRef]
- Ernfors, M.; von Arnold, K.; Stendahl, J.; Olsson, M.; Klemedtsson, L. Nitrous oxide emissions from drained organic forest soils—An up-scaling based on C/N ratios. Biogeochemistry 2007, 84, 219–231. [Google Scholar] [CrossRef]
- Feng, Z.; Zhu, L. Impact of biochar on soil N2O emissions under different biochar-carbon/fertilizer-nitrogen ratios at a constant moisture condition on a silt loam soil. Sci. Total Environ. 2017, 15, 584–585. [Google Scholar] [CrossRef]
- Hadas, A.; Kautsky, L.; Goek, M.; Kara, E.E. Rates of decomposition of plant residues and available nitrogen in soil, related to residue composition through simulation of carbon and nitrogen turnover. Soil Biol. Biochem. 2004, 36, 255–266. [Google Scholar] [CrossRef]
- He, Y.; Zhou, X.; Jiang, L.; Li, M.; Du, Z.; Zhou, G.; Shao, J.; Wang, X.; Xu, Z.; Bai, S.H.; et al. Effects of biochar application on soil greenhouse gas fluxes: A meta-analysis. Glob. Chang. Biol. 2017, 9, 743–755. [Google Scholar] [CrossRef]
- Liu, S.W.; Zhang, Y.J.; Zong, Y.J.; Hu, Z.; Wu, S.; Zhou, J.; Jin, Y.; Zou, J. Response of soil carbon dioxide fluxes, soil organic carbon and microbial biomass carbon to biochar amendment: A meta-analysis. Glob. Chang. Biol. Bioenergy 2016, 8, 392–406. [Google Scholar] [CrossRef]
- Cross, A.; Sohi, S.P. The priming potential of biochar products in relation to labile carbon contents and soil organic matter status. Soil Biol. Biochem. 2011, 43, 2127–2134. [Google Scholar] [CrossRef]
- Zimmerman, A.R.; Gao, B.; Ahn, M.Y. Positive and negative carbon mineralization priming effects among a variety of biochar-amended soils. Soil Biol. Biochem. 2011, 43, 1169–1179. [Google Scholar] [CrossRef]
- Chia, C.H.; Singh, B.P.; Joseph, S.; Graber, E.R.; Munroe, P. Characterization of an enriched biochar. J. Anal. Appl. Pyrolysis 2014, 108, 26–34. [Google Scholar] [CrossRef]
- Hernandez-Soriano, M.C.; Kerré, B.; Kopittke, P.M.; Horemans, B.; Smolders, E. Biochar affects carbon composition and stability in soil: A combined spectroscopy-microscopy study. Sci. Rep. 2016, 6, 25127. [Google Scholar] [CrossRef] [PubMed]
- Nguyen, D.H.; Scheer, C.; Rowlings, D.W.; Grace, P.R. Rice husk biochar and crop residue amendment in subtropical cropping soils: Effect on biomass production, nitrogen use efficiency and greenhouse gas emissions. Biol. Fertil. Soils 2016, 52, 261–270. [Google Scholar] [CrossRef]
- Lehmann, J.; Rillig, M.C.; Thies, J.; Masiello, C.A.; Hockaday, W.C.; Crowley, D. Biochar effects on soil biota—A review. Soil Biol. Biochem. 2011, 43, 1812–1836. [Google Scholar] [CrossRef]
- García, S.; Gil, M.V.; Martín, C.F.; Pis, J.J.; Rubiera, F.; Pevida, C. Breakthrough adsorption study of a commercial activated carbon for pre-combustion CO2 capture. Chem. Eng. J. 2011, 171, 549–556. [Google Scholar] [CrossRef]


| Materials | Total C (g kg−1) | Total N (g kg−1) | C/N Ratio | NH4+ (mg kg−1) | NO3− (mg kg−1) | pH (H20) | EC (µS cm−1) | Sand (%) | Silt (%) | Clay (%) |
|---|---|---|---|---|---|---|---|---|---|---|
| Soil | 57.7 | 6.5 | 8.9 | 259.1 | 107.5 | 3.08 | 748 | 19 | 33 | 48 |
| Total C (g kg−1) | Total N (g kg−1) | C/N Ratio | pH (H20) | Surface area (BET) (m2 g−1) | EC (mS cm−1) | |||||
| Biochar | 482.4 | 19.2 | 25.2 | 10.2 | 2.7 | 7.3 | ||||
| Items | Experiment 1 | Experiment 2 | ||||
|---|---|---|---|---|---|---|
| Objective | To study the effect of incorporation depth on soil GHG emissions | To study the effect of surface application on soil GHG emissions | ||||
| Soil layer used | Two different depths: 0–5 cm and 0–10 cm soil layers | Only 0–10 cm soil layer | ||||
| Treatments | (1) Control | (2) Pruning residue | (3) Residue biochar | (1) Control | (2) Pruning residue | (3) Residue biochar |
| Incubation condition | 80% WFPS and 25 °C | 80% WFPS and 25 °C | ||||
© 2018 by the authors. Licensee MDPI, Basel, Switzerland. This article is an open access article distributed under the terms and conditions of the Creative Commons Attribution (CC BY) license (http://creativecommons.org/licenses/by/4.0/).
Share and Cite
Oo, A.Z.; Sudo, S.; Win, K.T.; Shibata, A.; Sano, T.; Hirono, Y. Returning Tea Pruning Residue and Its Biochar Had a Contrasting Effect on Soil N2O and CO2 Emissions from Tea Plantation Soil. Atmosphere 2018, 9, 109. https://doi.org/10.3390/atmos9030109
Oo AZ, Sudo S, Win KT, Shibata A, Sano T, Hirono Y. Returning Tea Pruning Residue and Its Biochar Had a Contrasting Effect on Soil N2O and CO2 Emissions from Tea Plantation Soil. Atmosphere. 2018; 9(3):109. https://doi.org/10.3390/atmos9030109
Chicago/Turabian StyleOo, Aung Zaw, Shigeto Sudo, Khin Thuzar Win, Akira Shibata, Tomohito Sano, and Yuhei Hirono. 2018. "Returning Tea Pruning Residue and Its Biochar Had a Contrasting Effect on Soil N2O and CO2 Emissions from Tea Plantation Soil" Atmosphere 9, no. 3: 109. https://doi.org/10.3390/atmos9030109
APA StyleOo, A. Z., Sudo, S., Win, K. T., Shibata, A., Sano, T., & Hirono, Y. (2018). Returning Tea Pruning Residue and Its Biochar Had a Contrasting Effect on Soil N2O and CO2 Emissions from Tea Plantation Soil. Atmosphere, 9(3), 109. https://doi.org/10.3390/atmos9030109