Abstract
We have performed large-eddy simulations (LES) to study the effect of complex land topography on the atmospheric boundary layer (ABL) in coastal areas. The areas under investigation are located at three beaches in Monterey Bay, CA, USA. The sharp-interface immersed boundary method is employed to resolve the land topography down to grid scale. We have considered real-time and what-if cases. In the real-time cases, measurement data and realistic land topographies are directly incorporated. In the what-if cases, the effects of different scenarios of wind speed, wind direction, and terrain pattern on the momentum flux at the beach are studied. The LES results are compared with simulations using the Coupled Ocean/Atmosphere Mesoscale Prediction System (COAMPS) and field measurement data. We find that the land topography imposes a critical influence on the ABL in the coastal area. The momentum fluxes obtained from our LES agree with measurement data. Our results indicate the importance of capturing the effects of land topographies in simulations.
1. Introduction
The present-day simulation and operational forecasting tools are limited in their ability to compute coastal land–air–sea interactions. The parameterizations used by these tools are usually derived from open-ocean problems. As a result, many unique features and complex processes in littoral regions, such as the increase of surface roughness in a surf zone [1,2,3] and the abrupt change in sea–land terrain, have not been addressed.
Mesoscale numerical weather prediction (NWP) models discretize the atmosphere into horizontal scales of O(10–10) m and vertical scales of O(10–10) m [4,5,6]. These models are typically forced by a coarser scale regional or global model or analysis dataset, and may nest one or several meshes to achieve the desired spatial scale at a location of interest. The finest resolution is typically around 1–3 km; smaller grid scales can be used in computation, but the physics parameterizations are generally not designed to address resolved turbulent eddies. Grid scales of 1–3 km often cannot capture the change in surface roughness in coastal areas. For example, the land elevation changes 4 m within a horizontal distance of 40 m at the Elkhorn Slough Beach under investigation. Due to the use of grid scale of 1 km, the land is seen as flat in a grid cell, and the change of land elevation is smeared. As a result, physics-based parameterizations are called for.
Motivated by the critical need to develop physics-based parameterizations in coastal areas, a project called coastal land–air–sea interactions (CLASI) has been carried out. The ultimate goal of this project is to help improve the performance of COAMPS (Coupled Ocean/Atmosphere Mesoscale Prediction System) in the coastal area. As the first step of this project, we test the capability of LES of capturing effects of complex land topographies on the air flow through comparison with in situ field measurement. Field measurements have been conducted in Monterey Bay, CA, USA [3]. In the collaborative numerical study, we have developed a novel computational framework to perform large-eddy simulation (LES) of atmospheric boundary layer (ABL) with field measurement data and realistic land topographies incorporated into the simulations. The complex topographies of land, such as dunes, beaches, and rivers, are directly captured in our simulation using the immersed boundary (IB) method [7], such that we do not need to use flat-surface approximation with surface roughness variation only. The LES results are compared with field measurements and simulations of Coupled Ocean/Atmosphere Mesoscale Prediction System (COAMPS) [4]. We have also conducted what-if LES cases to study the effects of wind speed, wind direction, and terrain pattern on the momentum flux and wind stress.
2. Study Cases
Table 1 summarizes the cases studied. We have conducted three real-time cases and five what-if cases. The sites of the three real-time cases, namely cases ESB1, MAB, and DMB, are located at the Elkhorn Slough Beach (ESB), Marina Beach (MAB), and Del Monte Beach (DMB), respectively. The image of the Monterey Bay and the zoom-in images of the three beaches are shown in Figure 1. We validate the LES results against measurement data at six locations. As shown in Figure 1b–d, A and B are located at ESB; C, D, and E at MAB; and F at DMB. Locations A and C are over the sea, and the measurements were conducted using the marine atmospheric profiling system carried by a Rigid-Hulled Inflatable Boat (RHIB). Locations B, D, and F are at the beach, where beach flux towers were used to measure the airflow. Location E is inland, and the measurement data were obtained from the Naval Postgraduate School (NPS) inland station. The what-if cases are hypothetical variations of case ESB1. Cases ESB2–ESB4 are conducted to study the effect of the wind speed. The inlet wind speeds of cases ESB2, ESB3, and ESB4 are , , and that of case ESB1, respectively. Cases ESB5 and ESB6 are performed to assess the effects of the wind direction and land topography, respectively. In case ESB5, the wind blows from land to ocean, and the inlet wind speed is the same as that in case ESB1. Note that although cases ESB2–ESB5 are what-if cases, the condition of wind speed and wind direction in these cases can take place in the real world according to the field measurement data shown in below. In case ESB6, the land is assumed flat everywhere with the elevation set to the sea level, and the inlet wind is the same as in case ESB1.

Table 1.
Summary of the location, date, and time of large-eddy simulations (LES) cases.
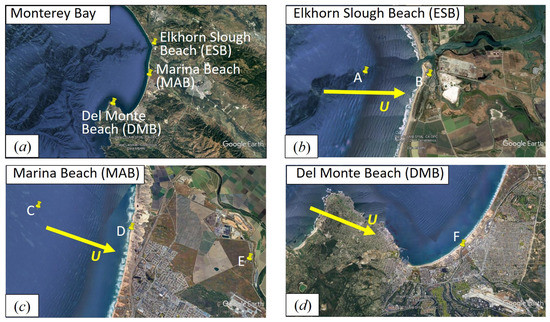
Figure 1.
Locations of simulation cases obtained from Google Earth. (a) Monterey Bay, (b) Elkhorn Slough Beach (ESB), (c) Marina Beach (MAB), (d) Del Monte Beach (DMB). The arrows represent the wind direction. The large-eddy simulations (LES) results are validated against measurement data at locations (A–F) at three different beaches as marked in (b–d).
3. Numerical Methods
The LES is performed using an in-house numerical code called Virtual Wind Simulator (VWiS) [7,8,9]. Let , , and (or, x, y, and z) denote the the streamwise, spanwise, and vertical directions, respectively. The velocity vector is a function of x, y, z, and time t. The present numerical code solves the following continuity and momentum equations of incompressible airflow,
Here, represents the density, p the pressure, the kinematic viscosity, and the subgrid-scale (SGS) stress tensor, calculated using the dynamic Smagorinsky model [10]. According to the measurement data, the Monin-Obukhov length was significantly larger than the boundary layer depth, indicating that the stratification condition was close to neutral. We have rerun case ESB1 with the buoyancy effect incorporated, and it was confirmed that the effect of the density stratification on the flow dynamics is negligible. As a result, the buoyancy is neglected, and the temperature is not simulated in the present LES study.
Equation (2) is discretized using the second-order central difference scheme. The second-order Runge-Kutta method is used for the time integration. The advection and SGS terms are calculated explicitly, while the viscous term is advanced implicitly. The fractional-step method [11] is employed to satisfy the divergence-free condition given by Equation (1). The Poisson equations are solved using an open-source math library called Portable, Extensible Toolkit for Scientific Computation (PETSc) [12]. The details of VWiS are given in Yang et al. [7].
A unique feature and major challenge in the simulation of ABL in littoral areas is the complex land topography. To address this issue, we use an LES tool called CURVIB-LES [13,14]. The CURVIB-LES is based on the IB method [15]. With the use of the IB method, there is no need to generate topography-conforming grid, and simulations can be performed using efficient flow solvers on regular Eulerian grid. The CURVIB-LES code has been extensively validated for many applications [7,14,16,17,18,19]. The land elevation is obtained from the database of the National Oceanic and Atmospheric Administration (NOAA). Because the wave amplitude is much smaller than the land elevation, the sea surface is treated as a flat bottom of the simulation domain, with the roughness given by the Charnock relationship [20]
Here, is the Charnock coefficient, the friction velocity, and the gravitational acceleration. Following Shabani et al. [1], the value of is set to 0.01 and 0.11 for open ocean and surf zone, respectively. To determine , we use the field measurement data of time-averaged wind speed at . To be more specific, the wind profile is determined using the logarithmic law with surface roughness as
Combining Equations (3) and (4) and using the measurement data result in an algebraic equation for , which can be solved using an iteration approach.
At the inlet of the computational domain, Equation (4) is used to determine the mean streamwise velocity, while the method of Mann [21] is used to generate the turbulence fluctuations. Specifically, the velocity fluctuations are calculated as . Here, Taylor’s frozen turbulence hypothesis is used to convert an instantaneous three-dimensional (3D) velocity field to a time series of two-dimensional velocity field at the inlet . The bulk mean wind speed V is the vertical average of the mean steamwise velocity . The 3D velocity fluctuation is calculated as
The summation is carried out over all wavenumber vectors , with . Here, is the computational domain size in the i-direction, and m is an integer number ranging from to , where is the number of grid points in the i-direction. Each for a specific wavenumber vector in Equation (5) is a Gaussian stochastic complex variable with unit variance. The coefficient is determined based on the velocity spectral tensor developed by Mann [22]. The detailed method for calculating and are given in Mann [21]. Note that the inflow given by Equations (4) and (5) is a synthetic turbulent flow, which is not necessarily physical. However, because the flow in the computational domain follows the governing Equations (1) and (2), the turbulence becomes physical progressively as the wind goes downstream. In this sense, the distance between the inlet and the area of interest needs to be sufficiently large. In the present study, we focus on the beach area, which is approximately 3.5 km from the inlet. We find that after 500 m from the inlet, the turbulence statistics over the open ocean do not change significantly in the streamwise direction, indicating that the wind turbulence becomes fully developed before the beach is reached.
Besides the bottom and inlet boundary conditions introduced above, the advection boundary condition is used at the outlet, and the free-slip condition is prescribed at the two side walls and top boundary. In all LES cases, the computational domain size is . The number of grid points is . The grid is uniform in the streamwise and spanwise directions with grid spacing of 15 m. The vertical grid spacing is 1.5 m at the bottom, with stretching towards the top boundary.
The COAMPS [4] is a non-hydrostatic NWP model with fully compressible equations discretized on an Arakawa-C grid in the horizontal direction and on a terrain-following sigma coordinate in the vertical direction. The prognostic equations of the atmospheric component of COAMPS solve three-dimensional wind (u, v, w), potential temperature, and the Exner function. In addition, predictive equations for the water vapor, microphysics (cloud water, cloud ice, rainwater, snow, and graupel concentrations), and turbulence kinetic energy are included. In this study, the model was forced by Navy Global Environmental Model (NAVGEM) [23] fields at the boundaries and initial time. The inner-most nested grid, centered over the Monterey Bay region, was grid points in the horizontal (333 m resolution) with 60 vertical levels (5 in the lowest 100 m). The boundary-layer turbulence is parameterized following the level 2.5 closure scheme of Mellor and Yamada [24] with the surface layer scheme of Louis [25] with revisions of Wang et al. [26]. Within the scheme of Mellor and Yamada [24], the eddy viscosity and eddy diffusivity coefficients are computed at every model grid point as functions of the flux Richardson number, the turbulence kinetic energy and the turbulent mixing length scale following [27]. This approach to modeling the atmospheric boundary layer in COAMPS performs well on the open ocean when verified against observations [28,29,30]. This approach to modeling the atmospheric boundary layer in COAMPS performs well when verified against observations [28,29,30,31]. Forecasts of between one and 12 h lead time from the grid points nearest to selected latitude/longitude points were used to extract profiles to force the LES domains.
4. Results
Figure 2a shows the time-averaged streamwise velocity U at three y–z planes 1, 2, and 3 and at one x–z plane 4 in case ESB1. The land elevation above sea level is also shown in the figure. The distances between planes 1 and 2 and between planes 2 and 3 are both 2.5 km. The time-averaging is carried out over 30 min. The spanwise profiles of U at at planes 1, 2, and 3 are compared in Figure 2b. As shown in both Figure 2a,b, at plane 1 over the open ocean, the flow field is relatively homogeneous in the spanwise direction. In contrast, inhomogeneity exhibits in the mean velocity field at planes 2 and 3, located over the surf zone and land, respectively. The inhomogeneity at plane 3 can be attributed to the complex land topography in the upstream. However, the sea-surface boundary condition in the upstream of plane 2 is homogeneous in the spanwise direction. This indicates that the inhomogeneity at plane 2 is caused by the complex land topography in its downstream. At plane 4, the contours of U do not change significantly over the sea, but the abrupt change of the topography, such as the change from water to land at point 5, leads to the variation of U in the streamwise direction. In summary, Figure 2 shows that the mean velocity in the coastal area is influenced by the land topography.
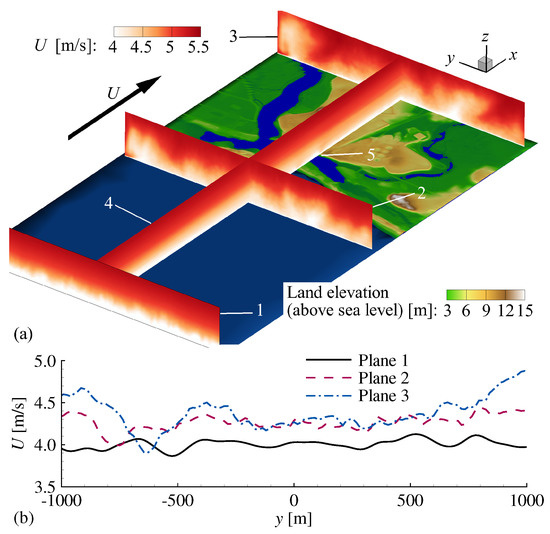
Figure 2.
Time-averaged streamwise velocity U in case ESB1 (Elkhorn Slough Beach). (a) Contours at three y–z planes and one x–z plane; and (b) spanwise profiles at at planes 1, 2, and 3.
To further study the importance of land topography in the coastal area, we compare the time-averaged wind speed U obtained from LES, COAMPS, and field measurements in Figure 3. The results at all six measurement locations are shown here. It can be observed from Figure 3 that the agreement between the LES results and the measurement data is reasonable. In case MAB, the results of COAMPS agree with the LES results. However, disagreements between COAMPS and LES results in cases ESB1 and DMB are evident. The discrepancies between COAMPS and LES results are expected, considering the differences in the governing equations, numerical schemes, grid resolutions exhibited between these two models.
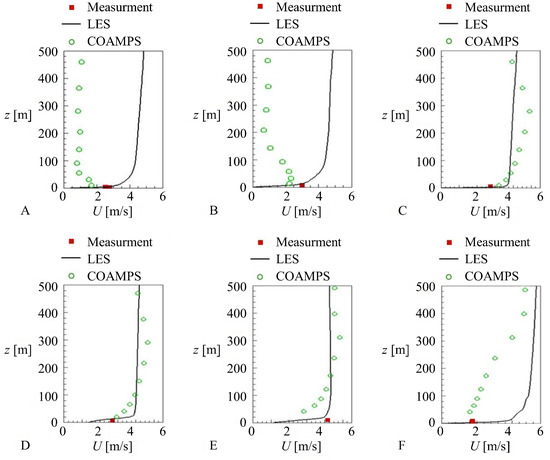
Figure 3.
Profiles of mean streamwise velocity U at locations (A), and (B) in case ESB1, (C–E) in case MAB (Marina Beach), and (F) in case DMB (Del Monte Beach). See Figure 1 for locations A–F.
Next, we analyze the LES results of the momentum flux. Figure 4a,b shows the contours of of LES case ESB1 and the spanwise profiles of at at planes 1, 2, and 3, respectively. Similar to the mean streamwise velocity U displayed in Figure 2, is relatively homogeneous at plane 1, but becomes more inhomogeneous at planes 2 and 3. It can be also seen from plane 4 that over the sea changes little in the x-direction. In contrast, the magnitude of over the land increases noticeably as the air flows downstream. It is understood from Figure 4 that in comparison with the relatively flat surface of the sea, the complex land topography tends to enhance the turbulence in the coastal area, which in turn influences the momentum flux. It was also reported in previous studies of flows past hills, steps, and ribs that the turbulence mixing is enhanced due to the complex bottom geometry [31,32,33,34,35,36].
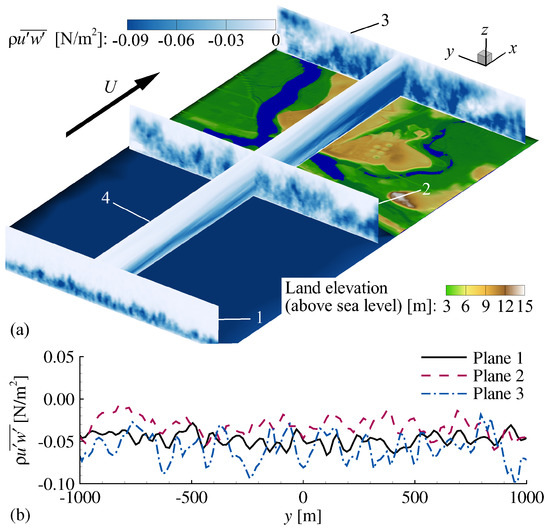
Figure 4.
Time-averaged turbulent momentum flux in case ESB1. (a) Contours at three y–z planes and one x–z plane, and (b) spanwise profiles at at planes 1, 2, and 3.
Figure 5 compares the LES and COAMPS results of the turbulence momentum flux against the measurement data. Note that the measurement data are available at a specific altitude of about 7 m above the sea level, but the LES can compute the value of at various altitudes. The results of LES shown in Figure 5 are at the altitude where measurements were made. The horizontal axis of Figure 5 represents the values of obtained from LES or COAMPS, while the vertical axis gives the values acquired in field measurements. The diagonal dashed line represents the perfect agreement between numerical and measurement results. It is shown in Figure 5 that all the LES results are located near the dashed line, indicating a good predictive performance of LES on . The COAMPS makes a good prediction at locations A and C, which are located over the open ocean. In contrast, the results of COAMPS at locations B, D, E, and F are far away from the dashed line. It is evident that the performance of COAMPS in the coastal area needs to the improved.
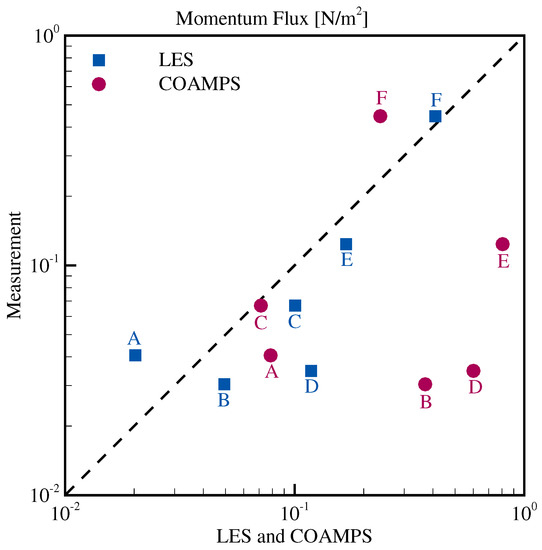
Figure 5.
Turbulence momentum flux obtained from LES and COAMPS (Coupled Ocean/Atmosphere Mesoscale Prediction System) versus field measurement results at locations A and B in case ESB1, C, D and E in case MAB, and F in case DMB. See Figure 1 for locations A–F.
To further study the effect of land topography on the turbulence momentum flux , we demonstrate as a function of the mean velocity U at location B obtained from cases ESB1–ESB6 in Figure 6. The measurement data at the same location are superposed for comparison. It can be seen from Figure 6 that the results of cases ESB1–ESB4 agree with the measurement data for the onshore-wind condition, indicating that the LES makes a good prediction on the momentum flux at different wind speeds. As expected, both LES and measurement indicate that the magnitude of increases with the wind speed. In cases ESB1, ESB5, and ESB6, the inlet wind speed is the same (Table 1), but the momentum flux varies. The momentum flux in case ESB5 is higher than that in case ESB1. This is because the wind in case ESB5 is offshore directed, and the turbulence at the beach is enhanced by the complex land topography in the upstream. The result of case ESB5 agrees with the measurement data for the offshore wind condition, indicating that capturing the complex land topography benefits the prediction of momentum flux at the beach for the offshore-wind condition. The momentum flux in case ESB6 is only one half that in case ESB1. The only difference in the setup between cases ESB1 and ESB6 is that the realistic land topography is used in case ESB1, but the land is treated as flat in case ESB6. With smoother downstream land topography in case ESB6, the momentum flux at the beach is smaller than that in case ESB1. From the comparison between cases ESB1 and ESB6, it is evident that capturing the land topography is also important for making a good prediction on the momentum flux in the coastal area when the wind is onshore directed. If the land topography is not properly captured as in case ESB6, the momentum flux at the beach is inaccurate.
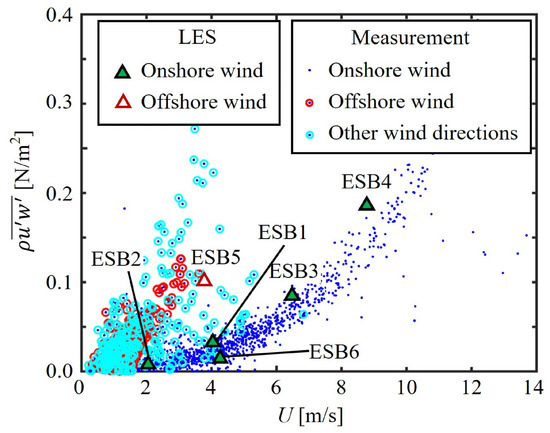
Figure 6.
Turbulence momentum flux versus mean velocity U at location B in cases ESB1–ESB6. The measurement data at the same location are superposed.
Figure 7 compares the LES and measurement results of the wind stress exerted at the land surface for the onshore-wind conditions. The results at location B in cases ESB1–ESB4, location D in case MAB, and location F in case DMB are shown here. In general, the LES results agree with the measurement data. In cases ESB1–ESB4, the wind stress increases with the wind speed, which is consistent with the measurement data. The measurement data show that the wind stress varies at different sites, which is also captured in the LES. From the comparison among the LES results of the wind stress at different beaches, it is known that the wind stress at the beach is sensitive to the land topography. This indicates that it is important to capture the land topography in the simulation of ABL in the coastal area, which is consistent with the conclusion drawn based on the comparison between cases ESB1 and ESB6 in Figure 6. The complex land topography cannot be captured in COAMPS by using only one or at most two grid points in the coastal area without proper parameterizations, for which research is called.
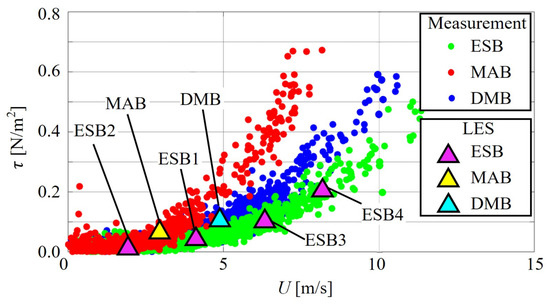
Figure 7.
Wind stress versus mean velocity U at three beaches, i.e., location B in cases ESB1–ESB4, location D in case MAB, and location F in case DMB. The measurement data at the same locations are superposed.
5. Conclusions
In this paper, we test the capability of LES in capturing the effect of complex land topographies on the ABL in coastal area. The site under consideration is located at three beaches in Monterey Bay, CA, USA. In LES, the land topography is captured by using the IB method. The waves on the sea surface are treated as roughness with an increased value in the surf zone. The LES results of real-time cases are compared with COAMPS and field measurement data.
The performance of LES is in general positive. With the ability of capturing the major variations of land topography, LES makes good predictions on the mean velocity and momentum flux. In contrast, owing to the averaging of surface roughness over 300 m in COAMPS, discrepancies between the COAMPS and measurement results of the momentum flux are seen in the coastal area. The results of what-if cases indicate that the momentum flux at the beach is sensitive to the wind speed, wind direction, and land topography. Note that even if the wind blows from ocean to land, i.e., the land is in the downstream of the beach, the land topography also influences the momentum flux at the beach.
The present study shows a critical need to capture the complex land topography in the coastal area in the simulation of the ABL. LES has been proven to be a powerful tool for providing flow details, which helps analyze the field measurement data and is potentially helpful for developing physical-based mesoscale models. Nesting LES into COAMPS may also help improve the prediction of ABL in the coastal area.
Acknowledgments
This research is supported by Office of Naval Research as part of the Coastal Land–Air–Sea Interactions (CLASI) project managed by Reginald Beach.
Author Contributions
A.C. and L.S. conceived and designed the numerical simulations; A.C. and F.S. contributed simulation tools; A.C., Z.Y. and S.H. performed the numerical simulations; J.D.D. and D.D.F. provided COAMPS simulation results; J.M. and Q.W. provided field measurement data; Z.Y. and A.C. analyzed the data; Z.Y., A.C., J.D.D., D.D.F., J.M., Q.W., B.K.H., H.C.G., and L.S. discussed the results; Z.Y. and L.S. wrote the paper.
Conflicts of Interest
The authors declare no conflict of interest.
Abbreviations
The following abbreviations are used in this manuscript:
| ABL | Atmospheric boundary layer |
| LES | Large-eddy simulation |
| COAMPS | Coupled Ocean/Atmosphere Mesoscale Prediction System |
| IB | Immersed boundary |
| ESB | Elkhorn Slough Beach |
| MAB | Marina Beach |
| DMB | Del Monte Beach |
| NPS | Naval Postgraduate School |
| UTC | Coordinated universal time |
References
- Shabani, B.; Nielsen, P.; Baldock, T. Direct measurements of wind stress over the surf zone. J. Geophys. Res. Oceans 2014, 119, 2949–2973. [Google Scholar] [CrossRef]
- Ortiz-Suslow, D.G.; Haus, B.K.; William, N.J.; Laxague, N.J.; Reniers, A.J.H.M.; Graber, H.C. The spatial–temporal variability of air–sea momentum fluxes observed at a tidal inlet. J. Geophys. Res. Oceans 2015, 120, 660–676. [Google Scholar] [CrossRef]
- MacMahan, J. Increased aerodynamic roughness owing to surfzone foam. J. Phys. Oceanogr. 2017, 47, 2115–2122. [Google Scholar] [CrossRef]
- Hodur, R.M. The Naval research laboratory’s coupled ocean/atmosphere mesoscale prediction system (COAMPS). Mon. Weather Rev. 1997, 125, 1414–1430. [Google Scholar] [CrossRef]
- Shamarock, W.C.; Klemp, J.B.; Dudhia, J.; Gill, D.O.; Barker, D.M.; Duda, M.G.; Huang, X.-Y.; Wang, W.; Powers, J.G. A description of the advanced research WRF version 3. NCAR Tech. Notes 2008. [Google Scholar] [CrossRef]
- Pielke, R.A.; Cotton, W.R.; Walko, R.L.; Tremback, C.J.; Lyons, W.A.; Grasso, L.D.; Nicholls, M.E.; Moran, M.D.; Wesley, D.A.; Lee, T.J.; et al. A comprehensive meteorological modeling system—RAMS. Meterol. Atmos. Phys. 1992, 49, 69–91. [Google Scholar] [CrossRef]
- Yang, X.; Sotiropoulos, F.; Conzemius, F.; Wachtler, J.N.; Strong, M.B. Large eddy simulation of turbulent flow past wind turbines/farms: The Virtual Wind Simulator (VWiS). Wind Energy 2015, 18, 2025–2045. [Google Scholar] [CrossRef]
- Foti, D.; Yang, X.; Campagnolo, F.; Maniaci, D.; Sotiropoulos, F. On the use of spires for generating inflow conditions with energetic coherent structures in large eddy simulation. J. Turbul. 2017, 18, 611–633. [Google Scholar] [CrossRef]
- Yang, X.; Sotiropoulos, F. A new class of actuator surface models for wind turbines. Wind Energy 2017. [Google Scholar] [CrossRef]
- Lilly, D.K. A proposed modification of the Germano subgridscale closure method. Phys. Fluids A 1992, 4, 633–635. [Google Scholar] [CrossRef]
- Kim, J.; Moin, P. Application of a fractional-step method to incompressible Navier-Stokes equations. J. Comput. Phys. 1985, 59, 308–323. [Google Scholar] [CrossRef]
- Balay, S.; Brown, K.; Eijkhout, V.; Gropp, W.; Kaushik, D.; Knepley, M.; Mcinnes, L.C.; Smith, B.; Zhang, H. PETSc Users Manual Revision 3.3.; Computer Science Division of Argonne National Laboratory: Argonne, IL, USA, 2012. [Google Scholar]
- Ge, L.; Sotiropoulos, F. A numerical method for solving the 3D unsteady incompressible Navier-Stokes equations in curvilinear domains with complex immersed boundaries. J. Comput. Phys. 2007, 225, 1782–1809. [Google Scholar] [CrossRef] [PubMed]
- Calderer, A.; Kang, S.; Sotiropoulos, F. Level set immersed boundary method for coupled simulation of air/water interaction with complex floating structures. J. Comput. Phys. 2014, 277, 201–227. [Google Scholar] [CrossRef]
- Mittal, R.; Gianluca, I. Immersed boundary methods. Annu. Rev. Fluid Mech. 2005, 37, 239–261. [Google Scholar] [CrossRef]
- Kang, S.; Sotiropoulos, F. Flow phenomena and mechanisms in a field-scale experimental meandering channel with a pool-riffle sequence: Insights gained via numerical simulation. J. Geophys. Res. 2011, 116, F03011. [Google Scholar] [CrossRef]
- Escauriaza, C.; Sotiropoulos, F. Initial stages of erosion and bed-form development in turbulent flow past a bridge pier. J. Geophys. Res. 2011, 116, F03007. [Google Scholar] [CrossRef]
- Khosronejad, A.; Kang, S.; Borazjani, I.; Sotiropoulos, F. Curvilinear immersed boundary method for simulating coupled flow and bed morphodynamic interactions due to sediment transport phenomena. Adv. Water Resour. 2015, 34, 829–843. [Google Scholar] [CrossRef]
- Calderer, A.; Guo, X.; Shen, L.; Sotiropoulos, F. Coupled fluid–structure interaction simulation of floating offshore wind turbines and waves: A large eddy simulation approach. J. Phys. Conf. Ser. 2014, 524, 012091. [Google Scholar] [CrossRef]
- Charnock, H. Wind stress on a water surface. Q. J. R. Meteorol. Soc. 1955, 81, 639–640. [Google Scholar] [CrossRef]
- Mann, J. Wind field simulation. Probab. Eng. Mech. 1998, 13, 269–282. [Google Scholar] [CrossRef]
- Mann, J. The spatial structure of neutral atmospheric surface-layer turbulence. J. Fluid Mech. 1994, 273, 141–168. [Google Scholar] [CrossRef]
- Hogan, T.F.; Liu, M.; Ridout, J.A.; Peng, M.S.; Whitcomb, T.R.; Ruston, B.C.; Reynolds, C.A.; Eckermann, S.D.; Moskaitis, J.R.; Baker, N.L.; et al. The navy global environmental model. Oceanography 2014, 27, 116–125. [Google Scholar] [CrossRef]
- Mellor, G.; Yamada, T. Development of a turbulence closure model for geophysical fluid problems. Rev. Geophys. 1982, 20, 851–875. [Google Scholar] [CrossRef]
- Louis, J.F. A parametric model of vertical eddy fluxes in the atmosphere. Bound. Layer Meteorol. 1979, 17, 187–202. [Google Scholar] [CrossRef]
- Wang, S.; Wang, Q.; Doyle, J. Some improvement of Louis surface flux parametrization. In Proceedings of the 15th Symposium on Boundary Layer and Turbulence, Wageningen, The Netherlands, 15–19 July 2002; pp. 547–550. [Google Scholar]
- Blackadar, A.K. The vertical distribution of wind and turbulent exchange in a neutral atmosphere. J. Geophys. Res. 1962, 67, 3095–3102. [Google Scholar] [CrossRef]
- Hodur, R.M.; Jakubiak, B. The effect of the physical parameterizations and the land surface on rainfall in Poland. Weather Forecast. 2016, 31, 1247–1270. [Google Scholar] [CrossRef]
- Perlin, N.; de Szoeke, S.P.; Chelton, D.B.; Samelson, R.M.; Skyllingstad, E.D.; O’Neill, L.W. Modeling the atmospheric boundary layer wind response to mesoscale sea surface temperature perturbations. Mon. Weather Rev. 2014, 142, 4284–4307. [Google Scholar] [CrossRef]
- Wang, S.; O’Neill, L.W.; Jiang, Q.; de Szoeke, S.P.; Hong, X.; Jin, H.; Thompson, W.T.; Zheng, X. A regional real-time forecast of marine boundary layers during VOCALS-REx. Atmos. Chem. Phys. 2011, 11, 421–437. [Google Scholar] [CrossRef]
- Fröhlich, J.; Mellen, C.P.; Rodi, W.; Temmerman, L.; Leschziner, M.A. Highly resolved large-eddy simulation of separated flow in a channel with streamwise periodic constrictions. J. Fluid Mech. 2005, 526, 19–66. [Google Scholar] [CrossRef]
- Breuer, M.; Peller, N.; Rapp, C.; Manhart, M. Flow over periodic hills—Numerical and experimental study in a wide range of Reynolds numbers. Comput. Fluids 2009, 38, 433–457. [Google Scholar] [CrossRef]
- Rasam, A.; Wallin, S.; Brethouwer, G.; Johansson, A.V. Large eddy simulation of channel flow with and without periodic constrictions using the explicit algebraic subgrid-scale model. J. Turbul. 2014, 15, 1–24. [Google Scholar] [CrossRef]
- Le, H.; Moin, P.; Kim, J. Direct numerical simulation of turbulent flow over a backward-facing step. J. Fluid Mech. 1997, 330, 349–374. [Google Scholar] [CrossRef]
- Fang, X.; Yang, Z.; Wang, B.-C.; Tachie, M.F.; Bergstrom, D.J. Highly-disturbed turbulent flow in a square channel with V-shaped ribs on one wall. Int. J. Heat Fluid Flow 2015, 56, 182–197. [Google Scholar] [CrossRef]
- Fang, X.; Yang, Z.; Wang, B.-C.; Tachie, M.F.; Bergstrom, D.J. Large-eddy simulation of turbulent flow and structures in a square duct roughened with perpendicular and V-shaped ribs. Phys. Fluids 2017, 29, 065110. [Google Scholar] [CrossRef]
© 2018 by the authors. Licensee MDPI, Basel, Switzerland. This article is an open access article distributed under the terms and conditions of the Creative Commons Attribution (CC BY) license (http://creativecommons.org/licenses/by/4.0/).