Article

A Case Study of the Stratospheric and Mesospheric Concentric Gravity Waves Excited by Thunderstorm in Northern China

1
Key Laboratory of Meteorological Disaster, Ministry of Education (KLME)/Joint International Research Laboratory of Climate and Environment Change (ILCEC)/Collaborative Innovation center on Forecast and Evaluation of Meteorological Disaster (CIC-FEMD)/Key Laboratory for Aerosol-Cloud-Precipitation of China Meteorological Administration, Nanjing University of Information Science and Technology, Nanjing 210044, China
2
School of Astronomy and Space Science, University of Chinese Academy of Science, Beijing 100049, China
3
State Key Laboratory of Space Weather, National Space Science Center, Chinese Academy of Sciences, Beijing 100190, China
*
Author to whom correspondence should be addressed.
Atmosphere 2018, 9(12), 489; https://doi.org/10.3390/atmos9120489
Submission received: 12 September 2018 / Revised: 1 December 2018 / Accepted: 4 December 2018 / Published: 10 December 2018

Abstract

:
In this paper, the complete process in which a concentric gravity wave (CGW), excited by a tropospheric thunderstorm, propagated into the stratosphere and mesosphere in Northern China is investigated. A strong thunderstorm developed in the middle of the Inner Mongolia autonomous region on the night of 10th August 2013. The stratospheric temperature perturbation, caused by the CGW, was observed by the Atmospheric Infrared Sounder (AIRS) at 02:11 LT 11th August 2013. An all-sky OH imager at the Shuozhou station (39.8° N, 112.1° E), supported by the Meridian Space Weather Monitoring Project, measured the mesospheric CGW between 22:00 LT to 23:00 LT on the night. It was certified that both the stratospheric and mesospheric CGWs were triggered by the aforementioned thunderstorm, and the excitation source was calculated to be located at (40.59° N, 108.67° E) by employing the dispersion relation. The CGWs were excited in the initial stage of the thunderstorm. The temperature and wind field data obtained by SABER and meteoric radar, respectively, were used to evaluate the background properties of the respective propagation regions. The result shows that an obvious thermal duct structure, with a positive squared vertical wavenumber (m2) existed around the OH layer.

1. Introduction

Gravity waves (GWs) are an important driver of the upper stratospheric and mesospheric circulation [1]. It is commonly recognized that deep convection (i.e., strong thunderstorms) can frequently excite GWs in the lower atmosphere [2]. In such a convectively unstable background environment, energetic and warm plumes rise rapidly to the upper troposphere. If enough energy is provided, the convective plume can overshoot the tropopause by up to 1–3 km into the stratosphere, dominated by the stable horizontal wind field. Then, the updraft collapses back down to the tropopause and spreads out horizontally as an anvil [3]. On one hand, the transitory air motion caused by overshooting causes the initial perturbation to initiate the GWs. On the other hand, latent heating and cooling (diabatic forcing) can also produce high-frequency GWs with dominant intrinsic periods between ~7 min and 1 h in the lower stratosphere [4,5]. The above-mentioned processes may excite a broad spectrum of GWs, with large ranges of temporal and spatial scales; the duration can vary between 30 min to ~4 h, and the propagating distance can cover 100 km to 800 km [2,3,6,7,8,9,10]. GWs can propagate for several hundreds of kilometers horizontally, and in the vertical direction, the waveform can reach the mesopause at altitudes of ~87 km. The GWs can interact with the background during propagation in two ways. On one hand, the GWs can become unstable and produce turbulence, along with wave–wave interaction between the GWs and atmosphere in the mesosphere, leading to a damping effect for the background wind field. A numerical simulation indicated that 51% of the energy conversion is induced by the above non-linear interaction [11]. On the other hand, the background wind field and its stability play important roles in the non-linear propagation of GWs. Wrasse et al. [12] investigated the propagation process and found that 45% of GWs were restrained by the ducting boundary. GWs can propagate and even reflect between the duct layer boundaries in the mesosphere and low thermosphere. In general, both the sharp temperature inversion and wind shear play important roles in the ducting structure, located between 80 km and 120 km. This is regarded as a significant condition for maintaining the wavelengths as the approximate constants in large-scale GWs [12,13].
The air temperature perturbation is an important indication of GWs in the stratosphere and mesosphere. Dewan et al. [14] reported the first satellite observations of thunderstorm-generated GWs using data from the Midcourse Space Experiment. Since 2002, the Atmospheric Infrared Sounder (AIRS) onboard NASA’s Aqua satellite has been detecting thermal radiation in the atmosphere [15,16,17,18]. The radiance measurements are the most sensitive to temperature perturbations in the fundamental band peak at a height of ~41 km. Thus, AIRS radiance measurements at 4.3 μm are used to detect stratospheric GWs [15,17,18,19,20].
Smaller-scale GWs with horizontal wavelengths of 5–10 km often reach or break in the stratosphere or lower mesosphere [6,21], while some larger-scale GWs, with horizontal wavelengths greater than 17 km, with smaller amplitudes and faster phase speeds, usually reach the mesopause (80–105 km altitude). These GWs become evanescent and reflect downward, or propagate into the thermosphere. There, remarkable perturbations in air density can be found in the OH (hydroxy) layer (~87 km). OH airglow emission variation, observed by ground-based airglow imagers, is a typical tracer of GWs [22,23,24,25,26]. Linear wavefronts are common waveforms in GWs, and are usually related to topography, frontal surface, and large-scale circulation [27]. Whereas circular or elliptical patterns have been rarely observed, the centers of the concentric rings in concentric gravity waves (CGWs) closely coincide with the convective systems in troposphere [14,20]. Observations indicate that this kind of concentric rings originated from severe thunderstorms and typhoons [28,29,30].
Although numerous simulations have been utilized to explain the mechanism of GW formation and propagation [31,32,33,34,35,36], practical observations are still critical and significant for the reliability of model parameterization. Nearly linear GWs, which have been analyzed for several decades, are believed to be the most common kind in the OH layer [37,38,39]. However, compared with many convective systems, very few CGWs observed by OH all-sky airglow imagers have been reported [28,29,40,41,42]. In recent years, Yue et al. [30] reported only nine CGWs events in eight years of observations, and Xu et al. [43] analyzed the first simultaneous observations of CGWs propagations by the no-gap all-sky OH airglow imager network over northern China.
In this work, a CGW event, generated by a thunderstorm in northern China, which propagated into the stratosphere and mesosphere, is reported. In China, since the first CGWs observed by Xu et al. [43], the only study of CGWs is reported by Wang et al. [44] without the verification of the excitation source. Thus, more observations are necessary to explore the relationship between CGW propagation and background conditions in China. The observed CGW characteristics in the stratosphere and mesosphere can contribute to the parameterization of numerical models and the collection of CGW datasets in this region as well. This paper briefly introduces the datasets in Section 2. Section 3 contains the processing of the all-sky image data and the usage of the atmosphere dispersion relation. Section 4 covers the method used to extract the wavelengths and wave periods from stratospheric and mesospheric waveforms. Section 5 provides the dispersion relation calculation to confirm that the CGWs were initiated by the thunderstorm in the center of the CGWs. Section 6 discusses the propagation circumstances and the thermal duct structure, and a concluding summary in Section 7 completes this paper.

2. Data

2.1. AIRS Radiation Variation

AIRS is an infrared spectrometer and sounder onboard the NASA Aqua satellite. It is in a sun-synchronous polar orbit (13:30 local time, ascending node) at 705 km altitude with 99 min period [16]. The scanning time is 6 min for a single frame image. The footprint size is 13~14 km diameter at nadir view and the scan swath is ~1600 km wide, which is sufficient to cover the horizontal scale of most GWs. The air thermal perturbations induced by GWs with vertical wavelengths longer than 10–15 km can be detected by the measurements [18,45]. AIRS radiance measurements at the 4.3 μm CO2 fundamental emission band are most sensitive around 30–40 km altitude. Therefore, CO2 radiance emission band with frequency ranging between 2299.80 cm−1 and 2422.85 cm−1 is used to measure the stratospheric air temperature perturbation in this study.

2.2. OH All-Sky Airglow Image

Since the first airglow measurement in the 1970s [46,47], airglow imaging technique has become an effective method to monitor nighttime airglow emission perturbations. Owing to the first no-gap all-sky OH airglow imagers network composed of six observation stations, established by the Meridian Space Weather monitoring Project (National Space Science Center, Chinese Academy of Sciences), the successional observations in northern China began in February 2012 [43]. In this work, the airglow data were observed by Shuozhou station (39.8° N, 112.1° E). The OH airglow all-sky imager is composed of a CCD detector (1024 × 1024 pixel), a near-infrared (NIR) band (715–930 nm) filter, a Nikon 16 mm/2.8D fisheye lens with a 180° field of view, and an optical imaging system. The notch of NIR band filter centered at 865.5 nm at OH airglow layer (~87 km). The band-pass filter is sensitive to the emissions of the OH Meinel bands, and can suppress the O2 (0–1) emission [48]. The image interval of the optical system is 1 min. The spatial resolution of the airglow imager is not uniform because of the distortion caused by the fisheye effect. With the increase of zenith angle, the spatial resolution is 0.27 km at the zenith, but about 5.5 km at the zenith angle of 80°. On cloudless nights, the GWs can be viewed with the zenith angle smaller than 80°, so the maximum observation radius is 420 km at OH airglow layer.

2.3. TIMED/SABER and Meteor Doppler Radar Data

Sounding of the Atmosphere using Broadband Emission Radiometry (SABER) is a sensor on board the Thermosphere Ionosphere Mesosphere Energetics and Dynamics (TIMED) satellite, for detecting the profile of air temperature and several kinds of tracer components. The satellite was launched in January of 2002 at an altitude of 625 km with an inclination angle of 74.1°. SABER scans the atmosphere from 0 km to 180 km in 58 s, and can cover the latitude circle from winter hemisphere 53° to the summer hemisphere 83° [49,50]. SABER grid data has an excellent vertical spatial resolution of as high as ~0.4 km of Level-2A products [16]. In this work, kinetic temperatures from CO2 emissions are employed as the background temperature and 1.6 µm OH emission is used to extract OH airglow CGWs.
The meteor Doppler radar measures the wind velocity profiles in the mesosphere and lower thermosphere from 70 to 110 km with a height interval of 2 km. Its transmit power is 7.5 kW and received frequency is 38.9 MHz with an integration time of 1 h. In this work, the data of Beijing station (39.98° N, 116.37° E) which is 100 km east of the Shuozhou station boundary is used.

3. Method

3.1. Processing of All-Sky Image Data

Both low-frequency background emissions and the distortion caused by fisheye lenses are the main error source for all-sky image data. Thus, processing of the raw image data is necessary before the wave parameters can be extracted from the airglow images. First, the difference between two consecutive raw images is found so that time-difference (TD) images can be created to eliminate the background information [27,51,52]. In the TD images, the high-frequency perturbation caused by GWs from irregular, abrupt background changes can be recognized exactly. Next, in order to correct the distortion by the fisheye lens, the TD images are projected onto the geographic coordinate with 512 × 512 km grid, assuming the altitude of the OH airglow layer to be 87 km [26,38,53].

3.2. Boussinesq GW Dispersion Relation

The basic rules of GW propagation have been investigated by numerical simulation and observations for several years [8,54]. The Boussinesq GW dispersion relation has become an effective method to explain the propagation characteristics [7,55,56]. The GWs dispersion relation has been used to estimate the position of the GWs’ excitation source and the propagation time from the excitation altitude to the upper mesosphere and lower thermosphere (MLT) [12,57,58].
Due to the atmospheric dispersion relation, the GW with longer horizontal wavelengths can propagate longer distances under the assumption of zero wind. The Boussinesq GWs dispersion relation is [30,59]
λ h = 2 π R 2 ( 1 + Δ z 2 / R 2 ) 3 / 2 N Δ z Δ t
where λh is the horizontal wavelength, N is the Brunt-Väisälä frequency, and R is the horizontal distance from the center of the observed CGW at an altitude of ~87 km. Considering the generation mechanism of convective CGWs is convective overshooting in the upper troposphere, by assuming that the CGWs are launched from the tropopause, the height from the tropopause to the OH layer is Δ z = Z O H Z c t o p . If the measured horizontal wavelength is close to the estimated value calculated by Equation (1), the convective source can be confirmed as the CGWs excitation source.
Both the background temperature and wind field are determinant factors for GW propagation. Previous studies have shown that the temperature inversion layer and obvious wind shear are distinctly associated with the formation of mesospheric GW ducts during propagation processes [13,14,60]. The square of the Brunt-Väisälä frequency (N2) represents the influence of the temperature
N 2 = g T ( d T d z + g c p )
where g = 9.54   ms 2 , T is the kinetic temperature measured by SABER, d T / d z is the vertical gradient of temperature, and c p = 1005   J · kg 1 · K 1 is the specific heat capacity at constant pressure. The vertical wave number m = 2 π / λ z describes the vertical propagation condition, and can be expressed using the GW dispersion relation as [61]:
m 2 = N 2 ( c u ) 2 + u z z c u k h 2
where k h = 2 π / λ h is the horizontal wave number. u is the horizontal wind velocity in the direction of the CGW’s propagation, obtained by the meteor radar. u z z is the second derivative of u wind velocity with height z. The vertical profile of m2 is the most significant criterion in indicating the existence of the ducting structure [12].

4. CGW Characteristics

4.1. Mesospheric CGW

Concentric rings were observed in the mesosphere by the all-sky airglow imager from 22:00 LT to 22:30 LT. During this period, two groups of obvious waveforms of this CGW event were chosen, as shown in Figure 1. Both of the groups of CGWs maintained consecutive waveforms for ~20 min, and were initiated by the expansion of the same circular rings. Thus, they were part of the same CGW event. Group A was north of Shuozhou station, and its semi-period, where wave crests switched to troughs, was 4.28 min. The wave period and horizontal wavelength were 8.56 min and 34.06 km for group A, respectively, while they were 10.72 min and 22.61 km for group B, located to the southwest of Shuozhou station. Group A with longer horizontal wavelength can reach longer horizontal distance than group B.
The five rings of the group A (22:07 LT–22:12 LT) and the three rings of the group B (22:09 LT–22:13 LT) were chosen to estimate the center of the CGWs. The wave crests (bright parts) and wave troughs (dark parts) are marked with red and green dots, respectively, in Figure 1. The least square method [29,62] was employed to obtain a more accurate fitting result from the eight fringes. The best fitting center of circles and radii minimized the total residual sum of the squares, S [28,29,30].
S = k = 1 n k [ i = 1 n i ( r i k r k ) 2 ]
where r i k is the distance between the hypothetic center and the i-th marked point on the k-th wavefront. The distance r ab between a ( λ a , ϕ a ) and b ( λ b , ϕ b ) is calculated by the formulae of spherical trigonometry.
r ab = R 0 cos 1 [ sin ϕ a sin ϕ b + cos ϕ a cos ϕ b cos ( λ b λ a ) ]
where R 0 is the radius of the Earth. n k is the number of points on the wavefront. Here, the mean radius, r k , can be written as
r k = i r i k n k
The fitted center, located at (40.59° N, 108.67° E), is represented by the red triangle in Figure 1. The convective center, fitted by only two rings, was located at (40.47° N, 108.90° E) [63]. The deviation between the two results is less than 0.5°. Therefore, the number of marked points results in negligible deviation, and does not affect the fitting results.

4.2. Stratospheric CGWs

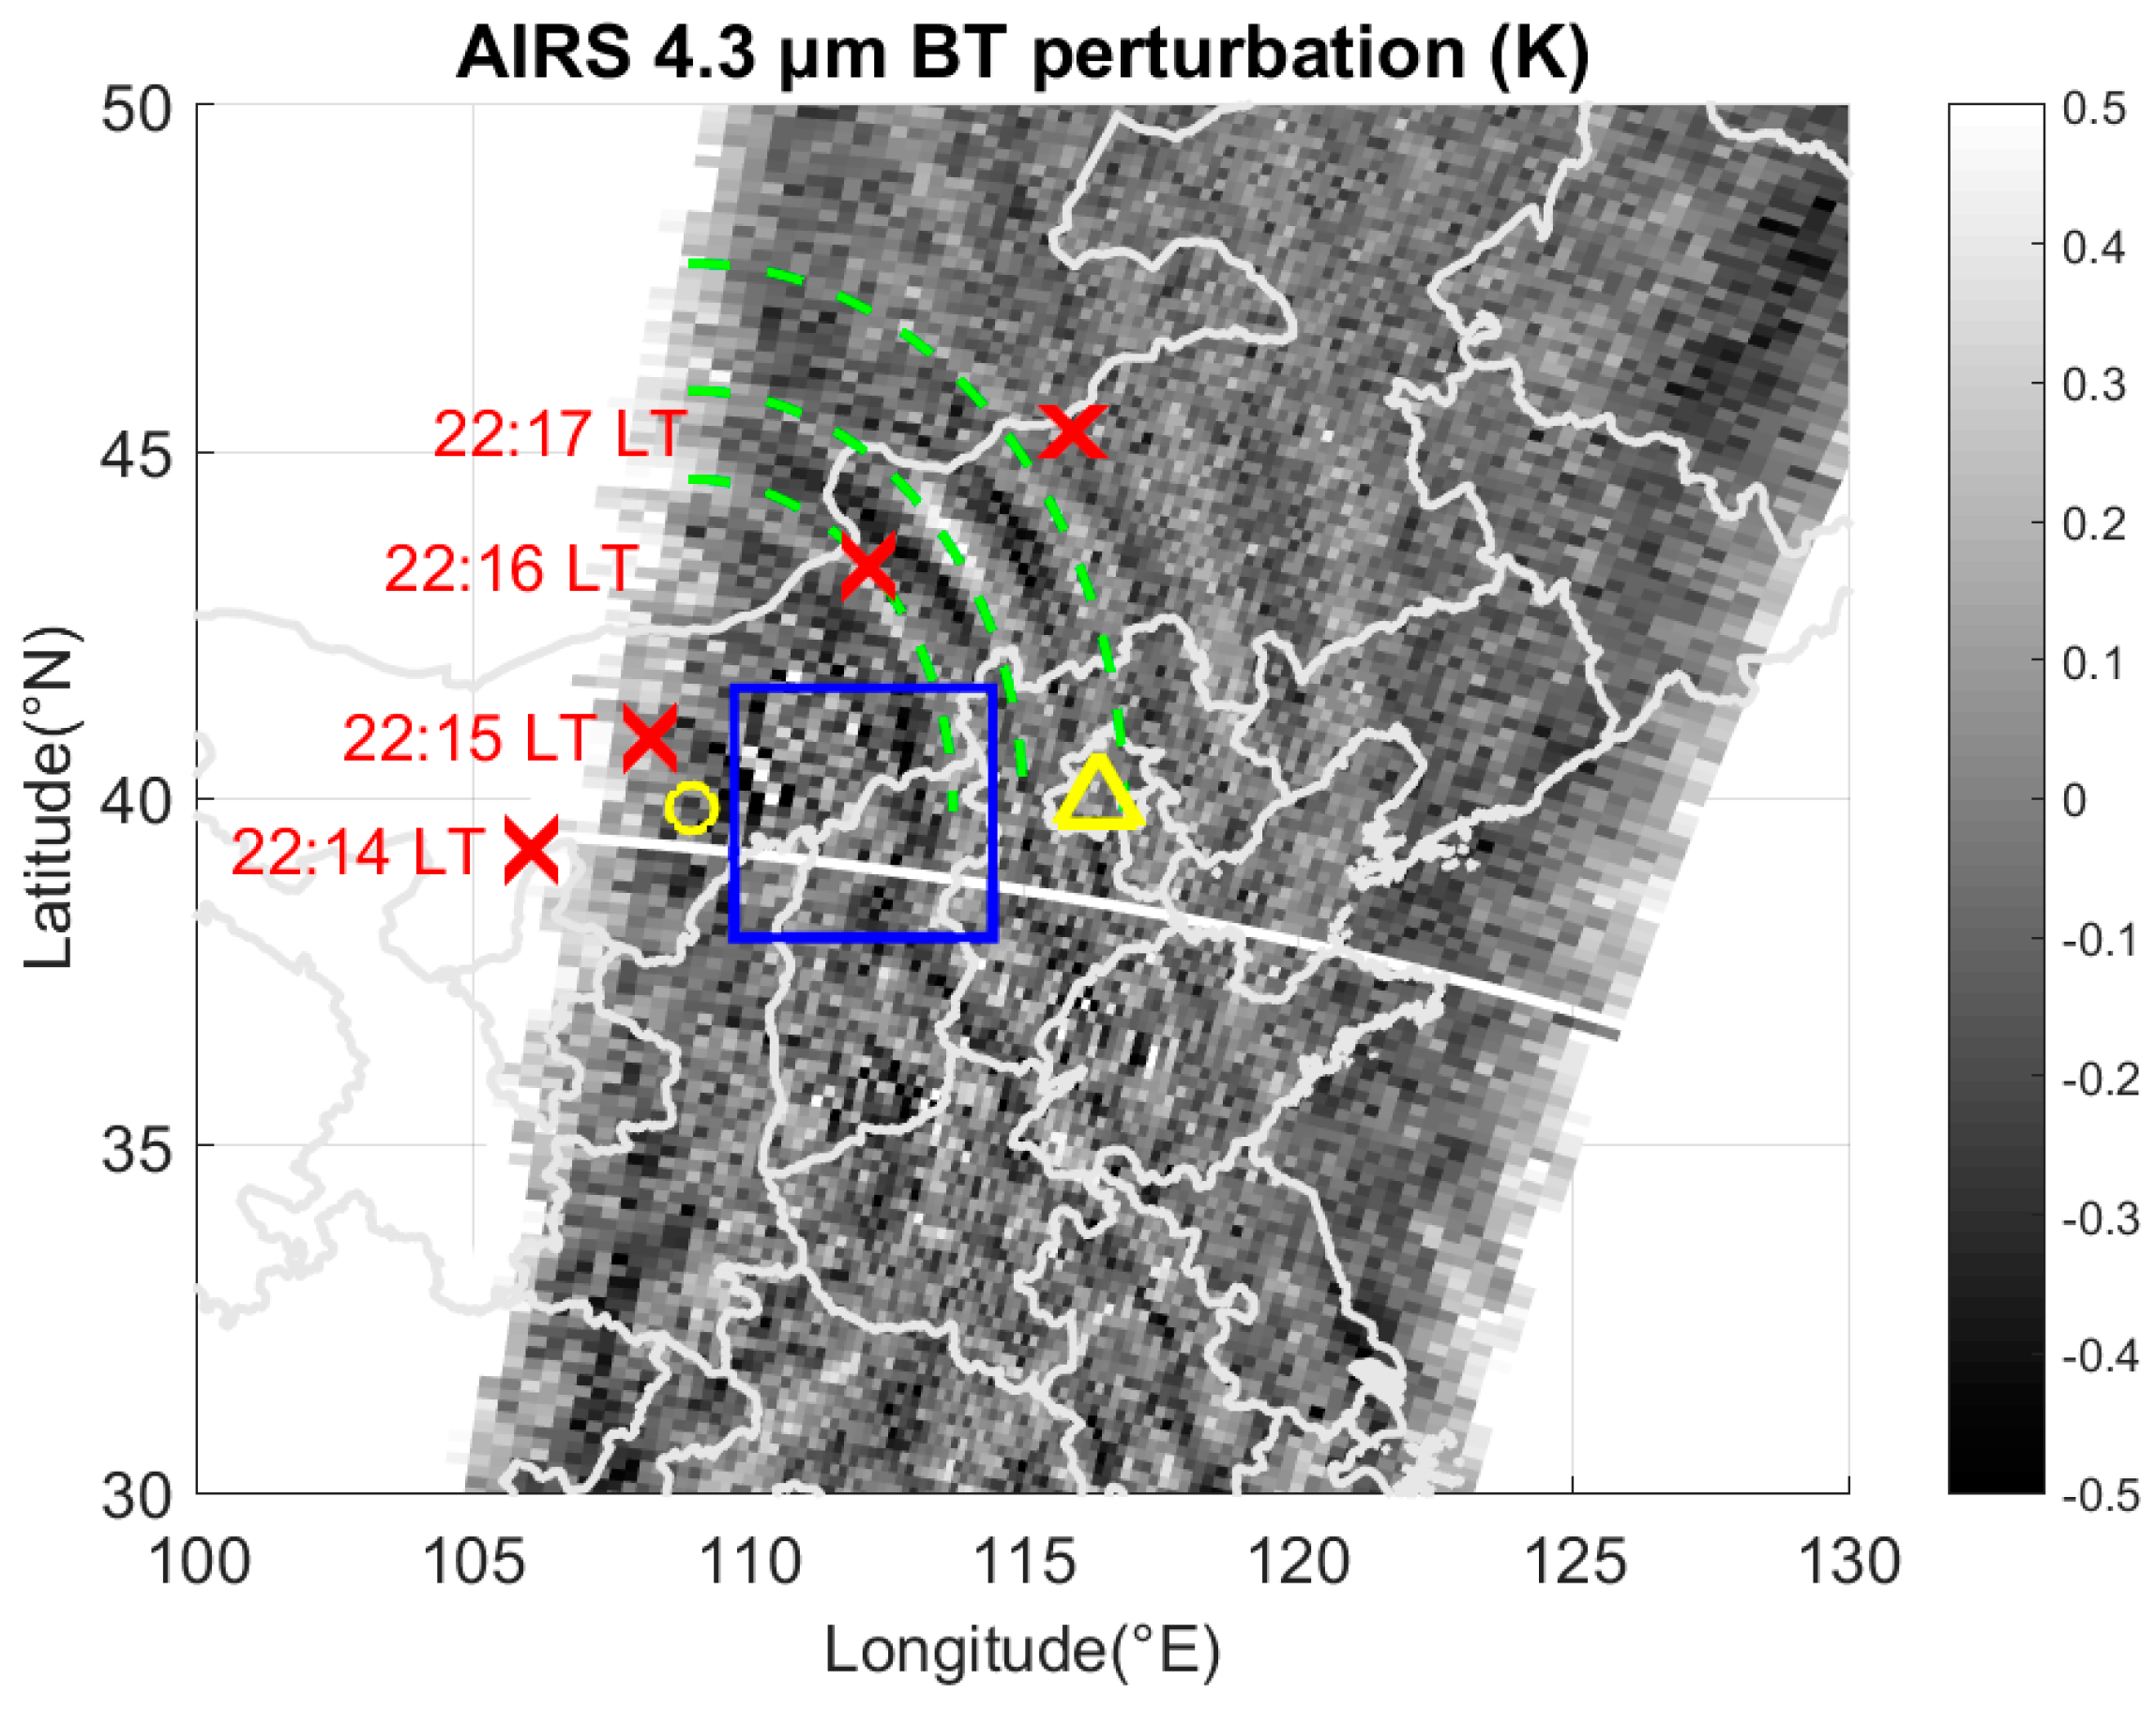
When CGWs propagate into the stratosphere, the radiance temperature perturbations can be observed by AIRS in the 4.3 μm channel. The stripy waveforms propagated northeastward at 02:11 LT on 11th August, as shown in Figure 2. Radiance temperature perturbations occurred in the region of 40°–45.5° N and 109°–116.5° E, north of Shuozhou station. The green dashed lines mark the peaks of the CGWs. The average horizontal wavelength of the three streaks in Figure 2 was 151.70 km, which is close to the most common value observed by AIRS of ~100 km [64].
The average propagation distance of group A and group B was 174.25 km and 149.64 km away, respectively. The stratospheric propagation distance was 516.92 km. In the horizontal direction, the greater propagation distance of stratospheric CGW is caused by the longer propagation time, ~4 h more than that of the mesospheric CGW.
Although the background emission will bring disturbance into the OH images [27,52], the relative variation is still a credible parameter to evaluate the perturbation caused by GWs [43]. The luminous intensity variation indicates the amplitude of GWs. The relative luminosity intensity, extracted from raw unwrapped OH images, is defined as ΔI/I, and the relative radiation temperature was defined as ΔT/T. In Figure 3, the average perturbation amplitude of ΔI/I is 6.14%, while the average perturbation amplitude of ΔT/T is 5.01%. The disparate methods and observation principles can cause the systematic deviation between the amplitudes of ΔI/I and ΔT/T, and wave amplitude damping caused by observational filters must be considered [15]. Smaller amplitudes in the stratosphere could be explained by gradual energy dissipation with the increase in horizontal propagation distance.

5. CGWs Excitation Source

The dispersion relation is widely used to estimate the position and time of a GW’s excitation source by verifying actual wave parameters in accordance with the theoretical dispersion relationship. Yue et al. [30] and Fovell et al. [65] used 12 km as the height of the tropopause, while at the Shuozhou station Z c t o p = 13 km, as per the NCEP (National Centers for Environmental Prediction) reanalysis data. Therefore, Δ z = 87 13 = 74 km is the vertical distance from the tropopause to OH airglow layer (~87 km) in Equation (1). In Figure 4, group A propagated a greater distance than group B, and so the horizontal wavelength of group A is obviously longer than group B. The uncertainties in the horizontal wavelengths are due to the difference between each waveform and the average value, which is caused by wave interference and noise when identifying the bright or dark bands in the airglow image. Comparing the observed horizontal wavelengths with their theoretical propagation curves, it could be seen that, in the OH airglow layer, the wavelengths and propagation distance approximately satisfied the 150 min curve (red line) in Figure 4. According to the observation, the excitation times of group A and group B were 19:37 LT and 19:39 LT on 10th August, respectively.
At AIRS observation height of 41 km, Δ z = 41 13 = 28 km from Equation (1), and the propagation time approximately conformed with the 7 h curve (red line) in Figure 5. Therefore, the excitation time of the CGWs in the AIRS layer was 19:11 LT on 10th August. The excitation time difference of OH airglow layer and AIRS layer was ~27 min. It probably because the waves were excited at different instants by the same source, once the waves have different parameters at the stratosphere and mesosphere, respectively. Moreover, the dispersion relationship is a theoretical estimation for actual atmospheric GWs’ propagation characteristics under the assumption of weak wind, and it will lead to certain errors. Accordingly, it is acceptable that the deviation of excitation time was almost 30 min in this case.
The convection cell, especially in the case of the overshooting process at the top of the convective cloud, has been proven to be the initial excitation of CGWs [9,21,66]. According to the excitation position and time, the excitation source of CGWs is a thunderstorm in the region of 40.5°–41.5° N and 108°–109° E. In accordance with the investigation by Wen et al. [63], the convection began at 19:00 LT and developed for ~6 h. The CGWs were excited in the initial stage of the thunderstorm, between 19:30 LT and 20:00 LT. In this stage, the strong and rapid development of convection was advantageous for overshooting, which is known to be important for initial perturbation [2,3,29,37,65].

6. Propagation Background Circumstances

Both propagation and breaking are the main phenomena of GWs and they are dictated by the horizontal prevailing wind in the stratosphere [67]. Therefore, the zonal wind is the principal factor controlling the GW’s propagation processes. The wind direction opposite to the direction of the GW’s horizontal propagation facilitates upward propagation in the upper atmosphere. Using the ECMWF (European Centre For Medium-Range Weather Forecasts) reanalysis data, the horizontal background wind field was statistically analyzed between the tropopause (~13 km) and the mid-stratosphere (~30 km) above the excitation thunderstorm at 18:00 LT. It is usually observed that eastward winds reverse direction to become westward winds at the bottom of the stratosphere. As shown in the wind-rose diagram (Figure 6), this region was mainly controlled by the background westward wind, and the maximum wind velocity was less than −22 m/s (westward winds). According to the classical wave theory, stratospheric westward wind cannot filter out eastward fluctuation propagation, so the CGWs which originated by the convection plume can reach the region over the Shuozhou station.
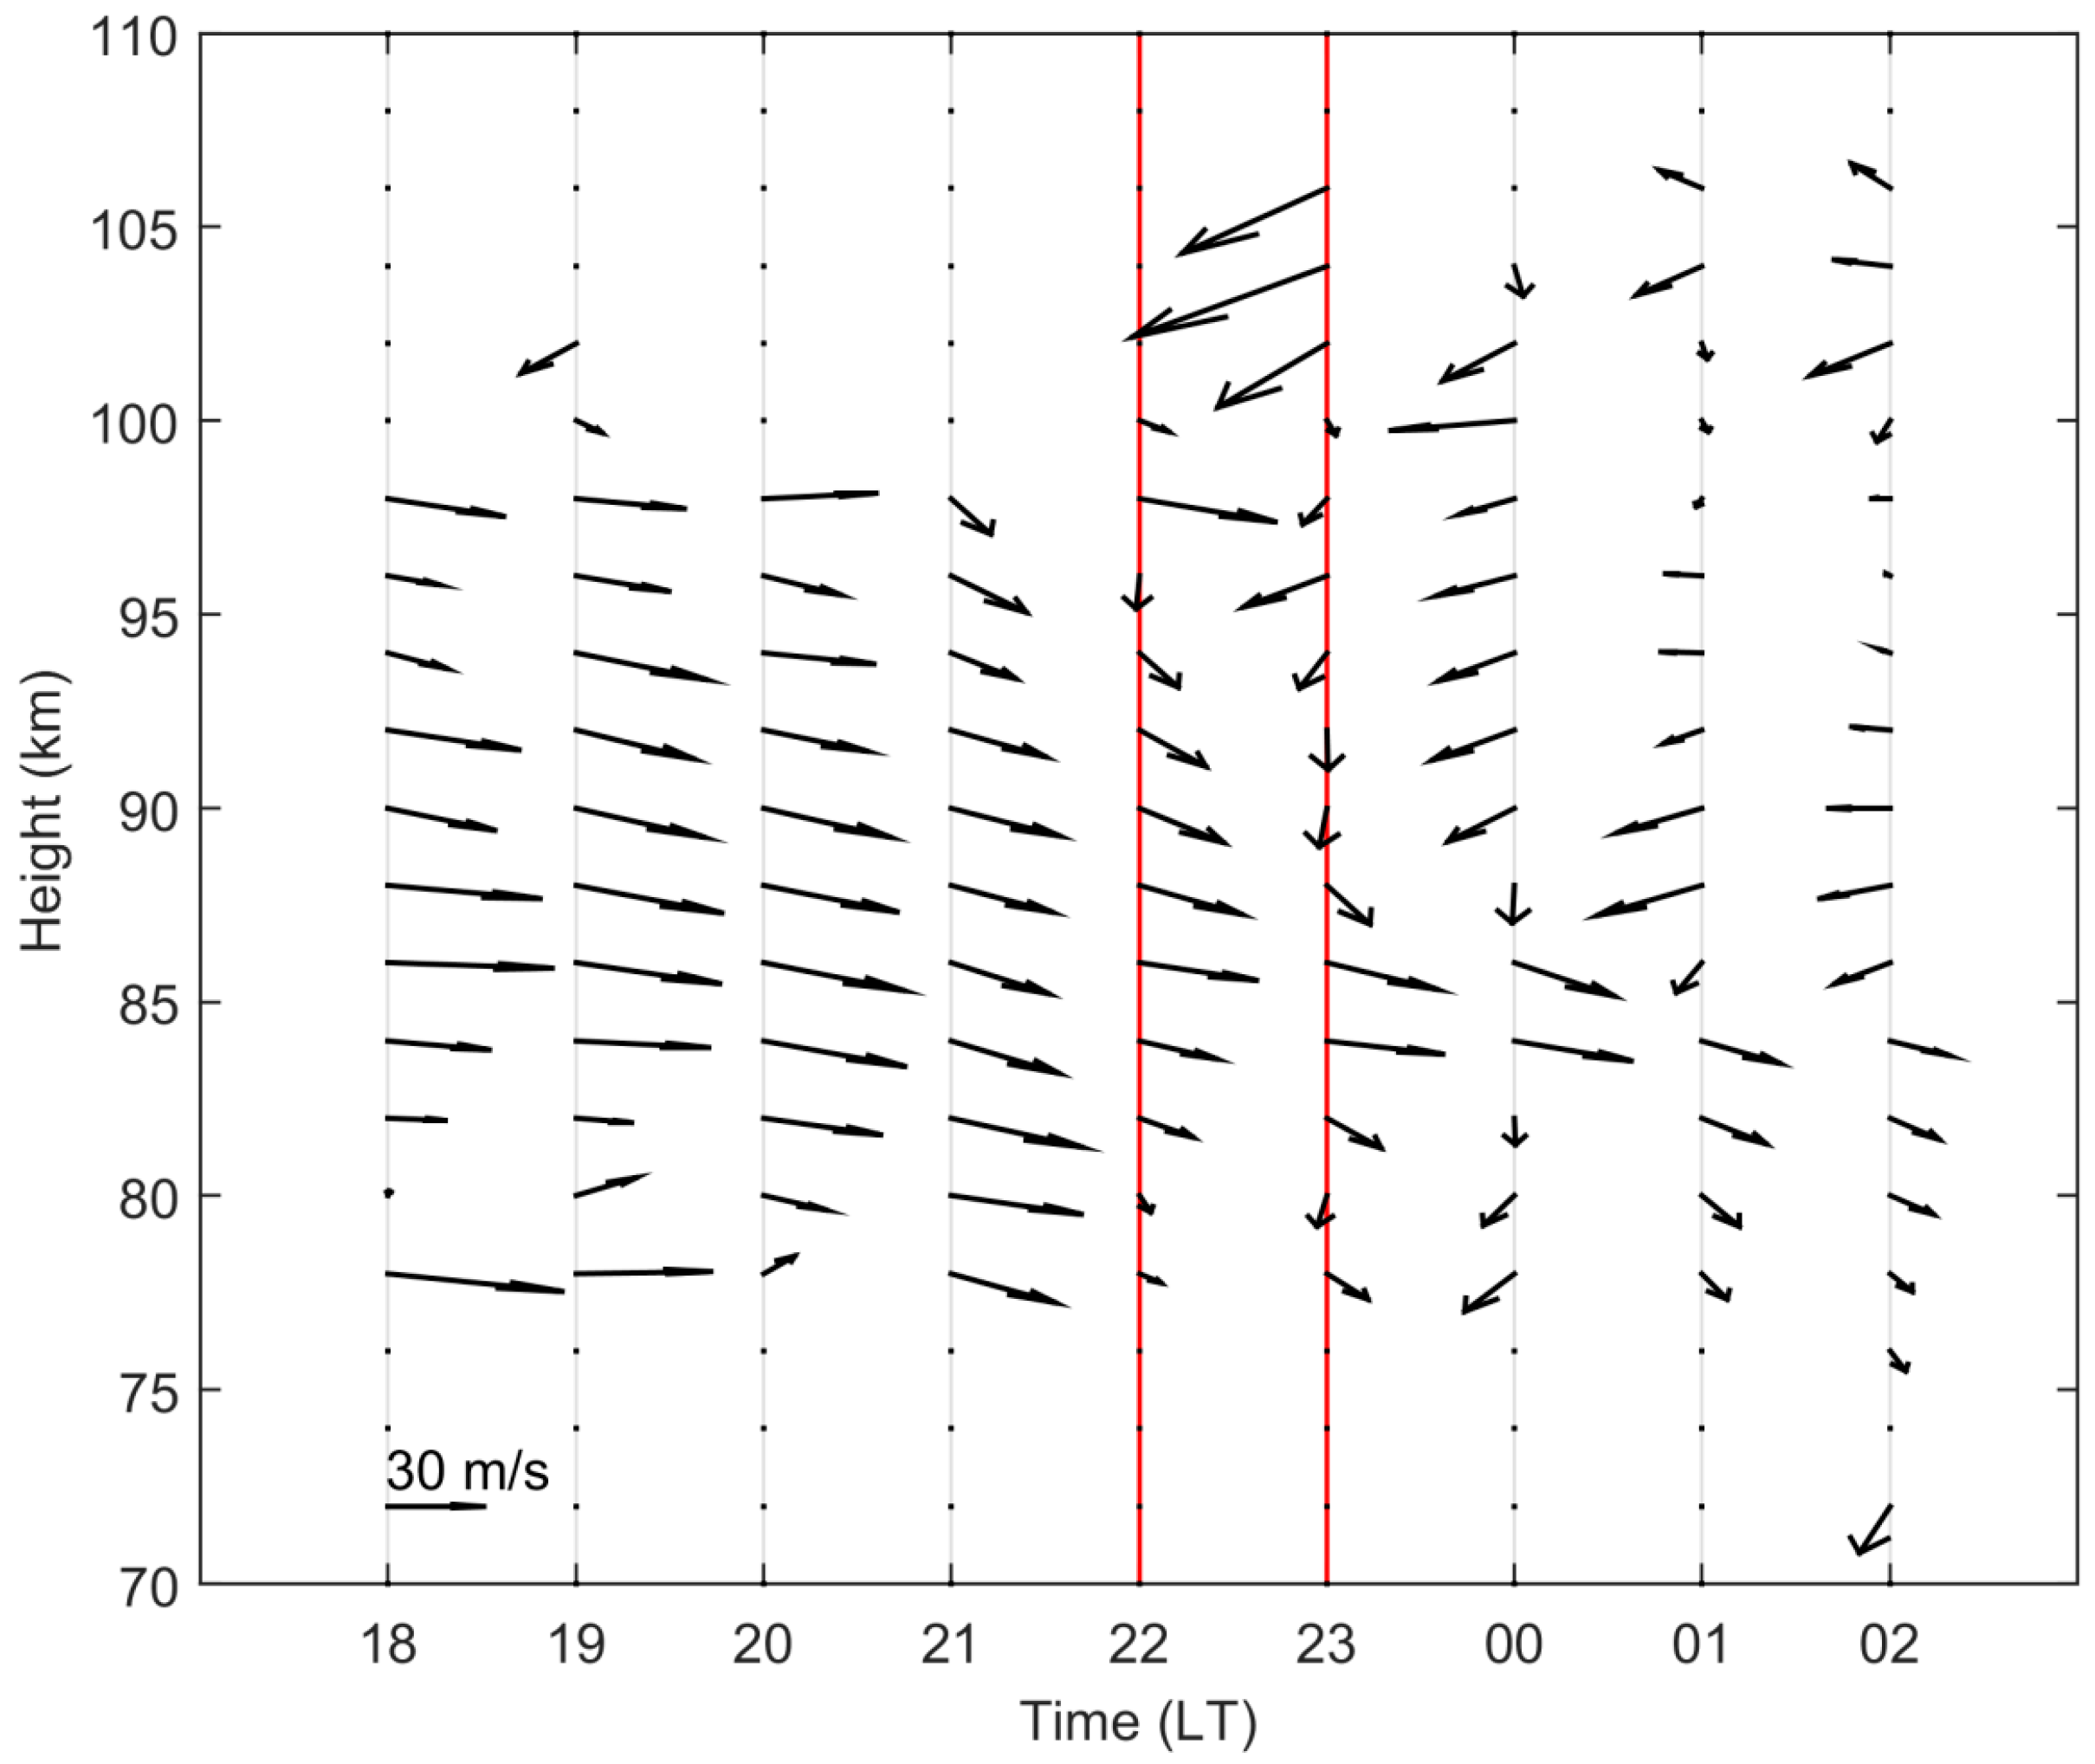
The background wind field was observed by the meteor radar (Beijing station), the location of which is marked as a yellow triangle in Figure 1. The wind hodograph from the night of 10–11th August 2013 is presented in Figure 7. The westerly wind controlled the whole layer between 80 km and 100 km until 22:00 LT, with a maximum velocity of 42.67 m/s. After 23:00 LT, the easterly wind gradually displaced the weak westerly wind from 86 km to 106 km, with a maximum velocity of −60.39 m/s, followed by a reduction in the westerly wind. It is noted that the obvious wind shear between 86 km and 90 km and CGWs occurred practically at the same time: between 22:00 LT and 23:00 LT.
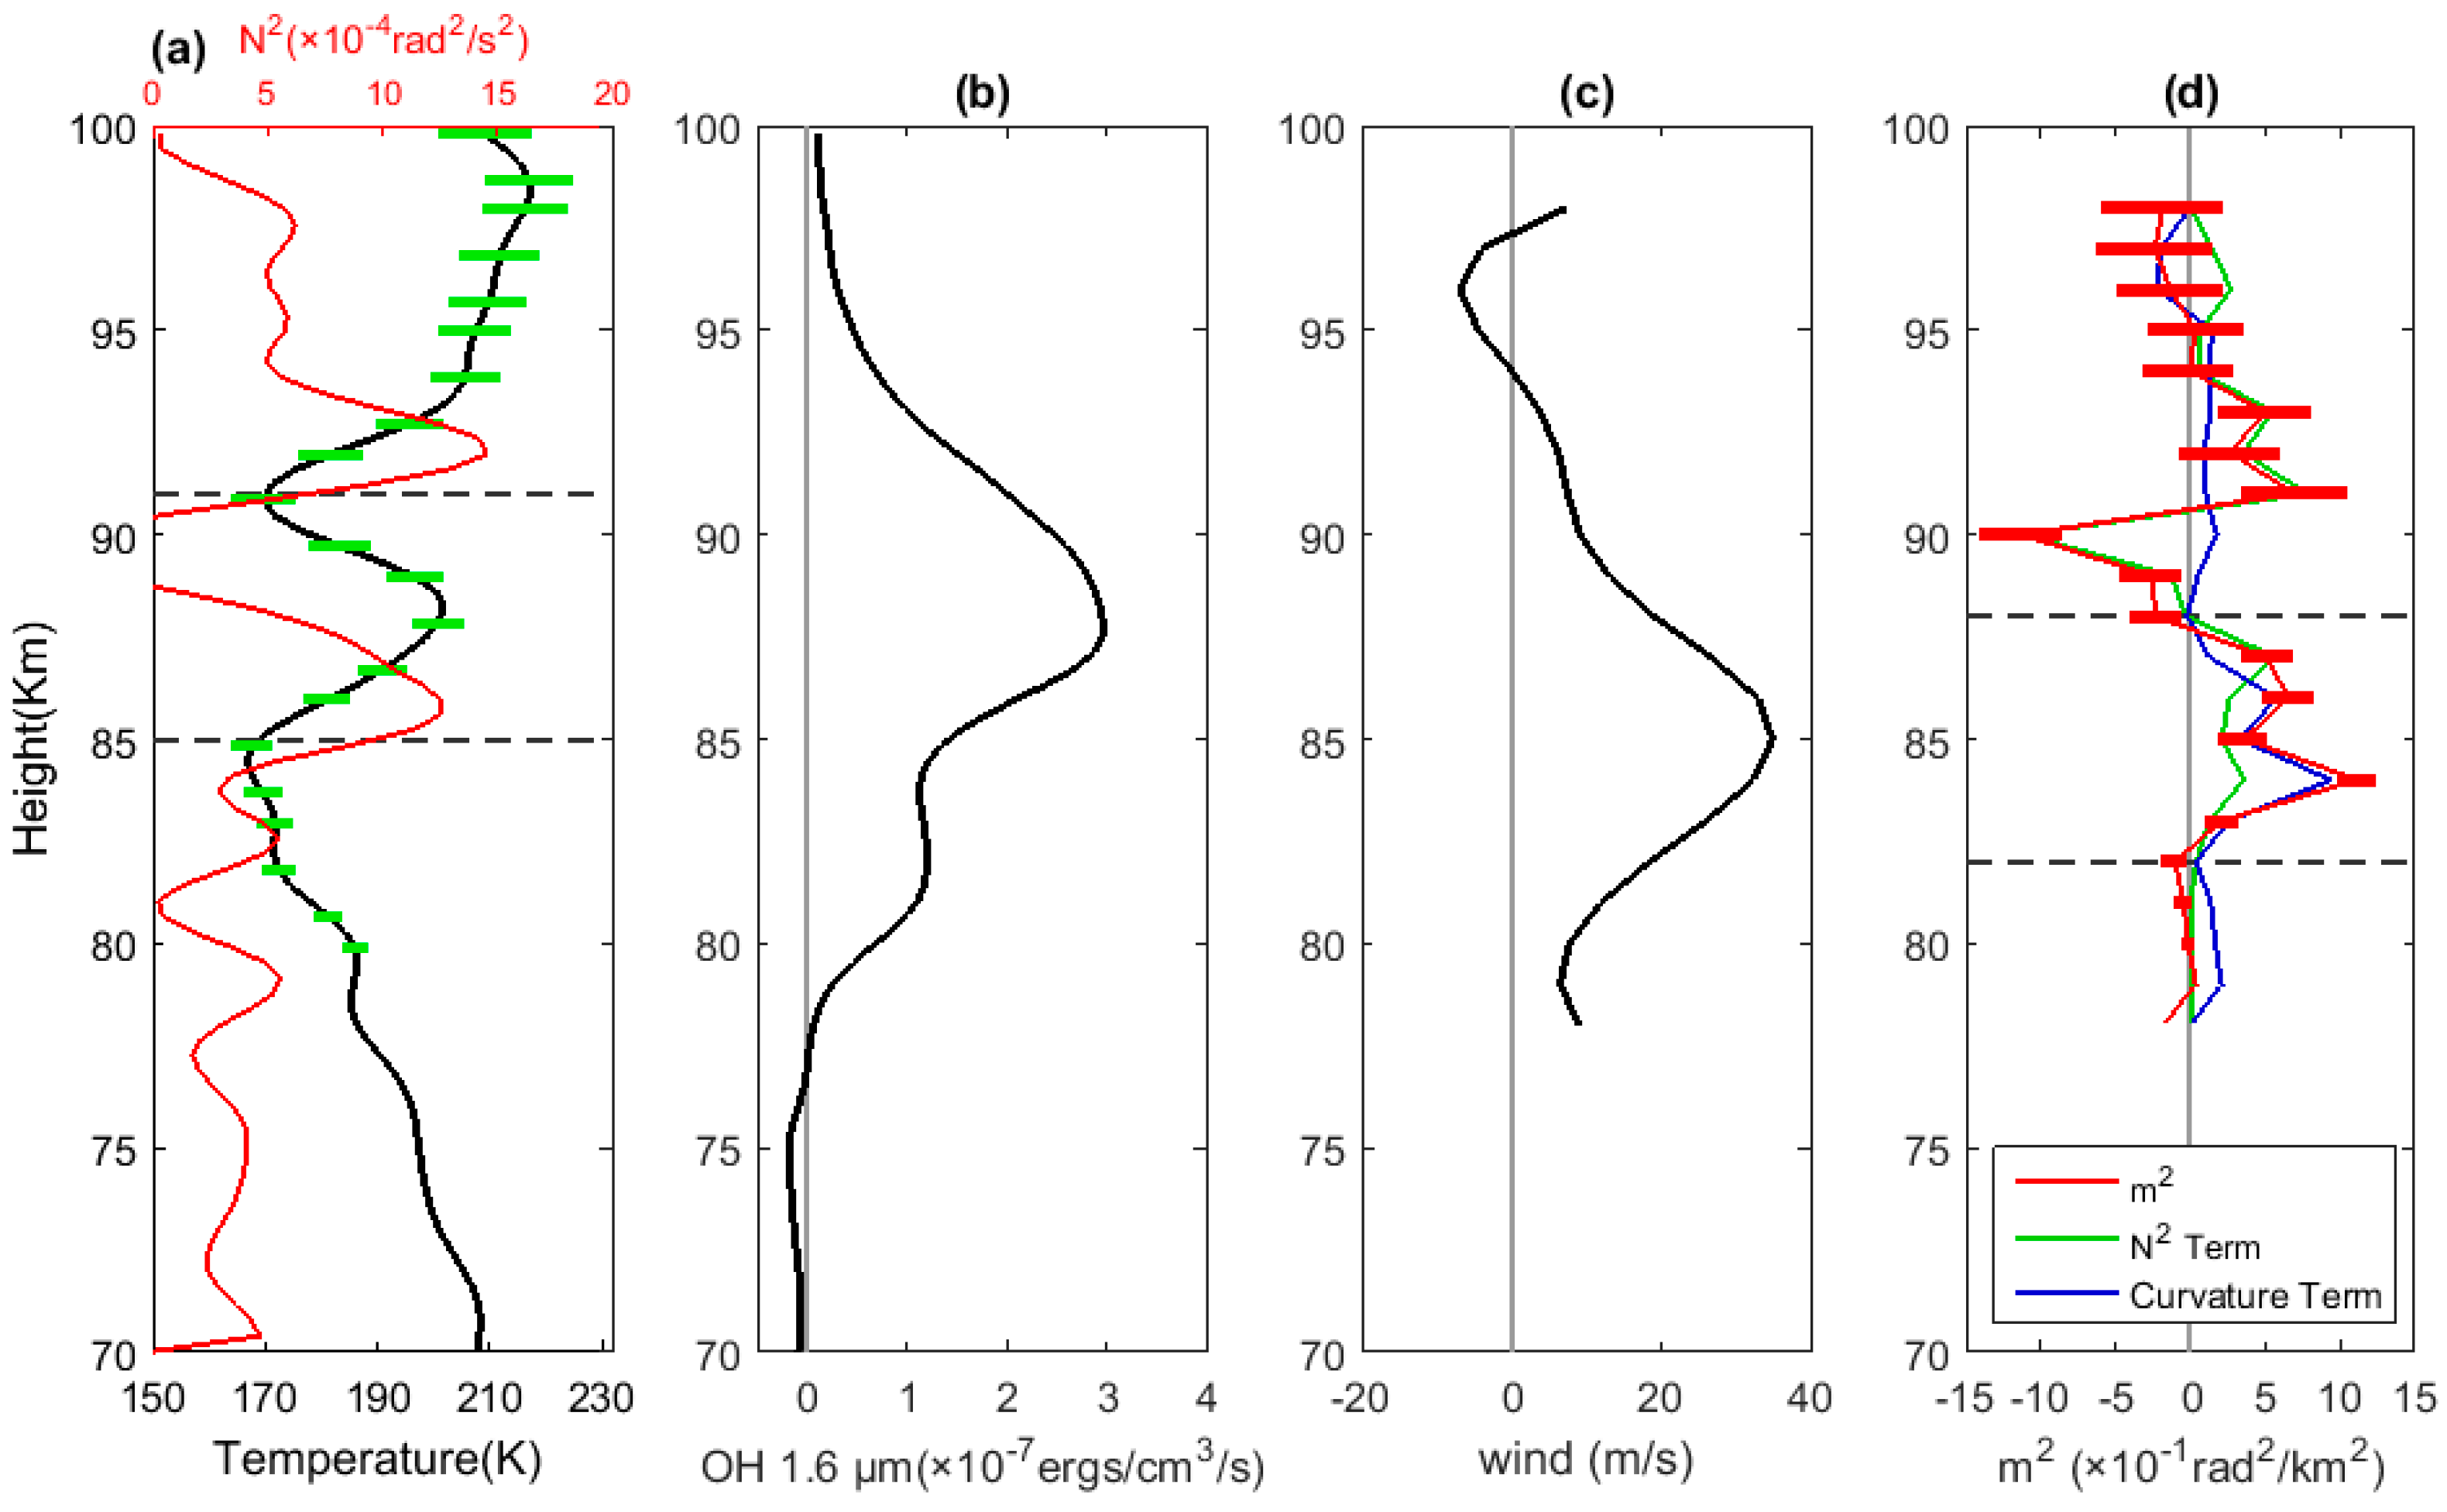
The thermal duct and wind duct structure have been proven to play important roles in the propagation of GWs [13,60,68,69,70]. The temperature inversion, which is the sudden increase around the mesopause in the vertical temperature profile, is a typical phenomenon of a thermal duct [38,43]. On the night of 10–11th August 2013, TIMED/SABER scanned the CGWs region four times (red crosses in Figure 1). An obvious temperature inversion layer, with a peak of 200 K, can be seen between the altitudes 85 km and 91 km (dotted lines in Figure 8a). The amplitude of the temperature inversion layer is ~30 K and it is as sharp as the previous observation in Northern China [38,43]. Remsberg et al. [71] assessed the quality of the temperature profiles observed by TIMED/SABER and calculated the root-sum-square (RSS) uncertainties of the temperature to present the random and bias errors. The RSS uncertainties are marked by green error bar in Figure 8a. Using Equation (2), the squared Brunt-Väisälä frequency (N2) can be derived from the temperature profile.
The peak of the 1.6 μm average OH emission profile is at 87 km in Figure 8b. According to the excitation source location and the arcs of the eastern half of CGWs (group A and group B) observed by the all-sky imager, the direction of propagation is eastward. Thus, the average u component of the meteor radar wind is used as the wind velocity in the propagation direction. The wind profile was vertically interpolated at 1 km per hour intervals (Figure 8c). Below 93 km, the wind direction is east, with a peak velocity at 85 km of 34.95 m/s.
The squared vertical wavenumber m2 is a criterion for the vertical propagation of GWs. In the layer where m2 is positive, surrounded by evanescent regions (where m2 is negative), the structure of CGWs is sustained, allowing them to propagate over longer distances. As Equation (3) reveals, m2 is controlled by the N2 term (the first term) and the curvature term (the second term), which represent the effects of temperature gradients and wind shear in the propagating environment, respectively. There is a thermal duct between 82 and 88 km in Figure 8d. Due to the lack of the original meteor radar data set, the random error of wind profile cannot be given. The average of the wind profile, during 21:00 LT to 23:00 LT, is used to decrease the effect of uncertainty in the wind profile. Thus, the deviation of m2 is propagated by the RSS uncertainties of temperature (red error bar in Figure 8d). The altitude of the duct region is associated with the peak of the wind profile. Figure 8d also illustrates that the curvature term contributes more towards m2 than the N2 term in the main ducting region.

7. Conclusions and Discussion

This paper reported the observation of typical stratospheric and mesospheric CGWs in northern China on the night of 10th August 2013. Two groups of mesospheric CGWs started to appear at 22:00 LT on 10th August and a series of arcs were observed by AIRS at 02:11 LT on 11th August. The CGWs were excited by a thunderstorm located at (40.59° N, 108.67° E). The stratospheric CGWs propagated horizontally for 516.92 km and the average horizontal wavelength was 151.70 km. In the mesosphere, group A propagated horizontally for 270.57 km and the average horizontal wavelength was 34.06 km. Group B propagated horizontally for a distance of 179.60 km and the average horizontal wavelength was 22.61 km. Compared with the mesospheric CGWs, the horizontal wavelengths of the stratospheric CGWs were much longer. The dispersion relationship was used to estimate the excitation source of the stratospheric and OH airglow CGWs. Although a brief analysis of mesospheric CGWs was completed by Wen et al. [63], more, different groups of waveforms have been extracted to fit the center in this work. Both of the fitting results are feasible; they describe all of the basic CGWs parameters and the propagation process of the intact CGWs event, while the CGWs were excited by the same thunderstorm. The horizontal wavelength values of CGWs (21.6 ± 2.5 km) investigated by Xu et al. [43] are similar to the observations in this paper, but the time scale was longer (~3 h) and the spatial scale was larger (~800 km). It is worth noting that, in this case, the horizontal propagation distance is much shorter in spite of the thermal duct observed.

Author Contributions

Y.W. performed the data analyses and wrote the manuscript; Q.Z. and H.G. contributed to the conceptualization of the study; J.X. and Q.L. provided all-sky dataset and methodology.

Funding

This research was funded by the National Key Basic Research Program of China grant NO. 2017YFC15015105 and the National Natural Science Foundation of China grant NO. 41775006 & NO. 41575004.

Acknowledgments

This work was financially supported by the National Key Basic Research Program of China (2017YFC15015105) and the National Natural Science Foundation of China (41775006, 41575004). The authors acknowledge the Chinese Meridian Project for providing the all-sky airglow and the meteor radar data.

Conflicts of Interest

The authors declare no conflict of interest. The founding sponsors had no role in the design of the study; in the collection, analyses, or interpretation of data; in the writing of the manuscript, or in the decision to publish the results.

References

  1. Fritts, D.C.; Alexander, M.J. Gravity wave dynamics and effects in the middle atmosphere. Rev. Geophys. 2003, 41, 1–68. [Google Scholar] [CrossRef]
  2. Holton, J.R.; Alexander, M.J. Gravity waves in the mesosphere generated by tropospheric convention. Tellus Ser. B-Chem. Phys. Meteorol. 1999, 51, 45–58. [Google Scholar] [CrossRef]
  3. Lane, T.P.; Reeder, M.J.; Clark, T.L. Numerical modeling of gravity wave generation by deep tropical convection. J. Atmos. Sci. 2001, 58, 1249–1274. [Google Scholar] [CrossRef]
  4. Alexander, M.; Holton, J.R.; Durran, D.R. The gravity wave response above deep convection in a squall line simulation. J. Atmos. Sci. 1995, 52, 2212–2226. [Google Scholar] [CrossRef]
  5. Pandya, R.E.; Alexander, M.J. Linear stratospheric gravity waves above convective thermal forcing. J. Atmos. Sci. 1999, 56, 2434–2446. [Google Scholar] [CrossRef]
  6. Lane, T.P.; Sharman, R.D.; Clark, T.L.; Hsu, H.M. An Investigation of Turbulence Generation Mechanisms above Deep Convection. J. Atmos. Sci. 2003, 60, 1297–1321. [Google Scholar] [CrossRef]
  7. Vadas, S.L.; Fritts, D.C. Reconstruction of the gravity wave field from convective plumes via ray tracing. Ann. Geophys. 2009, 27, 147–177. [Google Scholar] [CrossRef] [Green Version]
  8. Vadas, S.L.; Yue, J.; She, C.-Y.; Stamus, P.A.; Liu, A.Z. A model study of the effects of winds on concentric rings of gravity waves from a convective plume near Fort Collins on 11 May 2004. J. Geophys. Res. 2009, 114. [Google Scholar] [CrossRef] [Green Version]
  9. Choi, H.-J.; Chun, H.-Y.; Song, I.-S. Characteristics and Momentum Flux Spectrum of Convectively Forced Internal Gravity Waves in Ensemble Numerical Simulations. J. Atmos. Sci. 2007, 64, 3723–3734. [Google Scholar] [CrossRef]
  10. Pierce, A.; Coroniti, S. A mechanism for the generation of acoustic-gravity waves during thunderstorm formation. Nature 1966, 210, 1209–1210. [Google Scholar] [CrossRef]
  11. Liu, X.; Xu, J. Nonlinear interactions between gravity waves and different mean winds. Prog. Nat. Sci. 2006, 16, 1436–1441. [Google Scholar] [CrossRef]
  12. Wrasse, C.M.; Nakamura, T.; Tsuda, T.; Takahashi, H.; Medeiros, A.F.; Taylor, M.J.; Gobbi, D.; Salatun, A.; Suratno; Achmad, E.; et al. Reverse ray tracing of the mesospheric gravity waves observed at 23° S (Brazil) and 7° S (Indonesia) in airglow imagers. J. Atmos. Sol. Terr. Phys. 2006, 68, 163–181. [Google Scholar] [CrossRef]
  13. Fechine, J.; Wrasse, C.; Takahashi, H.; Medeiros, A.; Batista, P.; Clemesha, B.; Lima, L.; Fritts, D.; Laughman, B.; Taylor, M.J. First observation of an undular mesospheric bore in a Doppler duct. Ann. Geophys. 2009, 27, 1399. [Google Scholar] [CrossRef]
  14. Dewan, E.M.; Picard, R.H.; O’Neil, R.R.; Gardiner, H.A.; Gibson, J.; Mill, J.D.; Richards, E.; Kendra, M.; Gallery, W.O. MSX satellite observations of thunderstorm-generated gravity waves in mid-wave infrared images of the upper stratosphere. Geophys. Res. Lett. 1998, 25, 939–942. [Google Scholar] [CrossRef]
  15. Hoffmann, L.; Alexander, M.J. Retrieval of stratospheric temperatures from Atmospheric Infrared Sounder radiance measurements for gravity wave studies. J. Geophys. Res. 2009, 114. [Google Scholar] [CrossRef] [Green Version]
  16. Aumann, H.H.; Chahine, M.T.; Gautier, C.; Goldberg, M.D.; Kalnay, E.; McMillin, L.M.; Revercomb, H.; Rosenkranz, P.W.; Smith, W.L.; Staelin, D.H.; et al. AIRS/AMSU/HSB on the aqua mission: Design, science objectives, data products, and processing systems. IEEE Trans. Geosci. Remote Sens. 2003, 41, 253–264. [Google Scholar] [CrossRef]
  17. Grimsdell, A.W.; Alexander, M.J.; May, P.T.; Hoffmann, L. Model Study of Waves Generated by Convection with Direct Validation via Satellite. J. Atmos. Sci. 2010, 67, 1617–1631. [Google Scholar] [CrossRef] [Green Version]
  18. Hoffmann, L.; Alexander, M.J. Occurrence frequency of convective gravity waves during the North American thunderstorm season. J. Geophys. Res. 2010, 115. [Google Scholar] [CrossRef] [Green Version]
  19. Hecht, J.H.; Alexander, M.J.; Walterscheid, R.L.; Gelinas, L.J.; Vincent, R.A.; MacKinnon, A.D.; Woithe, J.M.; May, P.T.; Skinner, W.R.; Mlynczak, M.G.; et al. Imaging of atmospheric gravity waves in the stratosphere and upper mesosphere using satellite and ground-based observations over Australia during the TWPICE campaign. J. Geophys. Res. 2009, 114. [Google Scholar] [CrossRef] [Green Version]
  20. Kim, Y.-J.; Hong, S.-Y. Interaction between the orography-induced gravity wave drag and boundary layer processes in a global atmospheric model. Geophys. Res. Lett. 2009, 36. [Google Scholar] [CrossRef] [Green Version]
  21. Lane, T.P.; Sharman, R.D. Gravity wave breaking, secondary wave generation, and mixing above deep convection in a three-dimensional cloud model. Geophys. Res. Lett. 2006, 33. [Google Scholar] [CrossRef] [Green Version]
  22. Hecht, J.H.; Walterscheid, R.L.; Ross, M.N. First measurements of the two-dimensional horizontal wave number spectrum from CCD images of the nightglow. J. Geophys. Res. 1994, 99, 11449–11460. [Google Scholar] [CrossRef]
  23. Taylor, M.J.; Bishop, M.; Taylor, V. All-sky measurements of short period waves imaged in the OI (557.7 nm), Na (589.2 nm) and near infrared OH and O2 (0, 1) nightglow emissions during the ALOHA-93 campaign. Geophys. Res. Lett. 1995, 22, 2833–2836. [Google Scholar] [CrossRef]
  24. Taylor, M.J.; Pautet, P.D.; Medeiros, A.F.; Buriti, R.; Fechine, J.; Fritts, D.C.; Vadas, S.L.; Takahashi, H.; Sabbas, F.T.S.O. Characteristics of mesospheric gravity waves near the magnetic equator, Brazil, during the SpreadFEx campaign. Ann. Geophys. 2009, 27, 461–472. [Google Scholar] [CrossRef] [Green Version]
  25. Smith, S.M.; Mendillo, M.; Baumgardner, J.; Clark, R.R. Mesospheric gravity wave imaging at a subauroral site: First results from Millstone Hill. J. Geophys. Res. Space Phys. 2000, 105, 27119–27130. [Google Scholar] [CrossRef] [Green Version]
  26. Li, Q.; Xu, J.; Yue, J.; Yuan, W.; Liu, X. Statistical characteristics of gravity wave activities observed by an OH airglow imager at Xinglong, in northern China. Ann. Geophys. 2011, 29, 1401–1410. [Google Scholar] [CrossRef] [Green Version]
  27. Swenson, G.R.; Mende, S.B. OH emission and gravity waves (including a breaking wave) in all-sky imagery from Bear Lake, UT. Geophys. Res. Lett. 1994, 21, 2239–2242. [Google Scholar] [CrossRef]
  28. Sentman, D.D.; Wescott, E.M.; Picard, R.H.; Winick, J.R.; Stenbaek-Nielsen, H.C.; Dewan, E.M.; Moudry, D.R.; São Sabbas, F.T.; Heavner, M.J.; Morrill, J. Simultaneous observations of mesospheric gravity waves and sprites generated by a midwestern thunderstorm. J. Atmos. Sol. Terr. Phys. 2003, 65, 537–550. [Google Scholar] [CrossRef] [Green Version]
  29. Suzuki, S.; Vadas, S.L.; Shiokawa, K.; Otsuka, Y.; Kawamura, S.; Murayama, Y. Typhoon-induced concentric airglow structures in the mesopause region. Geophys. Res. Lett. 2013, 40, 5983–5987. [Google Scholar] [CrossRef] [Green Version]
  30. Yue, J.; Vadas, S.L.; She, C.-Y.; Nakamura, T.; Reising, S.C.; Liu, H.-L.; Stamus, P.; Krueger, D.A.; Lyons, W.; Li, T. Concentric gravity waves in the mesosphere generated by deep convective plumes in the lower atmosphere near Fort Collins, Colorado. J. Geophys. Res. 2009, 114. [Google Scholar] [CrossRef] [Green Version]
  31. Hines, C.O.; Tarasick, D.W. On the detection and utilization of gravity waves in airglow studies. Planet. Space Sci. 1987, 35, 851–866. [Google Scholar] [CrossRef]
  32. Hickey, M.P.; Walterscheid, R.L.; Taylor, M.J.; Ward, W.; Schubert, G.; Zhou, Q.; Garcia, F.; Kelly, M.C.; Shepherd, G.G. Numerical simulations of gravity waves imaged over Arecibo during the 10-day January 1993 campaign. J. Geophys. Res. Space Phys. 1997, 102, 11475–11489. [Google Scholar] [CrossRef] [Green Version]
  33. Schubert, G.; Walterscheid, R.L. Wave-driven fluctuations in OH nightglow from an extended source region. J. Geophys. Res. 1988, 93, 9903. [Google Scholar] [CrossRef]
  34. Swenson, G.R.; Gardner, C.S. Analytical models for the responses of the mesospheric OH* and Na layers to atmospheric gravity waves. J. Geophys. Res. Atmos. 1998, 103, 6271–6294. [Google Scholar] [CrossRef] [Green Version]
  35. Liu, A.Z. A modeling study of O2 and OH airglow perturbations induced by atmospheric gravity waves. J. Geophys. Res. 2003, 108. [Google Scholar] [CrossRef]
  36. Chen, D.; Chen, Z.; Lü, D. Simulation of the stratospheric gravity waves generated by the Typhoon Matsa in 2005. Sci. China Earth Sci. 2011, 55, 602–610. [Google Scholar] [CrossRef]
  37. Fritts, D.C.; Nastrom, G.D. Sources of mesoscale variability of gravity waves. Part II: Frontal, convective, and jet stream excitation. J. Atmos. Sci. 1992, 49, 111–127. [Google Scholar] [CrossRef]
  38. Li, Q.; Xu, J.; Yue, J.; Liu, X.; Yuan, W.; Ning, B.; Guan, S.; Younger, J.P. Investigation of a mesospheric bore event over northern China. Ann. Geophys. 2013, 31, 409–418. [Google Scholar] [CrossRef] [Green Version]
  39. Xu, J.; Smith, A.K.; Jiang, G.; Gao, H.; Wei, Y.; Mlynczak, M.G.; Russell, J.M. Strong longitudinal variations in the OH nightglow. Geophys. Res. Lett. 2010, 37. [Google Scholar] [CrossRef] [Green Version]
  40. Vadas, S.; Yue, J.; Nakamura, T. Mesospheric concentric gravity waves generated by multiple convective storms over the North American Great Plain. J. Geophys. Res. Atmos. 2012, 117. [Google Scholar] [CrossRef] [Green Version]
  41. Perwitasari, S.; Sakanoi, T.; Yamazaki, A.; Otsuka, Y.; Hozumi, Y.; Akiya, Y.; Saito, A.; Shiokawa, K.; Kawamura, S. Coordinated airglow observations between IMAP/VISI and a ground-based all-sky imager on concentric gravity wave in the mesopause. J. Geophys. Res. Space Phys. 2015, 120, 9706–9721. [Google Scholar] [CrossRef]
  42. Vargas, F.; Swenson, G.; Liu, A.; Pautet, D. Evidence of the excitation of a ring-like gravity wave in the mesosphere over the Andes Lidar Observatory. J. Geophys. Res. Atmos. 2016, 121, 8896–8912. [Google Scholar] [CrossRef] [Green Version]
  43. Xu, J.; Li, Q.; Yue, J.; Hoffmann, L.; Straka, W.C.; Wang, C.; Liu, M.; Yuan, W.; Han, S.; Miller, S.D. Concentric gravity waves over northern China observed by an airglow imager network and satellites. J. Geophys. Res. Atmos. 2015, 120. [Google Scholar] [CrossRef]
  44. Wang, C.M.; Qinzeng, L.I.; Jiyao, X.U.; Sun, L.C.; Yuan, W. A study of wave sources of gravity wave events observer by OH airglow imager located at Donggang station. Chin. J. Geophys. 2018. (In Chinese) [Google Scholar] [CrossRef]
  45. Hoffmann, L.; Wu, X.; Alexander, M.J. Satellite Observations of Stratospheric Gravity Waves Associated with the Intensification of Tropical Cyclones. Geophys. Res. Lett. 2018, 45, 1692–1700. [Google Scholar] [CrossRef]
  46. Weinstock Theory of the interaction of gravity waves with O2(1Σ) airglow. J. Geophys. Res. Space Phys. 1978, 83, 5175–5185. [CrossRef]
  47. Moreels, G.; Herse, M. Photographic evidence of waves around the 85 km level. Planet. Space Sci. 1977, 25, 265–273. [Google Scholar] [CrossRef]
  48. Nakamura, T.; Fukushima, T.; Tsuda, T.; She, C.Y.; Williams, B.P.; Krueger, D.; Lyons, W. Simultaneous observation of dual-site airglow imagers and a sodium temperature-wind lidar, and effect of atmospheric stability on the airglow structure. Adv. Space Res. 2005, 35, 1957–1963. [Google Scholar] [CrossRef]
  49. Liu, X.; Yue, J.; Xu, J.; Garcia, R.R.; Russell, J.M.; Mlynczak, M.; Wu, D.L.; Nakamura, T. Variations of global gravity waves derived from 14 years of SABER temperature observations. J. Geophys. Res. Atmos. 2017, 122, 6231–6249. [Google Scholar] [CrossRef]
  50. Mlynczak, M.G. Energetics of the mesosphere and lower thermosphere and the SABER experiment. Adv. Space Res. 1997, 20, 1177–1183. [Google Scholar] [CrossRef]
  51. Jing, T.; Kamalabadi, F.; Rumsey, L.G.; Swenson, G.R. Point-source suppression for atmospheric wave extraction from airglow imaging measurements. IEEE Trans. Geosci. Remote Sens. 2003, 41, 146–152. [Google Scholar] [CrossRef]
  52. Suzuki, S.; Shiokawa, K.; Otsuka, Y.; Ogawa, T.; Kubota, M.; Tsutsumi, M.; Nakamura, T.; Fritts, D.C. Gravity wave momentum flux in the upper mesosphere derived from OH airglow imaging measurements. Earth Planets Space 2007, 59, 421–428. [Google Scholar] [CrossRef] [Green Version]
  53. Baker, D.J.; Stair, A.T., Jr. Rocket measurements of the altitude distributions of the hydroxyl airglow. Phys. Scr. 1988, 37, 611–622. [Google Scholar] [CrossRef]
  54. Cao, B.; Heale, C.J.; Guo, Y.; Liu, A.Z.; Snively, J.B. Observation and modeling of gravity wave propagation through reflection and critical layers above Andes Lidar Observatory at Cerro Pachón, Chile. J. Geophys. Res. Atmos. 2016, 121, 12737–12750. [Google Scholar] [CrossRef]
  55. Cowling, D.H.; Webb, H.D.; Yeh, K.C. Group rays of internal gravity waves in a wind-stratified atmosphere. J. Geophys. Res. 1971, 76, 213–220. [Google Scholar] [CrossRef]
  56. Waldock, J.A.; Jones, T.B. The effects of neutral winds on the propagation of medium-scale atmospheric gravity waves at mid-latitudes. J. Atmos. Sol. Terr. Phys. 1984, 46, 217–231. [Google Scholar] [CrossRef]
  57. Hertzog, A.; Vial, F. A study of the dynamics of the equatorial lower stratosphere by use of ultra-long-duration balloons: 2. Gravity waves. J. Geophys. Res. Atmos. 2001, 106, 22745–22761. [Google Scholar] [CrossRef] [Green Version]
  58. Bertin, F.; Testud, J.; Kersley, L.; Rees, P.R. The meteorological jet stream as a source of medium scale gravity waves in the thermosphere: An experimental study. J. Atmos. Sol. Terr. Phys. 1978, 40, 1161–1183. [Google Scholar] [CrossRef]
  59. Hines, C.O. Internal atmospheric gravity waves at ionospheric heights. Can. J. Phys. 1960, 38, 1424–1427. [Google Scholar] [CrossRef]
  60. Dewan, E.M.; Picard, R.H. Mesospheric bores. J. Geophys. Res. Atmos. 1998, 103, 6295–6305. [Google Scholar] [CrossRef] [Green Version]
  61. Isler, J.R.; Taylor, M.J.; Fritts, D.C. Observational evidence of wave ducting and evanescence in the mesosphere. J. Geophys. Res. Atmos. 1997, 102, 26301–26313. [Google Scholar] [CrossRef] [Green Version]
  62. Hapgood, M.A.; Taylor, M.J. Analysis of airglow image data. Ann. Geophys. 1982, 38, 805–813. [Google Scholar]
  63. Wen, Y.; Zhang, Q.; Xu, J.; Li, Q.; Gao, H. The Propagation Characteristics of Mesospheric Concentric Gravity Waves Excited by Thunderstorm. Chin. J. Geophys. 2018. (In Chinese) (accepted) [Google Scholar]
  64. Gong, J.; Wu, D.L.; Eckermann, S.D. Gravity wave variances and propagation derived from AIRS radiances. Atmos. Chem. Phys. 2012, 12, 1701–1720. [Google Scholar] [CrossRef] [Green Version]
  65. Fovell, R.; Durran, D.; Holton, J. Numerical simulations of convectively generated stratospheric gravity waves. J. Atmos. Sci. 1992, 49, 1427–1442. [Google Scholar] [CrossRef]
  66. Chou, M.Y.; Lin, C.C.H.; Huba, J.D.; Lien, C.P.; Chen, C.H.; Yue, J.; Chang, L.C.; Rajesh, P.K. Numerical modeling of the concentric gravity wave seeding of low-latitude nighttime medium-scale traveling ionospheric disturbances. Geophys. Res. Lett. 2018. [Google Scholar] [CrossRef]
  67. Medeiros, A.F. An investigation of gravity wave activity in the low-latitude upper mesosphere: Propagation direction and wind filtering. J. Geophys. Res. 2003, 108. [Google Scholar] [CrossRef] [Green Version]
  68. Smith, S.M.; Taylor, M.J.; Swenson, G.R.; She, C.-Y.; Hocking, W.; Baumgardner, J.; Mendillo, M. A multidiagnostic investigation of the mesospheric bore phenomenon. J. Geophys. Res. Space Phys. 2003, 108. [Google Scholar] [CrossRef] [Green Version]
  69. She, C.Y.; Li, T.; Williams, B.P.; Yuan, T.; Picard, R.H. Concurrent OH imager and sodium temperature/wind lidar observation of a mesopause region undular bore event over Fort Collins/Platteville, Colorado. J. Geophys. Res. Atmos. 2004, 109. [Google Scholar] [CrossRef] [Green Version]
  70. Bageston, J.V.; Wrasse, C.M.; Batista, P.P.; Hibbins, R.E.; C Fritts, D.; Gobbi, D.; Andrioli, V.F. Observation of a mesospheric front in a thermal-doppler duct over King George Island, Antarctica. Atmos. Chem. Phys. 2011, 11, 12137–12147. [Google Scholar] [CrossRef] [Green Version]
  71. Remsberg, E.E.; Marshall, B.T.; Garcia-Comas, M.; Krueger, D.; Lingenfelser, G.S.; Martin-Torres, J.; Mlynczak, M.G.; Russell, J.M.; Smith, A.K.; Zhao, Y.; et al. Assessment of the quality of the Version 1.07 temperature-versus-pressure profiles of the middle atmosphere from TIMED/SABER. J. Geophys. Res. 2008, 113. [Google Scholar] [CrossRef] [Green Version]
Figure 1. (a) The fitting of the circles’ centers (red triangle) and waveforms of (b) group A and (c) group B on 10th August. The crests marked by red dots and troughs marked by green dots.
Atmosphere 09 00489 g001
Figure 2. Concentric gravity waves (CGWs) (wave peak marked by the green dashed line) caused the disturbance in the radiation temperature field detected by Atmospheric Infrared Sounder (AIRS) at 02:11 LT on 11th August. The center of the excited thunderstorm is marked as a yellow circle, and the blue plane is the boundary of the Shuozhou station. On 10th August, TIMED/SABER scanned this CGW event at 22:14 LT, 22:15 LT, 22:16 LT, and 22:17 LT. The sensing locations are marked as red crosses. The yellow triangle is the meteor radar station in Beijing.
Atmosphere 09 00489 g002
Figure 3. The relative luminosity intensity variation of OH airglow wave group A (a) at 22:10 LT on 10th August and radiation temperature perturbation of AIRS (b) at 02:11 LT on 11th August.
Atmosphere 09 00489 g003
Figure 4. Temporal and spatial horizontal wavelengths variations measured by the all-sky imager at 22:07 LT and 22:09 LT on 10th August.
Atmosphere 09 00489 g004
Figure 5. Temporal and spatial horizontal wavelengths variations measured by AIRS at 02:11 LT on 11th August.
Atmosphere 09 00489 g005
Figure 6. The background wind in the stratosphere above the convective system at 18:00 LT on 10th August.
Atmosphere 09 00489 g006
Figure 7. The vector wind profile on the night of 10–11th August 2013. The arrow denotes the direction of the wind; upwards is north, right is east. The CGWs were measured from 22:00 LT to 23:00 LT and are shown as the red lines.
Atmosphere 09 00489 g007
Figure 8. The height profile of (a) temperature and N2 (red line) at 22:16 LT, and (b) the average 1.6 μm OH emission intensity observed by SABER at 22:14 LT, 22:15 LT, 22:16 LT and 22:17 LT on 10th August. The green error bars are the RSS uncertainties. (c) Average height profile of the meteoric wind in the direction of CGW propagation at the Beijing station (39.98° N, 116.37° E) from 21:00 LT to 23:00 LT on 10th August. (d) The profile of the squared vertical wavenumber m2 is calculated by the (a) N2 term and (c) wind; the green (N2 term) and blue (curvature term) lines are the first term and second term in Equation (3). The deviations (red error bars) are propagated by the temperature.
Atmosphere 09 00489 g008