1. Introduction
Water is an essential element necessary for life on Earth. It is present in the atmosphere in its three phases: gas, liquid, and ice. Water vapor is the main natural greenhouse gas, originating from the evaporation of oceans and lakes. It condenses to form clouds of liquid water and ice. Cloud drops can coalesce and precipitate. For many years meteorologists have considered two types of precipitation, stratiform, and convective [
1].
Stratiform rainfall is characterized by a large horizontal extension, a low vertical extension and a low spatial and temporal variability of rainfall intensities. Convective rainfall is characterized by a larger vertical extension and a strong spatial and temporal variability of rainfall intensity. Convective and stratiform rainfall differs also in terms of rain cloud microphysical process [
2].
At the global scale, the rainfall is very heterogeneous, because it is highly dependent on processes related to the water cycle (quantities of water, solar radiation, and dynamics) [
3]. The Sahel region is a transition zone between Sahara and the wet climate of tropical Africa. It is under the influence of the West African monsoon, which brings the intertropical convergence zone (ITCZ) associated with moisture. Rainfall maxima from April to October are associated to Mesoscale Convective systems (MCS). However, these rainfall events and their intraseasonnal variability are complex, not linear. They can be linked to various other factors such as local orography [
4], heat flow [
5], and surface albedo [
6]. These factors have been investigated in the framework of the international project AMMA (African Monsoon Multidisciplinary Analysis), allowing the knowledge of the West African monsoon and its variability on different timescales to be improved [
7].
In comparison, Mediterranean climates are marked by temperate temperatures, marked seasonal rainfall and heat, and the summer season is drier than winter. Episodes of precipitation can be induced by orographic convection such as cevenol events [
8], by meso-scale convective systems [
9], or by cumulonimbus [
10]. The impact of these atmospheric processes in the Mediterranean have been studied in the framework of HYMEX, an international project which aims to better understand the water cycle and to improve the forecasting of hydro meteorological risks such as intense rains, rapid floods, high winds and droughts [
11].
Long term time series allow the probability distributions of duration of rain and drought episodes to be established, and compared in different contexts. The probability distribution is based on a geometric binary description (“rain” or “no rain”) of rainfall durations, and of lengths of MCS. This approach has been used in the case of non-precipitating clouds and gives results close to a passive scalar in turbulent field [
12]. The characterization of spatio-temporal distributions of successive rainy and/or dry events based on the analysis of daily rainfall series has been the subject of several recent studies. Characterizing wet and dry episodes in West Africa and describing the spatio-temporal variability of occurrences of rainy and dry episodes. Froidurot and Diedhiou [
13] quantified the influence of relief on the number and duration of rainy and dry episodes, and showed that the number of wet and dry spells decreases with their duration. Isolated wet days contribute the most to the total number of rainy days, while most frequent dry days duration is 2 days. Ratan et al. [
14] suggested that the characteristics of rainy or dry episodes depend only on the “arid” or “wet” nature of the area. By analyzing rainfall data with one-minute resolution, Peters et al. [
15] found a power law decrease of the probability distribution of the rainy and dry durations.
In this work we propose to characterize the distribution of rainfall in connection with convective systems over a wide spatial range in the Sahel and in South of France. After a description of the data and of the study areas (
Section 2), we present the methodology to establish the probability distributions of durations and lengths (
Section 3), and then an analysis of the nature of long-term rainfall distributions, in terms of duration and space (
Section 4).
2. Data and Methods
This work is focused on the Sahel region (20° W–30° E, 10° N–20° N), where West African monsoon processes occur. We use rainfall ground based data at four sites in Senegal. In order to compare the results with mid-latitudes, we also analyze data from four sites in France. The daily cumulative precipitation is obtained from the rain gauges of the large rainfall database of the French Research Institute for Development (IRD) deployed in Senegal. Rainfall observations data at the four sites in France are produced by Meteo-France.
In this work we use version 1.1 of the Global Precipitation Climatology Project (GPCP) daily rainfall data for the period 1998–2008, which allows us to extend the characterization of rainfall durations and lengths between 0 and 40° N to cover the equatorial zone, Sahel and mid-latitude. The One-Degree Daily (1DD) product consists in the daily estimate of precipitation on a 1° × 1° latitude/longitude grid from available observational data. Where possible (40° N–40° S), the Threshold-Matched Precipitation Index (TMPI) provides precipitation estimates in which the 3-hourly infrared brightness temperatures (IR Tb) are compared with a threshold and all “cold” pixels are given a single precipitation rate. Starting in October 1996, the GPCP set the stage for higher resolution estimates by working with the geosynchronous-satellite operators around the world to collect histograms of geo-IR brightness temperature (Tb) on a 1° × 1° grid covering 40° N–40° S at 3-hourly intervals. To complete the coverage of the TMPI precipitation dataset obtained from the 3-hourly geo-IR histograms, a technique for estimating precipitation outside of the geo-IR coverage was developed using sounding data from low-earth polar-orbit satellites. Together, these form the 1DD dataset, which is a first approach for estimating global daily precipitation at the 1° × 1° scale from observationally based data. The objective is to use statistical parameters from trusted estimates to constrain the overall behavior of the 1DD estimates, and then to use the geo-IR and sounding data to determine the day-to-day behavior [
16].
3. Statistical Methods
We propose a methodology based on the analysis of the probability distribution of the duration of rainy and dry events. The wet/dry duration series will allow the spatio-temporal characteristics such as the length of the MCS and the duration of the rains to be detected.
This analysis has the advantage of allowing simple statistical analyzes preserving the geometric complexity of the spatial and temporal distribution of rainfall.
3.1. Definition of Threshold
A rainy episode characterization is based on the distinction between rainy and dry days. This involves defining a rain value considered as the threshold which constitutes the limit separating “rain” from “non-rain”. Any day without precipitation is considered dry. To avoid differences in perceptions of small rains by the different measurement stations, Stern et al. [
17] estimate that a value of 0.85 mm of rain should be used as threshold. Salack et al. [
18] define a threshold of 0.1 mm in their work to identify the distributions of rainfall breaks in the Sahel monsoon. Other authors consider that a day is rainy (dry) if one records more (less) than 1 mm of rain [
13,
19]. Following the binary logic, “rain” or “non-rain”, of our approach we have chosen a threshold of detection which is minimal and equal to 0.1 mm.
3.2. Definition of Rain Duration Probability Distributions
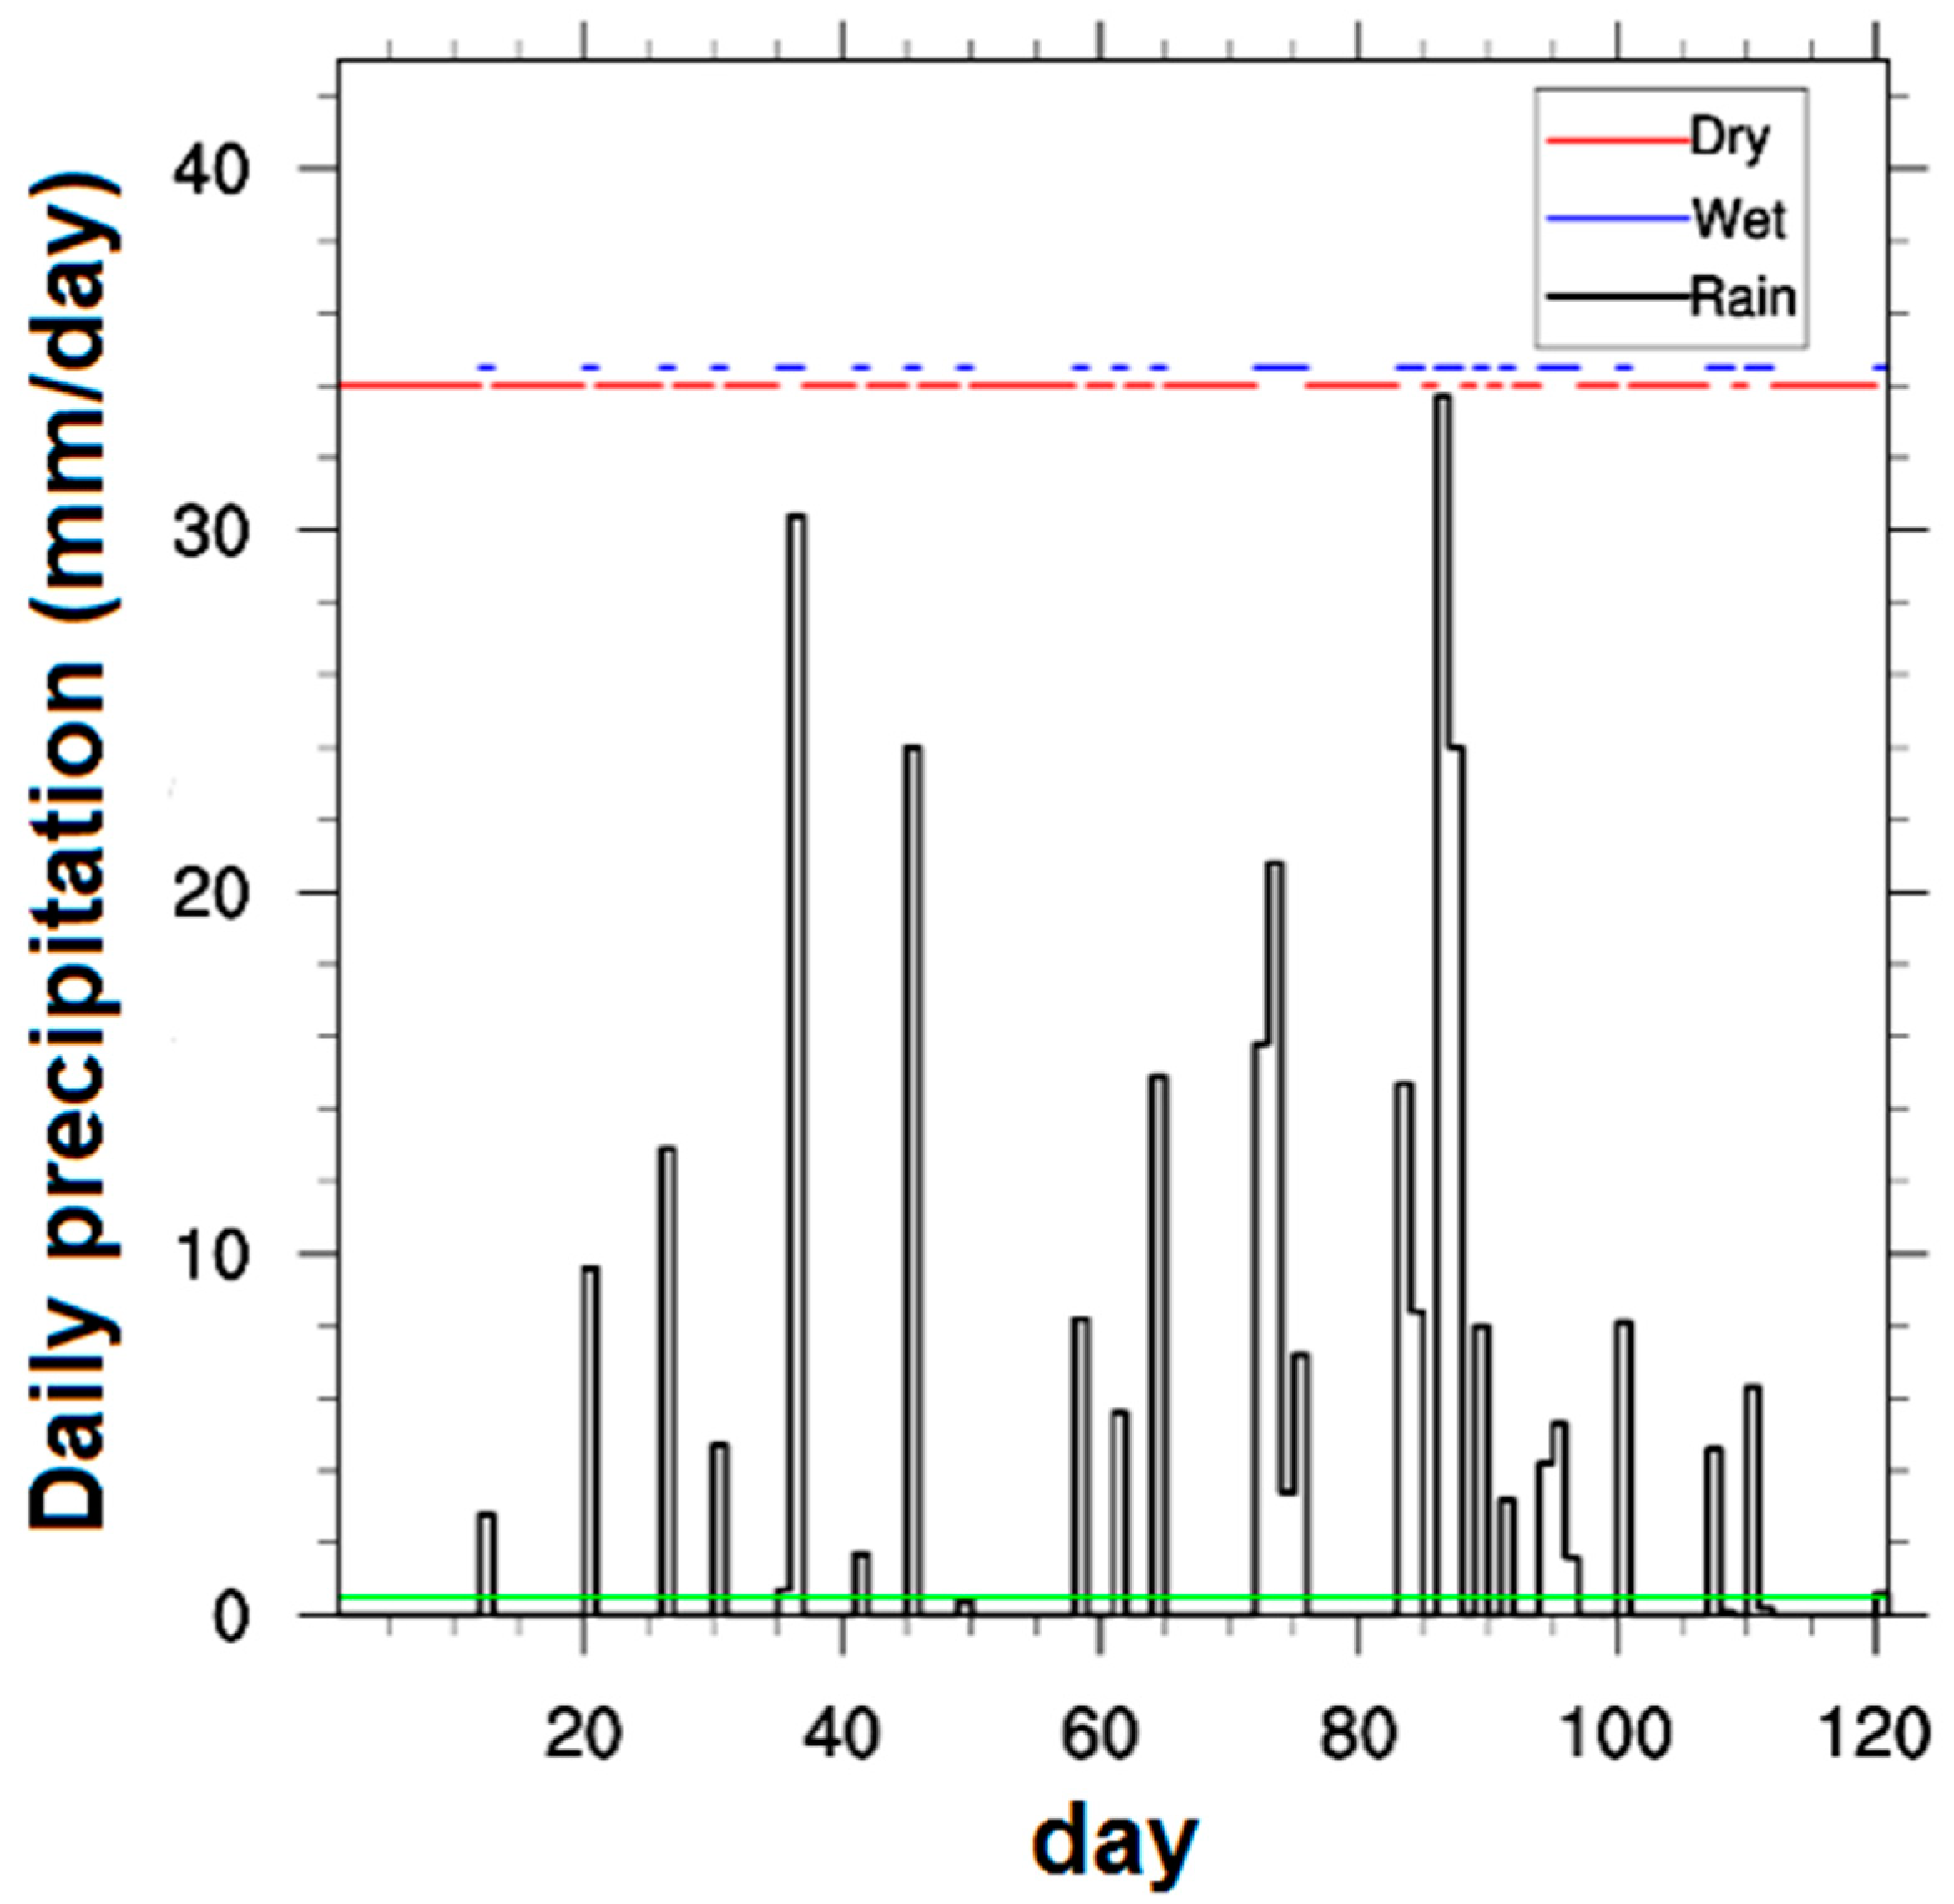
The duration of the episodes of rain (number of successive rainy days) or drought (number of successive days without rain) is a simple geometric measurement characterizing rain. The probability distribution of the durations is estimated by considering the successive rainy days (where the amount of rain recorded exceeds the defined threshold), and stop when a “dry” day occurs (
Figure 1).
In the same way we count the successive days without rain when the daily rain is below the threshold. A rainy (dry) episode is considered to be a succession of rainy days between two dry (rainy) episodes. A rainy or dry episode has a minimum duration equal to one day. Thus we obtain a set of successive rainy and dry days (episodes), but also the number and probability of occurrences of rainy and dry episodes in the series. To quantify the distribution of rare events from long rainy or dry episodes, it is preferable to use the distribution function P(X > x) rather than the probability density P(x − dx < X < x + dx). Our work in this study will be limited to the characterization of long rainy episodes.
3.3. Definition of Length Probability Distribution
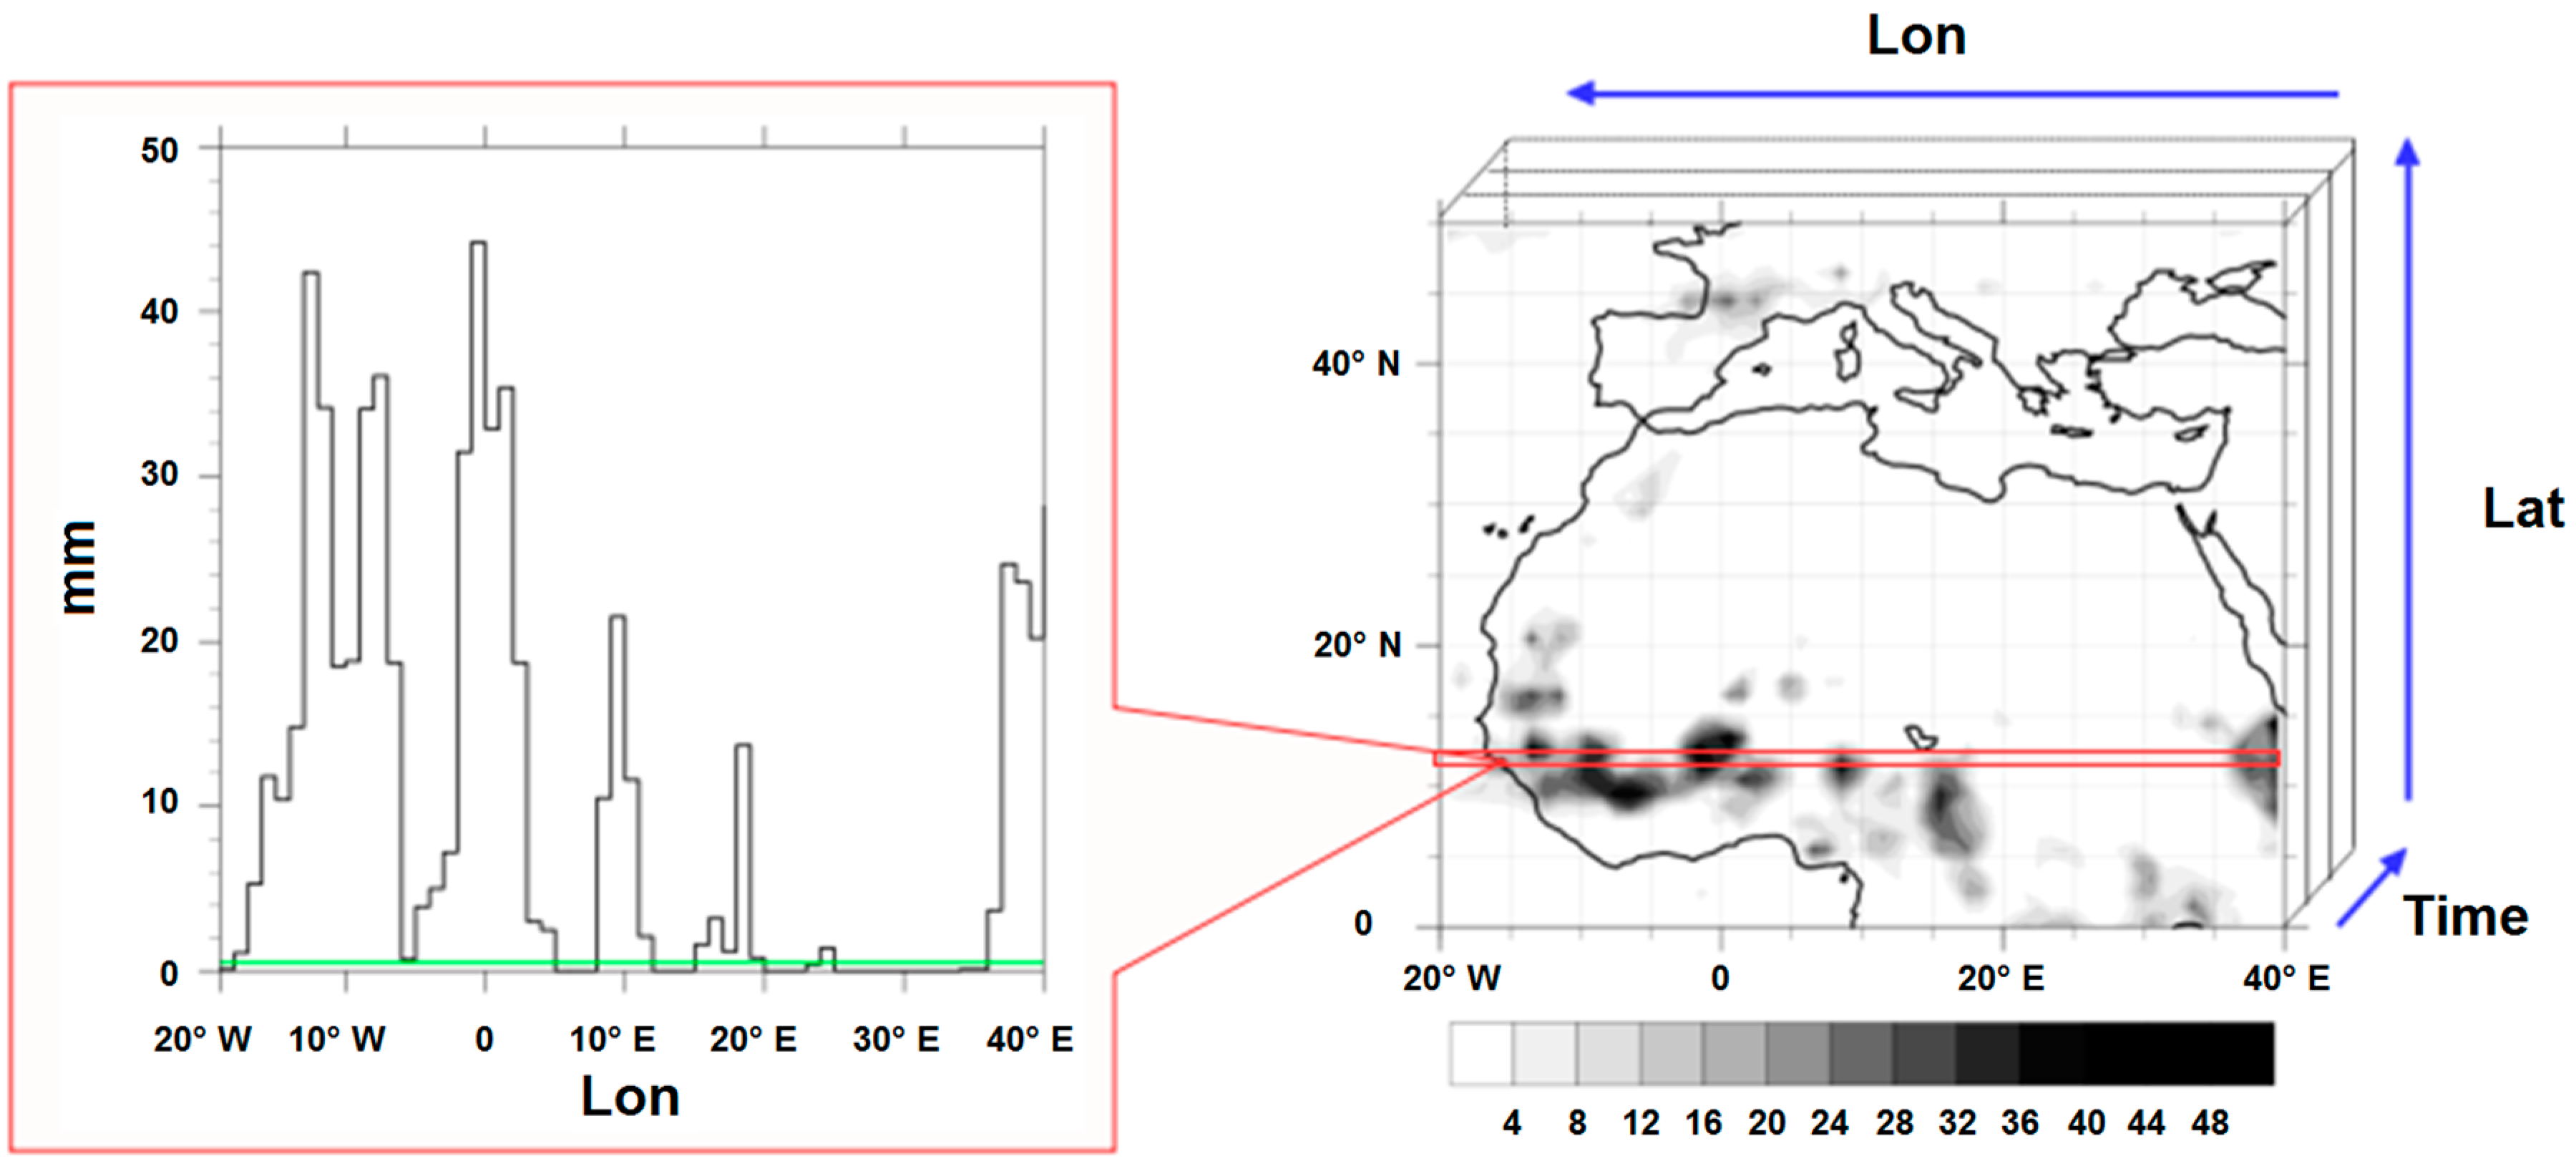
The probability distribution of the lengths (in degrees of longitude) of MCS characterizes the size of the convective precipitating systems. It can be compared to that of the durations. It is possible to use the ensemble average of a large number of East–West transects from GPCP horizontal maps to estimate the horizontal size distributions of the rainy regions.
Figure 2 presents a 3D precipitation map (time (4018 values from 1 January 1998 to 31 December 2008) × latitude (0–30° N) × longitude (30° W–30° E)).
The same threshold that those used for the probability distribution of durations is used to distinguish between “rain” and “non-rain” on the first 2D map (corresponding to 1 January 1998). The successive pixels of rain are considered as a given length of MCS which is measured in degree of longitude. At given latitude we process the second 2D map (corresponding to 2 January 1998) and we perform the same operation. This operation is repeated 4018 times per latitude to calculate the probability distribution of length and build a histogram of lengths (in degrees of longitude).
4. Results
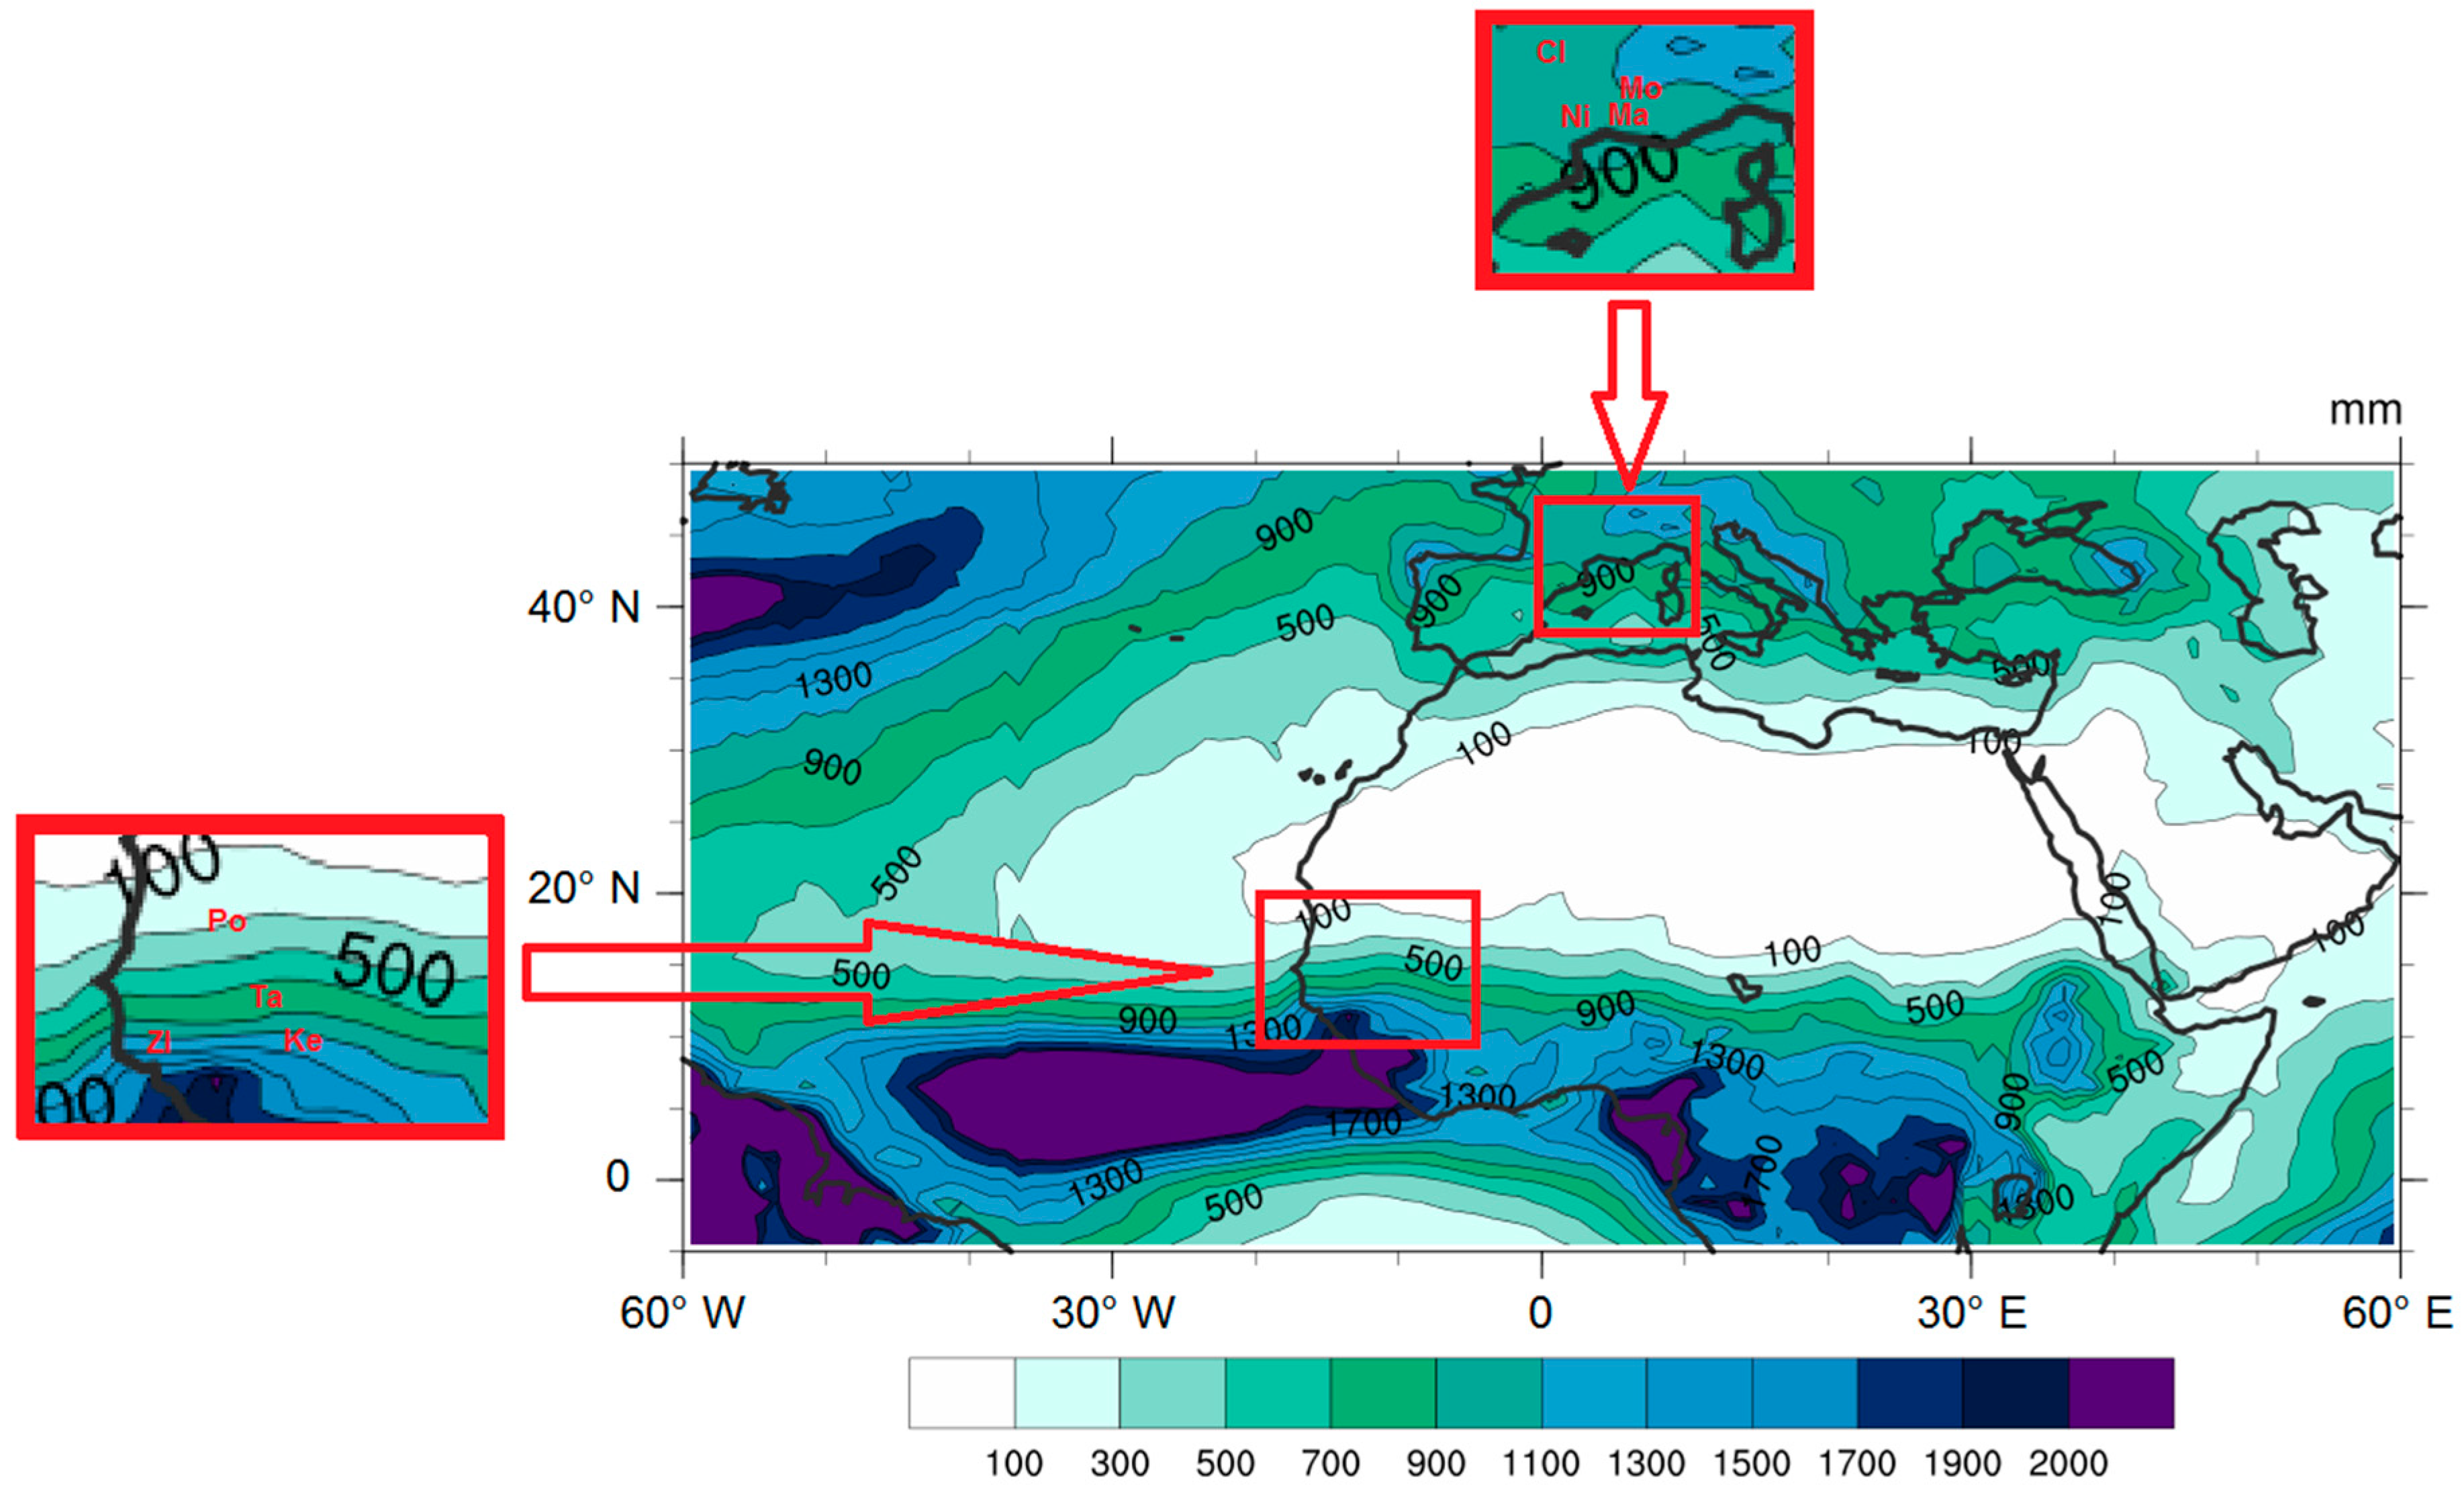
The annual cumulative rainfall over the period 1998–2008 is given in
Figure 3. We observe a south–north precipitation gradient with high rainfall over the equatorial latitudes of up to 2000 mm per year over the Gulf of Guinea and decrease northward until the southern limit of the Sahara where the annual cumulative rainfall is 100 mm. A north–south gradient is also observed north of Sahara where cumulative rainfall increases with latitudes.
4.1. Analysis of the Duration Probability Distribution
The probability distribution of durations of rainy episodes (≥1 day) led us to give an approximation to their distributions and thus to associate the best law of probability between exponential and power decreasing laws to describe their latitudinal evolution.
4.1.1. Analysis of Chronological Series of Rain Observations over Sahel and France
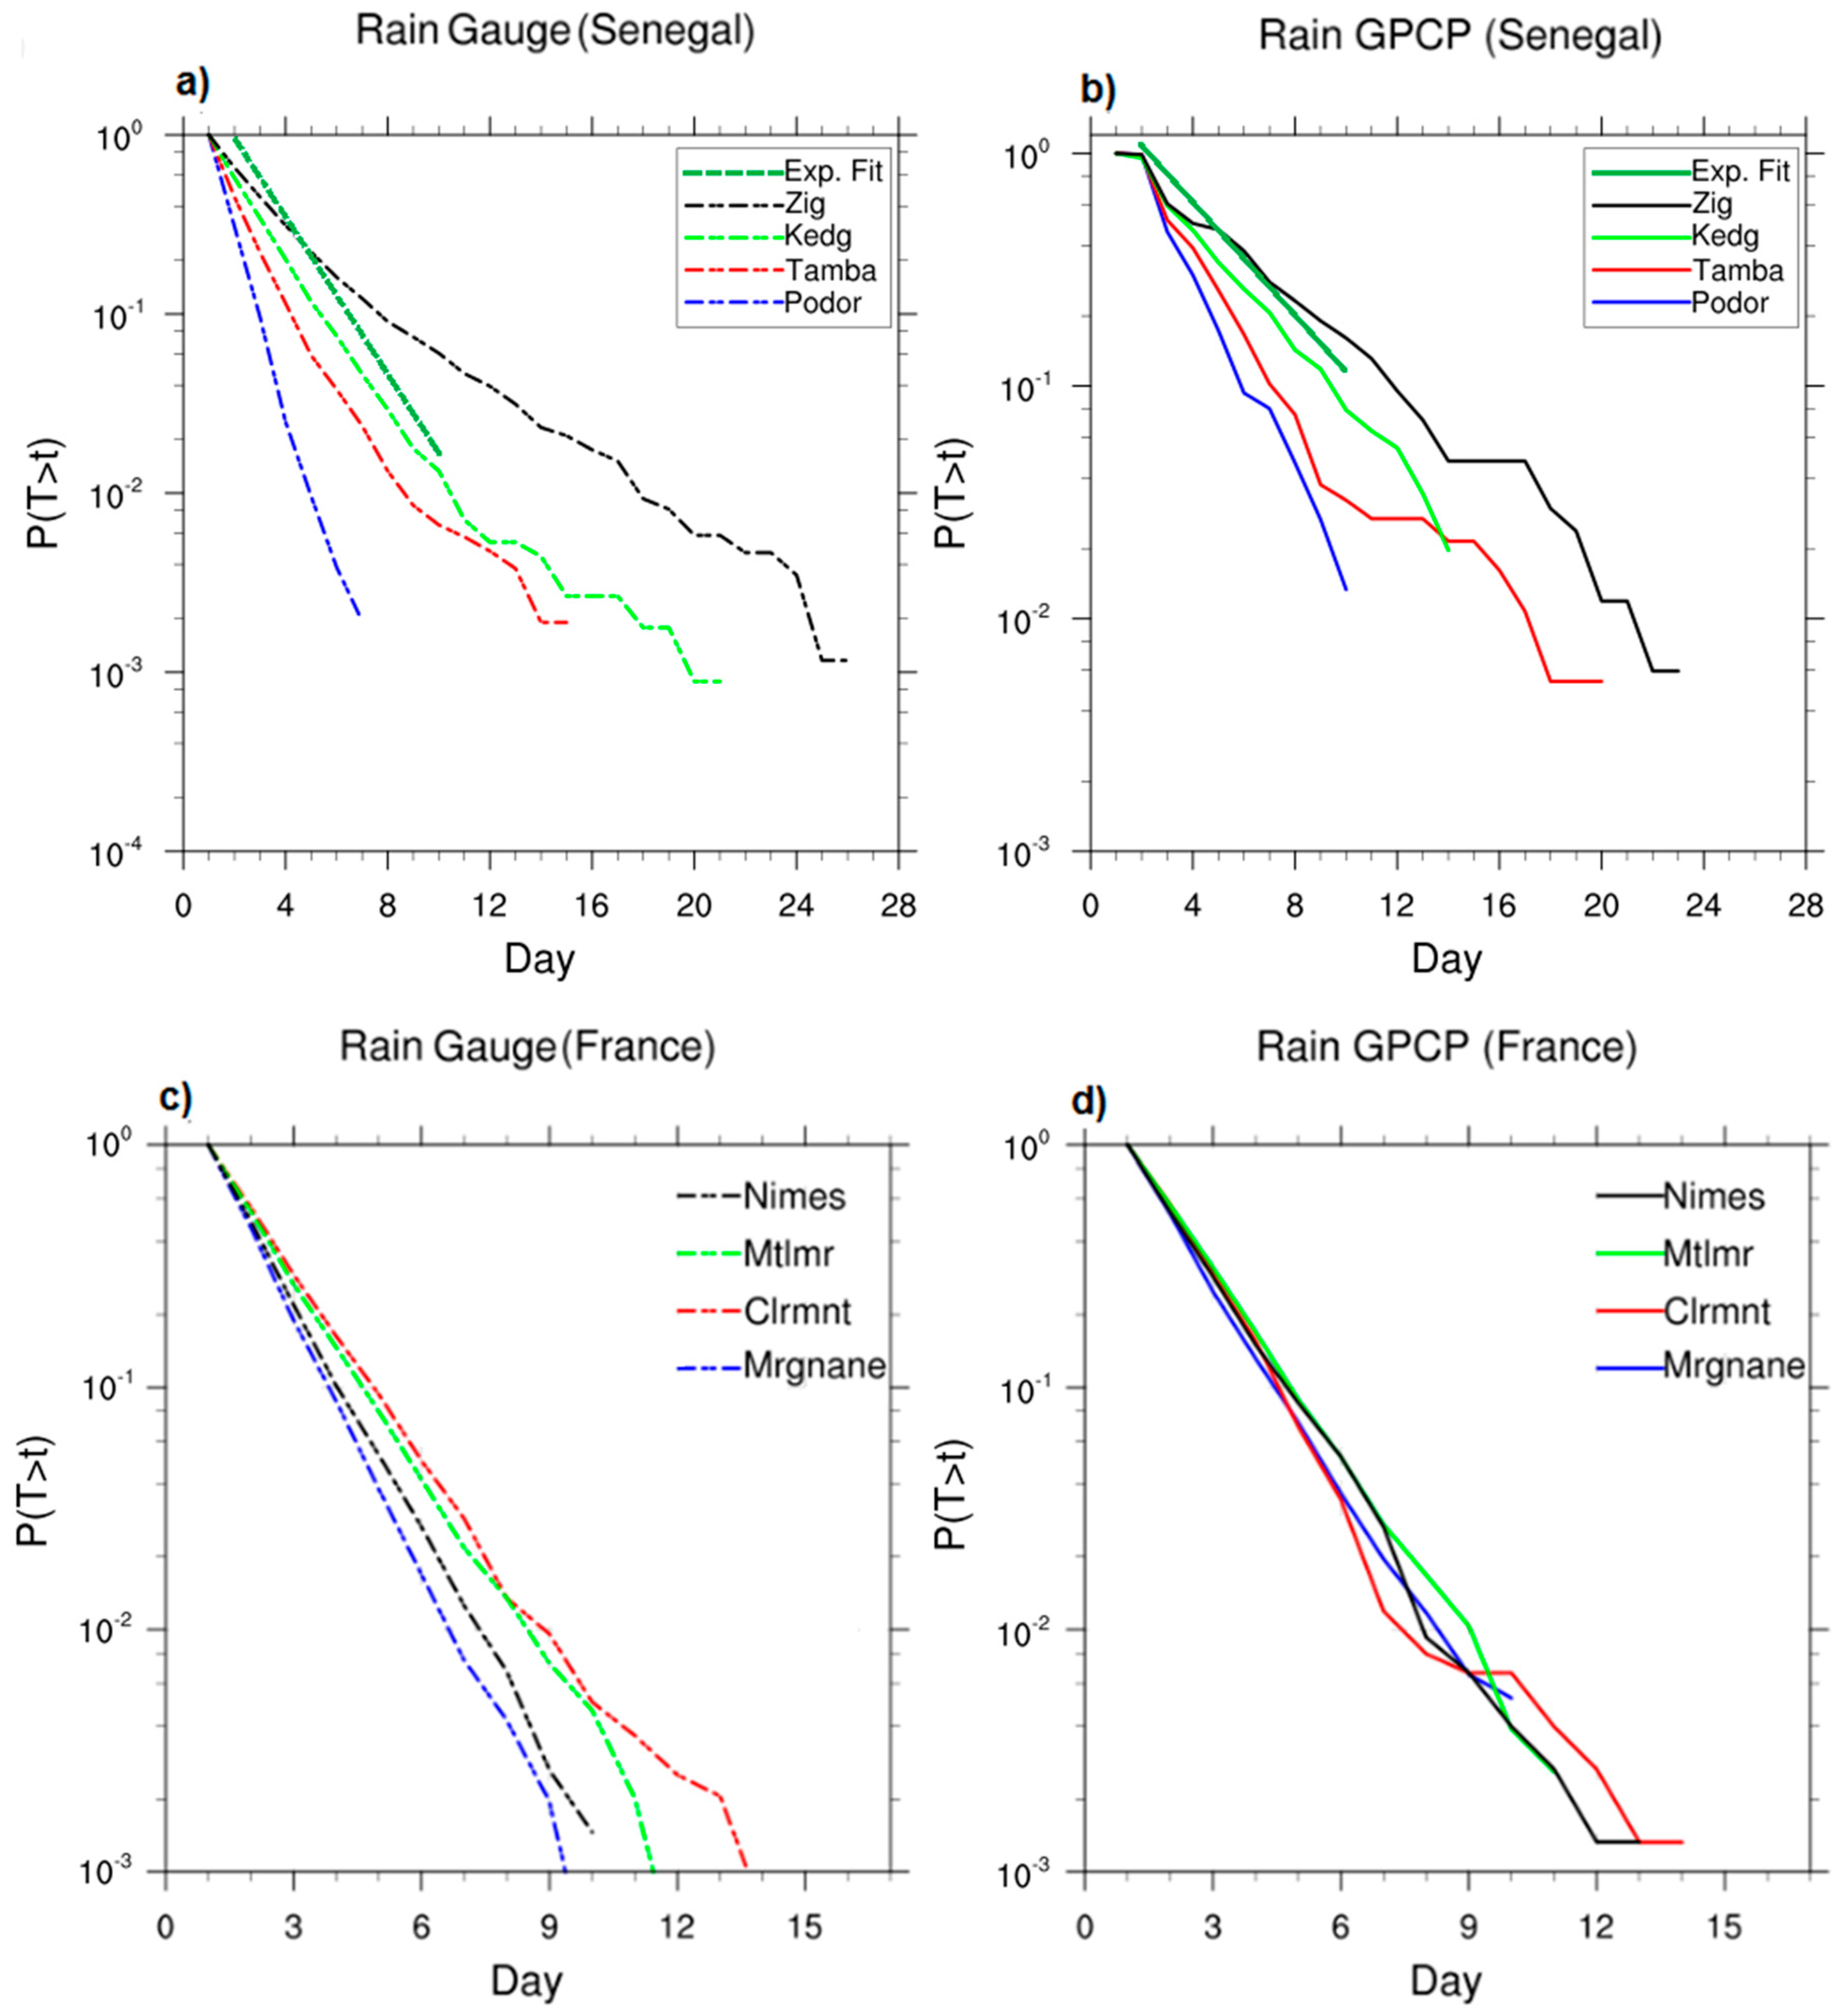
Figure 4 presents the distribution of rainfall from rain gauge and GPCP dataset, for the four sites of Senegal in the Sahel and the four other sites in France.
In Sahel rains are observed during the monsoon period so we only consider the part from June to September in this zone.
Figure 4 highlights an exponential decline and allows the estimation of the constant
T0 in Equation (1), for each site in a given scale range. The chosen time range ensures that all the measurements are relatively well approximated by an exponential decrease given by:
T0 (in days) is interpreted as a “characteristic duration” of long rainy episodes). t is the duration of rainy event in days and P (T > t) is the probability of rainy event larger than t.
Considering rain gauges as reference (
Figure 4a,c) we observe a number of rainy episodes varying in Sahel with latitude. The number of events is less in Podor (northernmost site, closer to the Sahara) compared to the three other of Sahel. The number of events is higher in Ziguinchor (the southernmost, more equatorial site) among the four in Sahel. An opposite conclusion is made for the sites in France, the highest number of events being observed in Clermont (site further north) and the lowest number of events in Marignane (the southernmost site of the four). We therefore note that the number of occurrences of long-lasting rain events follows a south–north rainfall gradient in Sahel and north–south in the mid-latitudes. At the nearest pixel of each station in Senegal and in France we have treated with the same methodology precipitation rate of GPCP satellites, (
Figure 4b,d) over 11 years, 1998–2008. The estimation of
T0 using the GPCP series gives results quite close to those of the rain gauges, but smaller spread of curves with respect to geographical distances.
T0 GPCP data reveal the same exponential distribution than rain gauges for the considered sites. These results should be interpreted with caution because the observation series do not cover the same time period.
Table 1 summarizes the inter-comparisons between slopes (−1/
T0) from the very local measures (rain gauges) and from the satellite measures at the 8 sites (4 sites of Senegal and 4 sites of France) studied. These two measures of
T0 are comparable using a linear transformation (Equation (2)) with correlation coefficient larger than 0.9:
with:
a = 1.53;
b = 0.27 for the sites in Senegal, and
a = 0.18;
b = 1.38 for the sites in France.
The good linear correlation between T0 from rain gauges and GPCP gives the opportunity to generalize the analysis to the whole area study including 0 to 40° N latitudes.
4.1.2. Analysis of GPCP over the Period 1998–2008 on the Area (0–40° N)
We use GPCP rain data to extend the probability distribution of the durations of long rainy periods over the entire study area. The results show different characteristics depending on latitude. The episodes having a longer duration are observed in the equatorial band (0–13° N) varying between 6 and 15 successive days of rains. The Sahelian region constitutes an area where long-lasting rainfall events are highly variable, in the southern latitudes of Sahel they can last up to 6 days. They cannot exceed one day in the northern Sahel (20° N), and at mid-latitudes (>20° N) in the northern hemisphere.
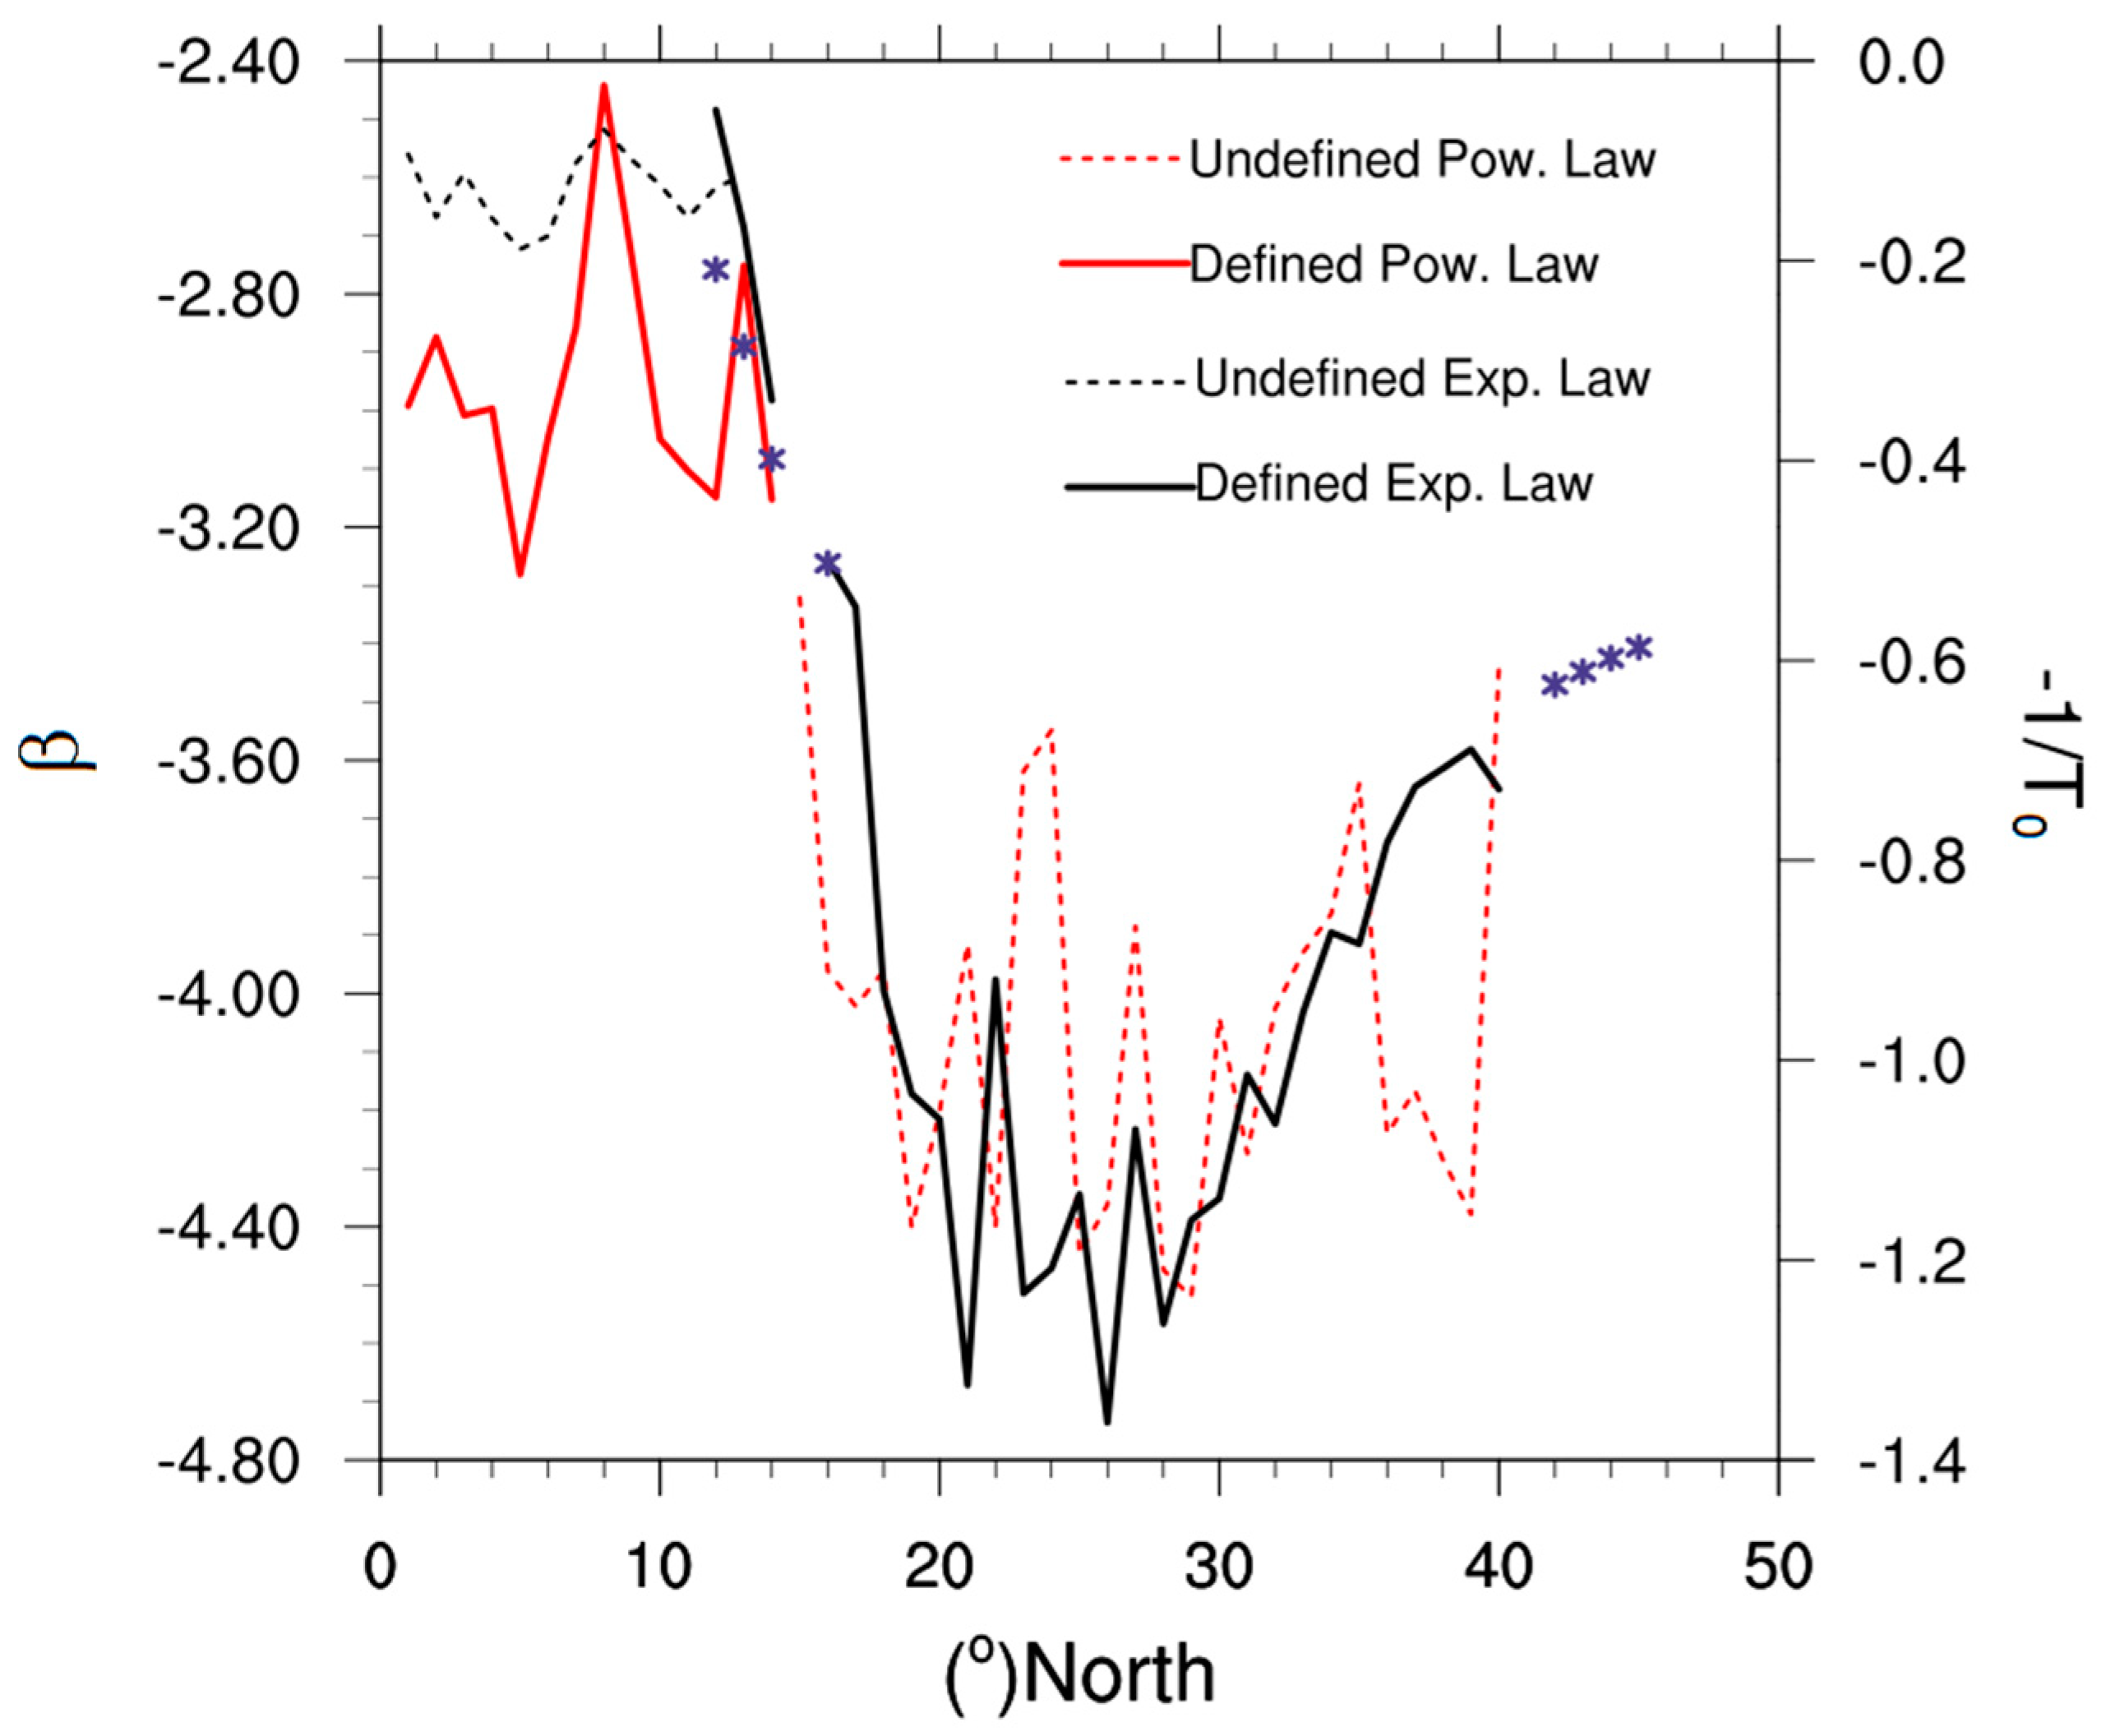
Assuming that rains follow an exponential distribution defined by the Equation (1) over all latitudes from 0 to 40° N, we calculated the slopes (−1/
T0) of fits (exponential approximations) for each latitude (
Figure 5, black curve). This assumption is false for equatorial latitudes between 0 and 12° N but remains true above 12° N.
Assuming that rains follow a power law distribution defined by the Equation (3) over all latitudes from 0 to 40° N, we have calculated β, the exponent of fits (approximations in power law) for each latitude (
Figure 5, red curve).
In the equatorial latitudes the approximation that corresponds and best describes the rainy episodes of long duration is a law power of form:
With −3 < β < −1. This approximation of a Levy-stable distribution remains valid and coherent up to 12–13° N. Beyond these latitudes, the law which best describes the convective structures in these zones is an exponential law defined as Equation (1) which is consistent with the approximation obtained from the ground based data in these latitudes.
Between 20° W–30° E and 0–40° N, the probability distribution of the duration of rain episodes longer than one day reveals two distinct functional behaviors with, a distribution in power law distribution following Equation (3) in the equatorial latitudes (0–12° N), and an exponential distribution following Equation (1) in higher latitudes than 12° N. The Sahelian region presents a rapid latitudinal transition of characteristic durations. Indeed, the probability of occurrence of a rainfall having a given duration and a given spatial extension decreases from the south to the north of Sahel. The typical duration is 10 days at 12° N and 1 day at 20° N.
4.2. Analysis of the Length Probability Distribution
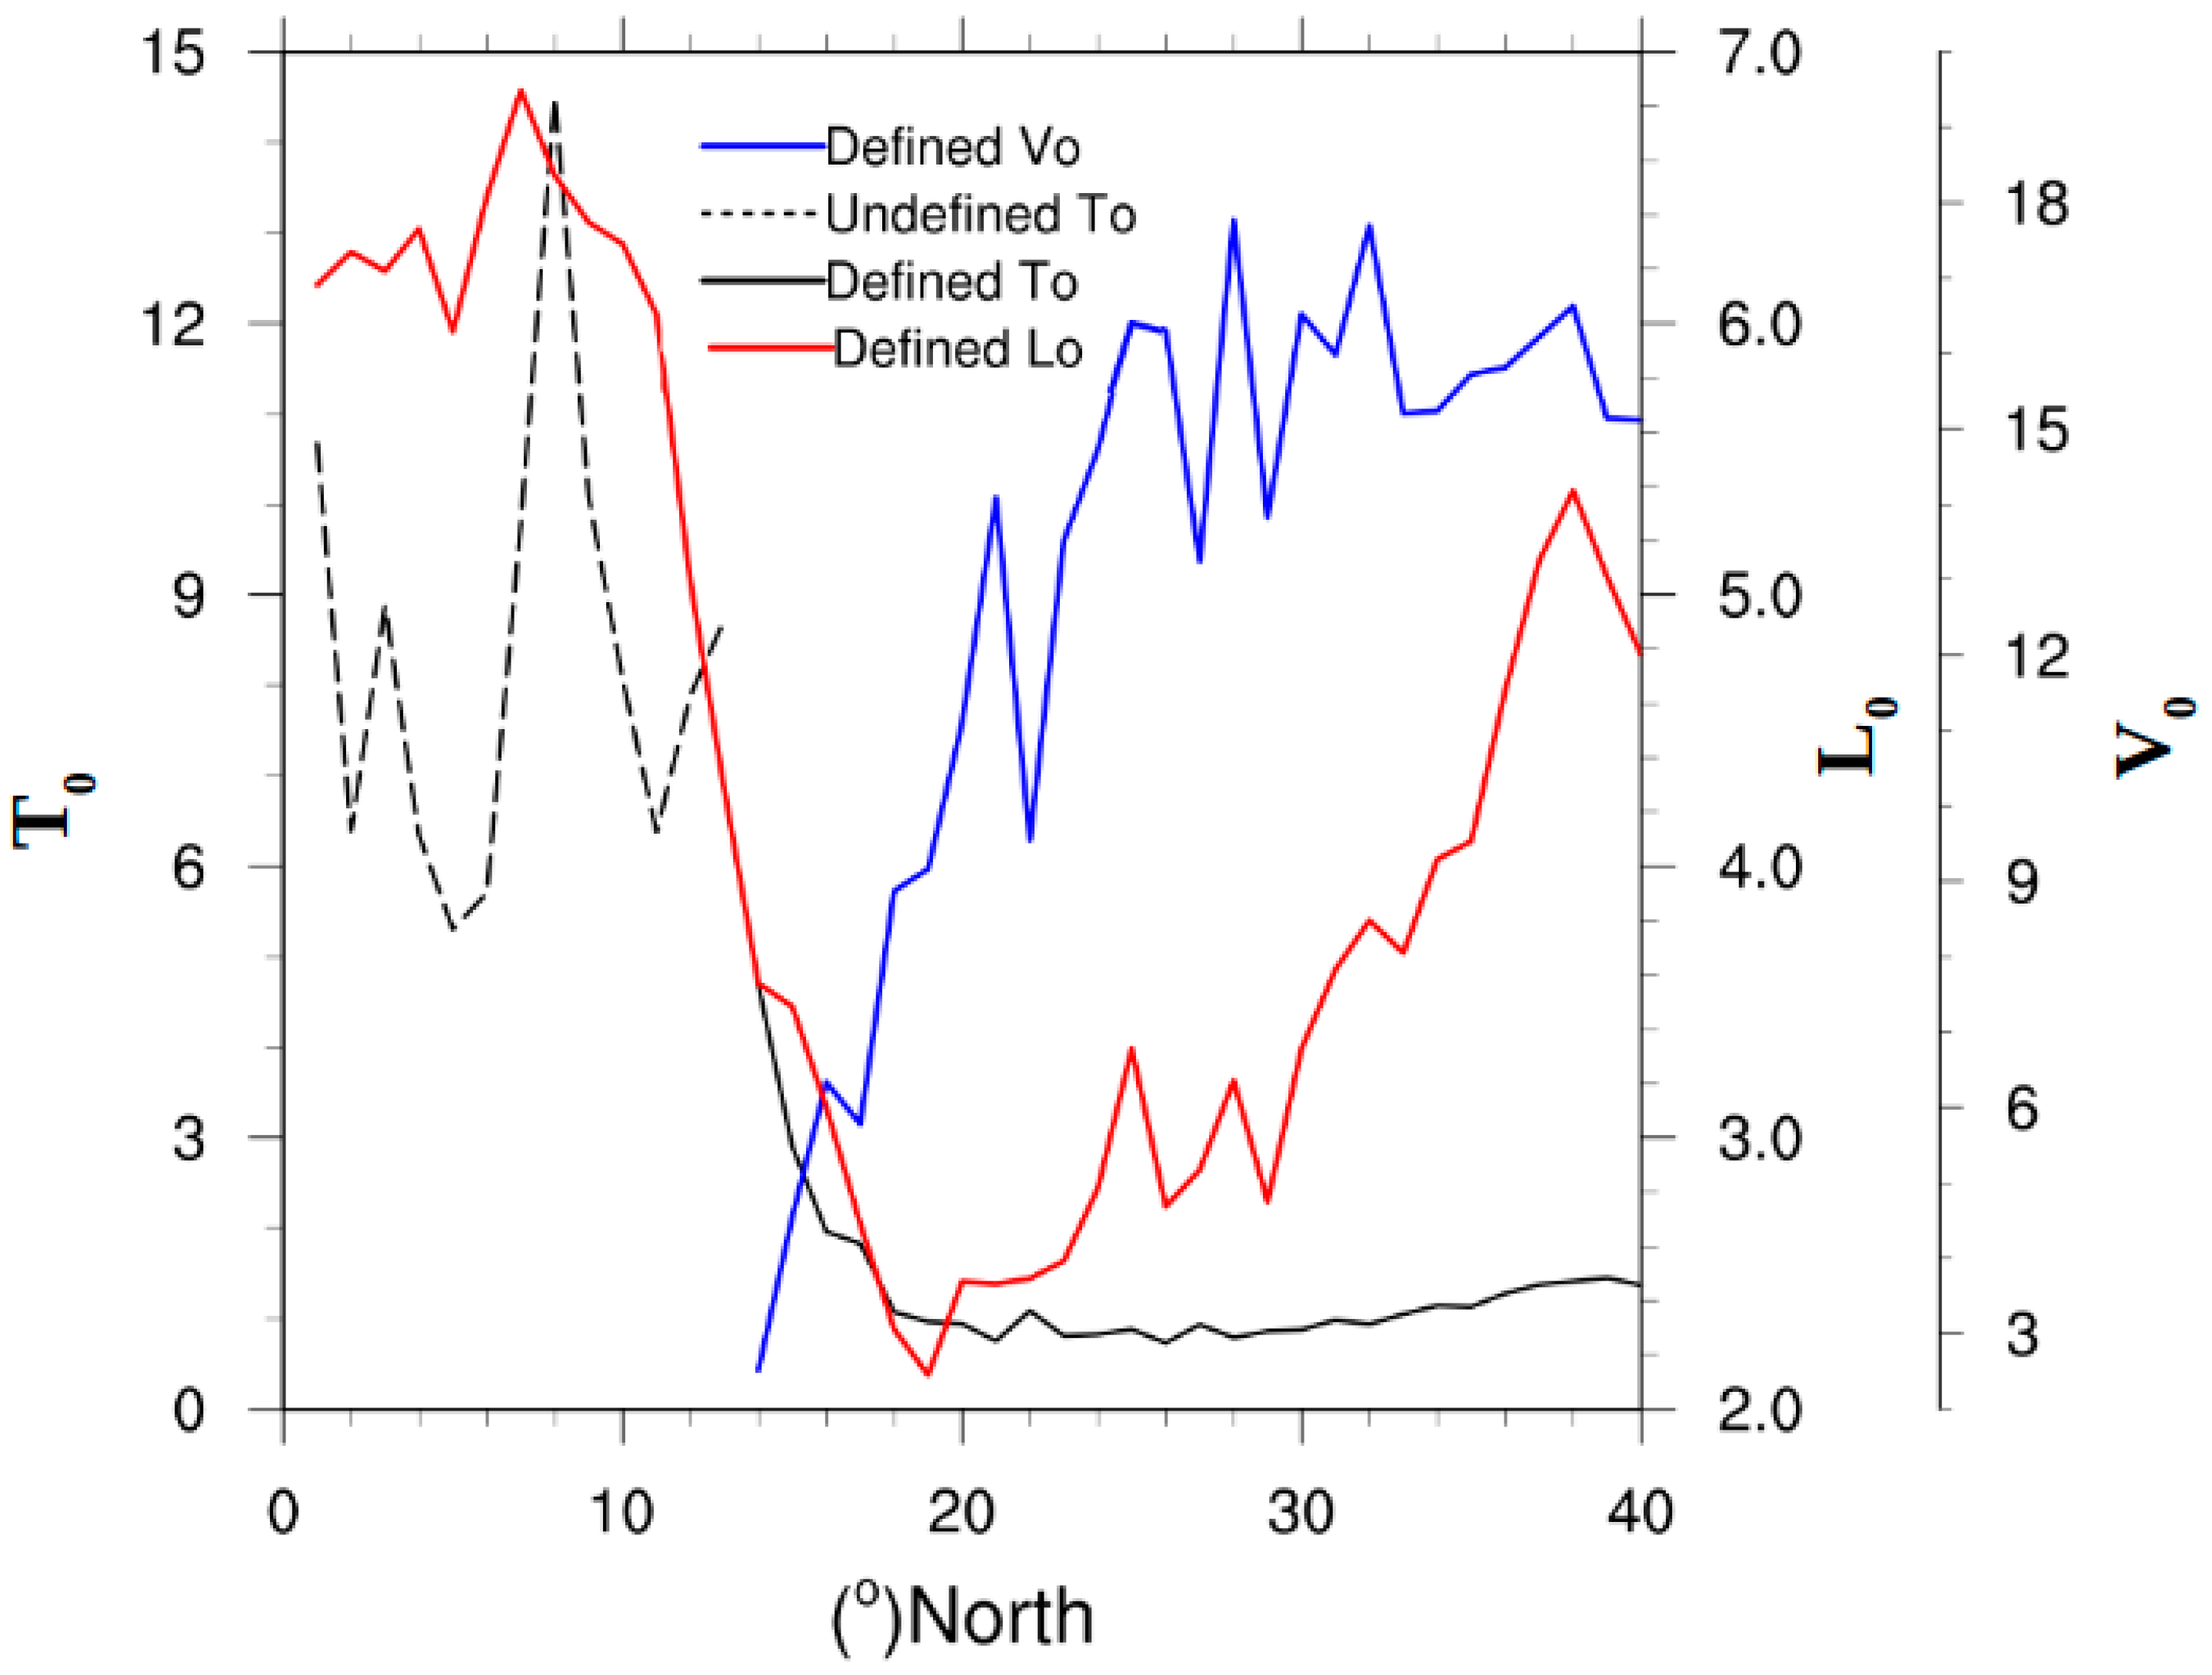
The probability distribution provides the distribution of the lengths of rain events in longitudinal degrees of the convective systems. The results show a difference, depending on the latitudinal region, of the geometry of the convective structures producing rains. In the equatorial latitudes (0–12° N) the size of convective systems is included between 4.5 and 7.5 degrees, whereas in the mid-latitudes (30–40° N) it varies between 3.5 and 5.3 degrees. In the southern part of Sahel, the longest precipitating systems are between 4.5 degrees, and 2 degrees at the limit with the Sahara.
The distribution of these lengths (sizes) of convective systems between 0 and 40° N is close to an exponential distribution given by Equation (4) for spatial scales between 1° and 50° of longitude (up to 5500 km).
where
L0 (in longitudinal degrees) is interpreted as a “characteristic length” of rainy episodes. In the Sahelian region, a rapid latitudinal transition for characteristic lengths is observed. The probability of occurrence of a rainfall episode decreases from the south to the north of the Sahel with a characteristic length 4.5° ≈ 499.5 km at 12° N and 2° ≈ 222 km at 20° N. This latitudinal transition has a higher gradient than that observed for the average rainfall distribution in the Sahel. In the mid-latitudes (>30° N) the spatial extensions have a distribution similar to that of the rain following the latitudes (characteristic length 3.5° ≈ 388.5 km at 31° N and 5.3° ≈ 588.3 km at 40° N).
The long time series of two dimensional rain fields is used to compare the temporal structures (the passage of the MCS over a site) and the spatial one (the extension of the MCS around the site). In the case of probability distribution, two distinct variables are estimated: the distribution of the duration of the rainy events over a fixed location P(T > t) and the distribution of the size of the rainy events on a domain including the fixed site P(L > l).
In the simple case of a rain field advected uniformly, it is expected that these two distributions are comparable (same functional behavior) and the average advection speed is estimated from the comparison of these two distributions. The probability distribution of length can be compared to the probability distribution of duration. In fact, the maximum duration of rainfall at a given site must have the same type of distribution as the maximum rainfall system sizes observed on a large scale and advected towards this site. We can therefore define a “statistical advection speed” of precipitating systems such as the ratio of the two constants (
L0 and
T0) of exponential decrease observed in
Figure 6.
The spatial and temporal distributions of Sahel (12–20° N) and mid-latitudes (>30° N) have the same functional behavior (exponential decrease) and their comparison gives an estimation of a “statistical speed advection” between 6 and 14 km h−1 (for the Sahel) for long rainy periods and between 16 and 20 km h−1 (for mid-latitudes). The temporal distribution of equatorial regions (0–12° N) deviates significantly from an exponential decline. It is close to a power law. It is then not possible to estimate speed between these variables with different functional behaviors. Thus, the speed retrieved by this method is notably lower than the dynamic advection speed in the lower troposphere, which is of the order of 50 km h−1. Hence, it is possible to interpret this difference in propagation speeds of precipitating systems as an index of their self-organization.
MCS indeed shows often rainy systems supplying vapor ahead (thus progressing more slowly than the environment), persisting injection of kinetic energy due diabatic effects of phase changes of water in clouds. The estimate of this “statistical speed” corresponding of an ensemble speed of MCS, which depends only of the distribution of rainy episode durations and spatial extensions, can be useful to test different parameterizations of deep convection in weather forecast models.
5. Summary and Conclusions
Our study focused on the characterization of the duration of rainfall episodes and their spatial extension between 0 and 40° N distinguishing and comparing three regions having different rain characteristics: Equatorial 0–12° N, Sahelian 12° N–20° N and mid-latitudes 30° N–40° N. We have calculated the probability distribution of daily rainfall series from 1998 to 2008 of the GPCP and characterized the distribution of the durations (more than 1 day) of rainy episodes and the distribution of their lengths corresponding to their spatial extension.
The probability distribution analysis reveals that the distribution of rainfall episodes is close to an exponential decrease in Sahel and mid-latitudes, whereas in the equatorial region it is close to a Levy-stable (power law) distribution.
The Sahelian region has a rapid latitudinal transition of the characteristic lengths and durations of the rainfall episodes.
For the distributions of lengths or spatial extensions of the rainfall episodes the probability distribution analysis highlights an exponential decrease over the whole study area from equator to mid-latitudes.
In latitudes where an exponential law is detected for both duration and length, north of 12° N, the measured duration and characteristic lengths (L0 and T0) must be coherent, allowing to define an advection “statistical speed” (V0 = L0/T0) characteristic of these rainy systems which depends only on temporal and spatial (horizontal) morphology of the rains.
We propose a simple statistical treatment of the daily rain databases allowing a « characteristic time duration » (
T0) and a characteristic horizontal size (
L0) of rain systems to be measured on each site. This estimation of the maximal duration and size of rain events is usable as long as an exponential decrease of the probability of large events is observed for the Sahelian and mid-latitude regions, but not for the equatorial region. In equatorial region, we observe a nearly power law decrease of the probability of large duration rain events and thus the physical interpretation of
T0 as a characteristic duration is not possible. This behavior is coherent with a large-scale turbulent behavior of rain fields following a Levy-stable distribution, as described by Peters [
15]. This observed latitudinal transition of valid and invalid
T0 seem to be sharper than the latitudinal evolution of mean rain rate (or the other first order statistic measure, like variance or occupation ratio).
In the future, the Fourier spectra could be calculated with the same rain data. Preliminary results show similar results: observation of a scale invariance between 2 and 45 days for the equatorial regions, and a rapid transition with latitude over the Sahel, with a scale invariance observed between 2 days and less than 10 days. This could explain why we observe a power law distribution for the equatorial region and an exponential decrease at northern mid-latitudes.
We plan to further validate these results using a more recent rain climatological data base, allowing longer time series and larger space resolution (GPCC data base, Schneider et al. [
20]). We plan to extend the study to a larger set of stations of the AMMA and HYMEX datasets. The detection of a similar transition using the GCM rain results could also be a sensible test for the convection parameterization schemes used in these models (more sensible than the comparisons based on first order statistics). This statistical approach will provide a better understanding of the spatio-temporal distribution of rain events and facilitate their modeling and forecasting for the Sahel region.
Author Contributions
Conceptualization C.D. and A.S; Methodology, A.S., C.D. and Y.G.; Software, A.S. and C.D.; Validation, A.S., C.D., Y.G., J.-L.B. and J.V.B.; Formal Analysis, C.D., A.S., Y.G. and J.-L.B.; Investigation, C.D., A.S., Y.G. and J.-L.B.; Resources, B.D., C.D. and A.S.; Data Curation, C.D., A.S., Y.G. and J.-L.B.; Writing—Original Draft Preparation, C.D., A.S., J.-L.B. and Y.G.; Writing—Review & Editing, all co-authors; Visualization, C.D., A.S., Y.G. and J.-L.B.; Supervision, C.D., Y.G., B.D. and J.V.B.; Project Administration, J.V.B and B.D.; Funding Acquisition J.V.B. and B.D.
Funding
This research received no external funding.
Acknowledgments
We acknowledge the Centre d’Excellence Africain (CEA) Mathématiques, Informatique et Technologies de l’Information et de la Communication (MITIC) for hosting this research. We acknowledge also IRD and Météo-France for providing meteorological observations and the National Oceanic and Atmospheric Administration (NOAA) for providing GPCP data.
Conflicts of Interest
The authors declare no conflict of interest.
References
- Houze, R.A. Structures of atmospheric precipitation system: A global survey. Radio Sci. 1981, 16, 671–689. [Google Scholar] [CrossRef]
- Li, X.; Zhai, G.; Gao, S.; Shen, X. A new convective–stratiform rainfall separation scheme. Atmos. Sci. Lett. 2014, 15, 245–251. [Google Scholar] [CrossRef]
- Stillman, S.; Zeng, X. Development of a 0.5° global monthly raining day product from 1901 to 2010. Geophys. Res. Lett. 2016, 43, 9704–9711. [Google Scholar] [CrossRef] [Green Version]
- Drobinski, P.; Sultan, B.; Janicot, S. Role of the Hoggar massif in the West African monsoon onset. Geophys. Res. Lett. 2005, 32, L01705. [Google Scholar] [CrossRef]
- Sultan, B.; Janicot, S. Abrupt shift of the ICTZ over West Africa and intra-seasonal variability. Geophys. Res. Lett. 2000, 27, 3353–3356. [Google Scholar] [CrossRef]
- Ramel, R.; Gallée, H.; Messager, C. On the northward shift of the West African monsoon. Clim. Dyn. 2006, 26, 429–440. [Google Scholar] [CrossRef]
- Redelsperger, J.L.; Thorncroft, C.D.; Diedhiou, A.; Lebel, T.; Parker, D.J.; Polcher, J. African Monsoon Multidisciplinary Analysis—An international research project and field compaign. Bull. Am. Meteor. Soc. 2006, 87, 1739–1746. [Google Scholar] [CrossRef]
- Delrieu, G.; Ducrocq, V.; Gaume, E.; Nicol, J.; Payrastre, O.; Yates, E.; Andrieu, H.; Ayral, P.A.; Bouvier, C.; Creutin, J.D.; et al. The catastrophic flash-flood event of 8–9 September 2002 in the Grad region, France: A first case study for the Cévennes-Vivarais Mediterranean hydro-meteorological observatory. J. Hydrometeorol. 2005, 6, 34–52. [Google Scholar] [CrossRef]
- Ricard, D.; Ducrocq, V.; Auger, L. A climatology of the mesoscale environment associated with heavily precipitating events over a northwestern Mediterranean area. J. Appl. Meteorol. Clim. 2012, 51, 468–488. [Google Scholar] [CrossRef]
- Dennis, A.S. Augmentation of rainfall from summer cumulus clouds. Agr. Water Manage. 1983, 7, 3–14. [Google Scholar] [CrossRef]
- Drobinski, P.; Ducrocq, V.; Alpert, P.; Anagnostou, E.; Béranger, K.; Borga, M.; Braud, I.; Chanzy, A.; Davolio, S.; Delrieu, G.; et al. HyMeX: A 10-year multidisciplinary program on the Mediterranean water cycle. Bull. Am. Meteorol. Soc. 2014, 95, 1063–1082. [Google Scholar] [CrossRef]
- Duroure, C.; Guillemet, B. Analyse des heterogeneites spatiales des stratocumulus et cumulus. Atmos. Res. 1990, 25, 331–350. [Google Scholar] [CrossRef]
- Froidurot, S.; Diedhiou, A. Characteristics of wet and dry spells in the West African monsoon system. Atmos. Sci. Lett. 2017, 18, 125–131. [Google Scholar] [CrossRef]
- Ratan, R.; Venugopal, V. Wet and dry spell characteristics of global tropical rainfall. Water Resour. Res. 2013, 49, 3830–3841. [Google Scholar] [CrossRef] [Green Version]
- Peters, O.; Hertlein, C.; Christensen, K. A complexity view of rainfall. Phys. Rev. Lett. 2001, 88, 018701. [Google Scholar] [CrossRef] [PubMed]
- Huffman, G.J.; Adler, R.F.; Morrissey, M.M.; Bolvin, D.T.; Curtis, S.; Joyce, R.; McGavock, B.; Susskind, J. Global precipitation at one degree daily resolution from multisatellite observations. J. Hydrometeorol. 2001, 2, 36–50. [Google Scholar] [CrossRef]
- Stern, R.; Rijks, D.; Dale, I.; Knock, J. Instat Climatic Guide. Available online: http://www.personal.reading.ac.uk/~sns97aal/eSIAC/Senegal_best_sowing_dates.pdf (accessed on 6 December 2018).
- Salack, S.; Muller, B.; Gaye, A.T.; Hourdin, F.; Cissé, N. Analyses multiéhelles des pauses pluviométriques au Niger et au Sénégal. Sécheresse 2012, 23, 3–13. [Google Scholar] [CrossRef]
- Deni, M.S.; Jemain, A.A.; Ibrahim, K. The best probability models for dry and wet spells in peninsular Malaysia during monsoon seasons. Int. J. Climatol. 2010, 30, 1194–1205. [Google Scholar] [CrossRef]
- Schneider, U.; Finger, P.; Meyer-Christoffer, A.; Rustemeier, E.; Ziese, M.; Becker, A. Evaluating the hydrological cycle over land using the newly-corrected precipitation climatology from the Global Precipitation Climatology Centre (GPCC). Atmosphere 2017, 8, 52. [Google Scholar] [CrossRef]
Figure 1.
Distribution of rainy and dry episodes during the monsoon in 2001 in Sahel, using GPCP (Global Precipitation Climatology Project) daily rainfall data. The wet and dry events are marked by blue and red line respectively, and the threshold equal to 0.1 mm is marked by a green line. The day 0 and 120 correspond to the 15 August 2001 and 12 October 2001 respectively.
Figure 2.
(Right) Lat × Lon + Time map of precipitation in mm/day between 0–50° N and 20° W–40° E over 4018 days (1998–2008) obtained from daily GPCP rainfall data. (Left) transect at 12° N showing rainfall as function of longitude during one day. The threshold equal to 0.1 mm is marked by a green line.
Figure 3.
Average annual cumulative rainfall between 1998 and 2008 from GPCP data in mm/day, with the geographical location of mid-latitudes sites in France (Clermont–Cl, Montélimar–Mo, Nîmes–Ni and Marignane–Ma) and Sahelian sites in Senegal (Podor–Po, Tambacounda–Ta, Ziguinchor–Zi and Kedougou–Ke).
Figure 4.
Probability rainy day occurrence in a log-lin plot (a) at four sites (Podor, Tambacounda Ziguinchor and Kedougou) in Senegal (Sahel) with daily observation data (rain gauge 1966–2007). (b) at the nearest pixels of the four sites (Podor, Tambacounda Ziguinchor, and Kedougou) of Senegal (Sahel) with daily GPCP data (1998–2008). (c) at four sites in France (Middle latitudes), Clermont (1944–2015), Montelimar (1920–2015), Nimes and Marignane (1945–2015) with daily observation data. (d) at the nearest pixels of the four sites (Clermont, Montelimar, Nimes, and Marignane) of France with daily GPCP data (1998–2008). An exponential fit of Kedougou based on Equation (1) is in dashed dark green (a) and continuous dark green (b).
Figure 5.
Exponent β (red) and inverse of the characteristic duration −1/T0 (black, in day−1) as function of the latitude between 0 and 40° N in the area where exponential and power laws are defined (solid lines) or not (dashed lines). Blue stars represent the −1/T0 (in day−1) slope in the four sites of Senegal and France measured from rain gauge data, corrected with Equation (2).
Figure 6.
Variation of the characteristic length (L0 in red, in degree), of the characteristic duration (T0 in black at the right, in days) and of the characteristic speed (V0 = L0/T0 in blue, in km·h−1) as a function of the latitude from 0 to 40° N. The black solid line indicates the latitudes where exponential law is defined for duration and dashed line latitudes where it is not defined.
Table 1.
Slope values (−1/T0) obtained with an exponential distribution of the duration of rainy events for the sites in France and Senegal. The slopes estimated from rain gauge data on the sites and GPCP data on the nearest pixels of the sites.
Table 1.
Slope values (−1/T0) obtained with an exponential distribution of the duration of rainy events for the sites in France and Senegal. The slopes estimated from rain gauge data on the sites and GPCP data on the nearest pixels of the sites.
| Country | Site | Period | −1/T0 Pluvio | −1/T0 GPCP |
|---|
| | Clermont 45.7° N, 3.1° E | 1944–2015 | −0.575 | −0.586 |
| France | Montelimar 44.5° N, 4.7° E | 1920–2015 | −0.608 | −0.597 |
| | Nimes 43.8° N, 4.4° E | 1945–2015 | −0.714 | −0.611 |
| | Marignane 43.4° N, 5.2° E | 1945–2015 | −0.823 | −0.624 |
| | Podor 16.4° N, 14.5° W | 1966–2007 | −0.949 | −0.502 |
| Sénégal | Tamba 13.4° N, 13.4° W | 1966–2007 | −0.606 | −0.398 |
| | Kedougou 12.3° N, 12.1° W | 1966–2007 | −0.505 | −0.285 |
| | Zigninchor 12.6° N, 16.1° W | 1966–2007 | −0.341 | −0.208 |
© 2018 by the authors. Licensee MDPI, Basel, Switzerland. This article is an open access article distributed under the terms and conditions of the Creative Commons Attribution (CC BY) license (http://creativecommons.org/licenses/by/4.0/).

 ,
, 


