Article

The Quasi-Biweekly Oscillation of Winter Precipitation Associated with ENSO over Southern China

Key Laboratory of Meteorological Disaster of Ministry of Education/Joint International Research Laboratory of Climate and Environment Change/Collaborative Innovation Center on Forecast and Evaluation of Meteorological Disasters, Nanjing University of Information Science and Technology, Nanjing 210044, China
*
Author to whom correspondence should be addressed.
Atmosphere 2018, 9(10), 406; https://doi.org/10.3390/atmos9100406
Submission received: 6 August 2018 / Revised: 29 September 2018 / Accepted: 13 October 2018 / Published: 16 October 2018
(This article belongs to the Section Meteorology)

Abstract

:
Using ERA-interim Reanalysis data and observational data, the intraseasonal oscillation of the winter rainfall in southern China is studied. The mean square deviation of daily precipitation is used to express precipitation variability, and winter precipitation variability over southern China is determined to be highly correlated with sea surface temperature (SST) in central and eastern tropical Pacific; the dominant period of the precipitation is 10–30 days, which reflects quasi-biweekly oscillation. Examination of 1000 hPa geopotential height suggests that key low-pressure systems affecting the intraseasonal precipitation come from Lake Baikal, but with different travel paths. In El Niño years, key low-pressure systems converge with other low-pressure systems and move southeastward until reaching South China, while in La Niña years, only one low-pressure system can reach southern China. Meanwhile, the explosive development of the low-pressure system is mainly caused by the joint effects of thermal advection and vorticity advection in El Niño, and only vorticity advection accounted for the dominant status in La Niña. Multiscale analysis shows that the meridional distribution of intraseasonal circulation plays an important role on the thermal transmission and brings strong warm advection from low latitudes to high latitudes in El Niño.

1. Introduction

The intraseasonal oscillation (ISO) was first found in the tropics [1,2,3,4,5,6] but also appeared over mid-latitudes and high-latitudes [7,8,9,10,11]. Many studies have noted that the persistent precipitation in the Yangtze River Basin and southern China region, which have significant intraseasonal oscillation characteristics [12,13,14], is closely related to the ISO; these studies have reported the physical mechanism associated with precipitation [15,16,17] and have used theoretical models to explore the main factors affecting precipitation [18,19,20,21].
Many studies have emphasized apparent relationships between precipitation and sea surface temperature (SST) on interannual and decadal timescale [22,23,24,25,26], including the El Niño–Southern Oscillation (ENSO); remarkably, the relationship changes with seasonal and regional variation over China [27,28,29]. For example, during El Niño years, the precipitation over northeastern China is relatively lower in summer, autumn and winter, while the autumn precipitation in the Yangtze River region and the winter precipitation in the southeast region increases significantly.
Compared with that of summer precipitation, the current research on winter precipitation is limited. This may be because winter precipitation only accounts for a small proportion of the annual precipitation. On the other hand, the abnormal precipitation in winter does not cause large flood disasters, but summer precipitation does. However, the winter precipitation has an important relationship with ENSO; abnormal changes in winter precipitation also cause disasters that have important influences, and heavy precipitation also often occurs. In past studies on winter precipitation, more attention has been given to El Niño phenomena using finer divisions of the events, and La Niña phenomena have been considered separately. The distinction between the two phases of ENSO that results in different features of intraseasonal variations in winter precipitation over China deserves study. The main objective of this study is to discuss the impacts of ENSO on the winter intraseasonal precipitation and to explore its possible causes by diagnosis on the dynamic and thermal conditions. The rest of the paper is organized as follows: In Section 2, the data and methods are explained. The results of the intraseasonal precipitation associated with ENSO events are given in Section 3. A summary and conclusions are presented in Section 4.

2. Data and Methods

The present study uses the ECMWF ERA-interim reanalysis [30] data that provides daily precipitation and other routine meteorological data, such as geopotential height, zonal and meridional winds, temperature, and vertical integral of vapor flux, etc. The ERA dataset is on 1.5 ° × 1.5 ° grids from 1979 to present. The SST over the tropical Pacific is based on the Hadley Centre sea ice and sea surface temperature data (HadISST) [31] with a horizontal resolution of 1°. Other daily precipitation data are derived from 756 observation stations in China.
In this study, the boreal winter refers to the months from November to the following April (NDJFMA). The number of total days of the 34 winters (from 1979/1980 to 2012/2013) is 6163.
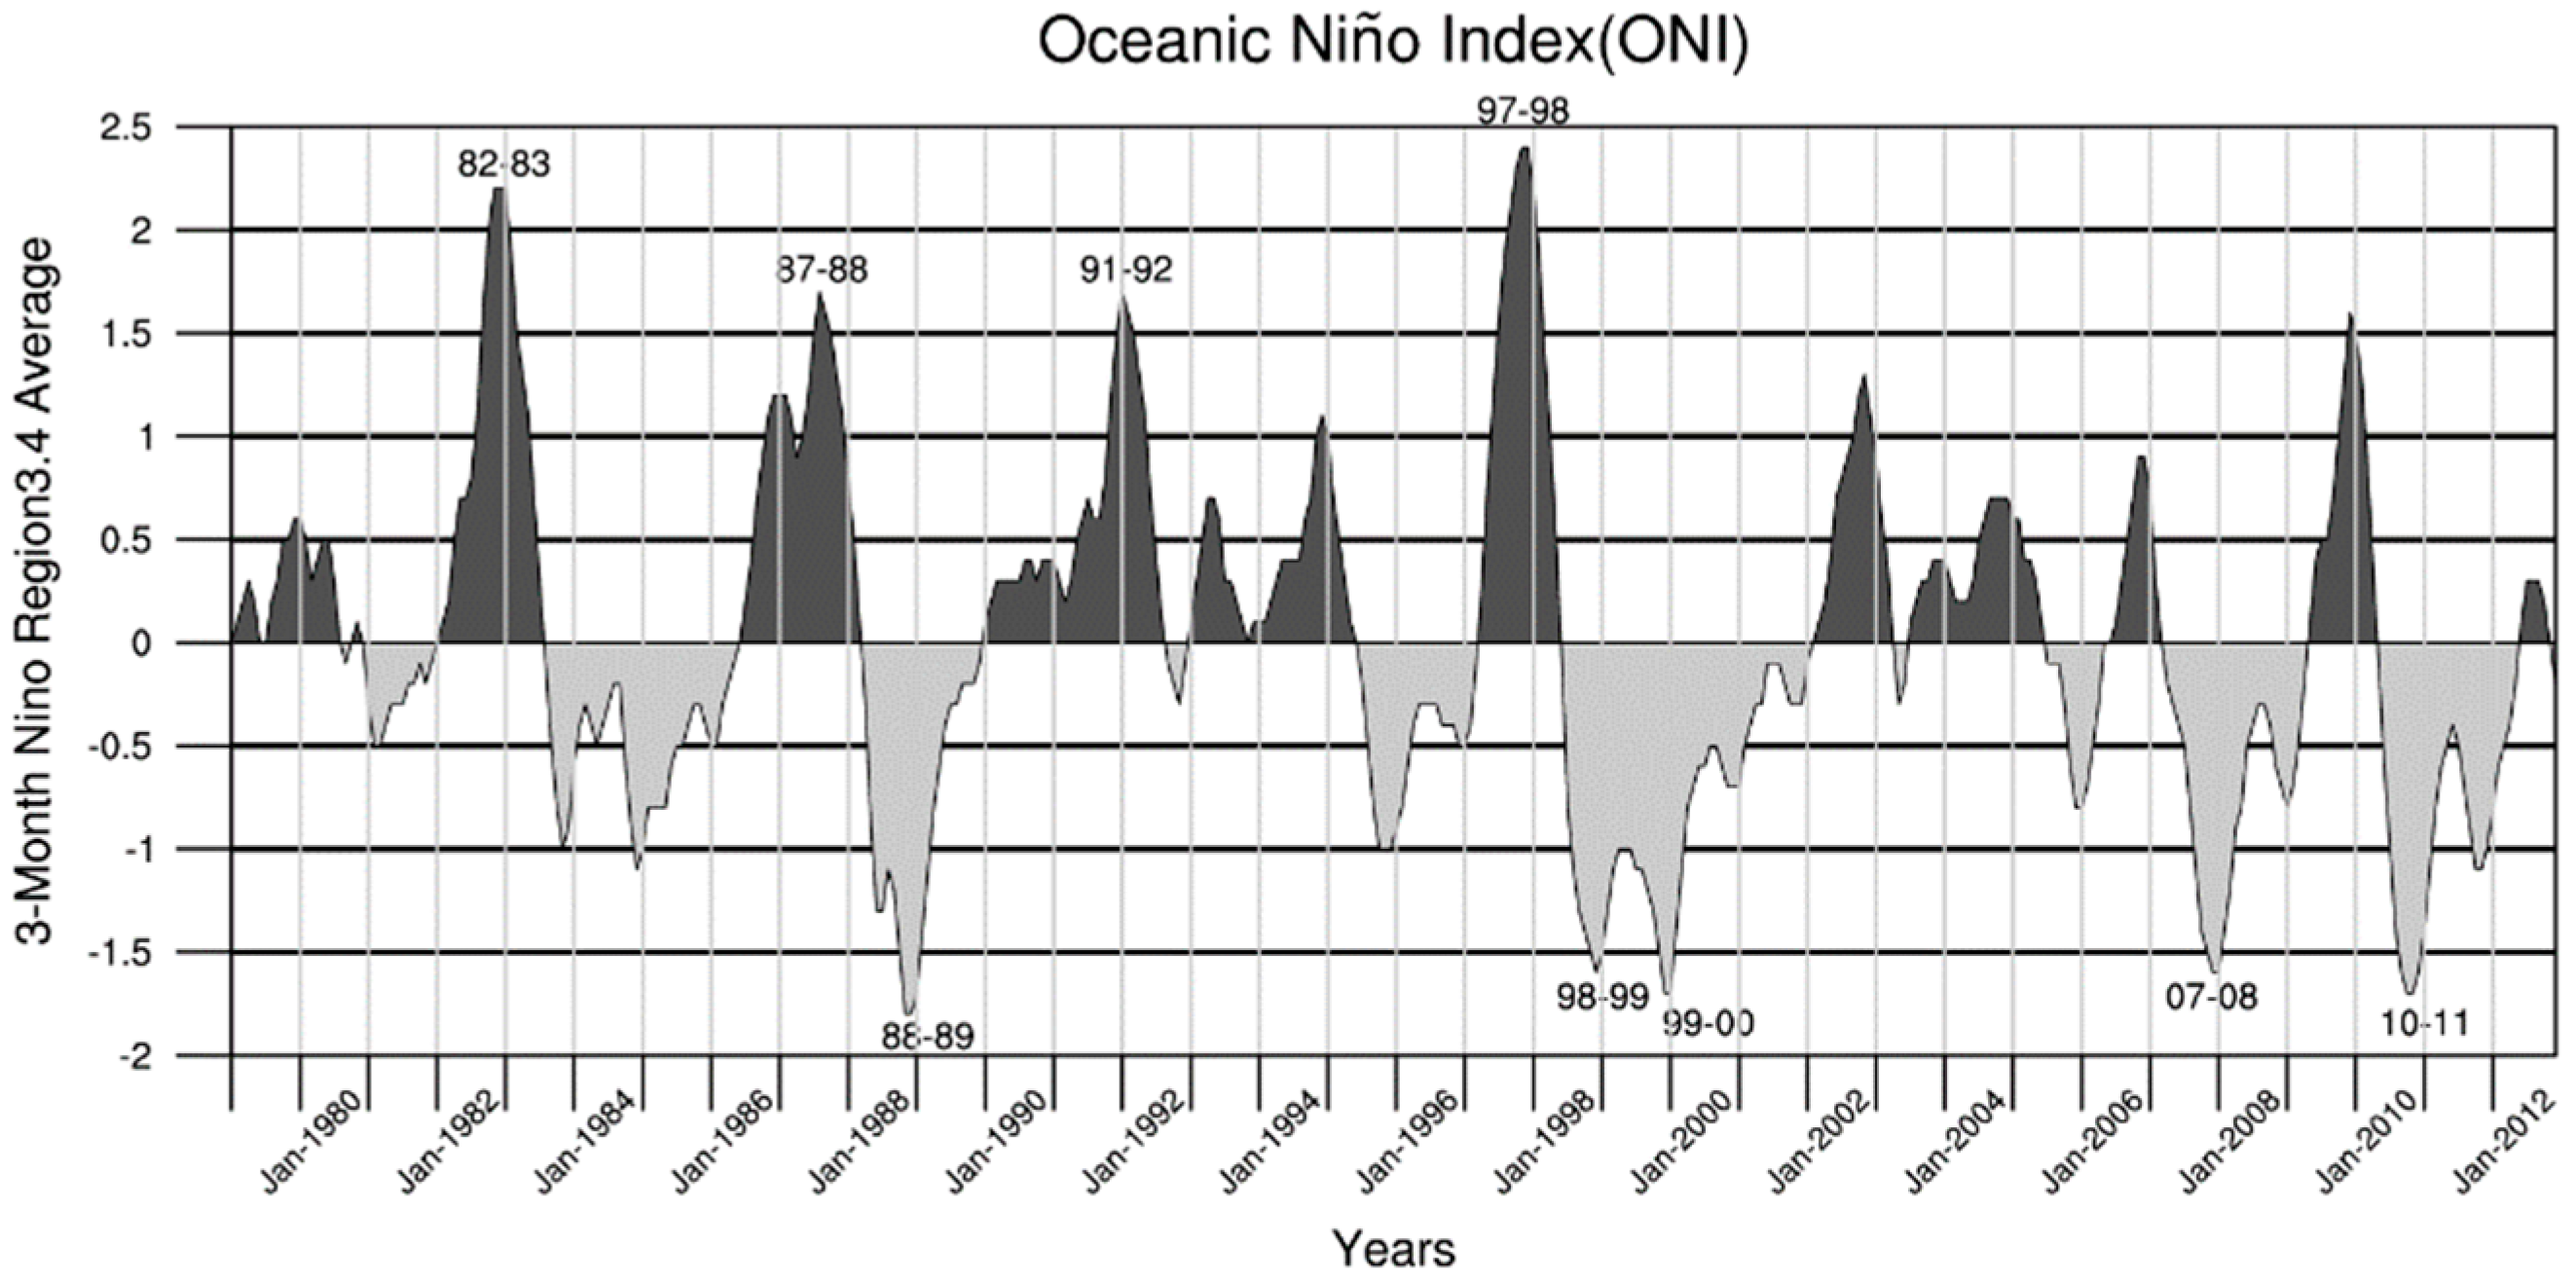
El Niño (La Niña) is a phenomenon in the equatorial Pacific Ocean characterized by five consecutive 3-month running mean sea surface temperature (SST) anomalies in the Niño 3.4 region (5° S–5° N, 120° W–170° W) that is above (below) the threshold of +0.5 °C (−0.5 °C). This standard is known as the Oceanic Niño Index (ONI), which can be found at http://origin.cpc.ncep.noaa.gov/products/analysis_monitoring/ensostuff/ONI_v5.php). In this case, strong ENSO events have been analyzed. The strong El Niño (La Niña) years also need to meet a minimum of 3 consecutive overlapping seasons at or above (below) the +1.5 °C (−1.5 °C) anomaly. Under this rule, four El Niño winters (1982/83, 1987/88, 1991/92, 1997/98) and five La Niña winters (1988/89, 1998/99, 1999/00, 2007/08, 2010/11) are identified, shown in Figure 1.
To diagnosis the development of surface system, the Equation of surface forecast is used.
( H 0 t ) = ( H ¯ t ) R 9.8 p ¯ p 0 [ V · T + ( Γ d Γ ) ω + 1 C p dQ dt ] dlnp ,
where p 0 is surface pressure, p ¯ is the pressure in an average layer (500 hPa in this paper), t is time, H 0 ( H ¯ ) is the geopotential of p 0 ( p ¯ ) , V is the zonal and meridional wind, T is the air temperature,   Γ d is the adiabatic lapse rate, ω is the vertical velocity, and Q is the diabatic heating. The constant coefficients include the specific gas constant R = 287   J   k g 1 K 1 , the specific heat at constant pressure C P = 1004   J   k g 1 K 1 and adiabatic rate Γ = 0.65   / 100   m . For the following discussion, the left side of the equation present the geopotential tendency at 1000 hPa, expressed by Ht1000. The first item on the right side of the equation is the geopotential tendency at 500 hPa, expressed by Ht500. The second item on the right side is temperature advection. The third item is adiabatic heating (the vertical transportation of potential temperature). The fourth item is diabatic heating. Prime presents the intraseasonal time scale (10–30 day filtered).
Based on the definition of time scale, multiscale analysis is applied to separate the key items in Equation (1) so as to discuss the interaction between different time scale components. Every variable ( F ) is divided into three parts: F = F ¯ + F + F , where F ¯ presents the background field (>30 day), F is the intraseasonal field (10–30 day) and F is the synoptic-scale field (<10 day). The M-term Guassian-Type filter is used to get the background field. The Butterworth filter is used to get the intraseasonal and synoptic disturbance, with the windows 10–30 days and 3–10 days respectively. In this case, the wind and the temperature can be written as:
V = V ¯ + V + V ,     T = T ¯ + T + T .
And the vertically integrated temperature advection p ¯ p 0 ( V · 𝛻 T )   dlnp can be written as:
p ¯ p 0 ( V · 𝛻 T ) dlnp =   p 0 p 0 ( V ¯ · T ¯ ) dlnp V ¯   T ¯ +   p 0 p 0 ( V ¯ · T ) dlnp V   ¯ T + p 0 p 0 ( V ¯ · T ) dlnp V   ¯ T + p 0 p 0 ( V · T ¯ ) dlnp V T ¯ + p 0 p 0 ( V · T ) dlnp V T + p 0 p 0 ( V · T ) dlnp V   T + p 0 p 0 ( V · T ¯ ) dlnp V T ¯ + p 0 p 0 ( V · T ) dlnp V T + p 0 p 0 ( V · T ) dlnp V T .
The geopotential tendency at 500 hPa is mainly determined by the relative vorticity advection, geostrophic vorticity advection, the tilting term, and the divergence term. As for the mid-latitude systems (for a shortwave system), the relative vorticity advection is very important [32]. To analyze the geopotential tendency at 500 hPa, the relative vorticity advection V · v o r must be analyzed, which is evaluated in the same way. The intraseasonal relative vorticity advection can be separated as the following:
( V · v o r ) =   ( V ¯ · vor ¯ ) V ¯   v o r ¯ +   ( V ¯ · v o r ) V ¯   vor + ( V ¯ · vor ) V   ¯ vor + ( V · vor ¯ ) V   vor ¯ + ( V · vor ) V vor +   ( V · vor ) V vor + ( V · vor ¯ ) V   v o r ¯ + ( V · v o r ) V vor + ( V · vor ) V vor .

3. Results

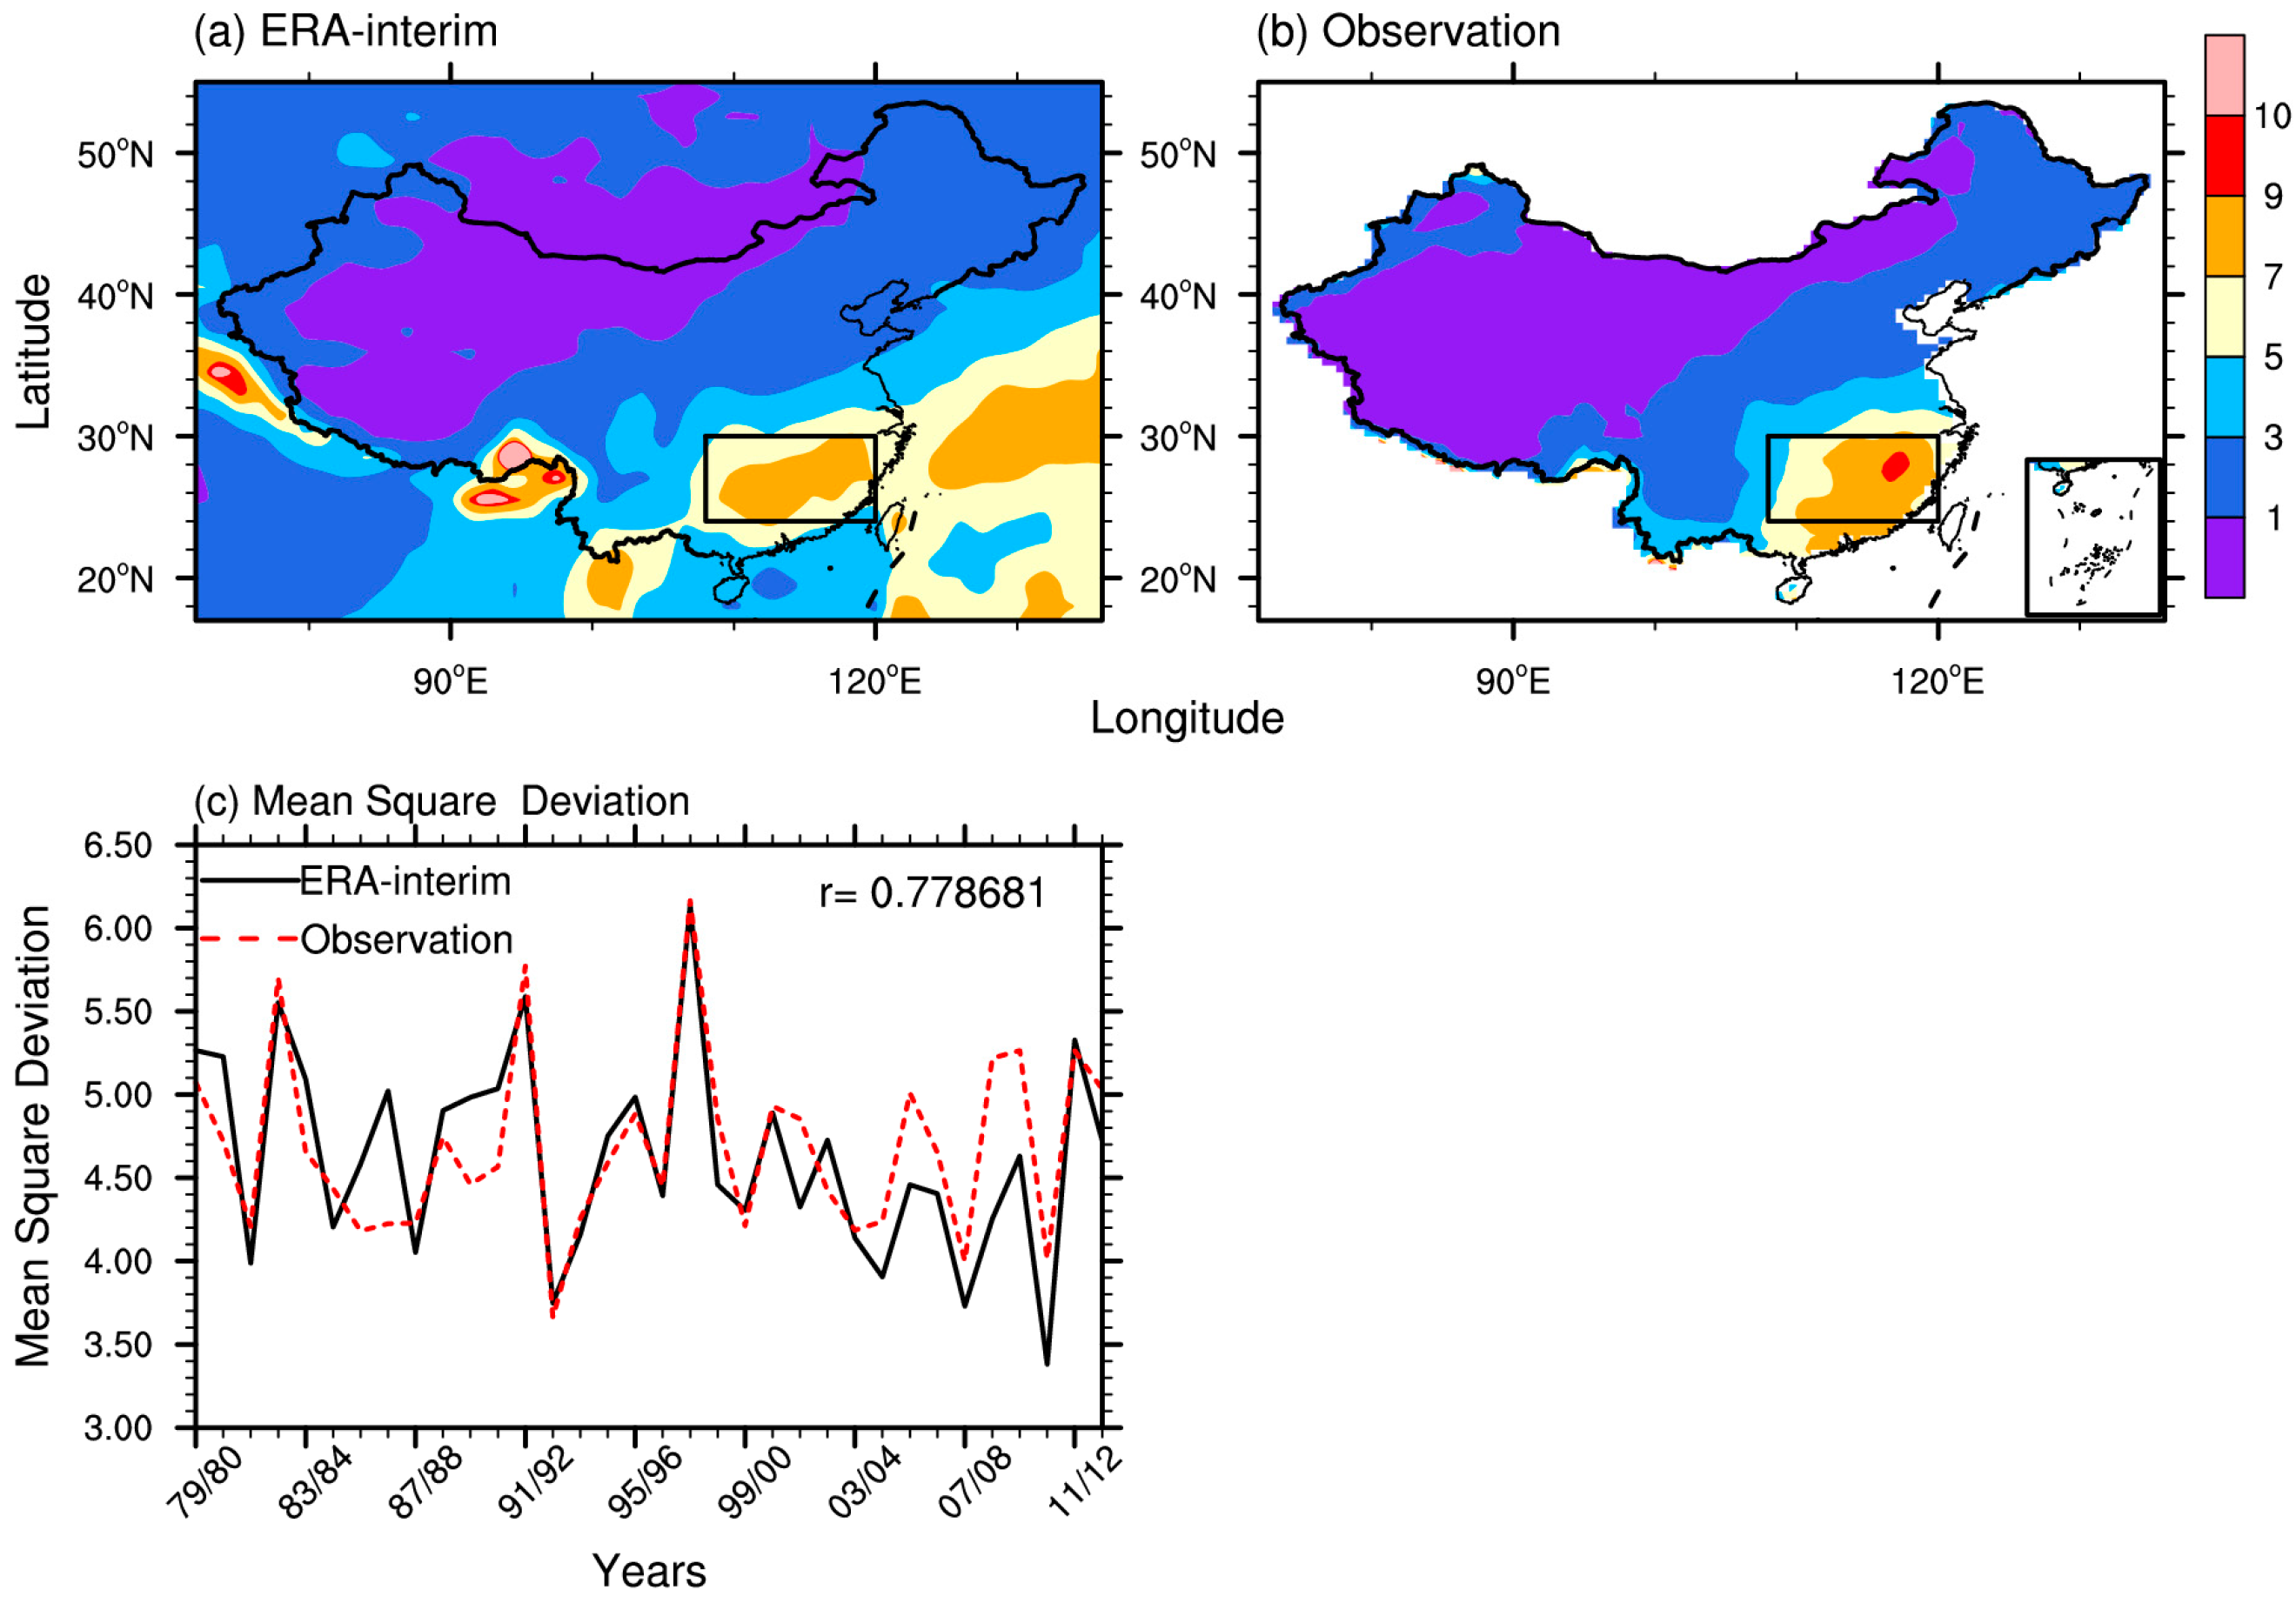
The variation in precipitation intensity for 34 winters, as indicated by the mean square deviation of daily precipitation, is shown in Figure 2. Comparing the results of ERA-interim precipitation (Figure 2a) with observation precipitation (Figure 2b), the mean square deviations have similar distributions and level of quantity. Both results present the degressive trend from southeast to northwest. The maximum activity extends northeastward, mainly covering southern China (approximately 24° N–30° N, 108° E–120° E). The annual mean square deviation of ERA-interim precipitation in southern China is close in accord with that of observation precipitation with a correlation coefficient of 0.77. The high consistency between the ERA-interim precipitation results and the observation results proves the ERA-interim precipitation is credible. Considering the possibility of rain belt moving to sea, ERA-interim precipitation is more favorable since there are no observed data over the ocean. Therefore, ERA-interim precipitation data are used below.
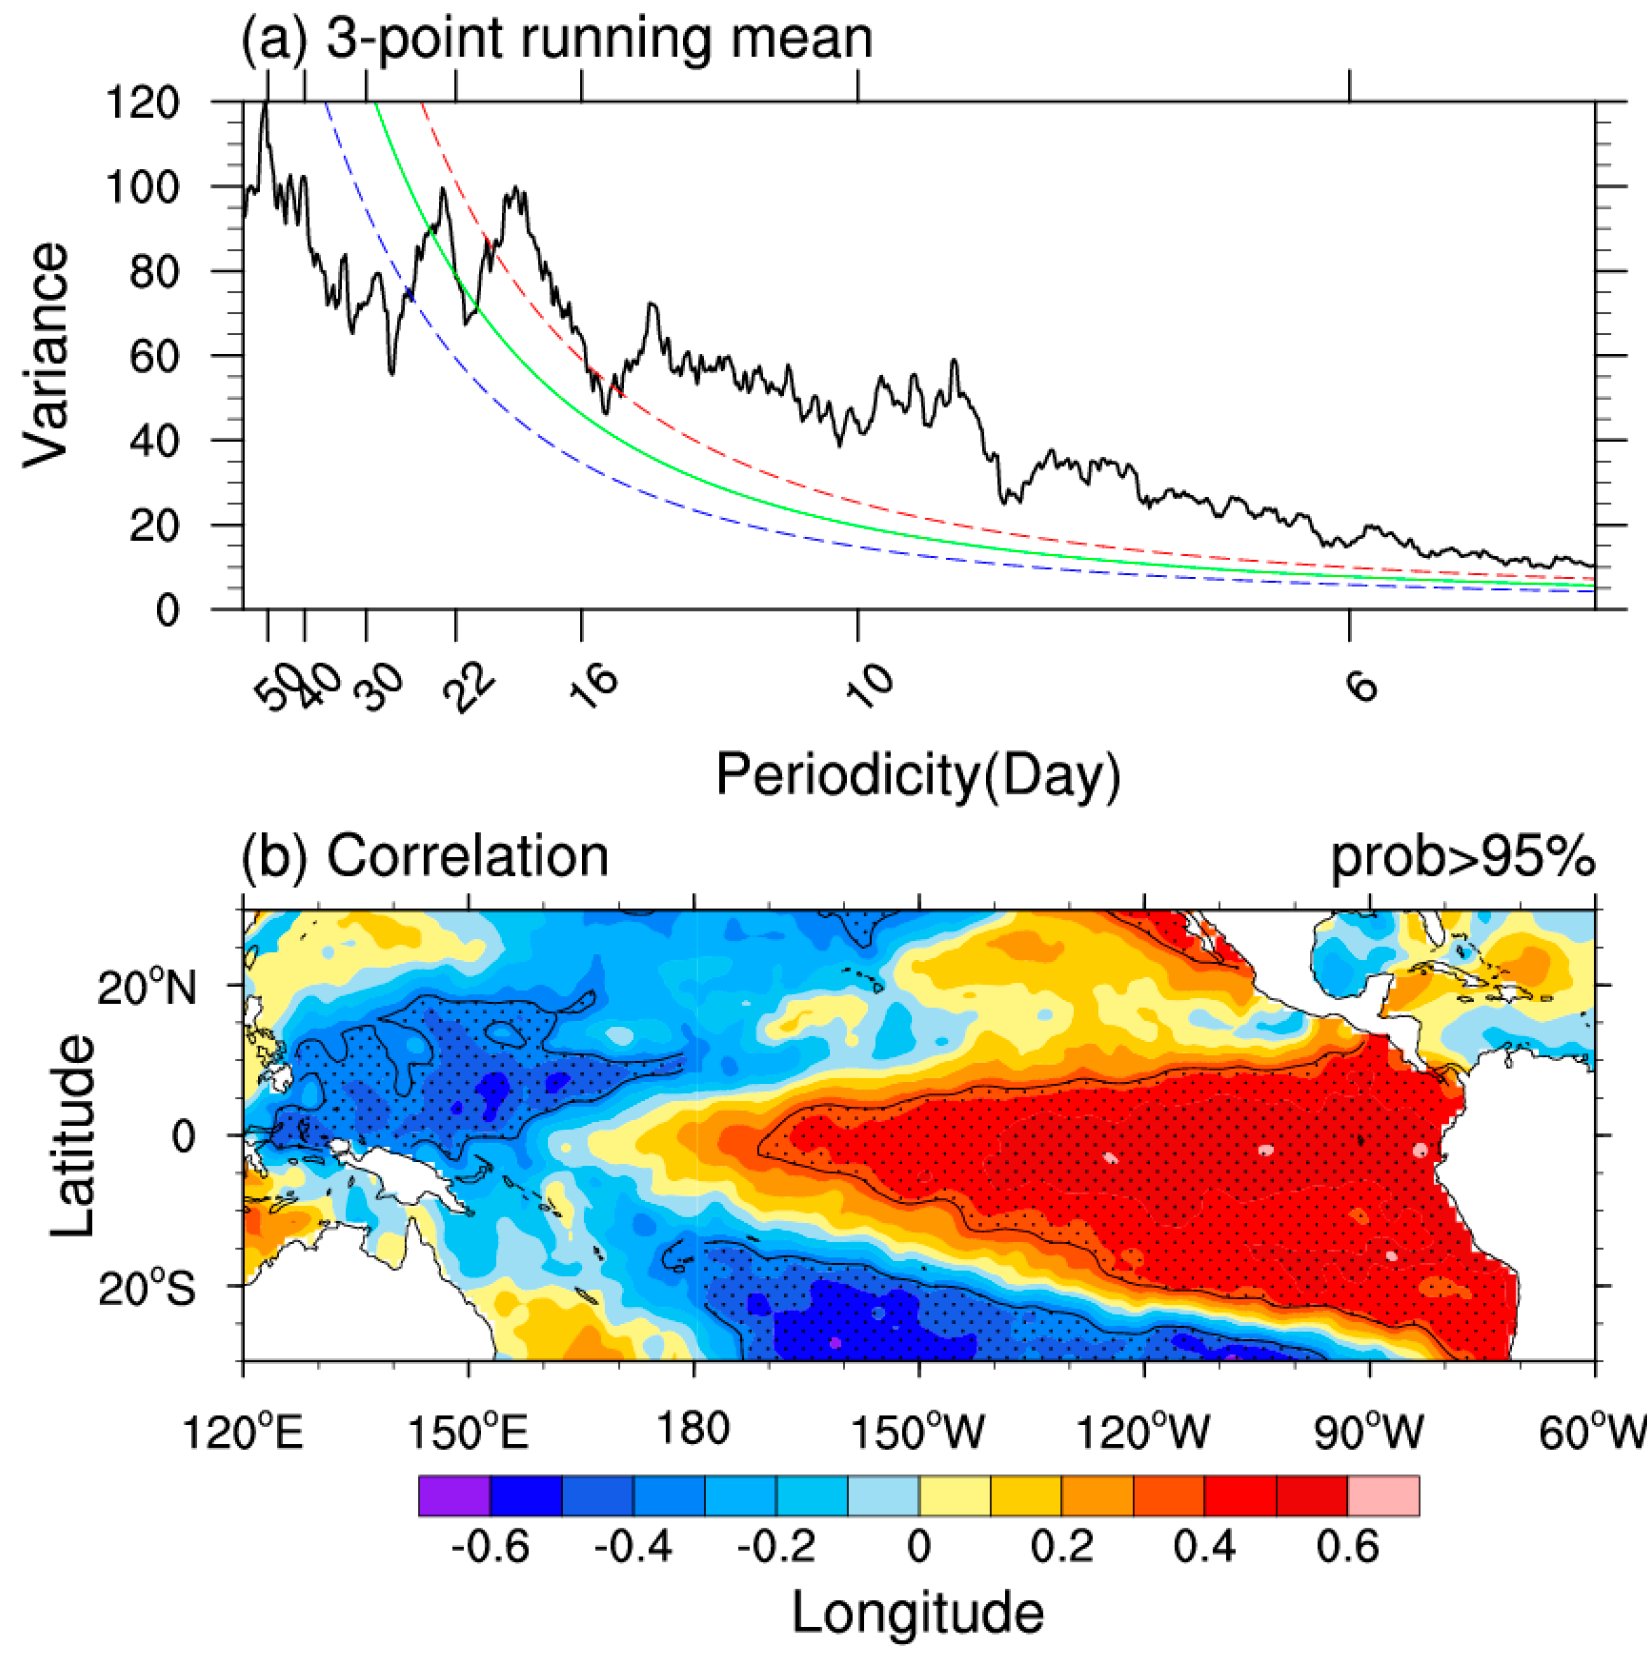
To obtain the significant cycle of winter precipitation over southern China, a power spectrum was used to analyze the dominant period of the winter precipitation. As indicated in Figure 3a, the red noise test shows that the cycle from 10 to 30 days is dominant at the intraseasonal time scale (10–90 day). Therefore, the original precipitation data were filtered on 10–30 day time scales by the Butterworth bandpass filter to highlight the 10–30 day oscillation variations. Ten to thirty day filtering was also carried out for other conventional element fields. Based on that, the correlation relationship between the mean square deviation of 10–30 day filtered winter precipitation in southern China and the raw winter SST is shown in Figure 3b. The correlations are high and significant in the central and eastern tropical Pacific region. This indicates that the 10–30 day precipitation oscillation intensity over southern China is strong (weak) when the SST anomaly is positive (negative) in the central and eastern tropical Pacific.
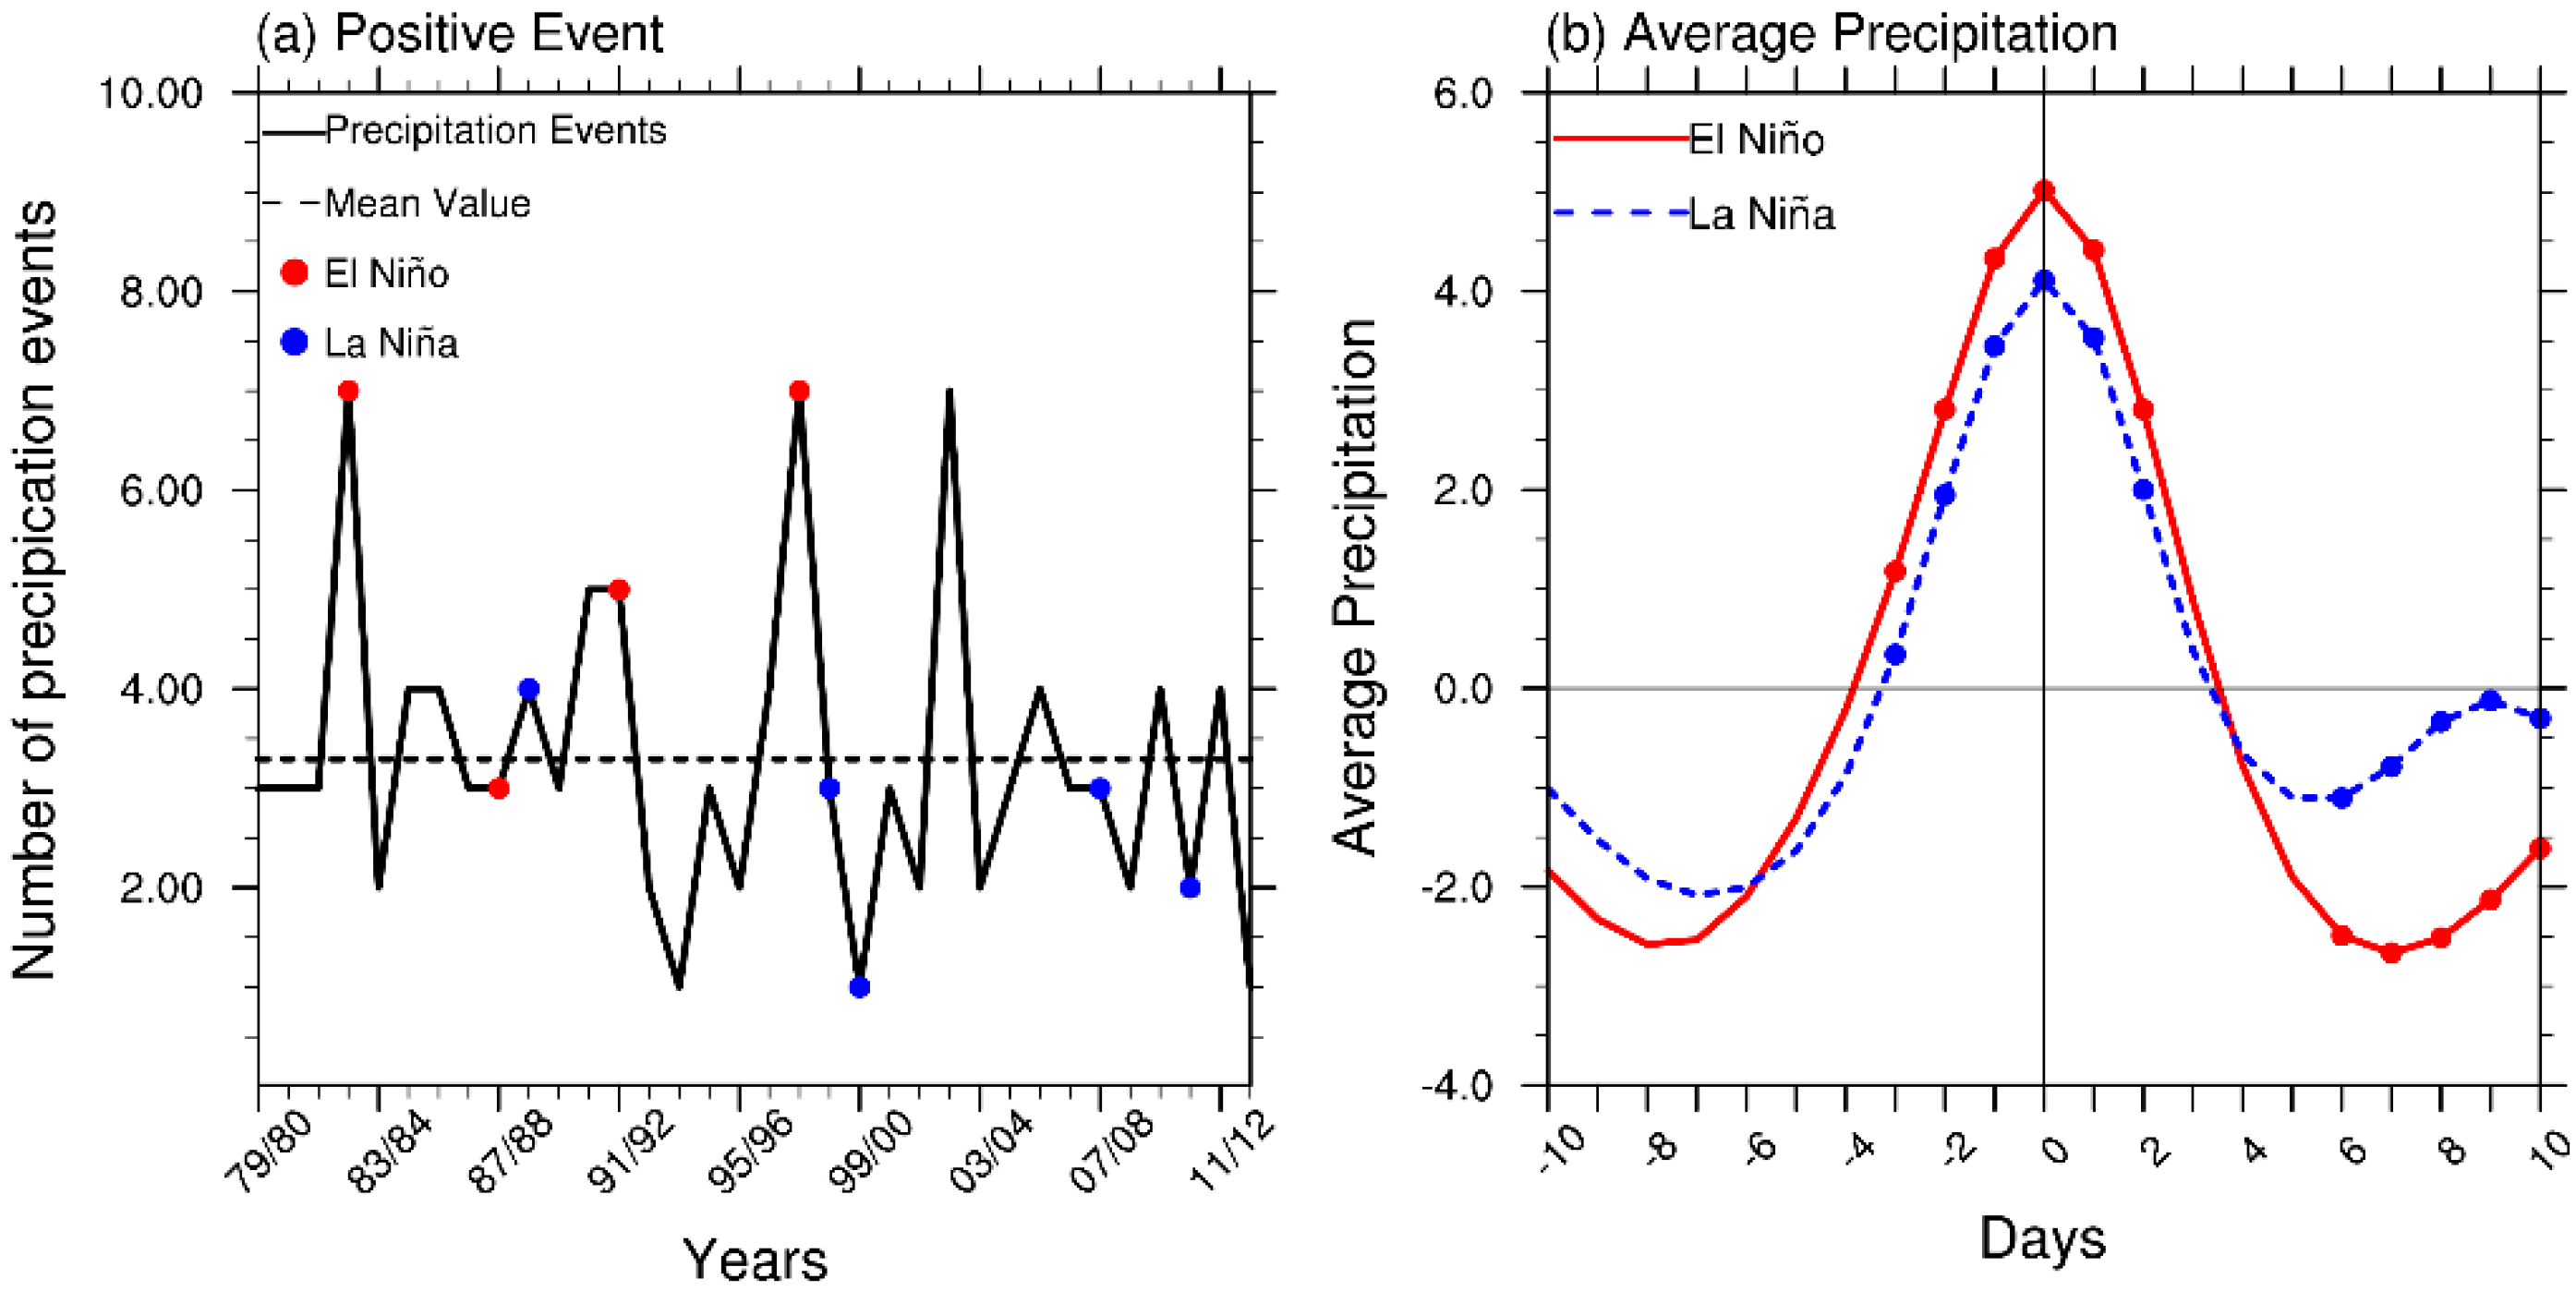
To detect possible impacts of ENSO on the intraseasonal evolution of the precipitation in winter, Figure 4 shows the frequency of the precipitation 10–30 day oscillation events and the evolution of the 10–30 day filtered precipitation in ENSO years. The study of precipitation could be carried out by extracting the active phase of 10–30 day precipitation, which means the intraseasonal precipitation events. On the basis of the regional average, a peak value greater than 1.5 times the mean square deviation was selected as one event. Peak times were defined as the 0 days of each event, and the precipitation of the 10–30 day filter with leading and lagging 1–10 day windows was synthesized.
In El Niño winters, precipitation oscillation events over southern China occurred 22 times, with up to seven events in 1982/83 and 1997/98, followed by five in 1992/93. The intraseasonal oscillation events in three out of four El Niño years are substantially higher than the mean value, and in the remaining years it is approximately the same as the mean value (slightly less). In most of the La Niña years, the frequency of the oscillation events is less than the average (Figure 4a). The intraseasonal precipitation has stronger amplitudes and a longer dominant period during El Niño years than that of La Niña years (Figure 4b). Basically, regardless of the El Niño year or La Niña year, precipitation has a significant quasi-biweekly oscillation. The dominant period of precipitation during El Niño years is 15 or 16 days, while that during La Niña years is 12 or 13 days. In the following sections, the initial time of precipitation period is scheduled for −8 day (El Niño) and −7 day (La Niña) respectively.
The precipitation belt and its development over southern China are closely related to the low-pressure system activity [33,34], as well as the water vapor transport from the ocean [35,36,37]. To diagnose the propagation characteristics of intraseasonal precipitation over southern China, the lead compositions of daily geopotential height and vapor transport from the ERA-interim were studied further (10–30-day filtered, Figure 5 and Figure 6).
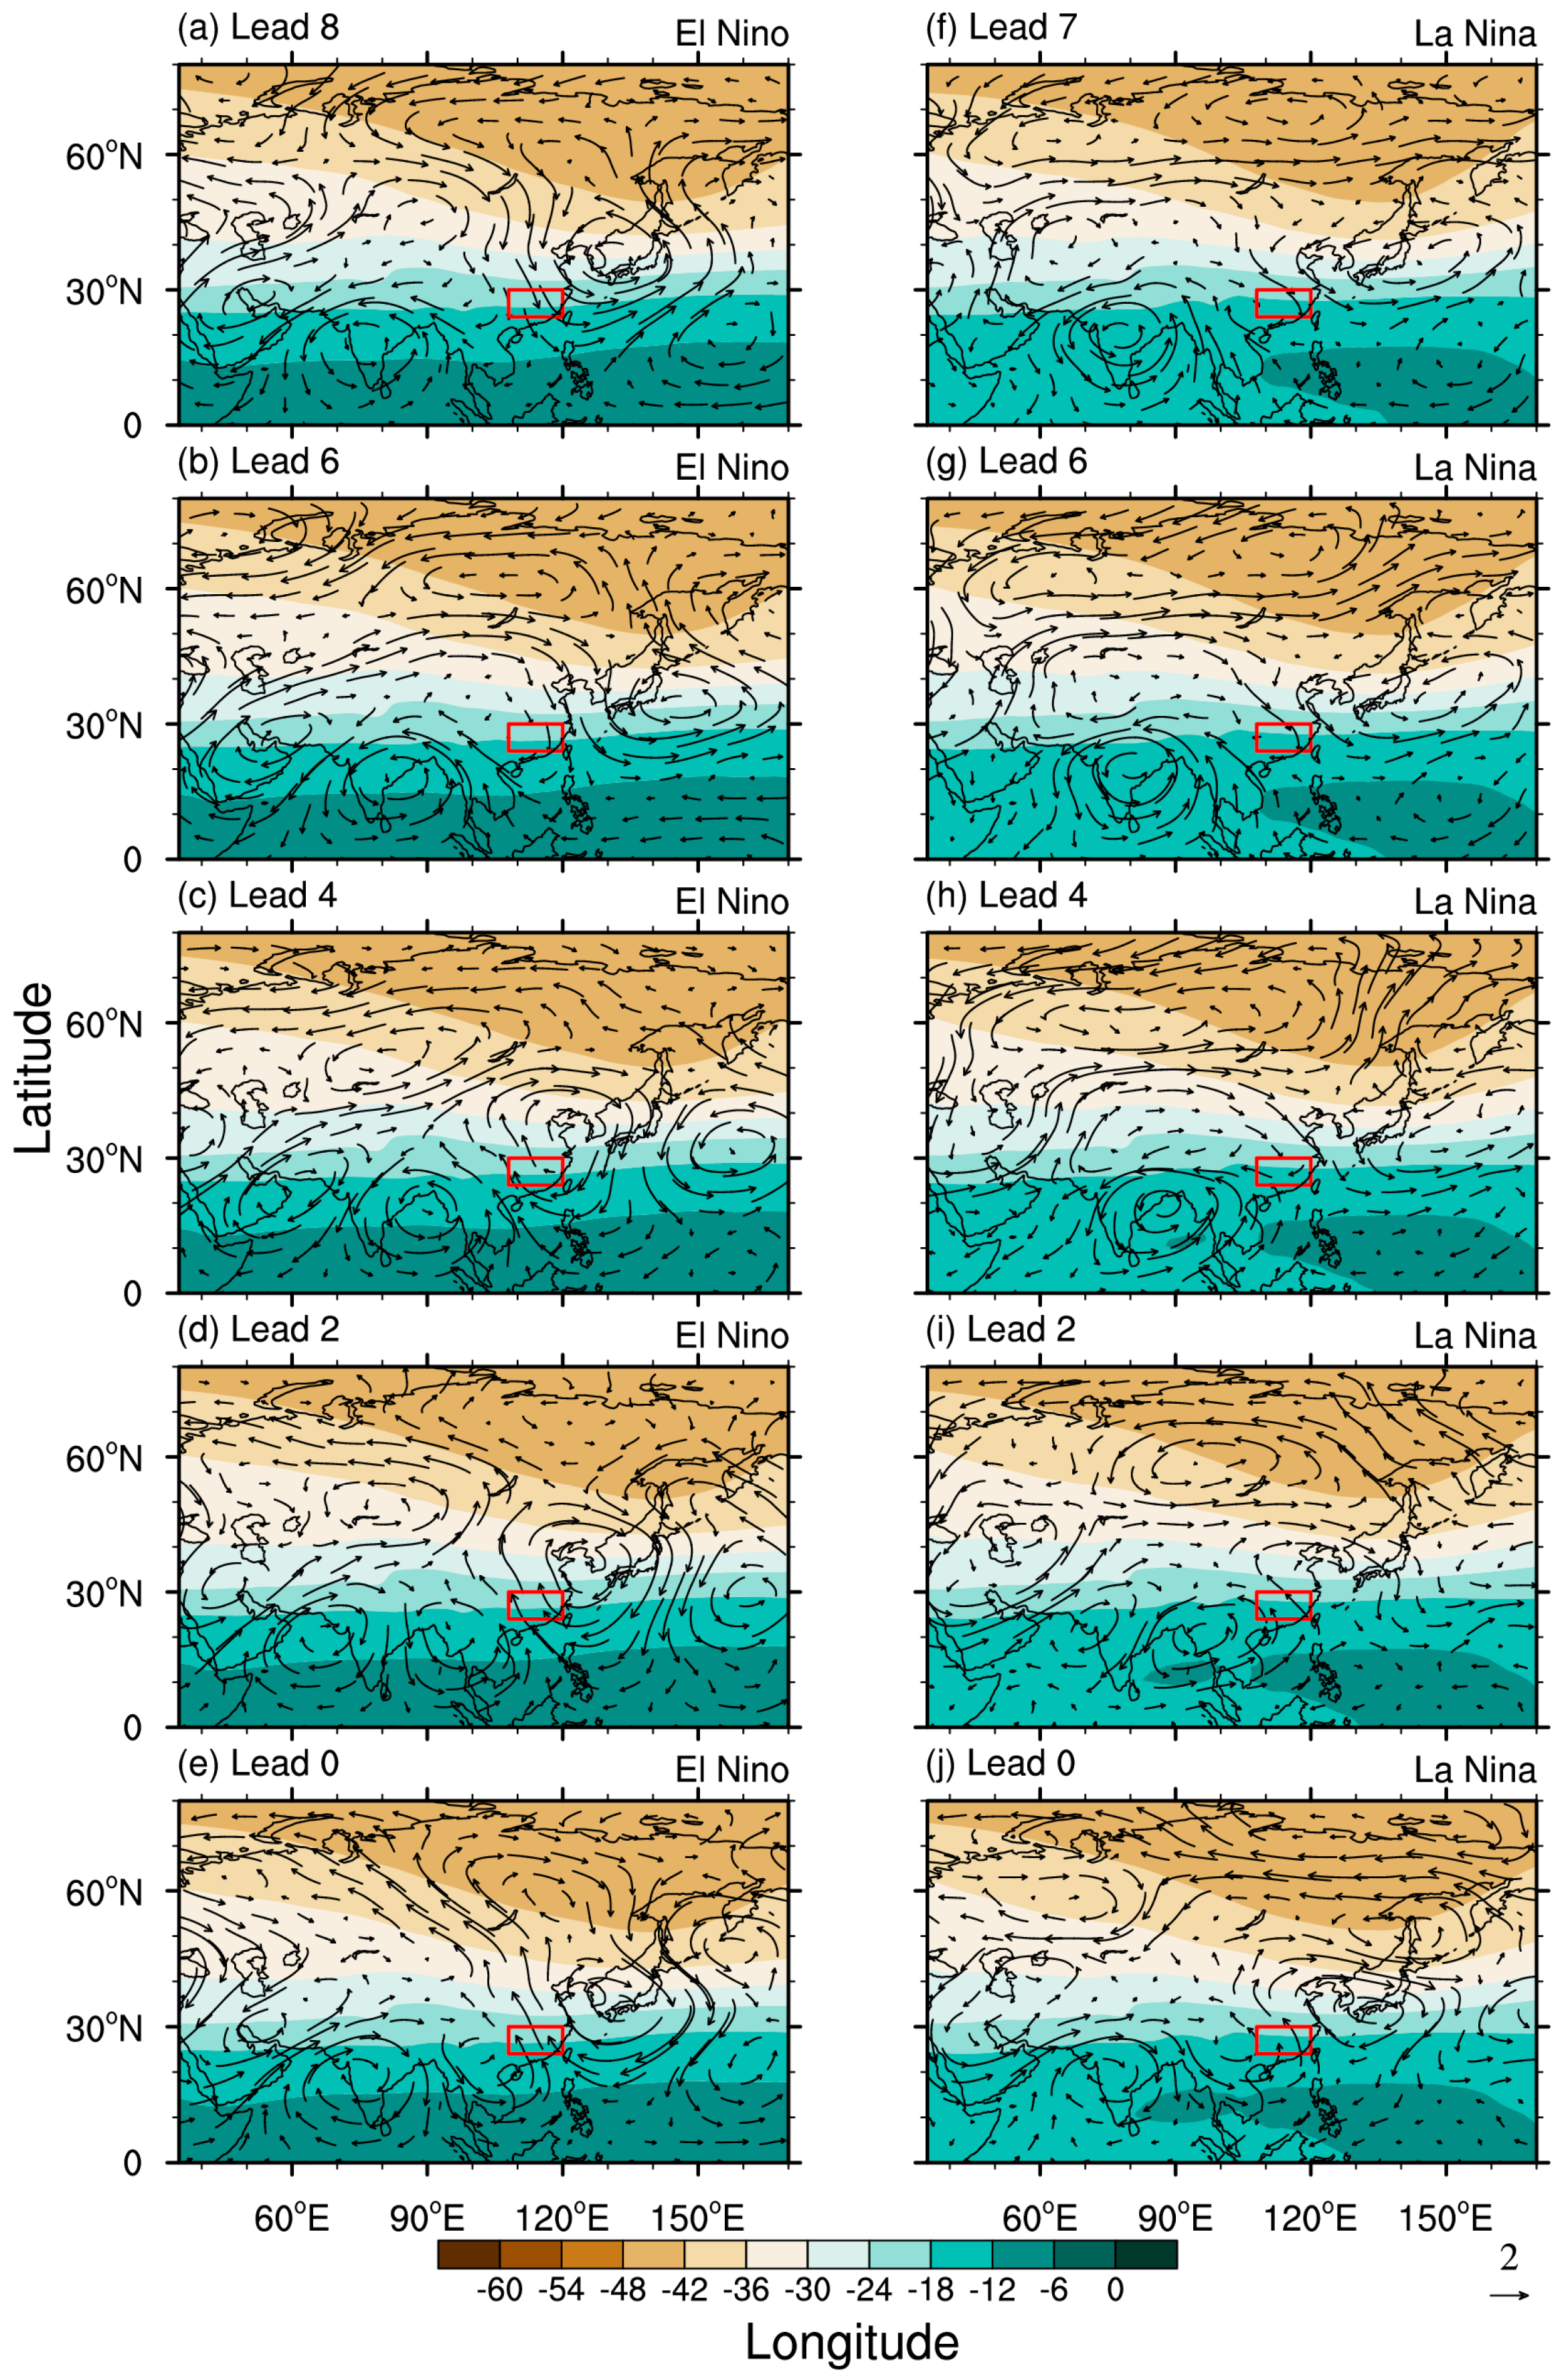
For El Niño, there are two significant intraseasonal low-pressure systems of geopotential height in the north of Lake Baikal and the east of Aral Sea. From −8 day to −6 day (Figure 5a,b), the Lake Baikal intraseasonal low-pressure system moves southeastward and then turns southwestward while the Aral Sea intraseasonal low-pressure system extends from west to east along the northern side of the Tianshan Mountains. Both intraseasonal low-pressure systems intensify and join at the Altay Mountains, exhibiting the largest degree of intensity at −6 day. From −6 day to the peak day, the intraseasonal low-pressure system at the Altay Mountains weakens, and its northwest–southeast central tilt continues to move southeastward into southern China.
For La Niña, a strong and significant intraseasonal low-pressure system appears in middle–high latitude of the northern hemisphere. It is located in the Central Siberian Plateau and stretches across much of the north of the supercontinent of Eurasia. In contrast to that observed for El Niño, this low-pressure system is much stronger and more northerly in the initial stage (−7 day, Figure 5f). Subsequently, the intraseasonal low-pressure system moves steadily from the north to the south while increasing in scope and decreasing in strength. During −4 day, the area range and intensity of the low-pressure system both reach their extreme value before its center moves southeastward into southern China. For both El Niño and La Niña, the intraseasonal rainfall appears in southern China when the intraseasonal low-pressure system moves to 30° N, and southern China is located in the eastern part of the low-pressure system.
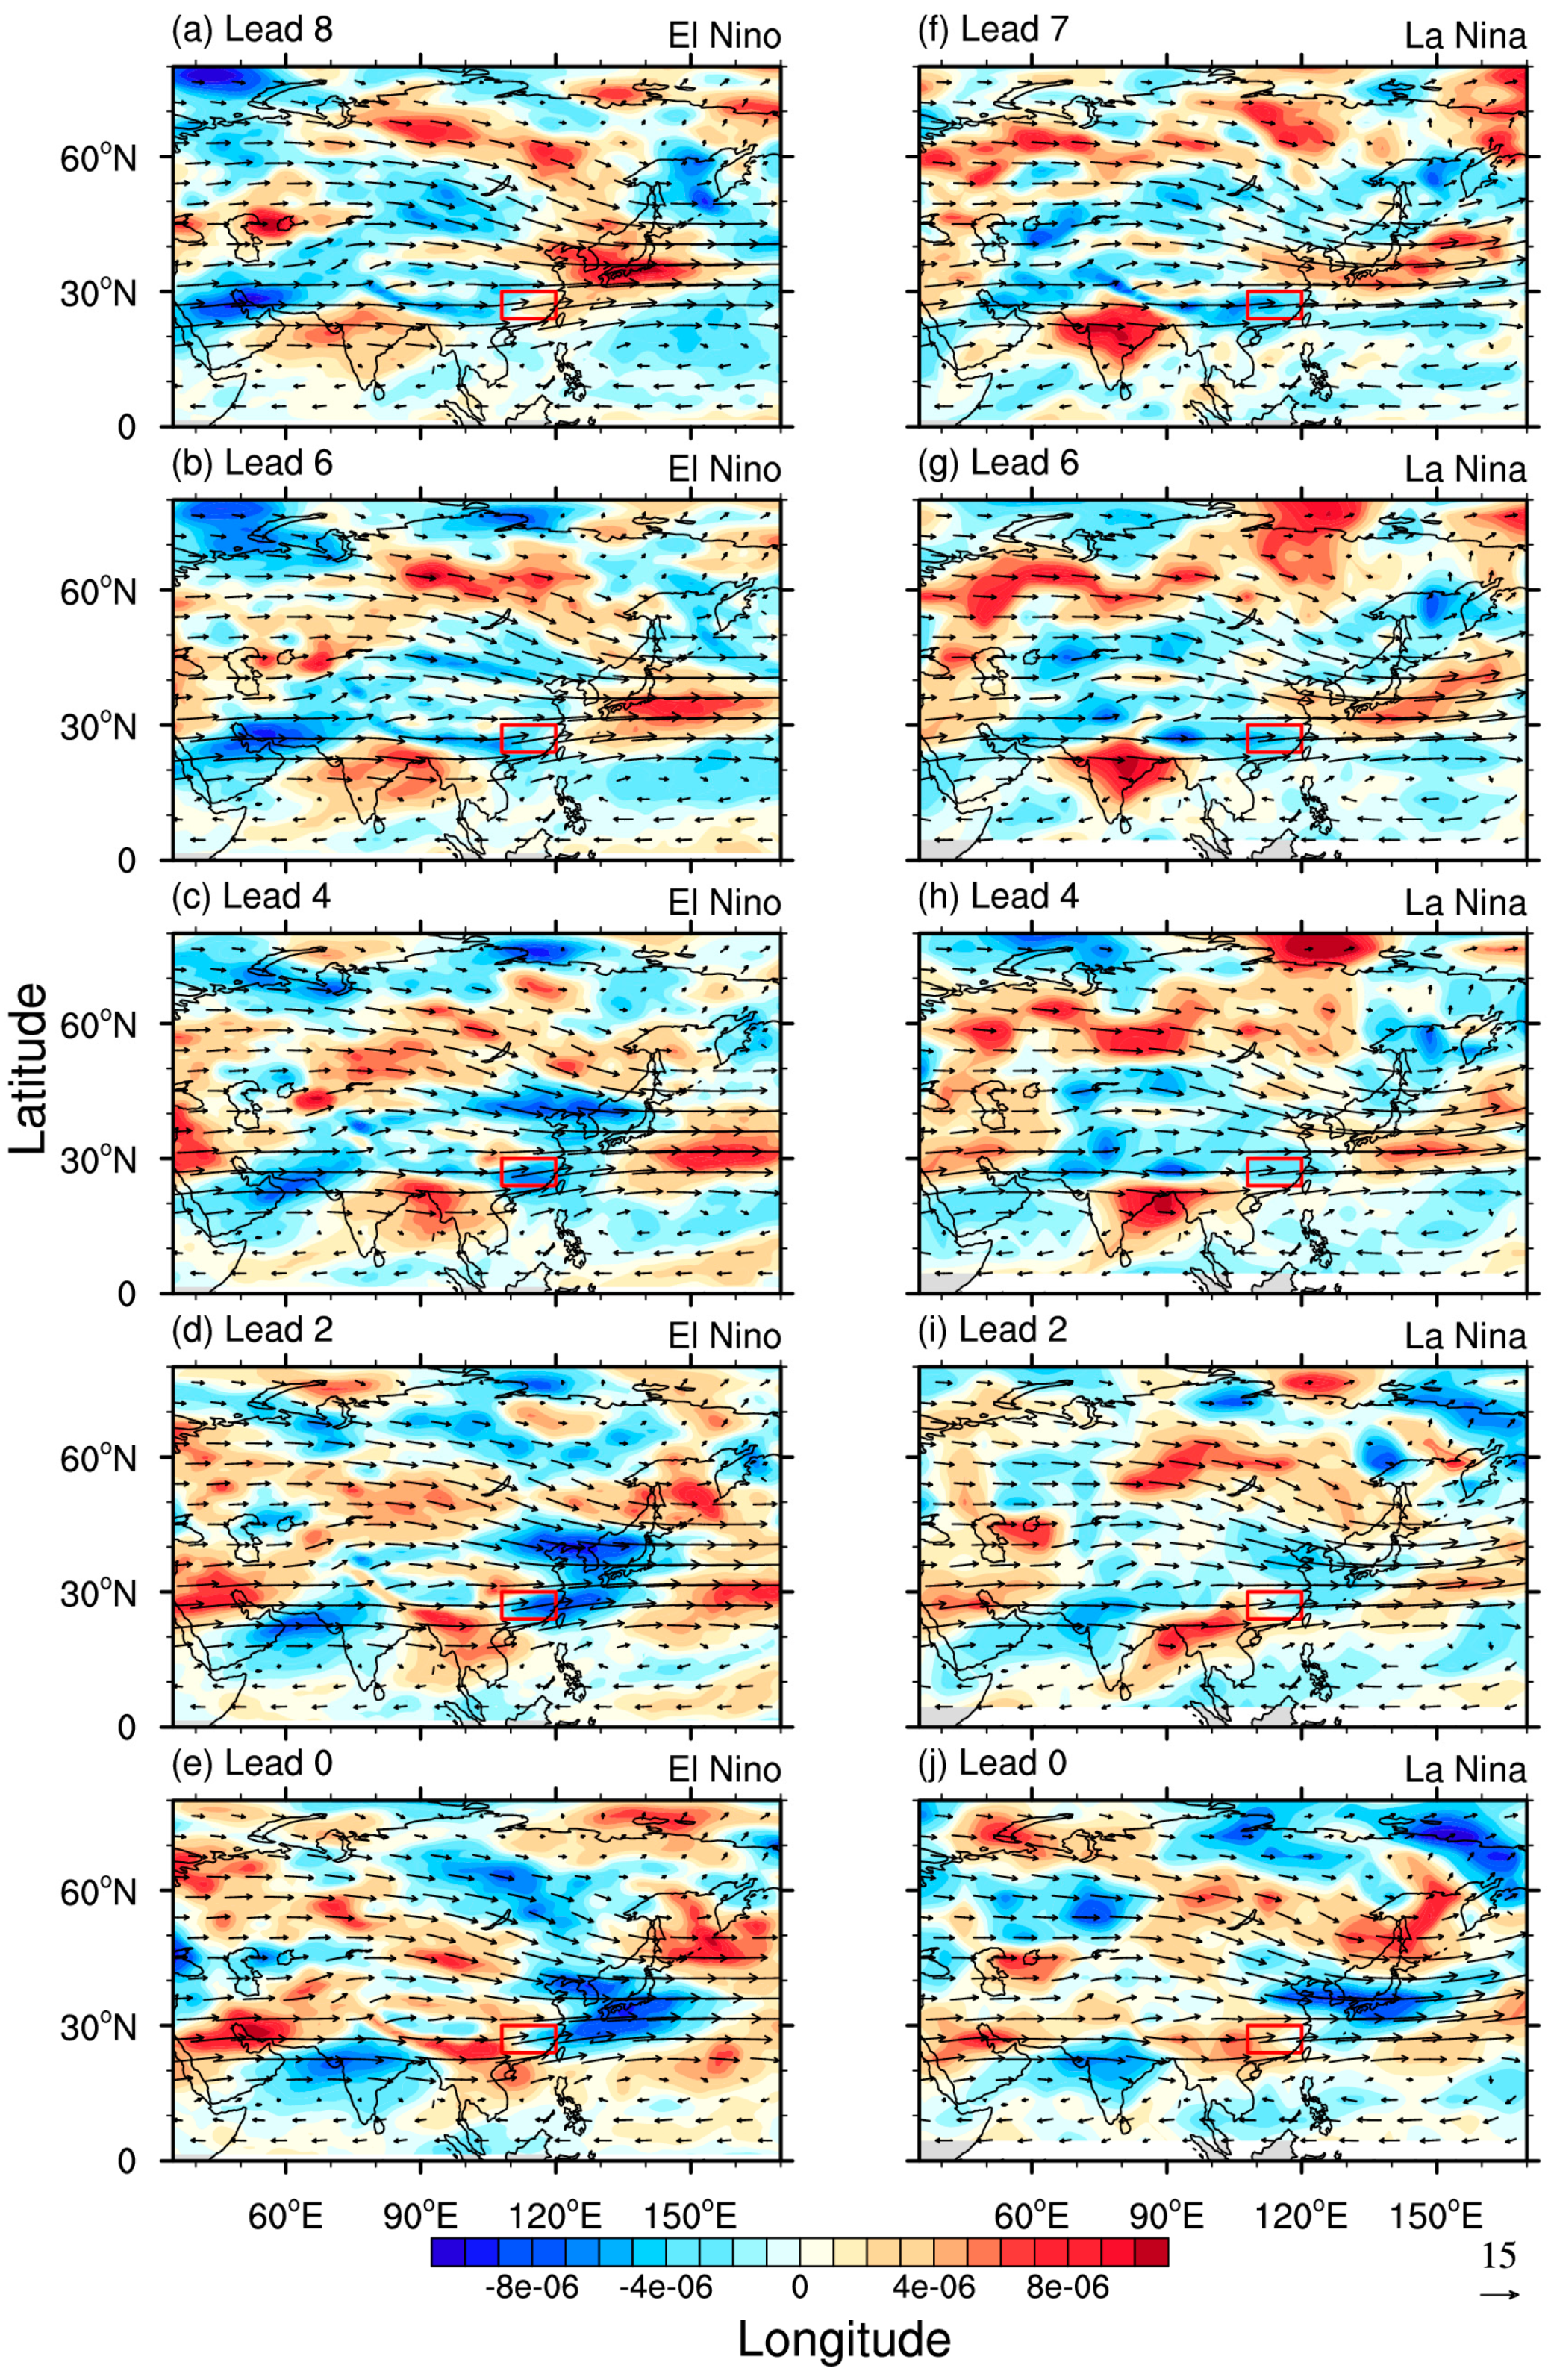
In winter, the intraseasonal water vapor flux over southern China is mainly from the middle–low latitude ocean. For El Niño, an intraseasonal north wind appears in South China and mid-latitude Pacific Ocean causing strong divergence of water vapor at the initial time (−8 day, Figure 6a). When the cyclonic type circulation of vapor transport moves eastward, the divergence center decreases significantly with a corresponding movement, and water vapor rapidly shifts to convergence in southern China. At −4 day (Figure 6c), the coastal areas appear to have a strong anticyclonic circulation of water vapor flux and be controlled by weak water vapor convergence. Subsequently, the anticyclonic circulation moves eastward with range reducing gradually where strong vapor transports from the Bay of Bengal, the South China Sea into southern China. A large amount of water vapor both from low latitudes and northwestern Pacific is concentrated in southern China providing sufficient vapor conditions for precipitation.
For La Niña, the water vapor transportation (10–30 day filtered) over southern China mostly comes from coastline causing two significant opposite water vapor centers located in southern China and the Bay of Bengal, respectively. At −7 day (Figure 6f), the water vapor exhibits relatively less divergence over southern China and stronger convergence in Bay of Bengal, respectively, by the northeast vapor transportation near South China Sea (SCS) to Indo-China Peninsula. Afterwards, the cyclonic circulation vapor transportation first weakens and shifts to anticyclonic at −4 day, then the center of vapor flux divergence field changes into convergence over southern China and divergence in Bay of Bengal at −2 day. This condition of water vapor is maintained for two days and reaches its peak at 0 day which provides a suitable vapor environment for precipitation.
Quantitative analysis of vapor flux divergence during the precipitation active period (−3 day to 3 day) can be used to reflect the difference of intensity of intraseasonal precipitation between El Niño and La Niña. The results indicate that the mean vapor flux divergence over South China in El Niño (−2.84922 × 10 5   kg · m 2 s 1 ) is larger than that in La Niña (−2.692329 × 10 5   kg · m 2 s 1 ), which are in accordance with the results of Figure 4b.
Utilizing the equation of surface forecast (Equation (1)), the low-pressure system at 1000 hPa that influences winter precipitation was theoretically analyzed. Because of low-pressure system is always moving in the direction of the pressure tendency gradient, selecting its central position of lagging 1 d as the key point of each day, the 10–30 day filtered geopotential height tendency was studied. As indicated in Figure 4b, the initial time of precipitation in El Niño and La Niña years is different, the whole leading period of precipitation is set from −8 day to the 0 day (El Niño) and −7 day to the 0 day (La Niña). Owing to the need to extract data from the day ahead, the study of the surface forecast equation was mainly in −8 day to −1 day (El Niño) and −7 day to −1 day (La Niña). The average of these days is called the averaging process below.
On the whole, as the intensity of the 1000 hPa low-pressure system gradually strengthened, ( H 0 t ) 
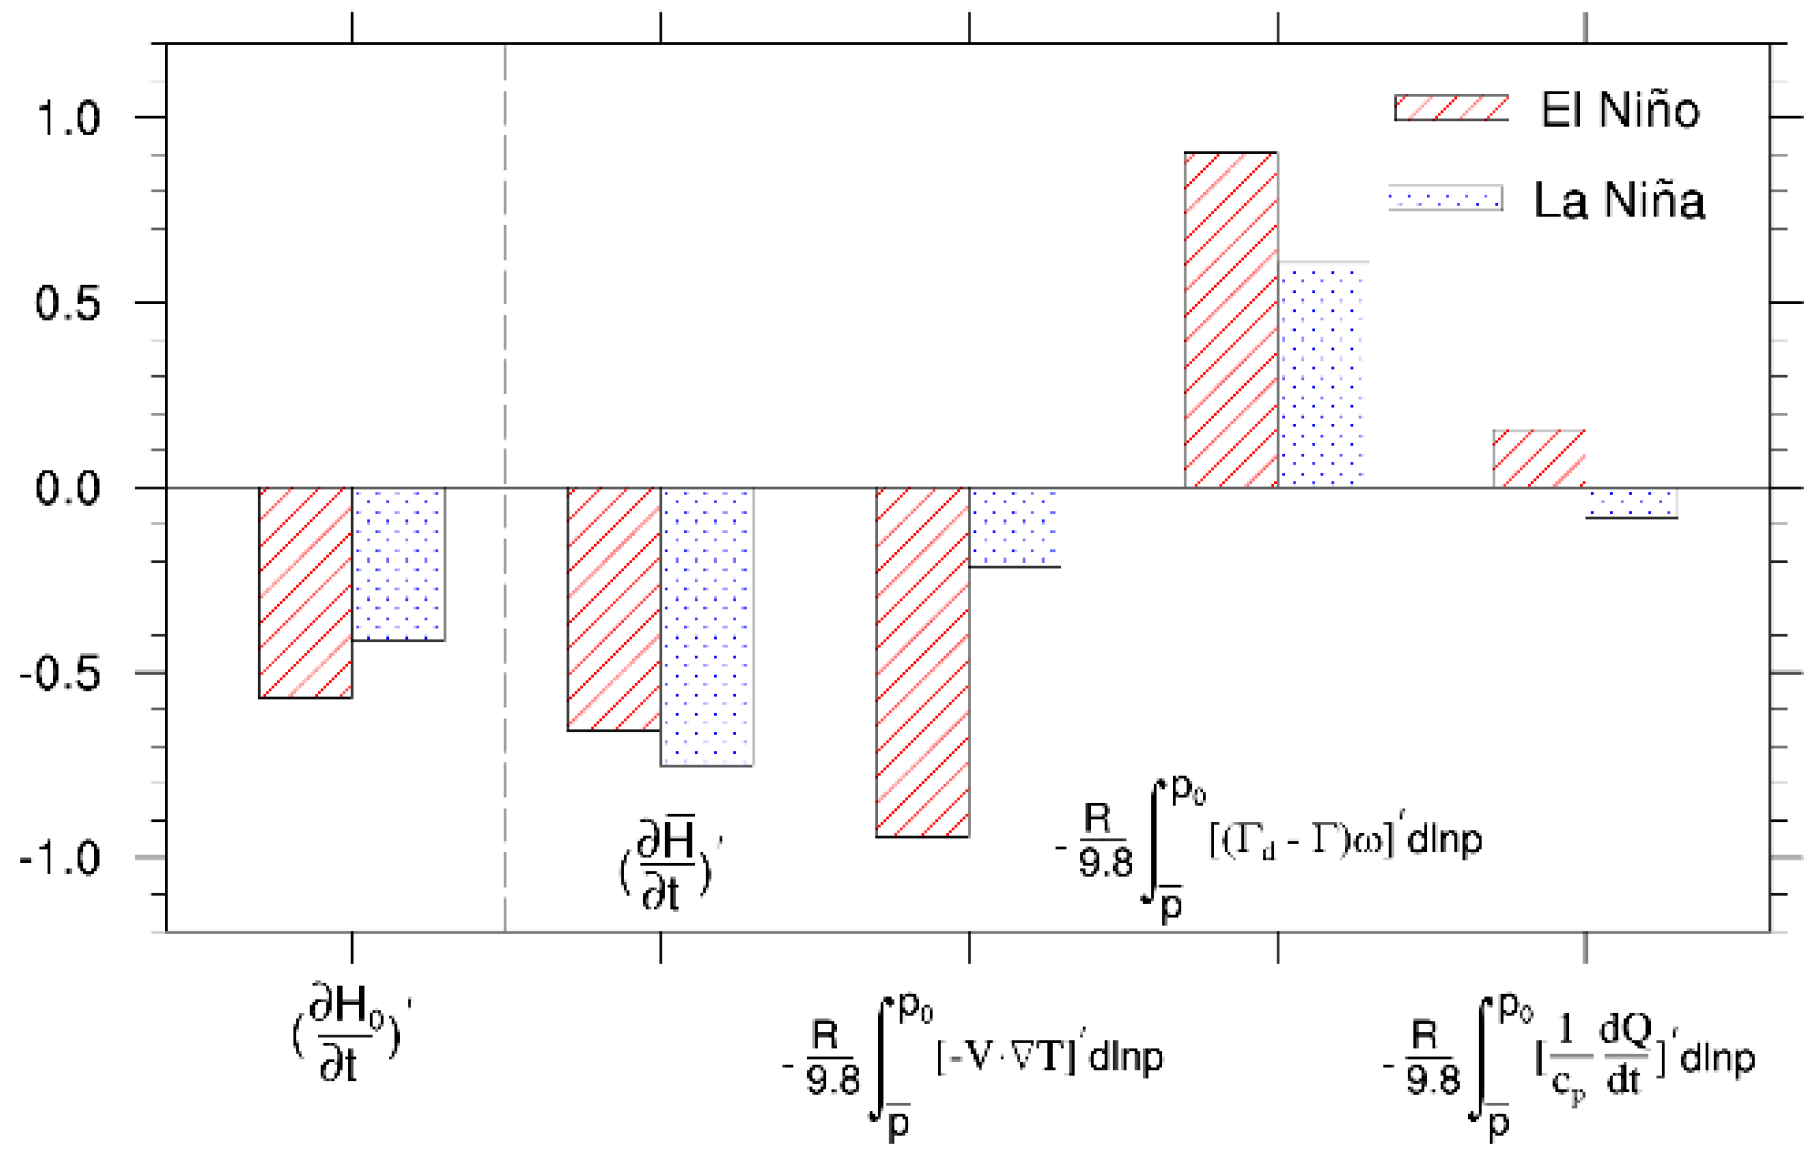
is always negative. If the result of right items in Equation (1) is also negative, then this item has positive contribution to low-pressure system development. Conversely, positive value is expressed as negative contribution that impedes development. The various terms in the surface forecast equation have made different contributions to the evolution of the 1000 hPa low-pressure system, as shown in Figure 7.
For El Niño, temperature advection has largest positive contribution rate, the effect of geopotential tendency over 500 hPa (Ht500) is smaller than the former, and the others are opposed. The balance between equation terms indicates that the low-pressure system is mainly caused by the joint effects of the Ht500 and the temperature advection. For La Niña, geopotential tendency over 500 hPa (Ht500) accounts for the dominant status as the effect of other items is weak throughout. Furthermore, with the occurrence of precipitation, the adiabatic heating presents a significant negative contribution, and the diabatic heating transforms into positive contribution in both El Niño and La Niña (Figure omitted).
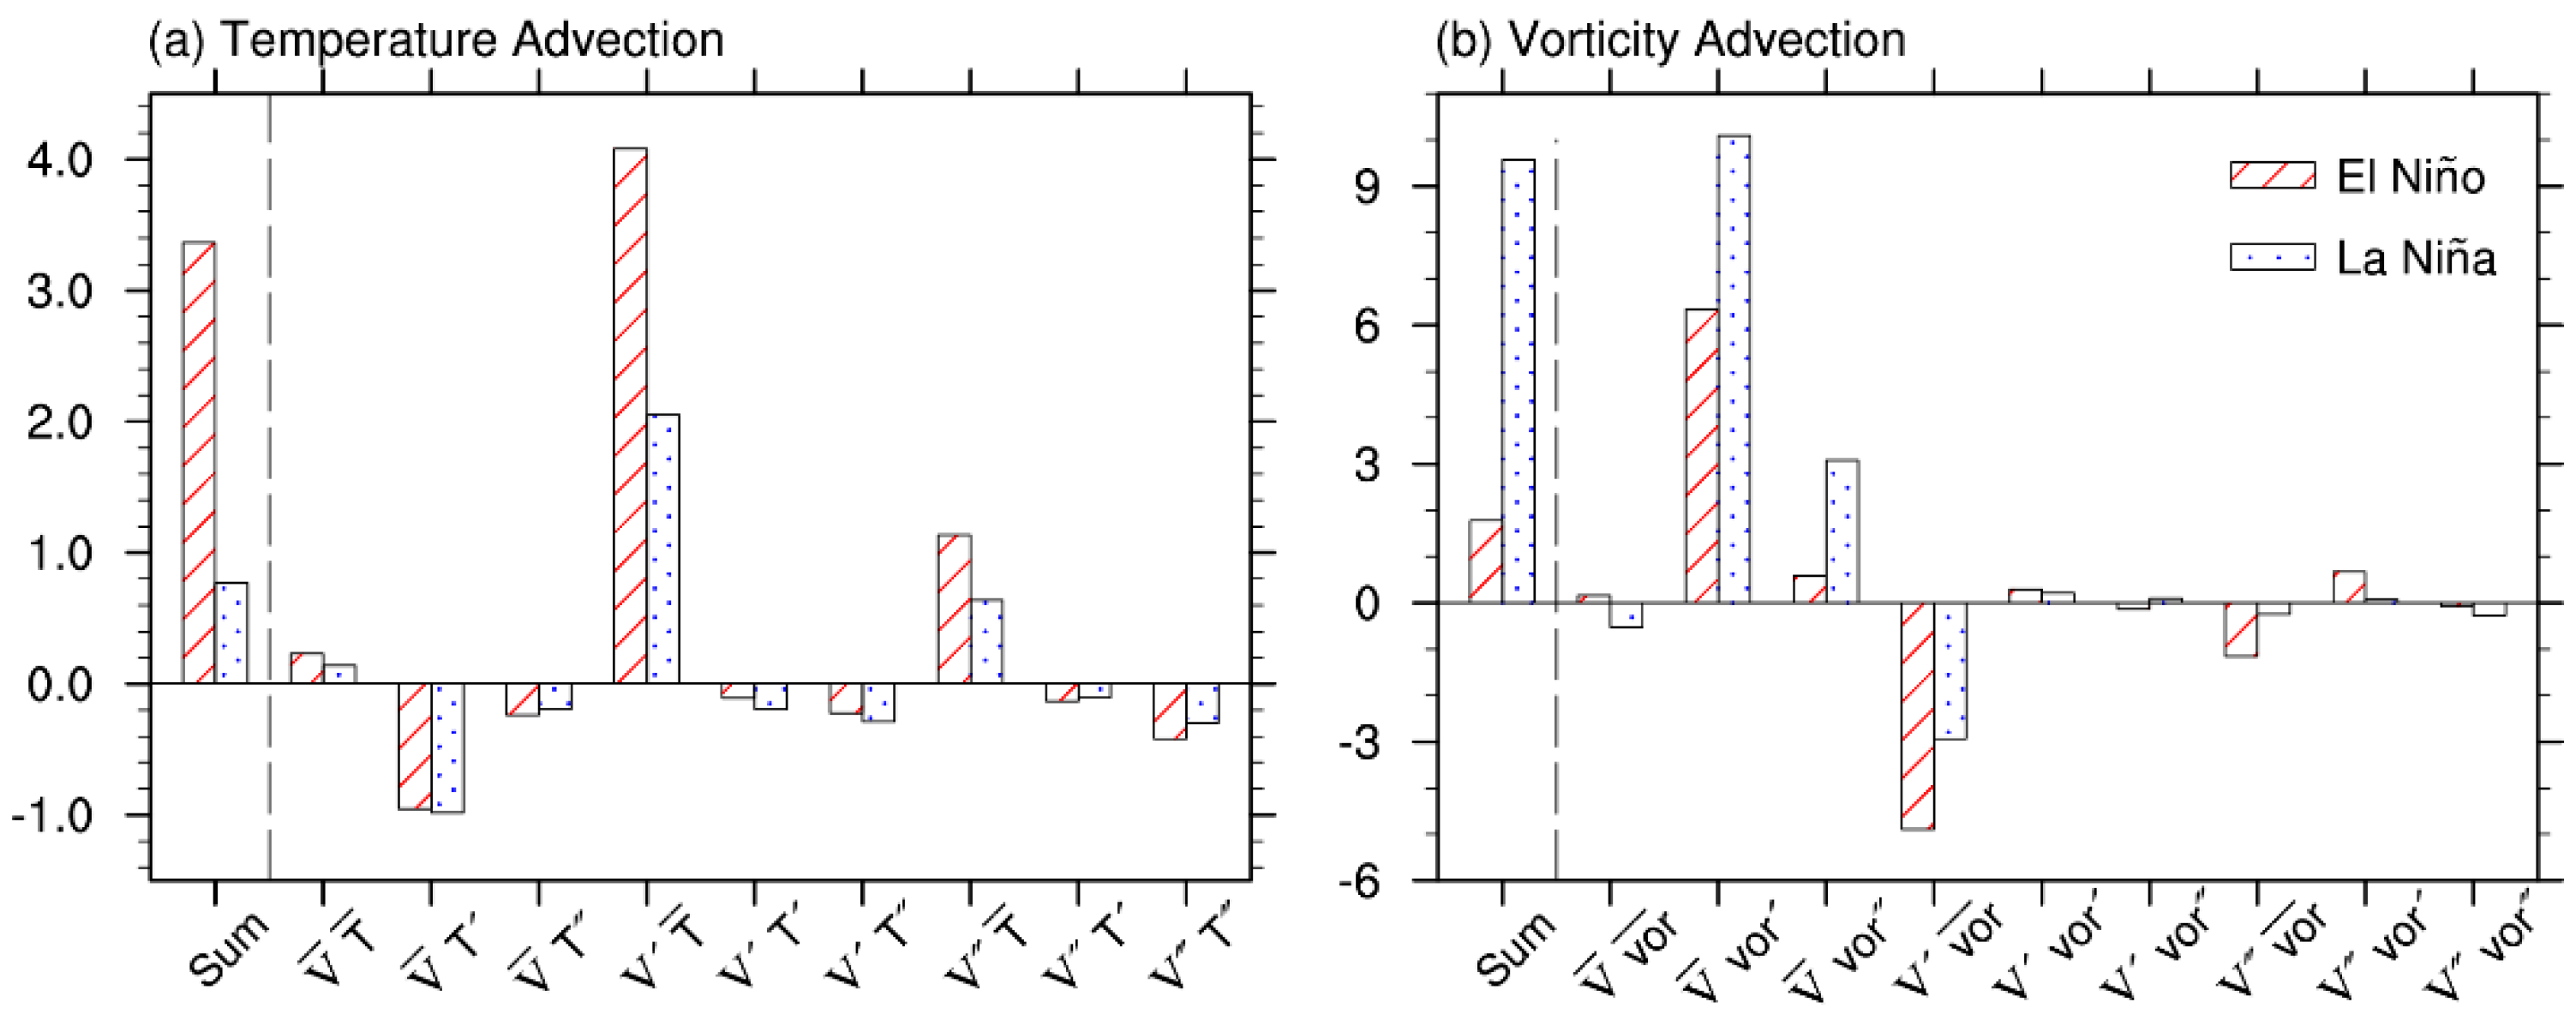
The temperature advection and geopotential tendency at 500 hPa are responsible for the strength of the intraseasonal low-pressure system. For the middle latitudes, the geopotential tendency at 500 hPa is mainly determined by the relative vorticity advection (for a shortwave system), therefore, the multiscale analysis of vertically integrated temperature advection from the surface to 500 hPa ( R 9.8 p ¯ p 0 [ V · T ] dlnp ) and vorticity advection over 500 hPa ( [ V · v o r ] ) in the averaging process (El Niño from −8 day to −1 day; La Niña from −7 day to −1 day) are shown in Figure 8.
For temperature advection, warm advection in El Niño is noticeably more than that in La Niña. The contribution to the warm advection from the intraseasonal wind when the background temperature is the maximum, and the one from synoptic-scale wind when the background temperature is of secondary importance, indicated background temperature plays a major role in the intraseasonal low-pressure system motion both in El Niño and La Niña. For relative vorticity advection over 500 hPa, positive vorticity advection in El Niño is less than that in La Niña. The interaction between background wind and intraseasonal vorticity and that between background wind and the synoptic-scale vorticity are two major factors impacting on the structure and motion of intraseasonal low-pressure system in La Niña.
To illustrate more clearly the propagation of warm advection and vorticity advection, the greatest contribution of them based on multiscale analysis was studied further. Figure 9 shows the intraseasonal wind and the background temperature over 500 hPa, which are most vulnerable to the temperature advection. During the precipitation oscillation period, the distribution of the background temperature is roughly the same both in El Niño and La Niña, appearing as descending from the equator to the North Pole and a cold trough situated in Okhotsk Sea.
However, the spatial distribution of the intraseasonal circulation fields is quite different. For El Niño, the longitudinal distribution of intraseasonal circulation is conspicuous, and the spatial distribution is very zonally asymmetrical. At −8 day, an intraseasonal cyclonic gyre extends northwestward from the Central Siberian Plateau to the Sea of Japan with the center in the Sea of Japan, another cyclonic gyre appears in the Aral Sea, and an anti-cyclonic gyre dominates in the middle. At low latitudes, an anticyclone gyre hovers over the Indian peninsula continuing to move eastward into the Indo–China Peninsula. At −4 day, those two cyclonic gyres in the middle–high latitudes gradually close together and even merge and move southwestward while anti-cyclonic gyre moves southward into the Pacific. At the same time of precipitation, the circulation of intraseasonal wind becomes opposite to the initial, but within similar geographical locations.
For La Niña, the intraseasonal circulation has a zonal distribution which is different from that in El Niño. At −7 day, Russia is dominated by a huge cyclonic gyre, and the west wind is quite remarkable near 60° N, and an anti-cyclonic gyre persists in its southern part. During the precipitation oscillation period, the cyclonic gyre moves southward stably and continuously until it controls most of Asia, which indicates weaker temperature tendency.
In comparison, the intraseasonal wind in El Niño features a zonal inhomogeneous structure as shown in Figure 9a–e. Temperature advection features a southwest–northeast distribution, leading to stronger warm advection in the east of intraseasonal cyclone gyre and brings significant temperature advection in El Niño, which differs from that in La Niña.
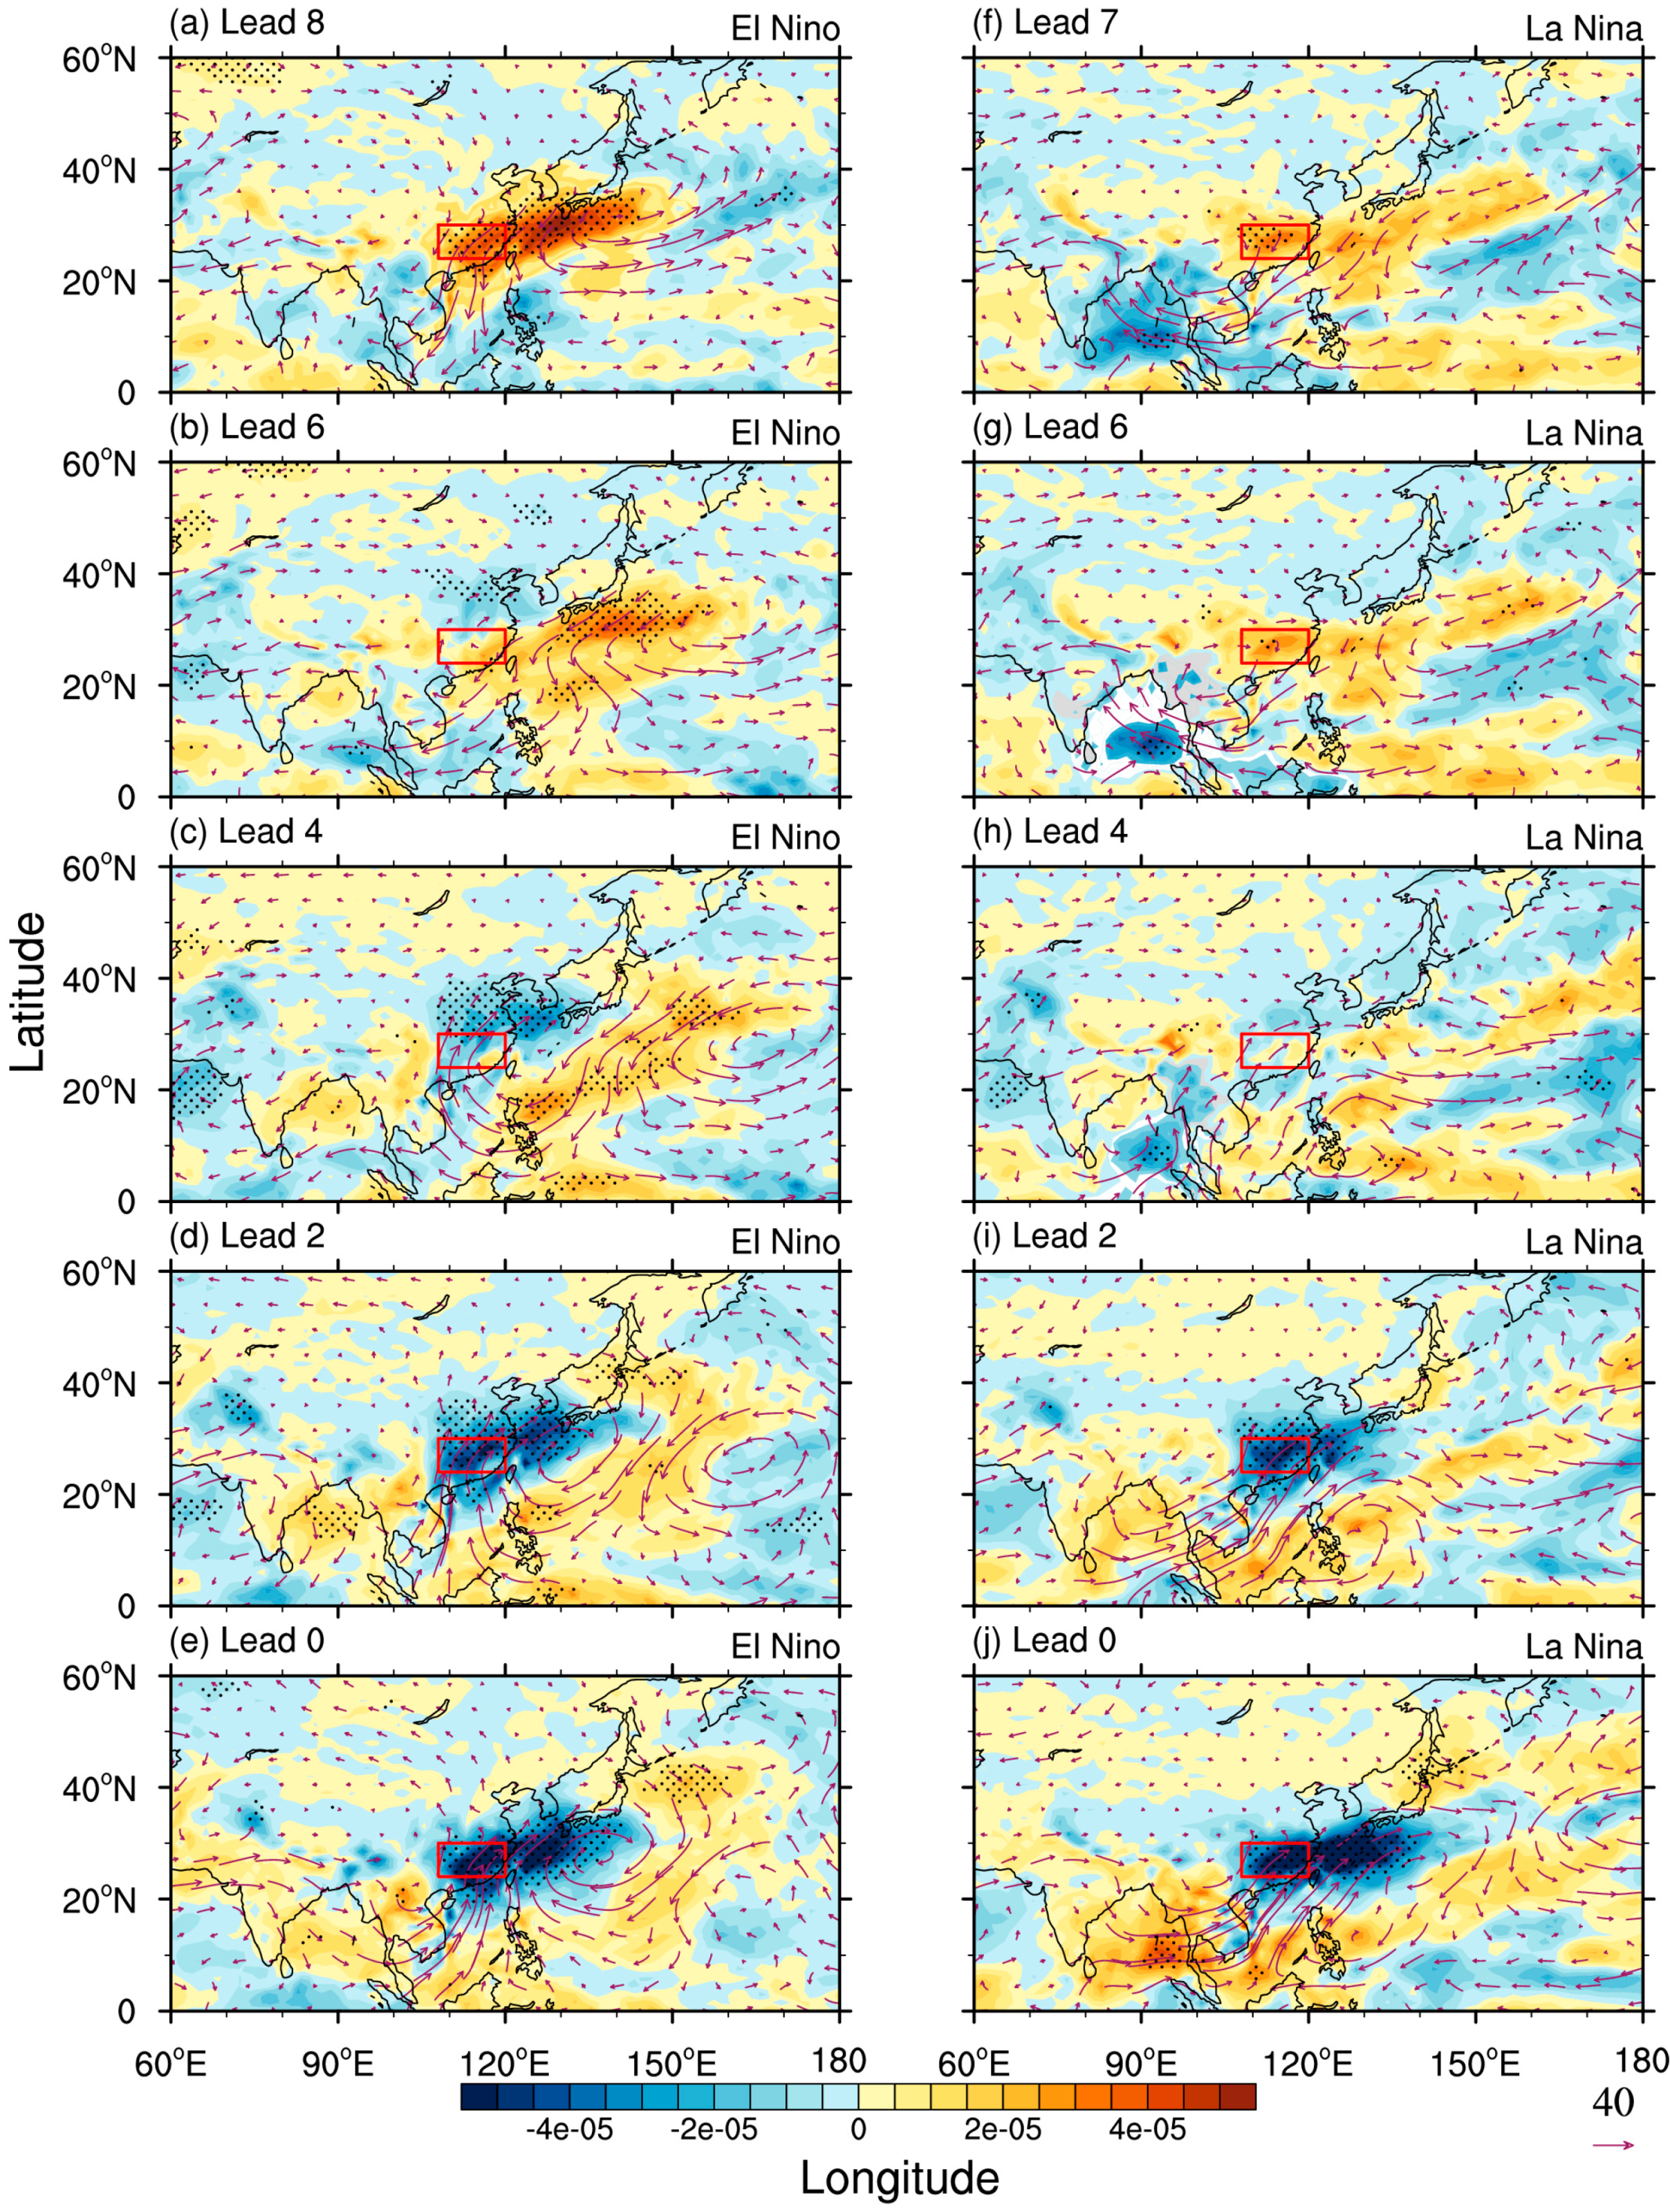
The interaction of intraseasonal vorticity and background wind are the biggest contributions to the vorticity advection. Similar to the background temperature, the distribution of background wind also has no variety during both El Niño and La Niña. Essentially, westerly winds prevail in the north of the subtropics with a stationary cyclonic circulation. The intraseasonal vorticity is largely determined by intraseasonal wind, which manifests as a meridional structure in El Niño and a zonal pattern in La Niña (Figure 10). The intraseasonal winds and vorticity at 500 hPa are consistent with the 1000 hPa intraseasonal low-pressure system. The zonal distribution of the intraseasonal vorticity and the background meridional wind behind the East Asia trough, bring positive vorticity advection and lead to 1000 hPa intraseasonal low-pressure system to move southward.

4. Conclusions

The intraseasonal oscillation of the winter precipitation in southern China and its differences between different phases of ENSO events were studied. The results indicate that precipitation centers are located in southern China during winter, and the winter precipitation is mainly controlled by the quasi-biweekly oscillation (10–30 day) from 1979/1980 to 2012/2013. There is a significantly positive correlation between the intraseasonal precipitation oscillation strength over southern China and SST in central and eastern tropical Pacific. Compared with that during La Niña, there is more precipitation in the active period of intraseasonal oscillation with a longer cycle in winter during El Niño years.
During El Niño winters, the north of Lake Baikal and the east of the Aral Sea both have intraseasonal low-pressure systems at 1000 hPa. Subsequently, those two intraseasonal low-pressure systems merge and strengthen at −6 day, and then move southeastward to reach southern China. However, only one intraseasonal low-pressure system affects precipitation over the Central Siberian Plateau (higher latitude) and moves southward into southern China in La Niña.
In an El Niño winter, the spatial distributions of 10–30 day wind features stronger meridional distribution. In Asia it is controlled by two huge opposite circulation systems and a turbulent titled airflow lies at the boundary between those two systems. Accompanied by the precipitation, the flow veers from north-by-west to south-by-east effecting heat transmission between low and high latitudes and making a great contribution to the explosive development of the low-pressure system and its propagation. In an La Niña winter, intraseasonal wind has a quasi-zonal distribution. The energy exchange between low and high latitude is weaker. The differences that lead to the low-pressure system are mainly caused by the joint effects of thermal and dynamic factors in El Niño, while only dynamic factors accounting for the dominant status in La Niña.

Author Contributions

S.Y. designed this study and took part in discussions. Q.T. contributed to data analysis and drafting the manuscript.

Funding

National Key R&D Program of China (2016YFA0600402); National 973 Project (Grant 2015CB453200); Priority Academic Program Development of Jiangsu Higher Education Institutions (PAPD).

Acknowledgments

Conflicts of Interest

The authors declare that there are no conflicts of interest regarding the publication of this paper.

References

  1. Madden, R.A.; Julian, P.R. Detection of a 40–50 Day Oscillation in the Zonal Wind in the Tropical Pacific. J. Atmos. Sci. 1971, 28, 702–708. [Google Scholar] [CrossRef] [Green Version]
  2. Madden, R.A. Description of global-scale circulation cells in the tropics with a 40–50 day period. J. Atmos. Sci. 1972, 29, 1109–1123. [Google Scholar] [CrossRef]
  3. Nakazawa, T. Tropical Super Clusters within Intraseasonal Variations over the Western Pacific. J. Meteorol. Soc. Jpn. 1988, 66, 823–839. [Google Scholar] [CrossRef] [Green Version]
  4. Chongyin, L.; Peili, W. A further inquiry on 30–60 day oscillation in tropical atmosphere. Acta Meteorol. Sin. 1990, 5, 525–535. [Google Scholar] [CrossRef]
  5. Wang, B.; Webster, P.; Kikuchi, K.; Yasunari, T.; Qi, Y. Boreal summer quasi-monthly oscillation in the global tropics. Clim. Dyn. 2006, 27, 661–675. [Google Scholar] [CrossRef]
  6. Wang, B.; Liu, F.; Chen, G. A trio-interaction theory for Madden–Julian oscillation. Geosci. Lett. 2016, 3, 34. [Google Scholar] [CrossRef]
  7. Anderson, J.R.; Rosen, R.D. The latitude-height structure of 40–50 day variations in atmospheric angular momentum. J. Atmos. Sci. 1983, 40, 1584–1591. [Google Scholar] [CrossRef]
  8. Kikuchi, K.; Wang, B. Global perspective of the quasi-biweekly oscillation. J. Clim. 2009, 22, 1340–1359. [Google Scholar] [CrossRef]
  9. Yang, S.; Wu, B.; Zhang, R.; Zhou, S. Relationship between an abrupt drought-flood transition over mid-low reaches of the Yangtze River in 2011 and the intraseasonal oscillation over mid-high latitudes of East Asia. Acta Meteorol. Sin. 2013, 27, 129–143. [Google Scholar] [CrossRef]
  10. Yang, S.; Wu, B.; Zhang, R.; Zhou, S. The zonal propagating characteristics of low-frequency oscillation over the Eurasian mid-high latitude in boreal summer. Sci. China Earth Sci. 2013, 56, 1566–1575. [Google Scholar] [CrossRef]
  11. Yang, S.; Tim, L. Intraseasonal variability of air temperature over the mid-high latitude Eurasia in boreal winter. Clim. Dyn. 2016, 47, 2155–2175. [Google Scholar] [CrossRef]
  12. Yang, H.; Li, C.-Y. The relation between atmospheric intra-seasonal oscillation and summer severe flood and drought in the Changjiang-Huaihe River Basin. Adv. Atmos. Sci. 2003, 20, 540–553. [Google Scholar]
  13. Liu, H.-B.; Zhang, D.-L.; Wang, B. Daily to submonthly weather and climate characteristics of the summer 1998 extreme rainfall over the Yangtze River Basin. J. Geophys. Res. 2008, 113, D22101. [Google Scholar] [CrossRef]
  14. Jing, Y.; Wang, B.; Wang, B.; Bao, Q. Biweekly and 21–30-day variations of the subtropical summer monsoon rainfall over the lower reach of the Yangtze River basin. J. Clim. 2010, 23, 1146–1159. [Google Scholar] [CrossRef]
  15. Chongyin, L.; Guilong, L. Evolution of Intraseasonal Oscillation over the Tropical Western Pacific/South China Sea and Its Effect to the Summer Precipitation in Southern China. Adv. Atmos. Sci. 1997, 14, 246–254. [Google Scholar] [CrossRef]
  16. Yang, Q.M. The 20–30-day oscillation of the global circulation and heavy precipitation over the lower reaches of the Yangtze River valley. Sci. China 2009, 52, 1485–1501. [Google Scholar] [CrossRef]
  17. Yuan, Y.; Chongyin, L.; Song, Y. Decadal anomalies of winter precipitation over southern China in association with El Niño and La Niña. J. Meteorol. Res. 2014, 28, 91–110. [Google Scholar] [CrossRef]
  18. Chen, Y.; Zhai, P. Simultaneous modulations of precipitation and temperature extremes in Southern parts of China by the boreal summer intraseasonal oscillation. Clim. Dyn. 2017, 49, 3363–3381. [Google Scholar] [CrossRef]
  19. Rocheta, E.; Evans, J.P.; Sharma, A. Can Bias Correction of Regional Climate Model Lateral Boundary Conditions Improve Low-Frequency Rainfall Variability? J. Clim. 2017, 30, 9785–9806. [Google Scholar] [CrossRef]
  20. Wu, B.; Zhou, T.; Li, T. Atmospheric Dynamic and Thermodynamic Processes Driving the Western North Pacific Anomalous Anticyclone during El Niño. Part I: Maintenance Mechanisms. J. Clim. 2017, 30, 9621–9635. [Google Scholar] [CrossRef]
  21. Wu, B.; Zhou, T.; Li, T. Atmospheric Dynamic and Thermodynamic Processes Driving the Western North Pacific Anomalous Anticyclone during El Niño. Part II: Formation Processes. J. Clim. 2017, 30, 9637–9650. [Google Scholar] [CrossRef]
  22. Eichler, T.; Higgins, W. Climatology and ENSO-Related Variability of North American Extratropical Cyclone Activity. J. Clim. 2006, 19, 2076–2093. [Google Scholar] [CrossRef]
  23. Karori, M.A.; Li, J.; Jin, F.F. The Asymmetric Influence of the Two Types of El Niño and La Niña on Summer Rainfall over Southeast China. J. Clim. 2013, 26, 4567–4582. [Google Scholar] [CrossRef]
  24. Wang, C.; Wang, X. Classifying El Niño Modoki I and II by Different Impacts on Rainfall in Southern China and Typhoon Tracks. J. Clim. 2013, 26, 1322–1338. [Google Scholar] [CrossRef]
  25. Zhang, Q.; Li, J.; Singh, V.P.; Xu, C.Y.; Deng, J. Influence of ENSO on precipitation in the East River basin, south China. J. Geophys. Res. Atmos. 2013, 118, 2207–2219. [Google Scholar] [CrossRef] [Green Version]
  26. Liu, J.; Wang, H.; Lu, E.; Kumar, A. Decadal modulation of East China winter precipitation by ENSO. Clim. Dyn. 2016, 1–15. [Google Scholar] [CrossRef]
  27. Zhai, P.; Zhang, X.; Wan, H.; Pan, X. Trends in Total Precipitation and Frequency of Daily Precipitation Extremes over China. J. Clim. 2005, 18, 1096–1108. [Google Scholar] [CrossRef]
  28. Zhang, W.; Jin, F.F.; Turner, A. Increasing autumn drought over southern China associated with ENSO regime shift. Geophys. Res. Lett. 2014, 41, 4020–4026. [Google Scholar] [CrossRef] [Green Version]
  29. Zhu, Z.; Li, T.; He, J. Out-of-Phase Relationship between Boreal Spring and Summer Decadal Rainfall Changes in Southern China. J. Clim. 2014, 27, 1083–1099. [Google Scholar] [CrossRef]
  30. Dee, D.P.; Uppala, S.M.; Simmons, A.J.; Berrisford, P.; Poli, P.; Kobayashi, S.; Bechtold, P. The ERA-Interim reanalysis: Configuration and performance of the data assimilation system. Q. J. R. Meteorol. Soc. 2011, 137, 553–597. [Google Scholar] [CrossRef]
  31. Rayner, N.A.; Parker, D.E.; Horton, E.B.; Folland, C.K.; Alexander, L.V.; Rowell, D.P.; Kent, E.C.; Kaplan, A. Global analyses of sea surface temperature, sea ice, and night marine air temperature since the late nineteenth century. J. Geophys. Res. 2003, 108, 4407. [Google Scholar] [CrossRef]
  32. Holton, J. An Introduction to Dynamic Meteorology; Academic Press: New York, NY, USA, 2004. [Google Scholar]
  33. Chang, E.K.M.; Song, S. The Seasonal Cycles in the Distribution of Precipitation around Cyclones in the Western North Pacific and Atlantic. J. Atmos. Sci. 2006, 63, 815–839. [Google Scholar] [CrossRef]
  34. Chang, E.K.M.; Zheng, C.; Lanigan, P.; Yau, A.M.; Neelin, J.D. Significant modulation of variability and projected change in California winter precipitation by extratropical cyclone activity. Geophys. Res. Lett. 2015, 42, 5983–5991. [Google Scholar] [CrossRef] [Green Version]
  35. Zhang, R. Relations of Water Vapor Transport from Indian Monsoon with That over East Asia and the Summer Rainfall in China. Adv. Atmos. Sci. 2001, 18, 1005–1017. [Google Scholar]
  36. Zhou, T.J.; Yu, R.C. Atmospheric water vapor transport associated with typical anomalous summer rainfall patterns in China. J. Geophys. Res. Atmos. 2005, 110, 104. [Google Scholar] [CrossRef]
  37. Yao, S.-X.; Huang, Q.; Zhang, Y.-C.; Kuang, X.Y. A study on response of precipitation in China to monsoon intraseasonal oscillation. J. Trop. Meteorol. 2012, 18, 503–511. [Google Scholar]
Figure 1. The Oceanic Niño Index (ONI, °C) from 1979 to 2013.
Atmosphere 09 00406 g001
Figure 2. The mean square deviation of winter precipitation (mm/d) based on daily (a) ERA-interim reanalysis data and (b) Observation. (c) Interannual variability of mean square deviation from 1979 to 2012 (black line, ERA-interim; red dashed line, observation).
Atmosphere 09 00406 g002
Figure 3. (a) Power spectrum of winter precipitation over southern China from 1979/1980 to 2012/2013. The red dashed line is the red noise spectrum, and the green (blue) dashed line indicates values above the 95% (5%) confidence level. (b) Correlations between mean square deviations of intraseasonal (10–30 day) winter precipitation over southern China (24° N–30° N, 108°–120° E) and raw winter sea surface temperature (SST). The dotted areas are locally significant at the 95% level.
Atmosphere 09 00406 g003
Figure 4. (a) The frequency of precipitation intraseasonal oscillation events over southern China (24° N–30° N, 108°–120° E; solid line) and the mean value (dashed line) from the winter of 1979/1980 to 2012/2013. The red solid circle and blue solid circle mark the years of El Niño and La Niña, respectively. (b) Lead/lag compositions of intraseasonal precipitation over southern China during El Niño (red solid line) and La Niña (blue dashed line) years. The dotted markers are locally significant at the 90% level t-test.
Atmosphere 09 00406 g004
Figure 5. Lead compositions of the intraseasonal 1000 hPa geopotential height field (shaded, dagpm) by intraseasonal precipitation oscillation events for El Niño (ae) and La Niña (fj). The red marker shows the minimum central value of the low-pressure system (El Niño from −8 day to the peak day; La Niña from −7 day to the peak day). The red box represents southern China.
Atmosphere 09 00406 g005
Figure 6. The same as Figure 5, but for vertical integral of intraseasonal vapor flux (vector, kg · m 1 s 1 ) and its divergence (shaded, kg · m 2 s 1 ).
Atmosphere 09 00406 g006
Figure 7. Averaging process of the surface forecast equation by intraseasonal precipitation events for El Niño (red forward-slash) and La Niña (blue dot). The horizontal axis shows items in the Equation (1). The units for the first two items below are 10 4   d a g p m · s 1 and that for the last three items below are 10 4   K · s 1 · Pa .
Atmosphere 09 00406 g007
Figure 8. Averaging process of (a) vertically integrated temperature advection ( K · s 1 · Pa ) and (b) 500 hPa vorticity advection ( 10 9 s 2 ). The horizontal axis shows the interaction between wind and temperature (vorticity) at different time scales as shown in Equations (2) and (3).
Atmosphere 09 00406 g008
Figure 9. The same as Figure 5, but for background temperature (shaded, °C) and intraseasonal wind (vector, m · s 1 ) over 500 hPa.
Atmosphere 09 00406 g009
Figure 10. The same as Figure 5, but for intraseasonal vorticity (shaded, s 1 ) and background wind (vector, m/s) over 500 hPa.
Atmosphere 09 00406 g010

