Numerical Study on the Urban Ventilation in Regulating Microclimate and Pollutant Dispersion in Urban Street Canyon: A Case Study of Nanjing New Region, China


Abstract
1. Introduction
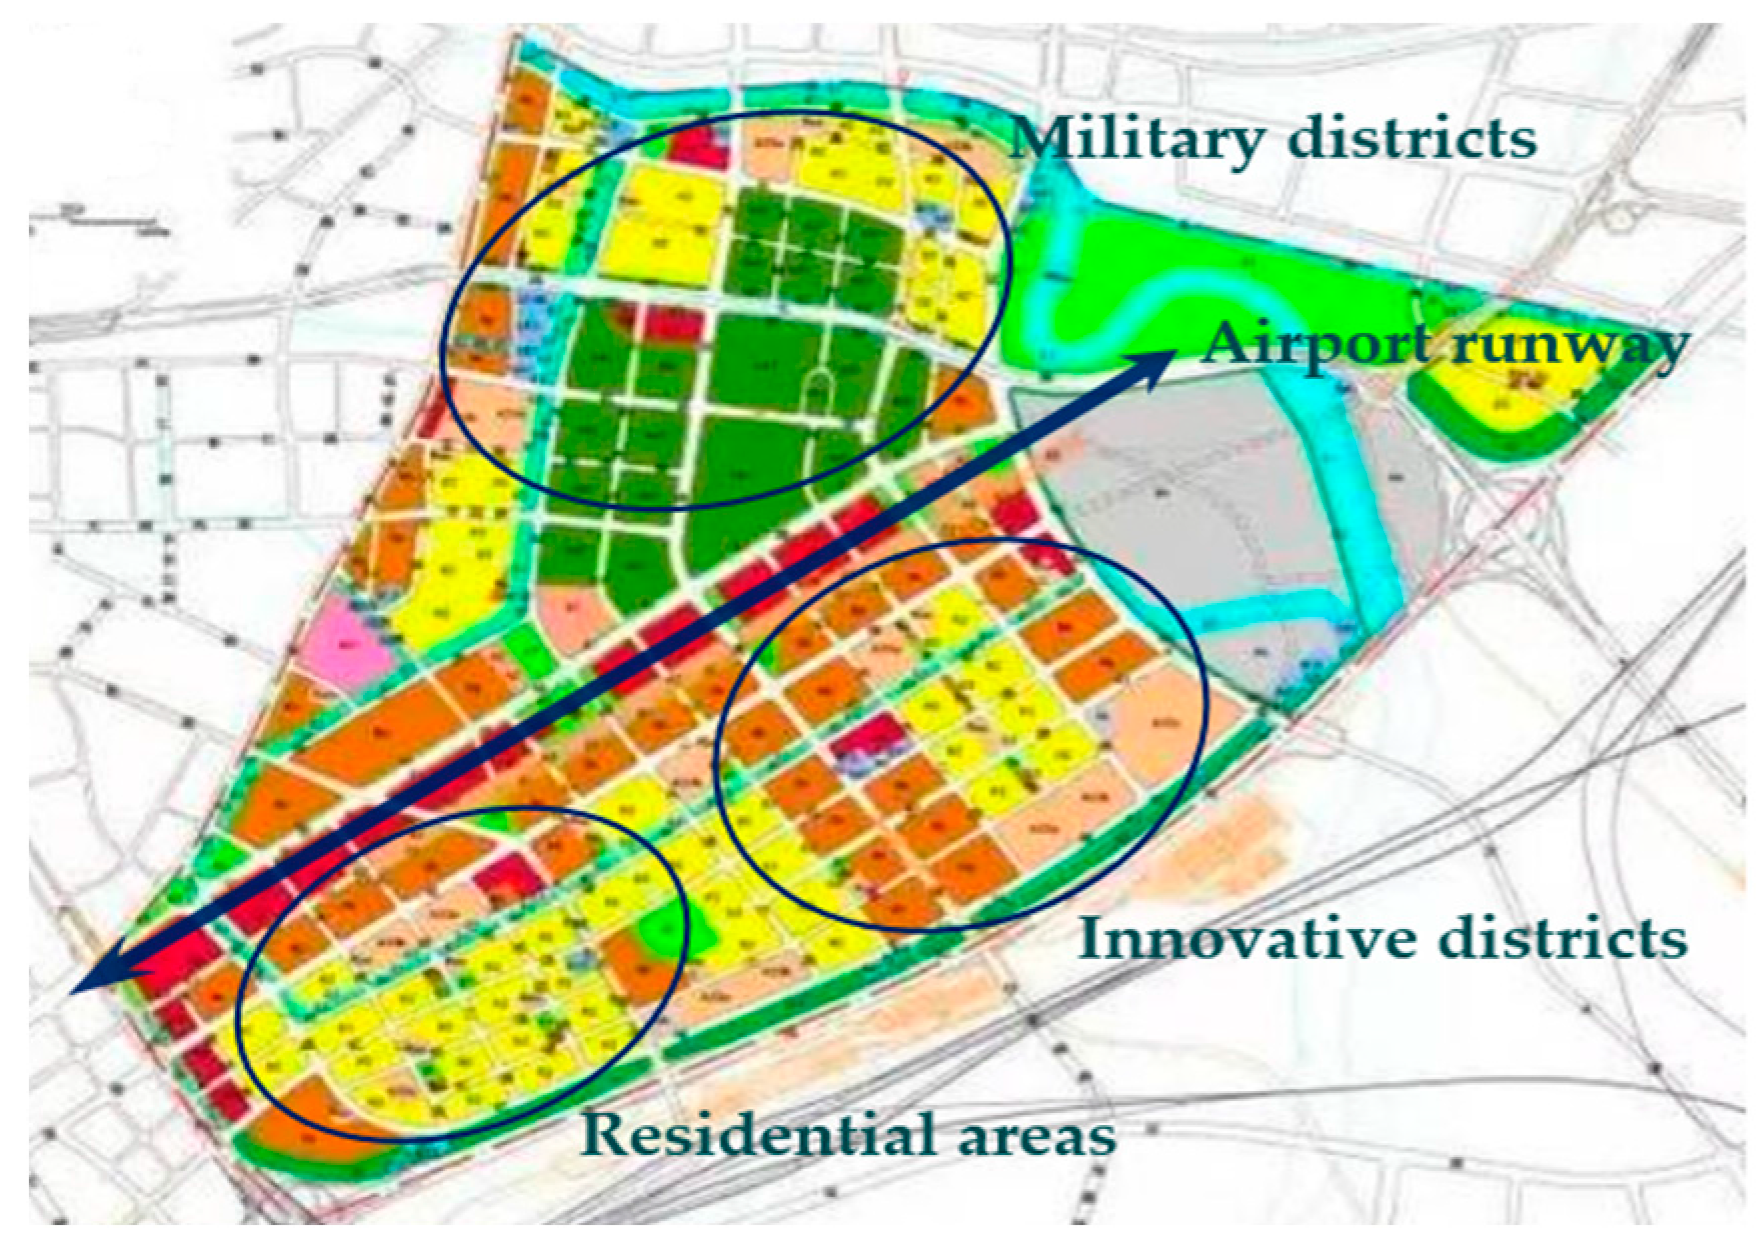
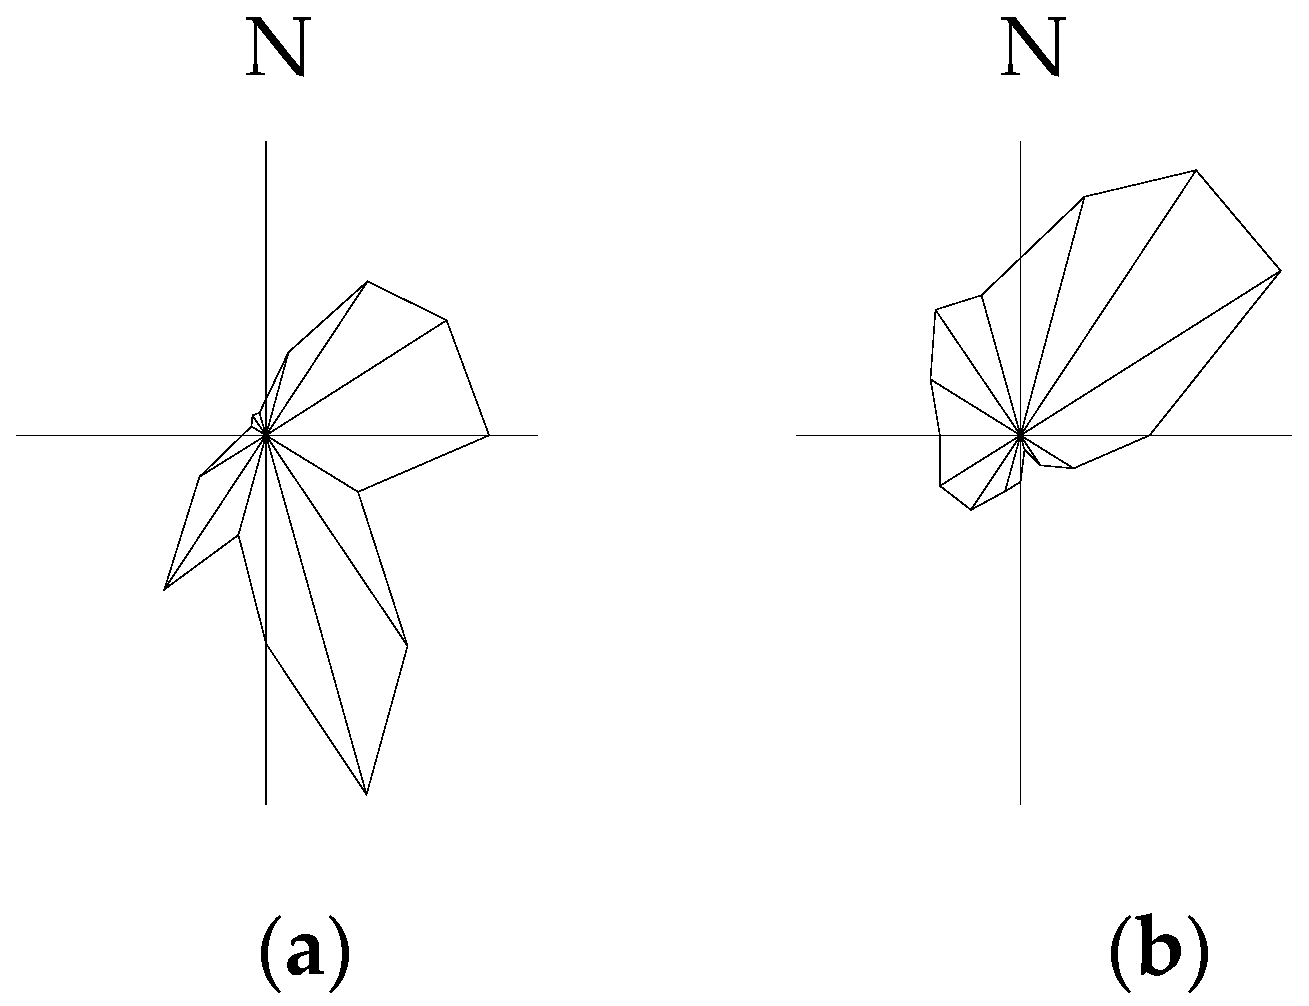
2. Study Case
3. Computational Settings and Parameters
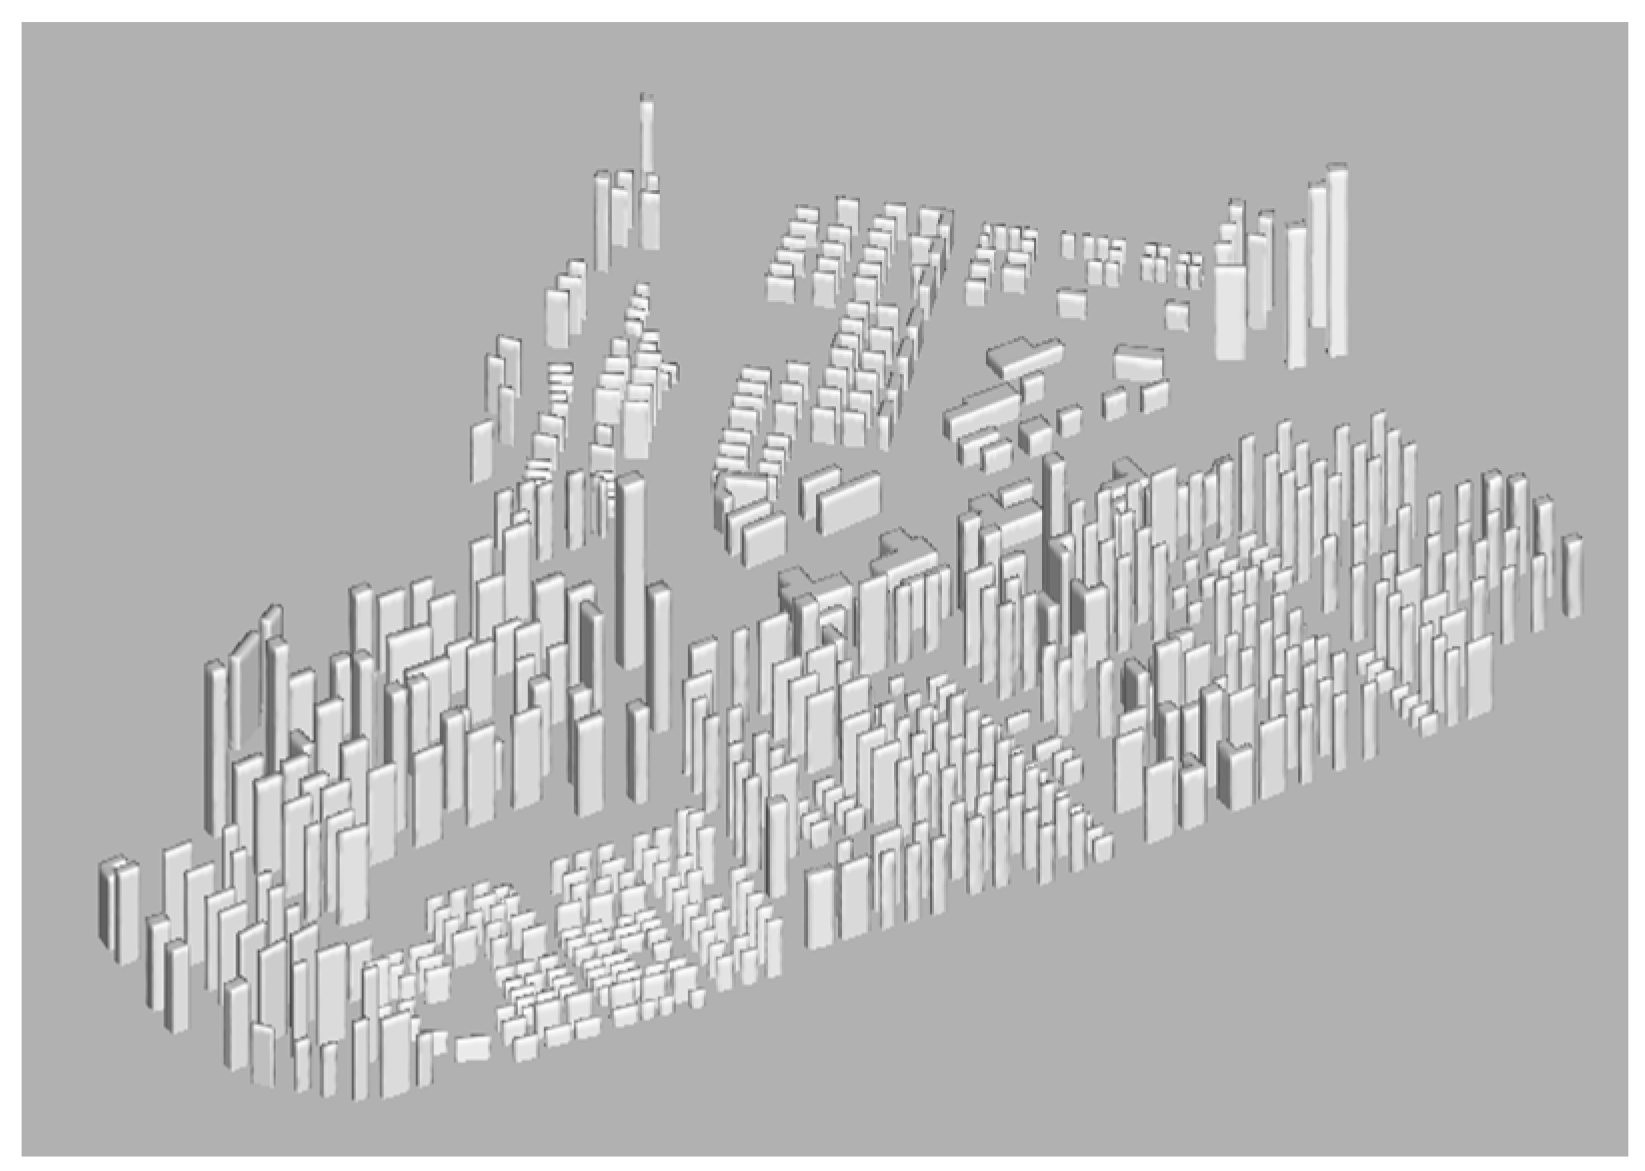
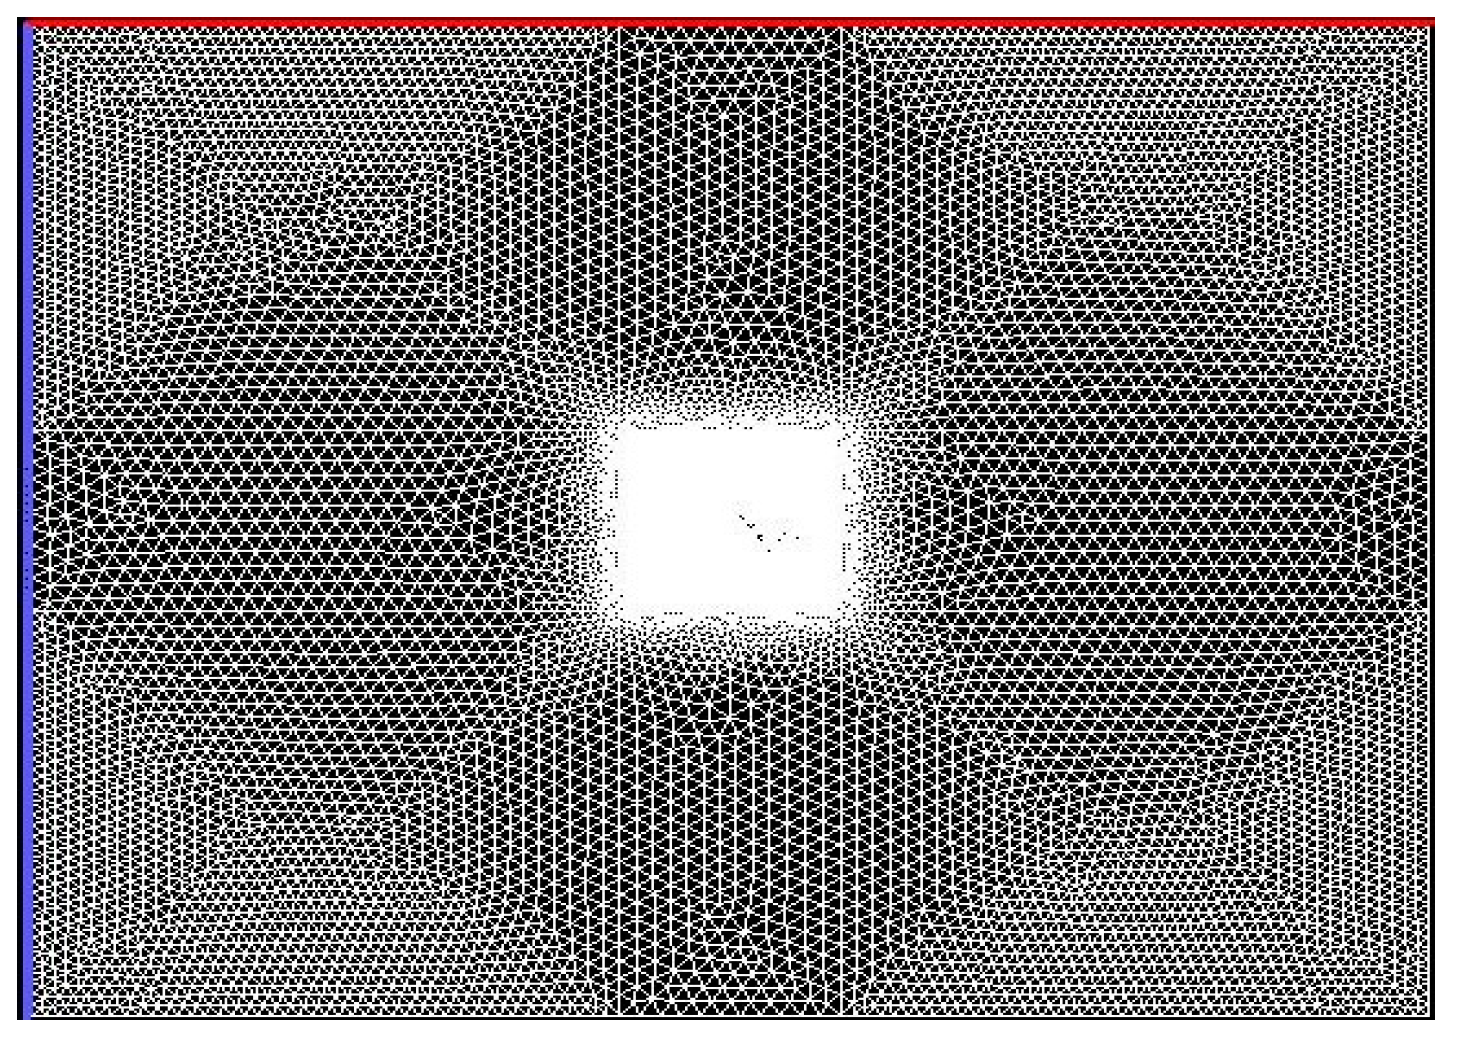
3.1. Geometric Model, Computational Domain and Meshing Generation
3.2. Methodology
3.3. Boundary Conditions and Solver Settings
4. Results and Discussion
4.1. Velocity and Temperature Distribution in the Street Canyon
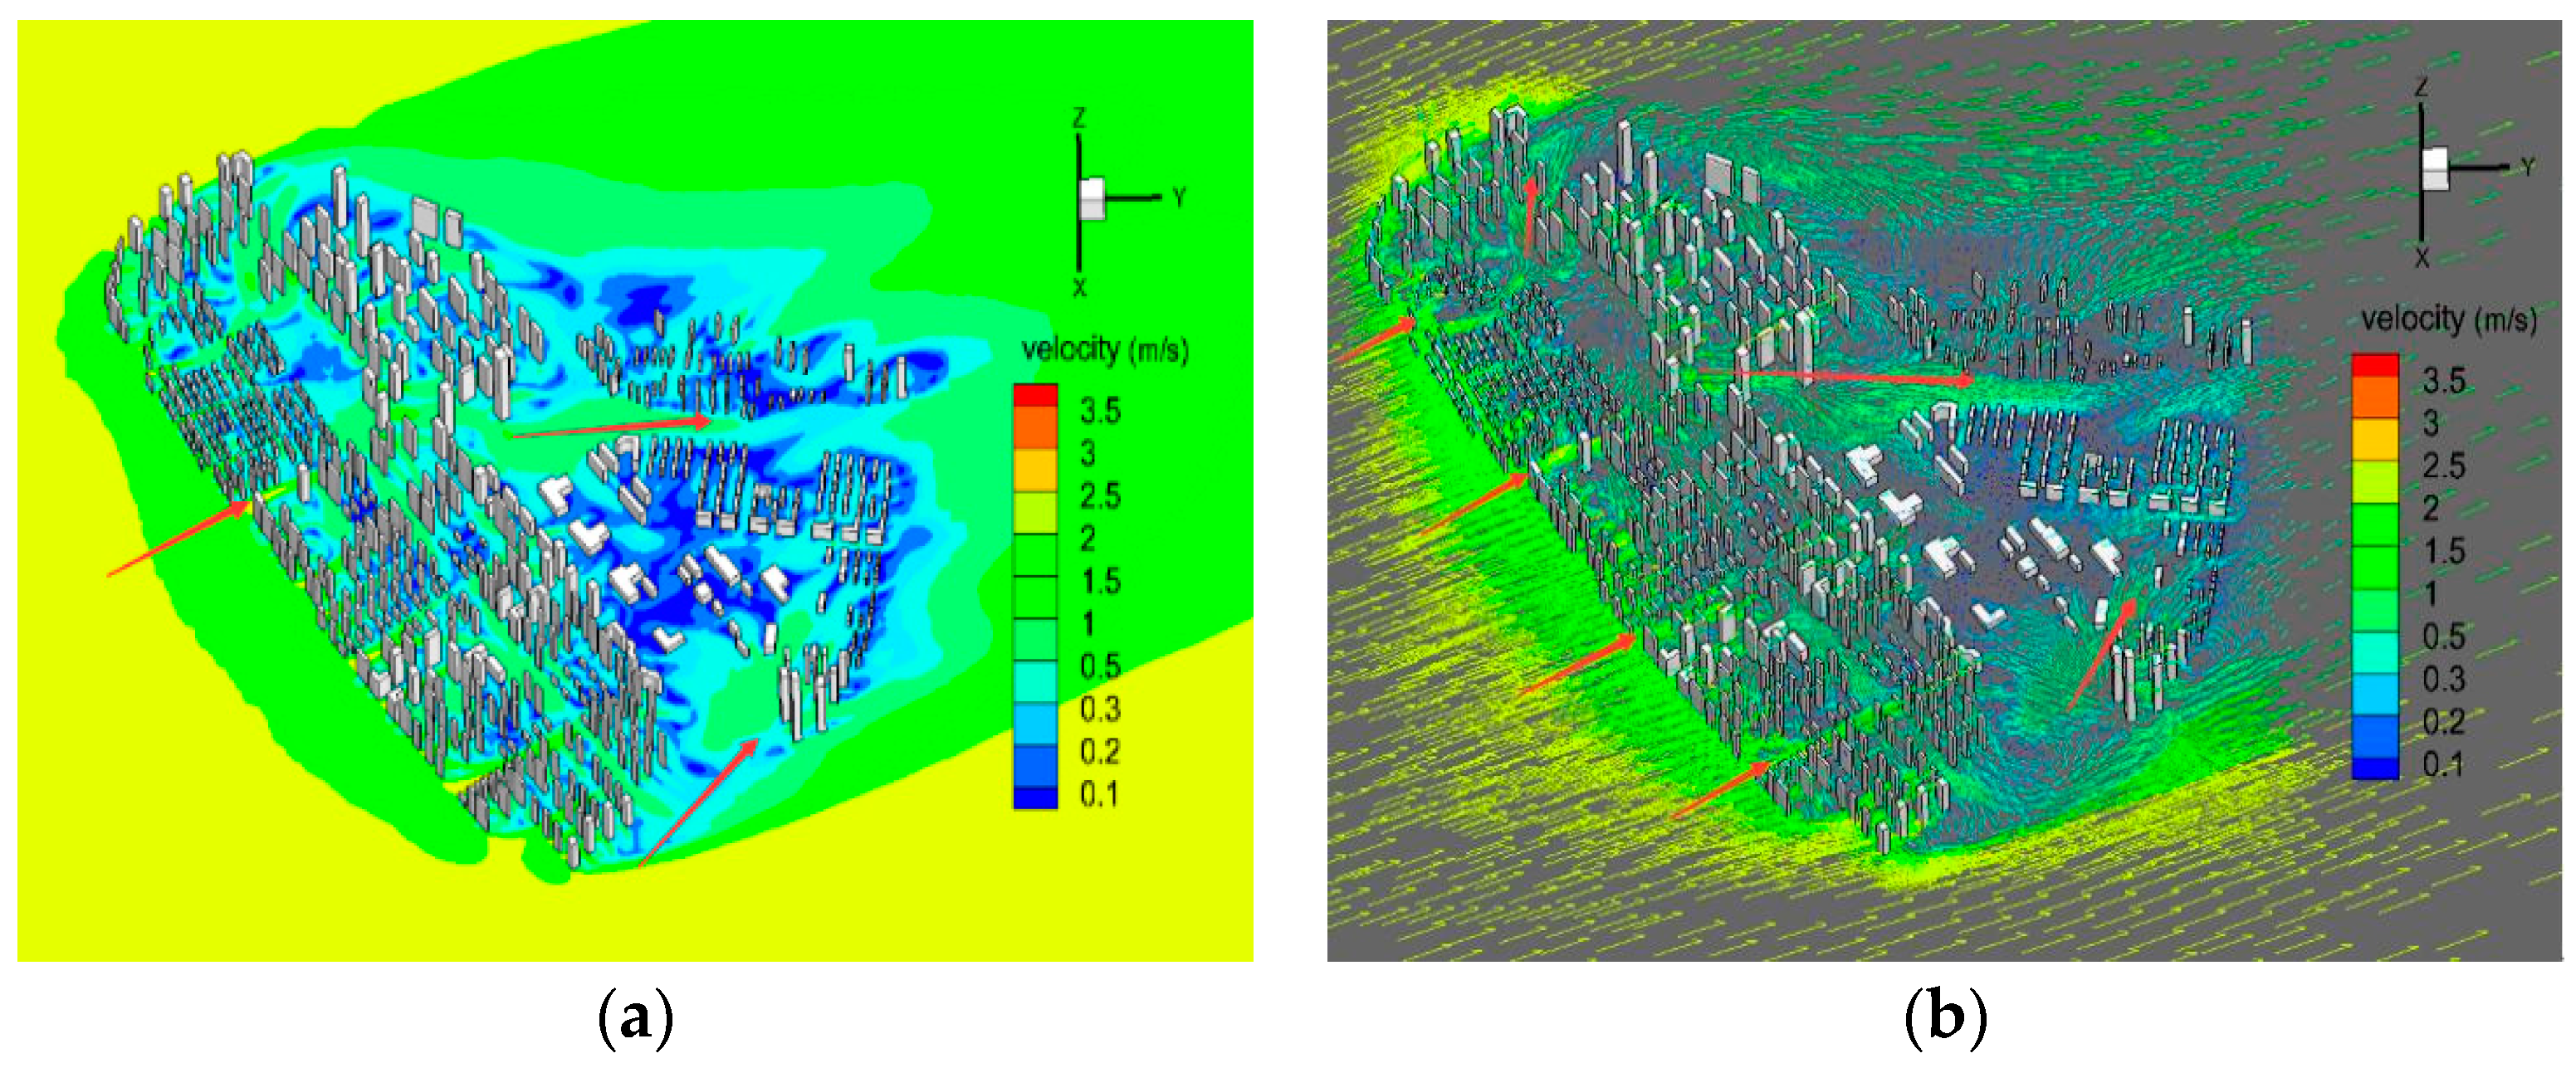
4.1.1. Velocity Distribution in the Perpendicular Prevailing Wind Direction
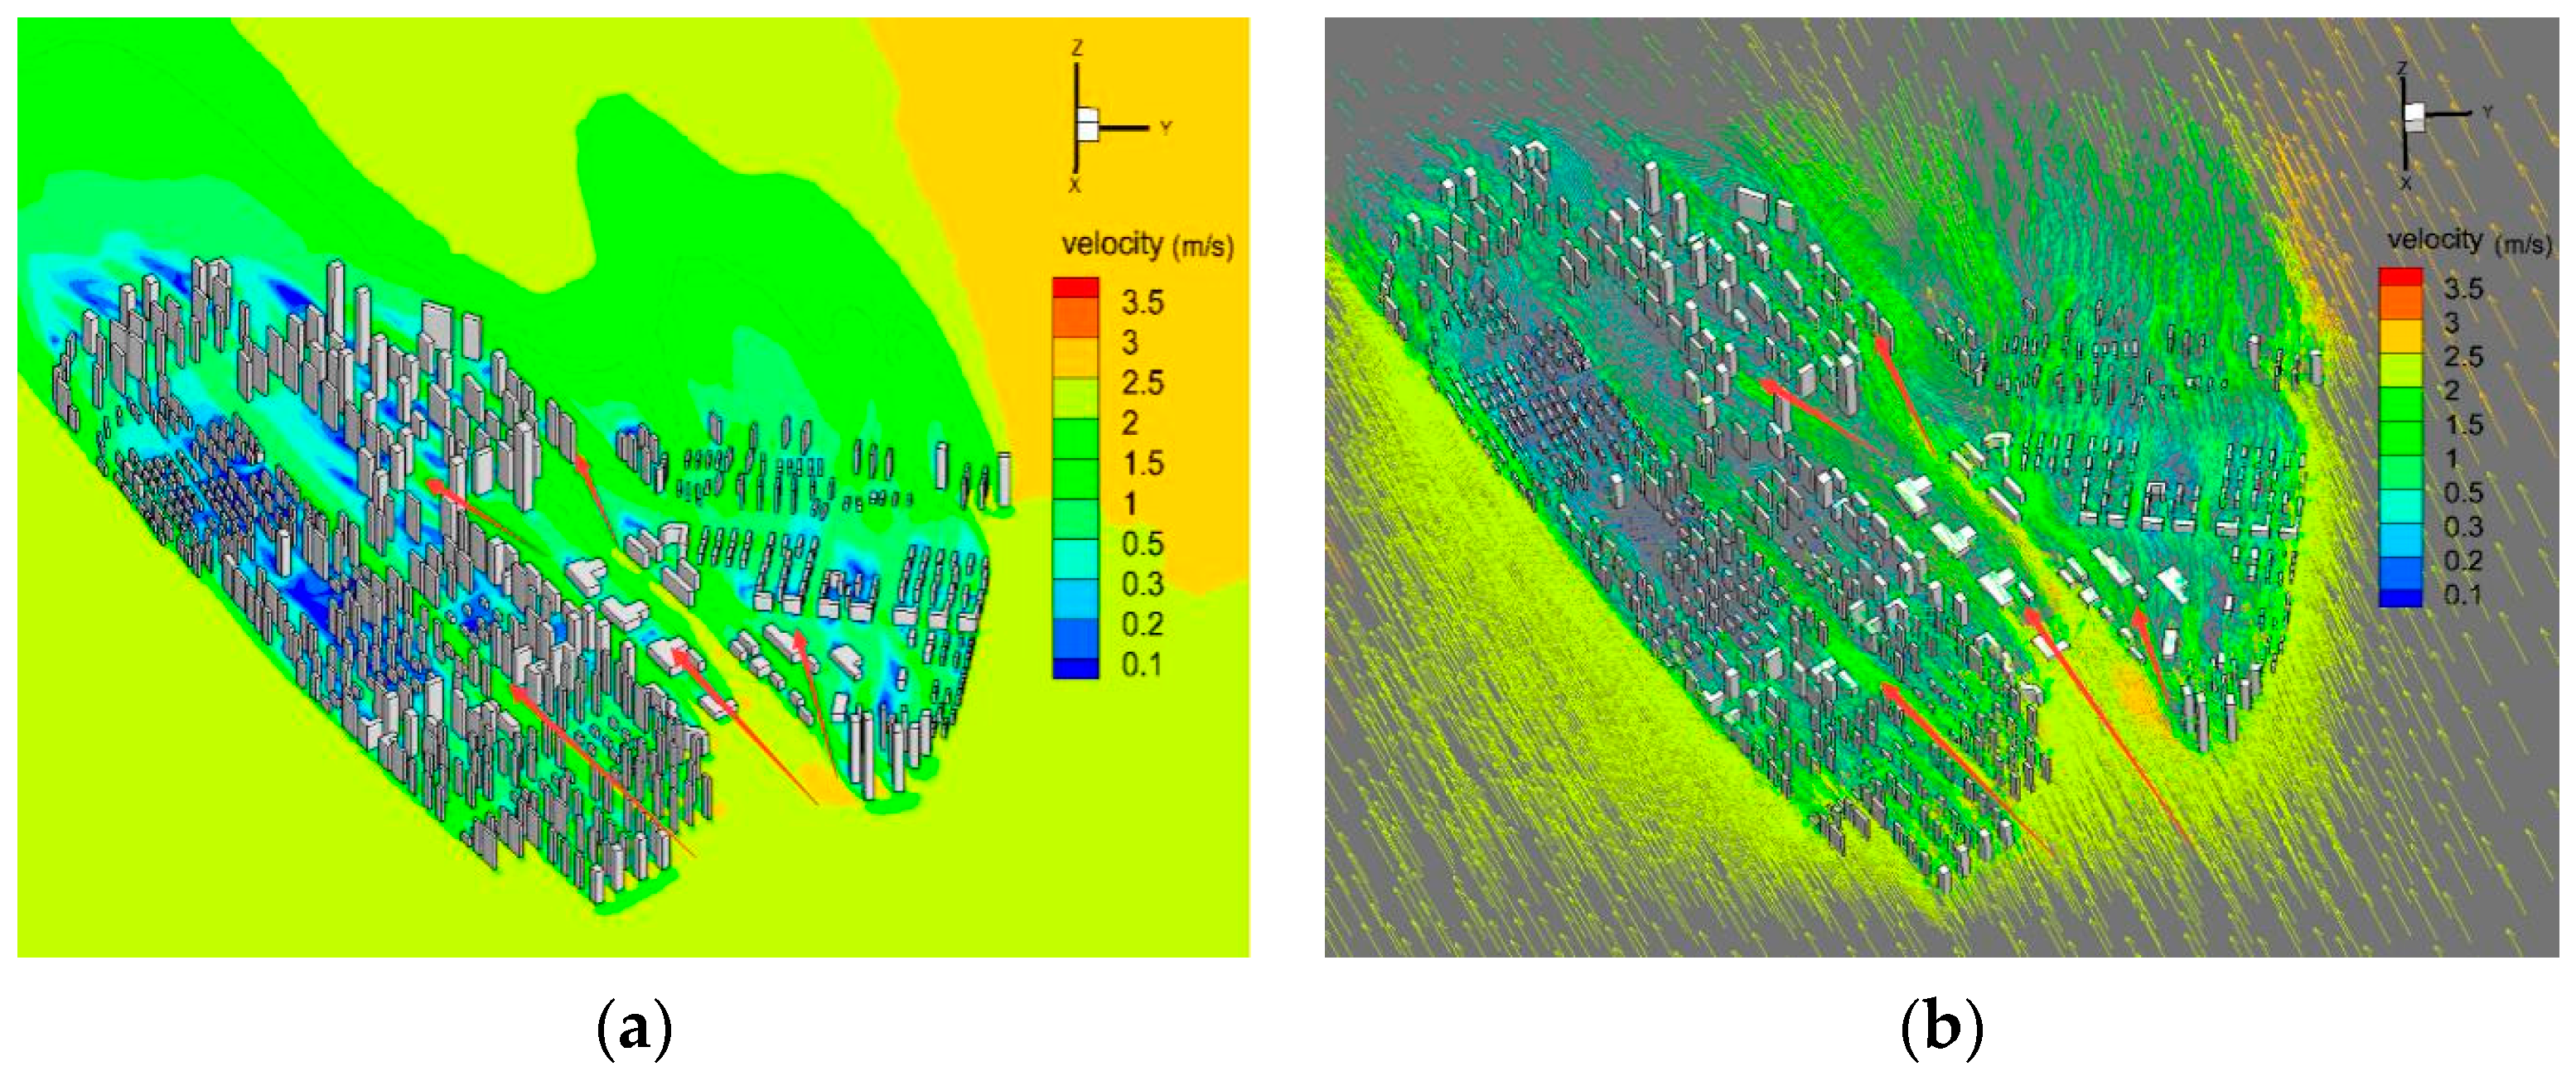
4.1.2. Velocity Distribution in the Parallel Prevailing Wind Direction
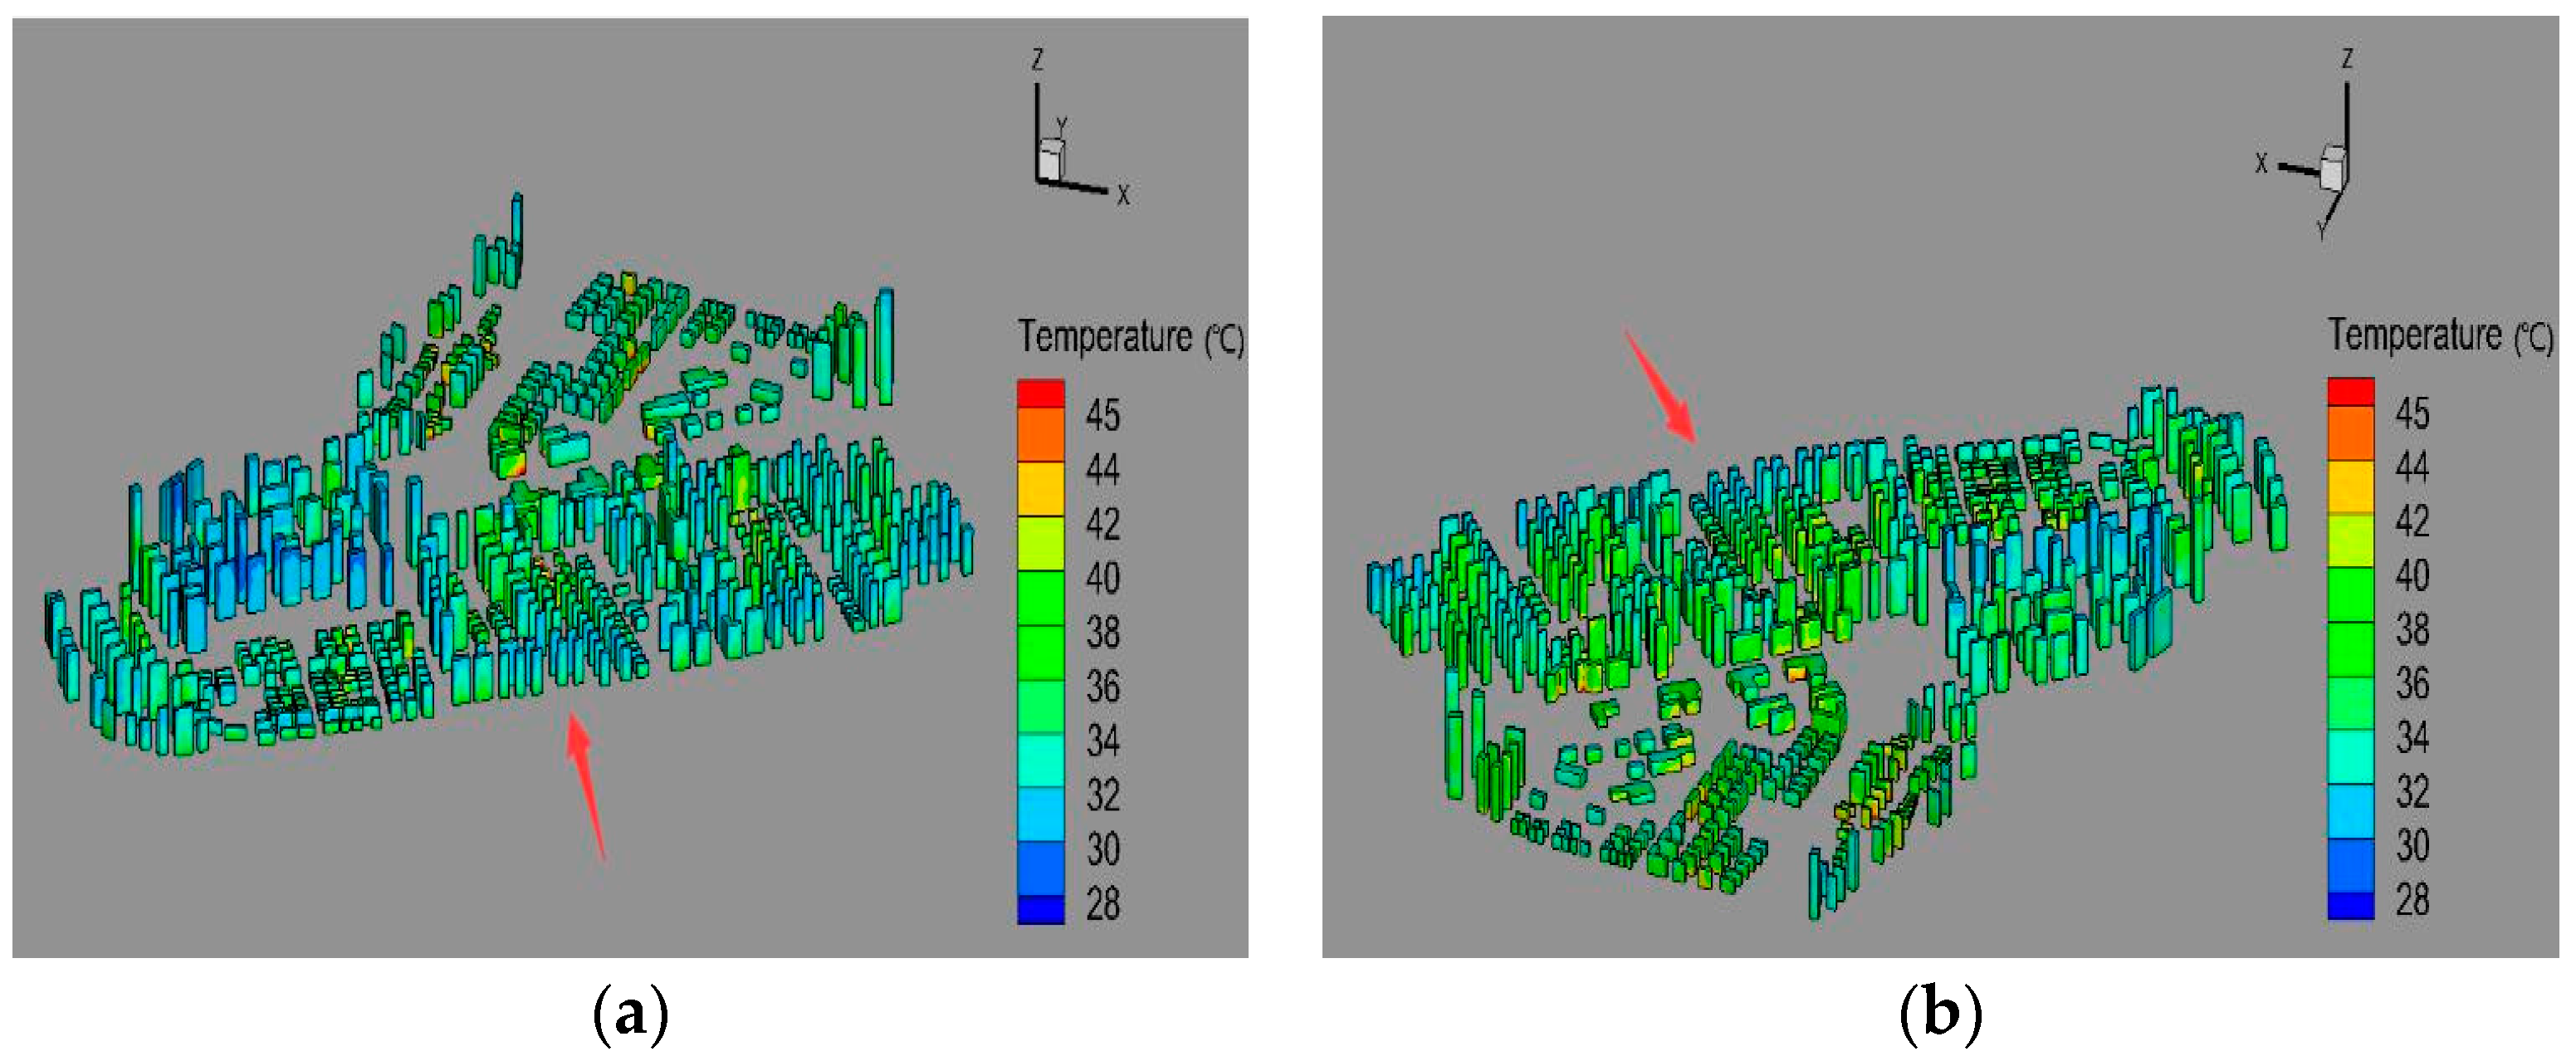
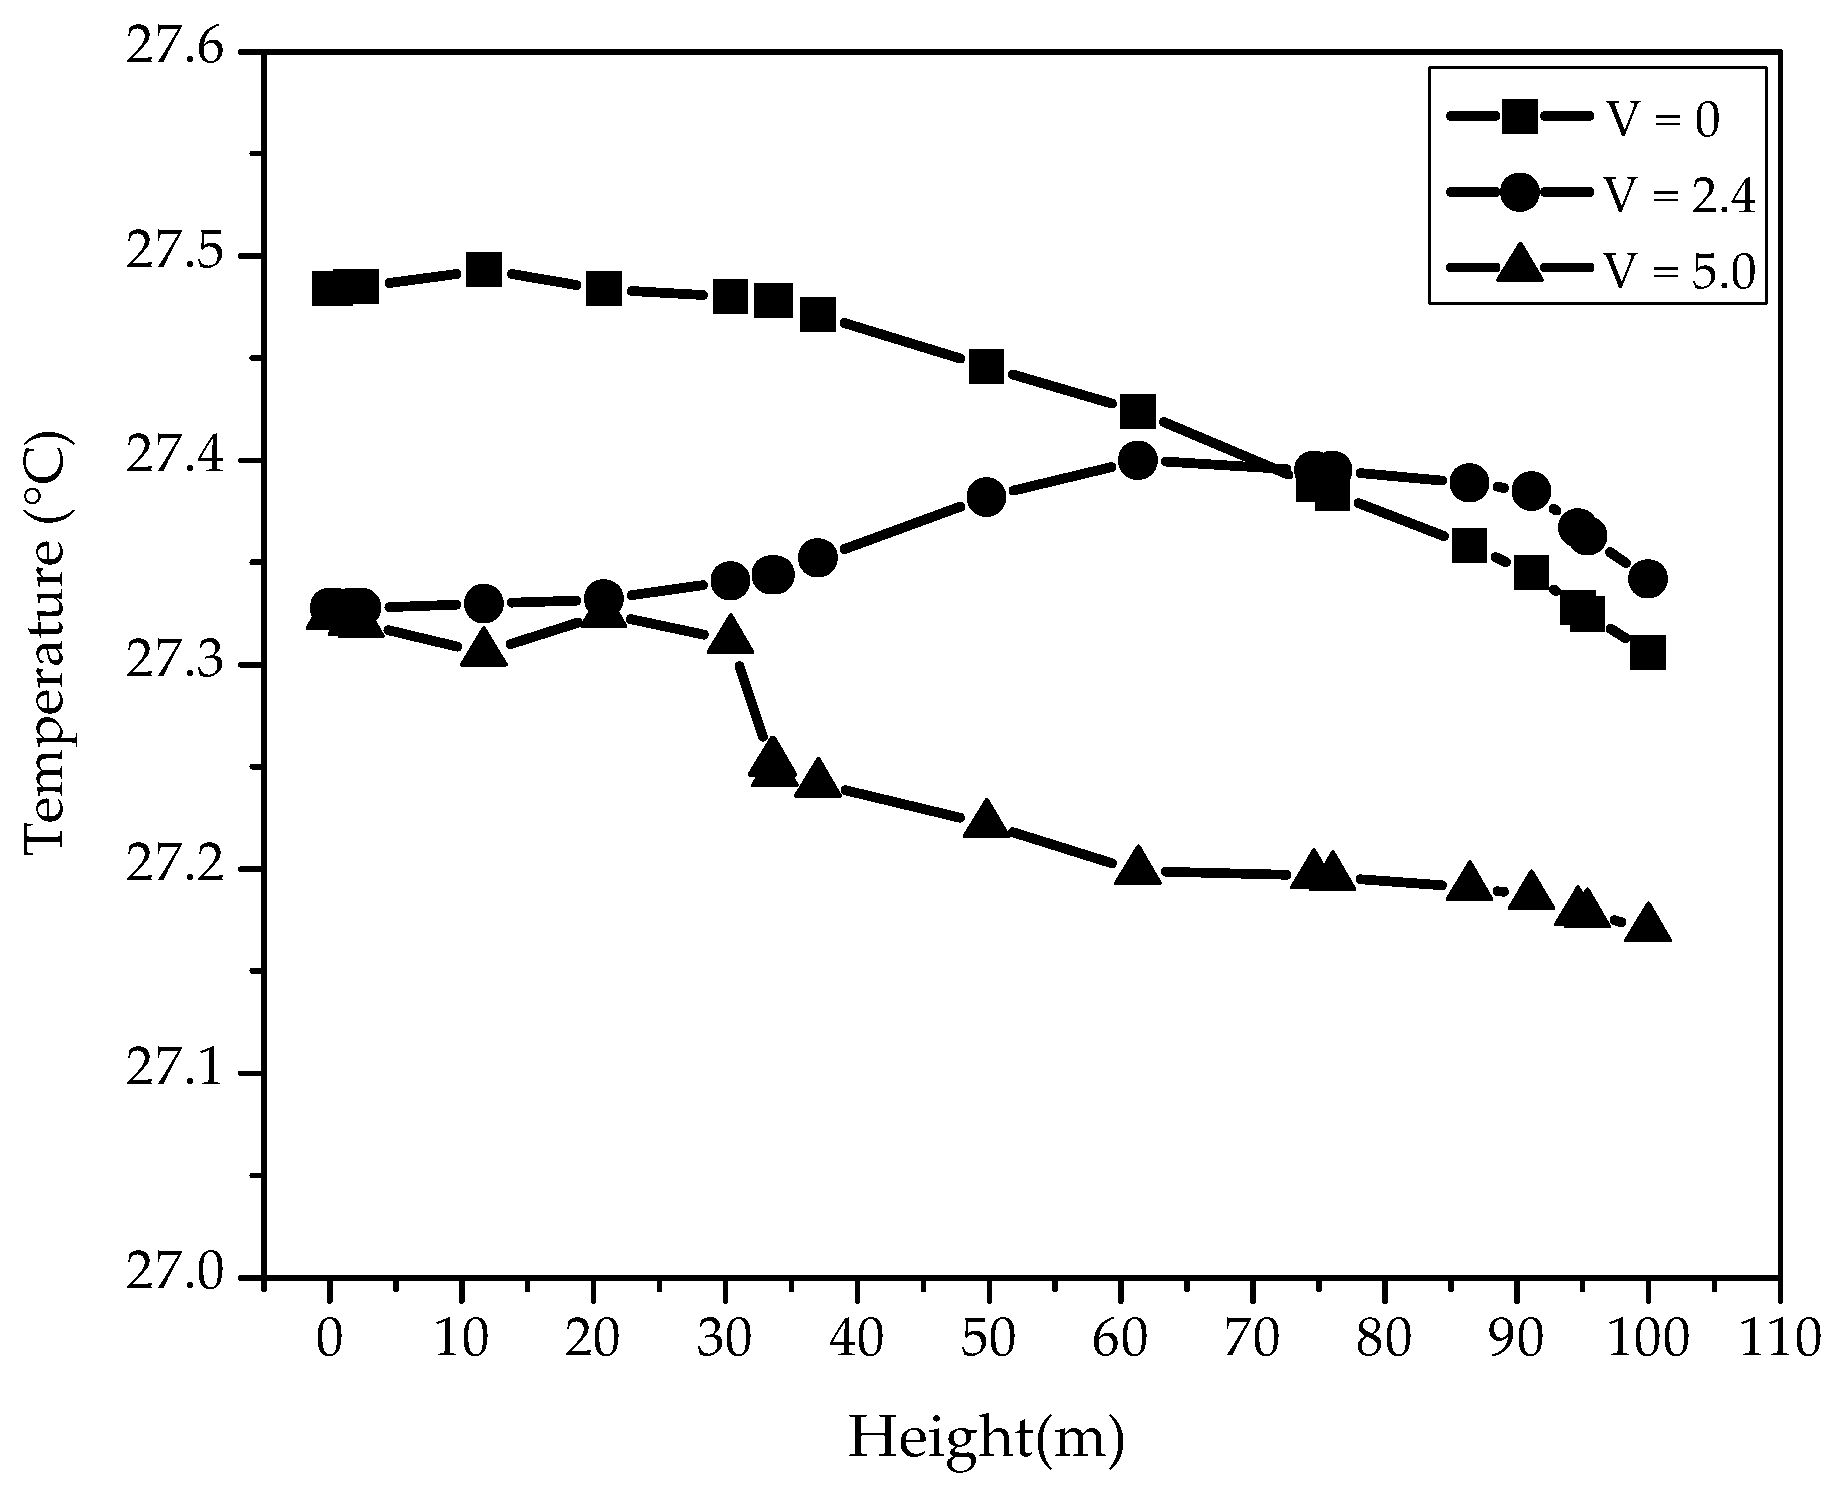
4.1.3. Temperature Distribution on Building Facades under the Ventilation in the Street Canyon
4.2. Outdoor Wind Speeds and Human Body Comfort
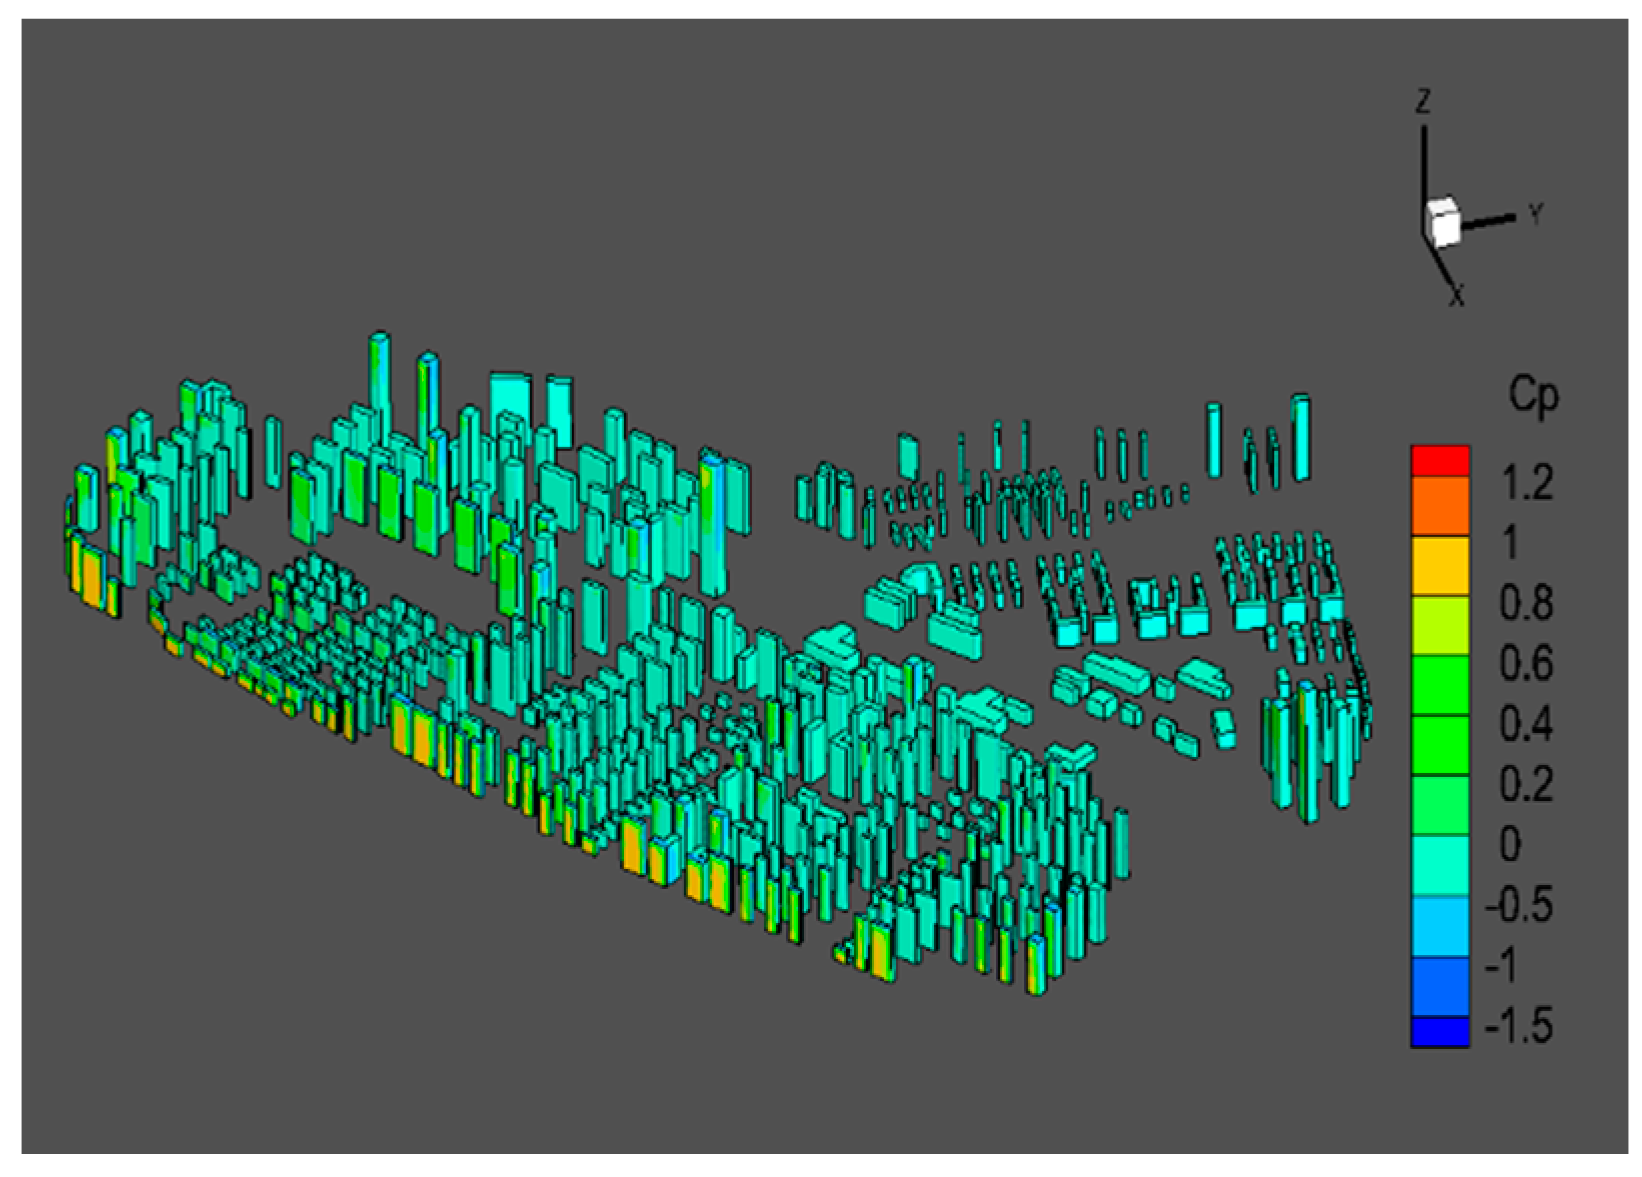
4.3. Wind Pressure on Building Envelopes
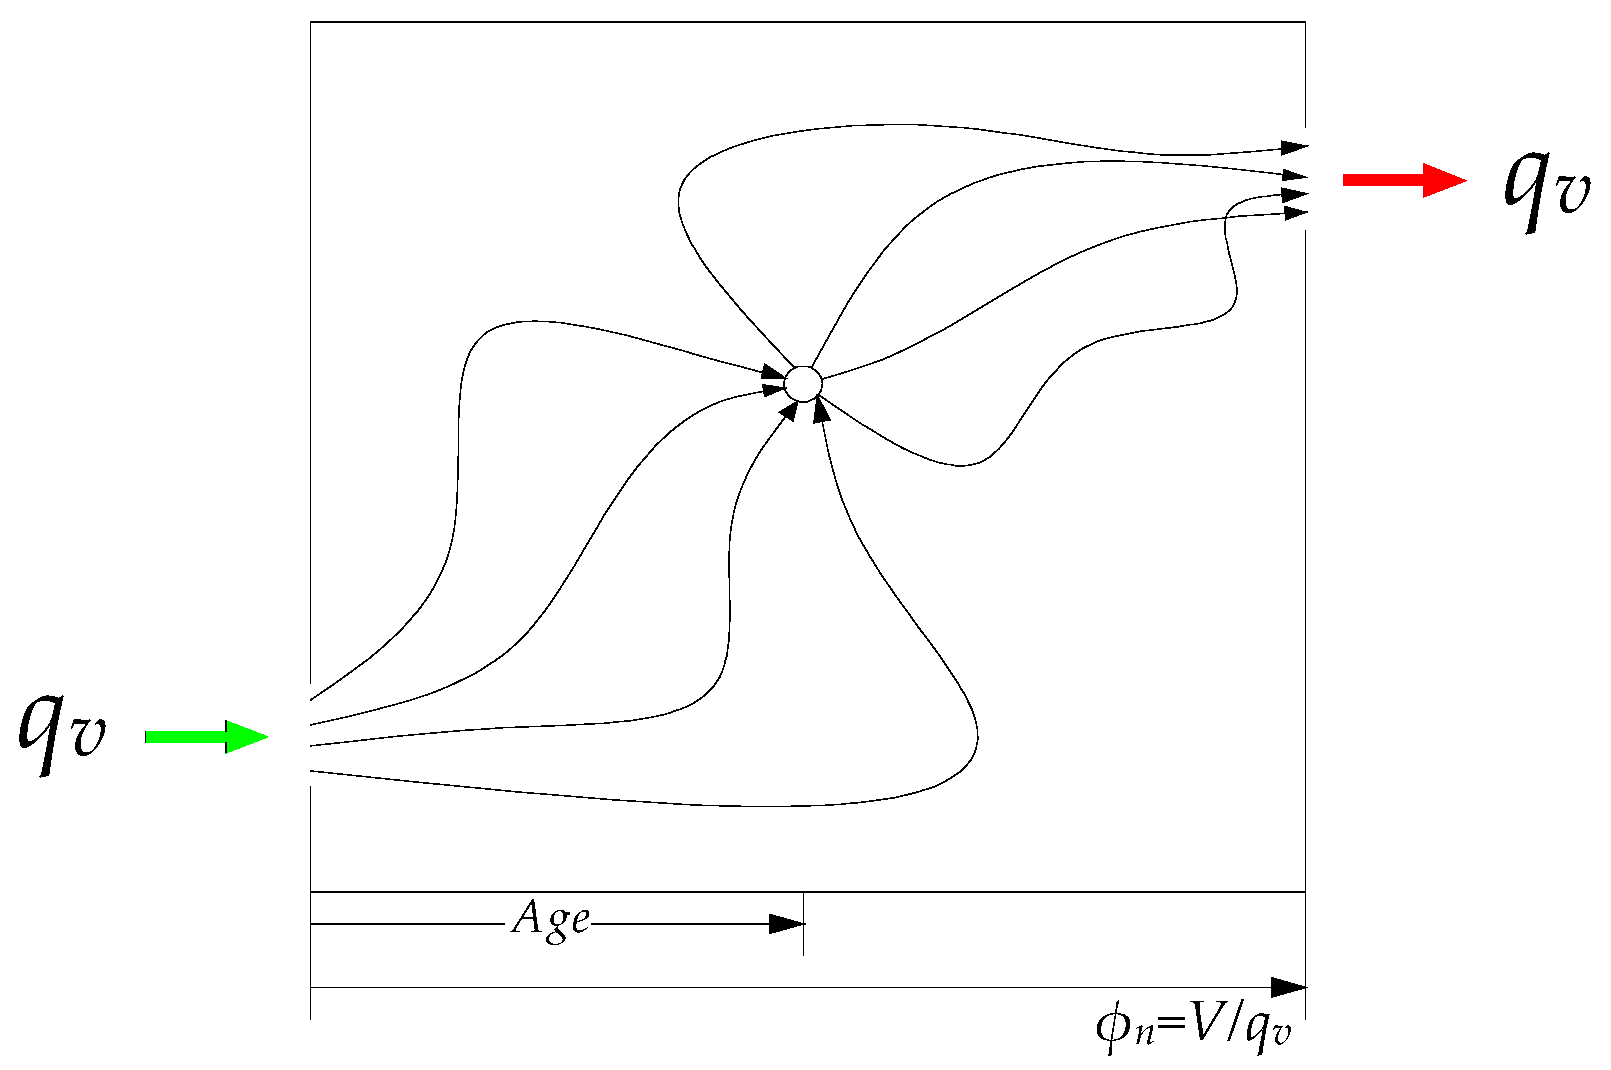
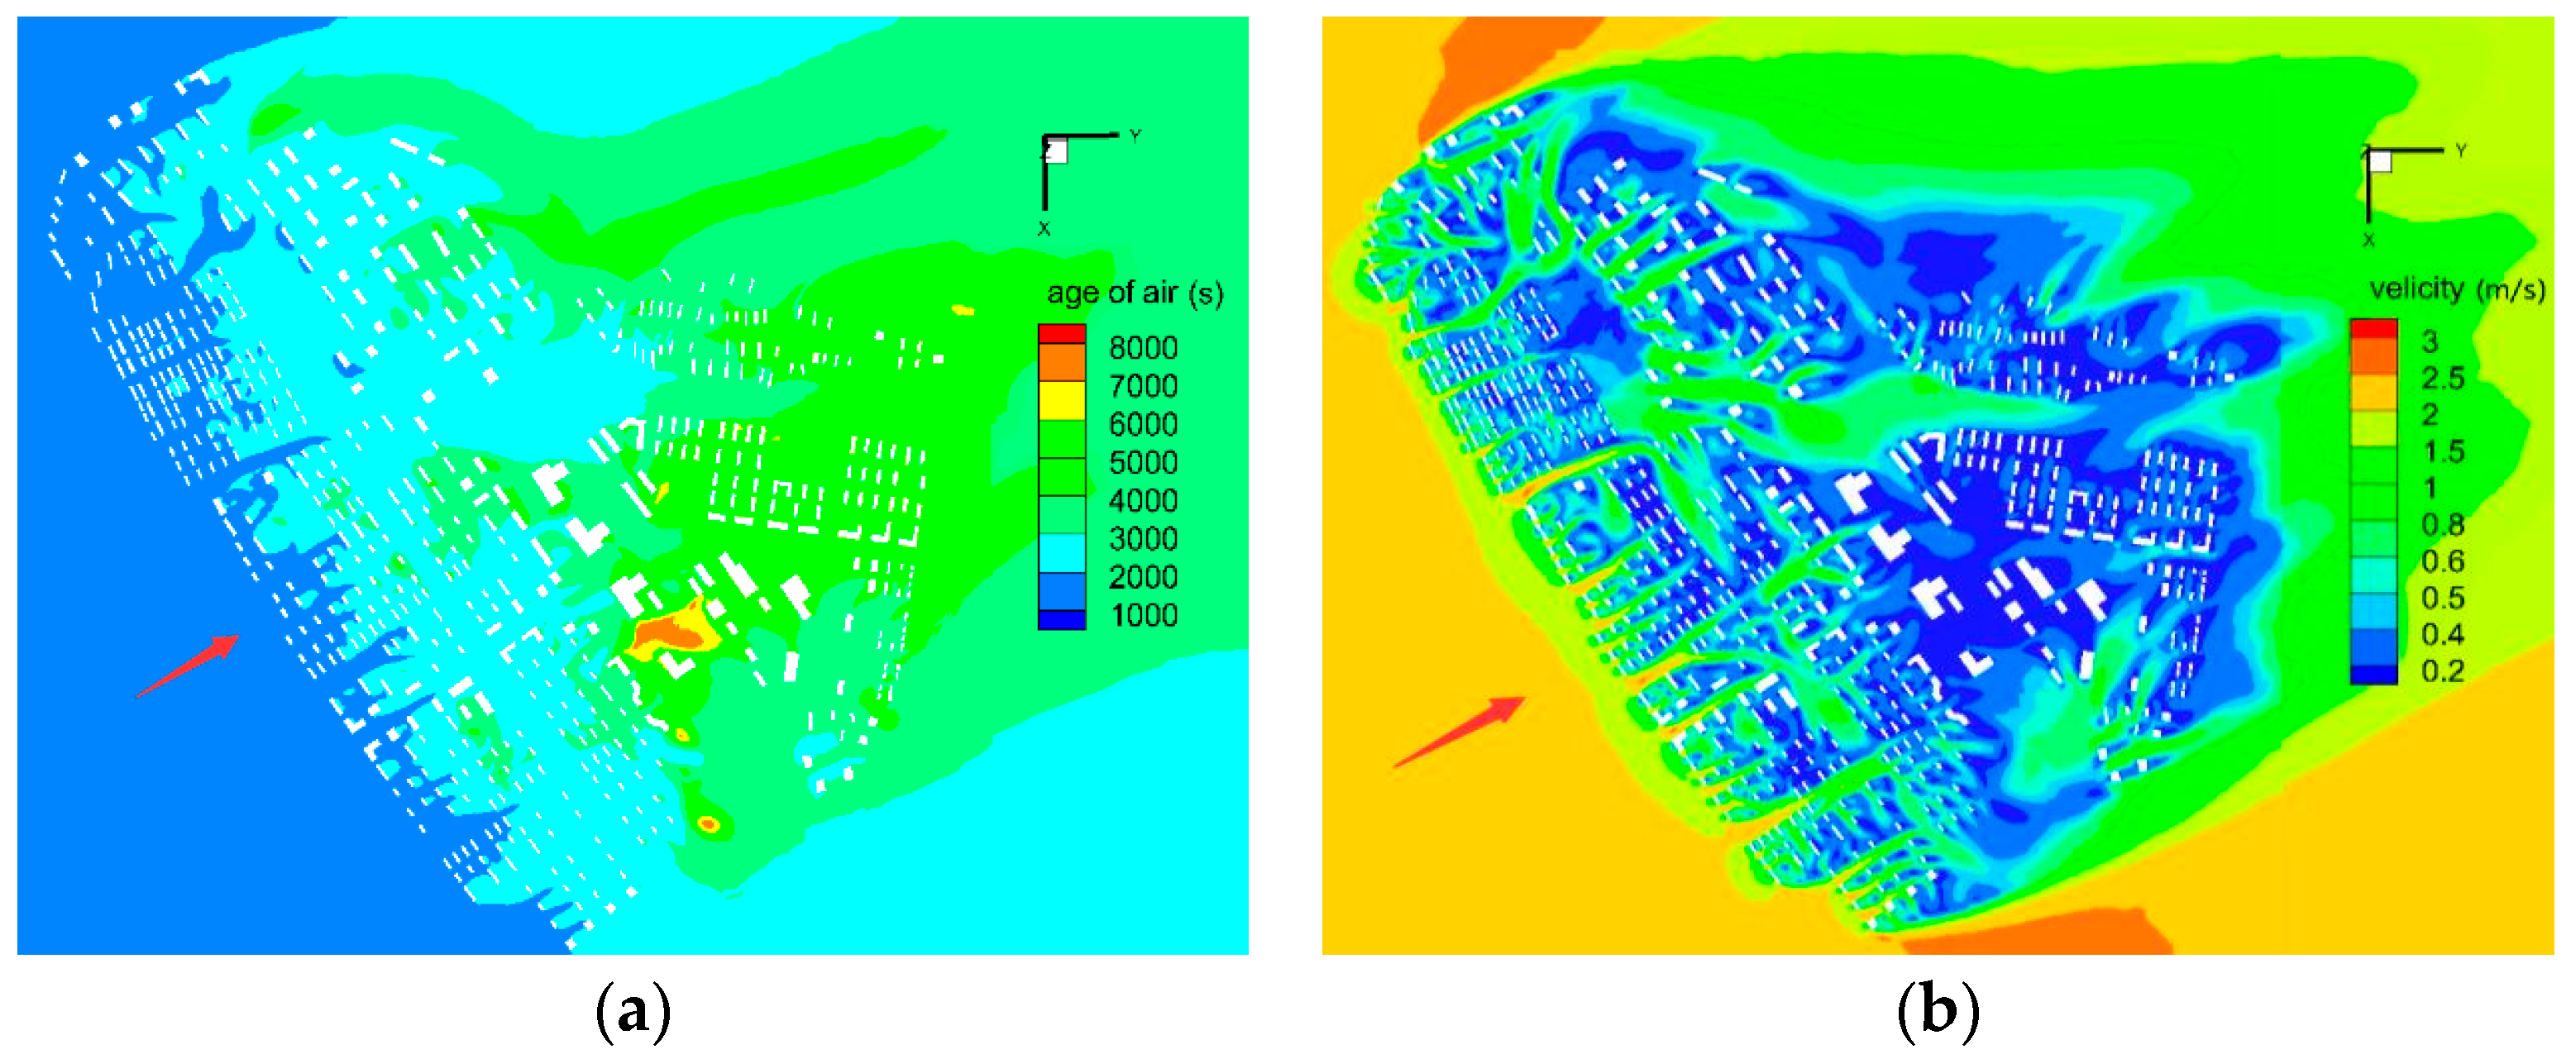
4.4. Air-Age-Based Discussions on the “Freshness” of Outdoor Air
5. Conclusions
- (1)
- The planned region was basically well-ventilated whether the coming wind direction was parallel or perpendicular to the street canyon. However, the air stagnation easily occurred in summer when the prevailing wind was perpendicular to the street canyon.
- (2)
- The favorable ventilation comfort appeared both patterns in the street canyon where the central long street dominated the whole wind field, especially when the wind came from its parallel direction.
- (3)
- Pressure coefficients indicated that the outdoor wind environment for building clusters located at the upper reaches were more favorable than those in lower reaches of the coming wind.
- (4)
- The age of air showed that the poor ventilation will cause the old air detained and make it difficult to exchange the fresh air, resulting in bad air quality in the street canyon, especially in downstream regions behind dense buildings.
Acknowledgments
Author Contributions
Conflicts of Interest
References
- Fernando, H.J.S.; Lee, S.M.; Anderson, J.; Princevac, M.; Pardyjak, E.; Grossman-Clarke, S. Urban Fluid Mechanics: Air Circulation and Contaminant Dispersion in Cities. Environ. Fluid Mech. 2001, 1, 107–164. [Google Scholar] [CrossRef]
- Huang, Y.D.; He, W.R.; Kim, C.N. Impacts of shape and height of upstream roof on airflow and pollutant dispersion inside an urban street canyon. Environ. Sci. Pollut. 2014, 22, 2117–2137. [Google Scholar] [CrossRef] [PubMed]
- Kwak, K.H.; Baik, J.J.; Lee, K.Y. Dispersion and photochemical evolution of reactive pollutants in street canyons. Atmos. Environ. 2013, 70, 98–107. [Google Scholar] [CrossRef]
- Baklanov, A.; Molina, L.T.; Gauss, M. Megacities, air quality and climate. Atmos. Environ. 2016, 126, 235–249. [Google Scholar] [CrossRef]
- Jin, X.; Yang, L.; Du, X.; Yang, Y. Particle transport characteristics in the micro-environment near the roadway. Build. Environ. 2016, 102, 138–158. [Google Scholar] [CrossRef]
- Hsieh, C.M.; Huang, H.C. Mitigating urban heat islands: A method to identify potential wind corridor for cooling and ventilation. Comput. Environ. Urban 2016, 57, 130–143. [Google Scholar] [CrossRef]
- Takebayashi, H.; Moriyama, M. Relationships between the properties of an urban street canyon and its radiant environment: Introduction of appropriate urban heat island mitigation technologies. Sol. Energy 2012, 86, 2255–2262. [Google Scholar] [CrossRef]
- Giridharan, R.; Ganesan, S.; Lau, S.S.Y. Daytime urban heat island effect in high-rise and high-density residential developments in Hong Kong. Energy Build. 2004, 36, 525–534. [Google Scholar] [CrossRef]
- Georgakis, C.; Zoras, S.; Santamouris, M. Studying the effect of “cool” coatings in street urban canyons and its potential as a heat island mitigation technique. Sustain. Cities Soc. 2014, 13, 20–31. [Google Scholar] [CrossRef]
- Mei, S.J.; Liu, C.W.; Liu, D.; Zhao, F.Y.; Wang, H.Q.; Li, X.H. Fluid mechanical dispersion of airborne pollutants inside urban street canyons subjecting to multi-component ventilation and unstable thermal stratifications. Sci. Total Environ. 2016, 565, 1102–1115. [Google Scholar] [CrossRef] [PubMed]
- Li, S.S.; Williams, G.; Guo, Y.M. Health benefits from improved outdoor air quality and intervention in China. Environ. Pollut. 2016, 214, 17–25. [Google Scholar] [CrossRef] [PubMed]
- Liu, J.L.; Niu, J.L. CFD simulation of the wind environment around an isolated high-rise building: An evaluation of SRANS, LES and DES models. Build. Environ. 2016, 96, 91–106. [Google Scholar] [CrossRef]
- Yoshie, R.; Mochida, A.; Tominaga, Y.; Kataoka, H.; Harimoto, K.; Nozu, T.; Shirasawa, T. Cooperative project for CFD prediction of pedestrian wind environment in the architectural institute of Japan. J. Wind Eng. Ind. Aerodyn. 2007, 95, 1551–1578. [Google Scholar] [CrossRef]
- Ricci, A.; Burlando, M.; Freda, A.; Repetto, M.P. Wind tunnel measurements of the urban boundary layer development over a historical district in Italy. Build. Environ. 2017, 111, 192–206. [Google Scholar] [CrossRef]
- Tominaga, Y.; Mochida, A.; Yoshie, R.; Kataoka, H.; Nozu, T.; Yoshikawa, M.; Shirasawa, T. AIJ guidelines for practical applications of CFD to pedestrian wind environment around buildings. J. Wind Eng. Ind. Aerodyn. 2008, 96, 1749–1761. [Google Scholar] [CrossRef]
- Ramponi, R.; Blocken, B.; de Cooa, L.B.; Janssen, W.D. CFD simulation of outdoor ventilation of generic urban configurations with different urban densities and equal and unequal street widths. Build. Environ. 2015, 92, 152–166. [Google Scholar] [CrossRef]
- Tong, Z.M.; Chen, Y.J.; Malkawi, A. Defining the Influence Region in neighborhood-scale CFD simulations for natural ventilation design. Appl. Energy 2016, 182, 625–633. [Google Scholar] [CrossRef]
- Blocken, B.; Janssen, W.D.; van Hooff, T. CFD simulation for pedestrian wind comfort and wind safety in urban areas: General decision framework and case study for the Eindhoven University campus. Environ. Model. Softw. 2012, 30, 15–34. [Google Scholar] [CrossRef]
- He, L.J.; Hang, J.; Wang, X.M.; Lin, B.R.; Li, X.H.; Lan, G.D. Numerical investigations of flow and passive pollutant exposure inhigh-rise deep street canyons with various street aspect ratios and viaduct settings. Sci. Total Environ. 2017, 584–585, 189–206. [Google Scholar] [CrossRef] [PubMed]
- Yang, F.; Gao, Y.W.; Zhong, K.; Kang, Y.M. Impacts of cross-ventilation on the air quality in street canyons with different building arrangements. Build. Environ. 2016, 104, 1–12. [Google Scholar] [CrossRef]
- Chatzidimitriou, A.; Yannas, S. Street canyon design and improvement potential for urban open spaces; the influence of canyon aspect ratio and orientation on microclimate and outdoor comfort. Sustain. Cities Soc. 2017, 33, 85–101. [Google Scholar] [CrossRef]
- Perret, L.; Blackman, K.; Fernandes, R.; Savory, E. Relating street canyon vertical mass-exchange to upstream flow regime and canyon geometry. Sustain. Cities Soc. 2017, 30, 49–57. [Google Scholar] [CrossRef]
- Tominaga, Y.; Stathopoulos, T. CFD modeling of pollution dispersion in a street canyon: Comparison between LES and RANS. J. Wind Eng. Ind. Aerodyn. 2011, 99, 340–348. [Google Scholar] [CrossRef]
- Park, S.J.; Choi, W.; Kim, J.J.; Kim, M.J.; Park, R.J.; Han, K.S.; Kang, G. Effects of building-roof cooling on the flow and dispersion of reactive pollutants in an idealized urban street canyon. Build. Environ. 2016, 109, 175–189. [Google Scholar] [CrossRef]
- Ai, Z.T.; Mak, C.M. CFD simulation of flow in a long street canyon under a perpendicular wind direction: Evaluation of three computational settings. Build. Environ. 2016, 114, 293–306. [Google Scholar] [CrossRef]
- Sandberg, M. What is ventilation efficiency? Build. Environ. 1981, 16, 123–135. [Google Scholar]
- Etherldge, D.; Sandberg, M. Building Ventilation: Theory and Measurement; John Wiley & Sons: Chichester, UK, 1996. [Google Scholar]
- Hang, J.; Sandberg, M.; Li, Y.G. Age of air and air exchange efficiency in idealized city models. Build. Environ. 2009, 44, 1714–1723. [Google Scholar] [CrossRef]
- Hang, J.; Li, Y.G. Age of air and air exchange efficiency in high-rise urban areas and its link to pollutant dilution. Atmos. Environ. 2011, 45, 5572–5585. [Google Scholar] [CrossRef]
- Mochida, A.; Tominaga, Y.; Murakami, S.; Yoshie, R.; Ishihara, T.; Ooka, R. Comparison of various k–emodels and DSM applied to flow around a high-rise building—Report on AIJ cooperative project for CFD prediction of wind environment. Wind Struct. 2002, 5, 227–244. [Google Scholar] [CrossRef]
- Versteeg, H.K.; Malalasekera, W. An Introduction to Computational Fluid Dynamics: The Finite Volume Method, 2nd ed.; Beijing World Publishing Corporation: Beijing, China, 2007; pp. 87–88. [Google Scholar]
- Yakhot, V.; Orszag, S.A.; Thangam, S.; Gatski, T.B.; Speziale, C.G. Development of turbulence models for shear flows by a doble expansion technique. Phys. Fluids A 1992, 4, 1510–1520. [Google Scholar] [CrossRef]
- Yakhot, V.; Orszag, S.A. Renormalization-group analysis of turbulence. Phys. Rev. Lett. 1986, 57, 6396–6409. [Google Scholar] [CrossRef] [PubMed]
- Sini, J.F.; Anquetin, S.; Mestayer, P.G. Pollutant dispersion and thermal effects in urban street canyons. Atmos. Environ. 1996, 30, 2659–2677. [Google Scholar] [CrossRef]
- Burnett, J.; Bojic, M.; Yik, F. Wind-induced pressure at external surfaces of a high-rise residential building in Hong Kong. Build. Environ. 2005, 40, 765–777. [Google Scholar] [CrossRef]
- Yuan, C.S. The effect of building shape modification on wind pressure differences for cross-ventilation of a low-rise building. Int. J. Vent. 2007, 6, 167–176. [Google Scholar] [CrossRef]
- Kelley, J.B. The extended Bernoulli equation. Am. J. Phys. 1950, 18, 202–204. [Google Scholar] [CrossRef]


| Scenario | Season | Temperature (°C) | Prevailing Wind Direction | Wind Speed (m/s) |
|---|---|---|---|---|
| 1 | Summer | 20~37 | SSE | 2.4 |
| 2 | Winter | −2~10 | ENE | 2.7 |
| Items | Military Districts | Innovative Streets | Residential Areas |
|---|---|---|---|
| Building area () | 167.0 | 410.3 | 488.4 |
| Body heat () | 1.6 | 4.3 | 4.5 |
| Surface heat () | 91.3 | 155.6 | 147.0 |
| Wind Scale | Human Body Comfor |
|---|---|
| 1.0 m/s | Breezeless |
| 1.05.0 m/s | Comfortable |
| 5.010.0 m/s | Uncomfortable with movement affected |
| 10.015.0 m/s | Very uncomfortable with movement greatly affected |
| 15.020.0 m/s | Intolerable |
| 20.0 m/s | Dangerous |
| Velocity (m/s) | Percentage (%) | |
|---|---|---|
| SSE (Summer ) | ENE (Winter) | |
| 0 (air stagnation) | 10.44 | 5.78 |
| 00.5 | 45.25 (0.04–0.50) | 20.17 (0.01–0.50) |
| 0.51.0 | 18.22 (0.51–0.98) | 46.13 (0.51–0.10) |
| 1.03.0 | 26.09 (1.01–2.89) | 27.92 (1.01–2.78) |
© 2017 by the authors. Licensee MDPI, Basel, Switzerland. This article is an open access article distributed under the terms and conditions of the Creative Commons Attribution (CC BY) license (http://creativecommons.org/licenses/by/4.0/).
Share and Cite
Liu, F.; Qian, H.; Zheng, X.; Zhang, L.; Liang, W. Numerical Study on the Urban Ventilation in Regulating Microclimate and Pollutant Dispersion in Urban Street Canyon: A Case Study of Nanjing New Region, China. Atmosphere 2017, 8, 164. https://doi.org/10.3390/atmos8090164
Liu F, Qian H, Zheng X, Zhang L, Liang W. Numerical Study on the Urban Ventilation in Regulating Microclimate and Pollutant Dispersion in Urban Street Canyon: A Case Study of Nanjing New Region, China. Atmosphere. 2017; 8(9):164. https://doi.org/10.3390/atmos8090164
Chicago/Turabian StyleLiu, Fan, Hua Qian, Xiaohong Zheng, Lun Zhang, and Wenqing Liang. 2017. "Numerical Study on the Urban Ventilation in Regulating Microclimate and Pollutant Dispersion in Urban Street Canyon: A Case Study of Nanjing New Region, China" Atmosphere 8, no. 9: 164. https://doi.org/10.3390/atmos8090164
APA StyleLiu, F., Qian, H., Zheng, X., Zhang, L., & Liang, W. (2017). Numerical Study on the Urban Ventilation in Regulating Microclimate and Pollutant Dispersion in Urban Street Canyon: A Case Study of Nanjing New Region, China. Atmosphere, 8(9), 164. https://doi.org/10.3390/atmos8090164