Article

Q-Space Analysis of the Light Scattering Phase Function of Particles with Any Shape

by
Christopher M. Sorensen
1,*,
Yuli W. Heinson
2,
William R. Heinson
2,
Justin B. Maughan
1 and
Amit Chakrabarti
1
1
Department of Physics, Kansas State University, Manhattan, KS 66506, USA
2
Department of Energy, Environmental & Chemical Engineering, Washington University in St. Louis, St. Louis, MO 63130, USA
*
Author to whom correspondence should be addressed.
Atmosphere 2017, 8(4), 68; https://doi.org/10.3390/atmos8040068
Submission received: 20 January 2017 / Revised: 18 March 2017 / Accepted: 20 March 2017 / Published: 29 March 2017
(This article belongs to the Special Issue Morphology and Internal Mixing of Atmospheric Particles)

Abstract

:
Q-space analysis is applied to the light scattering phase function of a wide variety of non-spherical and irregularly shaped particles including a great many types of dusts, fractal aggregates, spheroids, irregular spheres, Gaussian random spheres, thickened clusters and nine types of ice crystals. The phase functions were either experimental data or calculations. This analysis method uncovers many specific and quantitative similarities and differences between the scattering by various shapes and also when compared to spheres. From this analysis a general description for scattering by a particle of any shape emerges with specific details assigned to various shapes.

1. Introduction

The particles that appear in the atmosphere have a variety of shapes that can be simply divided into spheres and non-spheres. All these particles scatter and absorb light and this light-particle interaction is significant for the energy budget of the atmosphere and the Earth itself. The problem of how spherical particles interact with light was solved long ago; on the other hand a solution to describe and understand light scattering and absorption by non-spherical particles can be very challenging. Nevertheless, remarkable analytical and numerical methods have been developed and computational hardware has allowed for ever increasing speed for large scale calculations. Moreover, comprehensive experimental studies of scattering both in the lab and the field have occurred. However, given a solution or a set of data for scattering, the problem remains what to do with it. That is, if the pattern cannot be described, how can one quantitatively describe the scattering pattern and distinguish one pattern from another? Furthermore, if the pattern cannot be described, how can one know the physics responsible for the pattern?
Some time ago, we demonstrated [1,2,3] that the angular scattering patterns for spherical particles are best viewed as a function of the magnitude of the scattering wave vector
q = 2 k sin   ( θ / 2 )
where k = 2π/λ, λ is the wavelength of light, θ is the scattering angle and the scale for plotting should be logarithmic. This plotting yields a distinctly different perspective than plotting scattered intensity versus linear θ. Properties that make q a viable independent variable are that its inverse is a length scale that probes the lengths inherent to the particle. It is also the Fourier variable in the mathematical description of diffraction which is physically demonstrated as the limit where the refractive index of a particle approaches one. We must also stress that the logarithmic axis for q is essential as well as q itself because so much of our world progresses geometrically rather than arithmetically. We call this procedure of plotting scattered intensity versus q double logarithmically “Q-space analysis”. We shall see that Q-space analysis has descriptive abilities that can compare the similarities and differences of the scattering by different types of particles. It also leads to physical interpretation of the scattering mechanism.
This paper is concerned with the problem of how to describe and compare the angular scattering patterns, the phase functions, either observed or calculated for arbitrarily shaped particles. The foundation of this project is a comprehensive description of spherical particle scattering as viewed from Q-space, and that is where we start.

2. Q-Space Analysis Applied to Spheres

Properties universal to scattering by all particles becomes more apparent during Q-space analysis by rescaling both the q-axis and the intensity axis. When the effective radius R of the particle is known, the plot can be improved by plotting versus the dimensionless variable q R . Improvement can also be made by normalizing the differential scattering cross section, which is proportional to the scattered intensity and the phase function, by the Rayleigh differential cross section of the particle [4,5,6].
d C s c a ,   R a y ,   s p h / d Ω = k 4 R 6 F ( m )
where k =   2 π / λ and
F ( m ) =   | m 2 1 m 2 + 2 | 2
The function F(m) is the square of the Lorentz-Lorenz function of the complex refractive index m = n + . Equation (2) is proportional to the Rayleigh scattered intensity IRay.
Our work has shown that the scattering by spheres is well parameterized by the internal coupling parameter [7]
ρ = 2 k R F ( m ) = 2 k R | m 2 1 m 2 + 2 |
This parameter is similar to the well-known phase shift parameter ρ = 2 k R | m 1 | [4,5] but does a better job in describing the evolution of the scattering away from the diffraction limit, where ρ = ρ = 0 , and acting as a quasi-universal parameter for the scattering, as will be demonstrated below.
Figure 1 shows Q-space analysis applied to scattering by spheres (Mie scattering) for ρ = 3 ,   10 ,   30 ,   100 , and 1000 comprised from three refractive indices, m = 1.1, 1.5 and 2.0 and radii ranging from 0.25 to 647 microns. The envelope of the diffraction limit, also called the Rayleigh Debye-Gans (RDG) limit, which occurs when ρ 0 , is also shown as a dashed line. Because the scattered intensity, I, is proportional to the differential cross section, the Rayleigh normalized differential cross section is represented by a Rayleigh normalized scattered intensity, I / I R a y . The Mie scattering calculation was averaged over a log-normal size distribution with a geometric width 1.2 to eliminate the interference ripples.
The scattering curves in Figure 1 with the same ρ fall nearly on top of each other even though the size R and refractive index m vary widely for each ρ [2,7,8]. This demonstrates the quasi-universal parameterization afforded by ρ . Figure 1 also shows that the scattering evolves from the RDG, diffraction limit with increasing ρ . This evolution is described with the following features:
  • For all ρ , a forward scattering lobe of constant intensity appears when q R < 1 .
  • With increasing qR, the scattering begins to decrease in the Guinier regime [9] near q R 1 .
  • After the Guinier regime, power law functionalities begin to appear. For ρ < 1 , the RDG limit, a ( q R ) 4 functionality follows the Guinier. When ρ gets large, ρ 30 , a ( q R ) 3 functionality (2d Fraunhofer diffraction [8], see below) appears after the Guinier regime.
  • The ( q R ) 3 regime is followed by a “hump” regime centered near qR ρ which then crosses over to approximately touch the ( q R ) 4 functionality of the RDG limit when q R ρ .
  • Connecting the Guinier regime and the hump regime with an equal tangent line gives a ( q R ) 2 functionality which dominates, albeit briefly and imperfectly, when ρ < 10 . We call the region between the Guinier regime and the backscattering the “power law regime”.
  • At largest qR near 2kR (which corresponds to θ = 180°), enhanced backscattering occurs involving “rainbows” and the glory.
The Rayleigh normalized forward scattered intensity for spheres, I ( 0 ) / I R a y , also displays quasi-universal behavior with ρ   as shown in Figure 2 and described as follows (feature number 7):
I ( 0 ) = I R a y   when   ρ 1 I ( 0 ) = I R a y / ρ 2   when   ρ 10
Between these limits, a ripple structure ensues. Note that from Equations (2)–(4)
( d C s c a ,   R a y ,   s p h / d Ω ) / ρ 2 = k 2 R 4 / 4
The right hand side of Equation (6) is the forward scattering (diffraction) from a 2D circular obstacle of radius R. Now recall Babinet’s principle that states the intensity diffraction pattern through an aperture is identical to diffraction by an obstacle of the same size and shape [11]. Thus, Equation (6) is the circular aperture result.
A non-zero imaginary part of the refractive index, κ , will cause absorption. However, significant absorption, such that the scattering phase function changes, is governed by another universal parameter κ k R [12]. When κ k R < 0.1 , absorption is relatively insignificant; when κ k R > 3 , absorption is significant and does not alter the scattering further with increasing κkR. It is straightforward to show that ( κ k R )−1 is the ratio of the absorption skin depth to the particle radius.
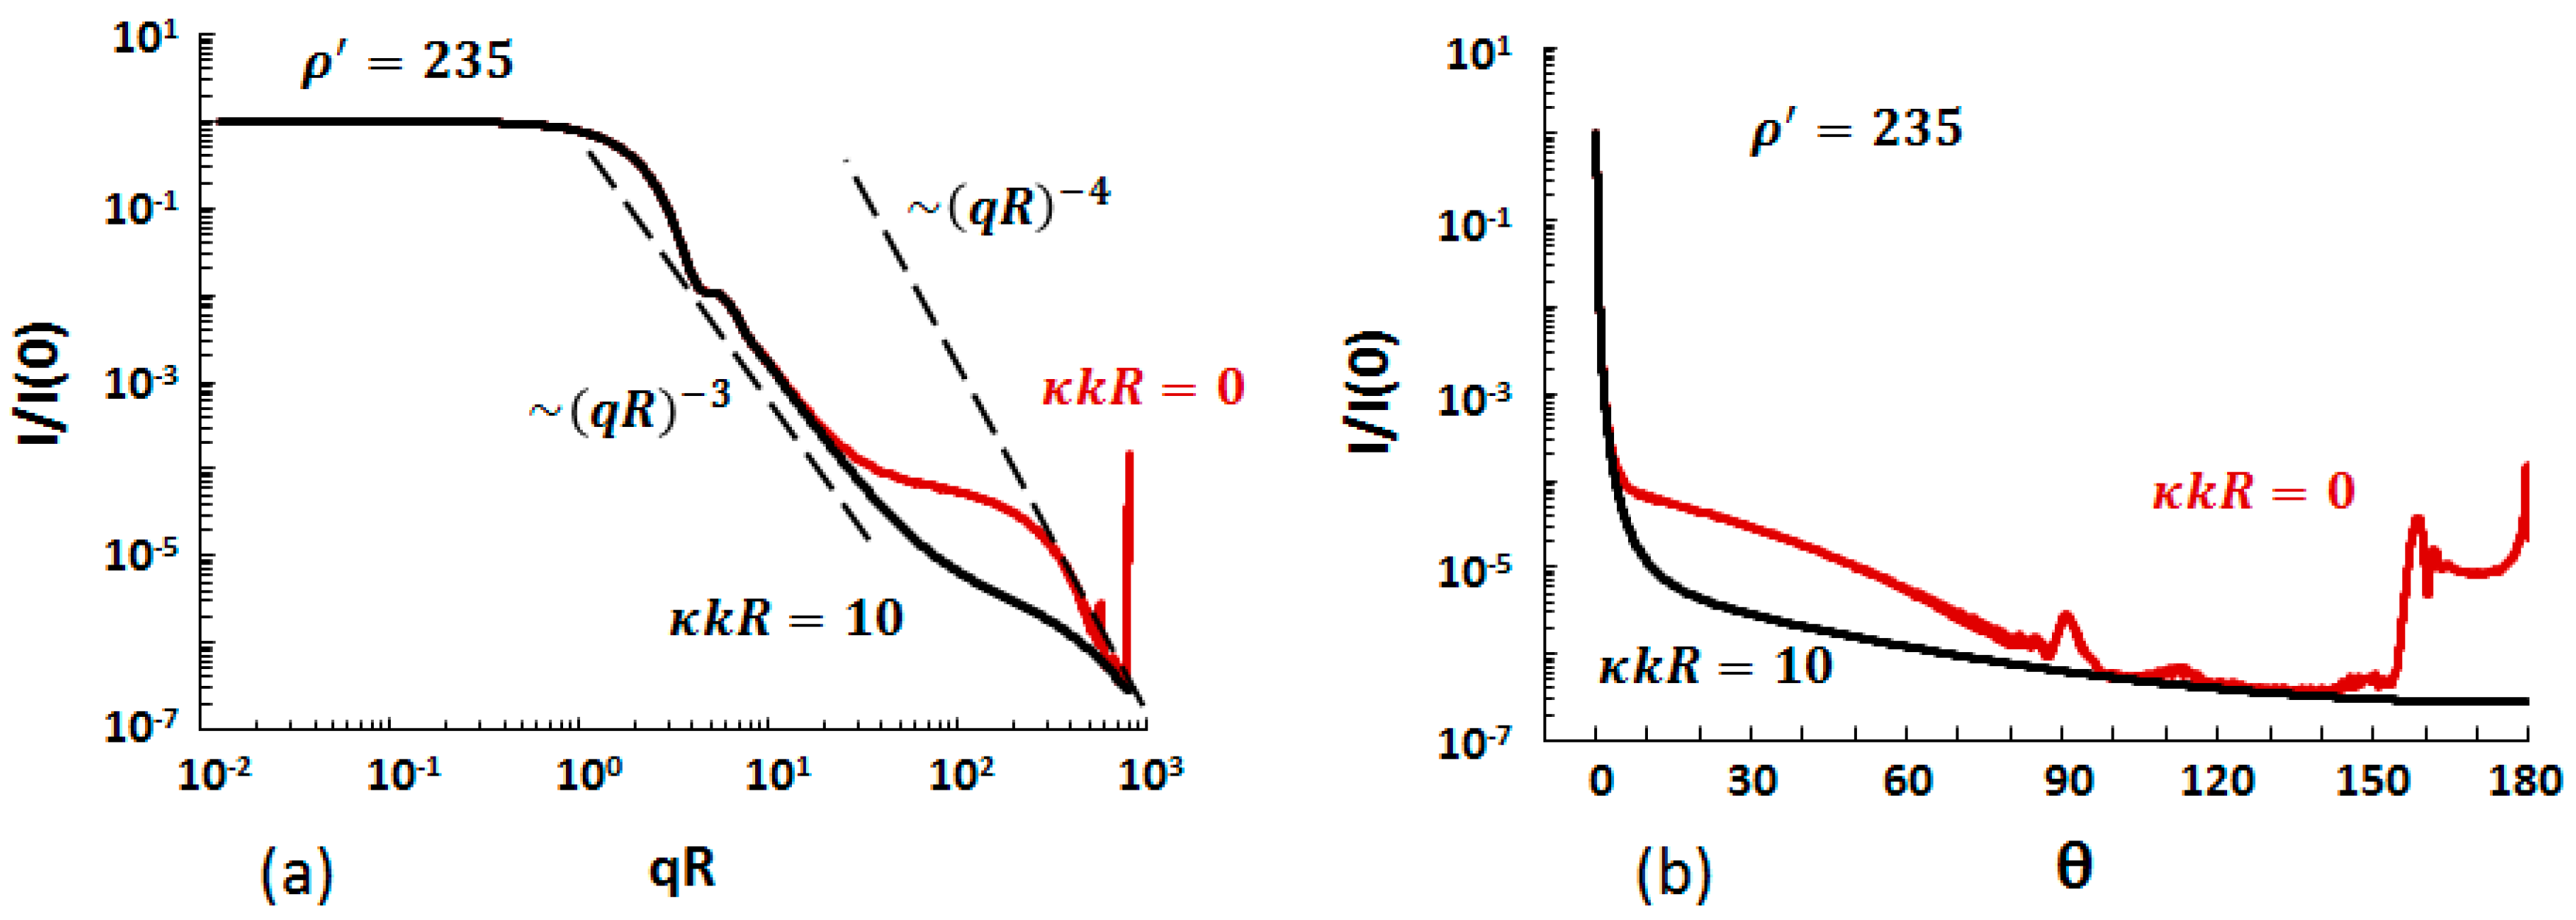
Figure 3 shows the scattering by a narrow distribution of large, refractive spheres with a mean ρ = 235 and κ k R   =   0 (without absorption) and κ k R   =   10 (with significant absorption). This figure demonstrates that scattering by spheres with significant absorption has lost most of the hump and all of the rainbow and glory structure leaving mostly the ( q R ) 3 power law. The figure also allows a comparison of the Q-space and traditional points of view (Figure 3a,b, respectively).
Thus, we conclude our survey of features uncovered by Q-space analysis for spheres with:
8.
When the refractive index, m = n + , is complex, a second universal parameter comes into play, κkR. When κkR < 0.1, non-zero κ has very little effect on the scattering; otherwise κ does have an effect with the same effect for different kR and real part of the refractive index n if κkR is the same. The forward scattering when q < R−1 is not affected, but the hump and backscattering, including possible rainbows and glories incur substantial changes. For large size parameters, kR, disappearance of the hump correlates with the scattering cross section decreasing from approximately 2πR2 to πR2 and the absorption cross section increasing from 0 to πR2 when κkR ≥ 3 [13].
These features of scattering by spheres, as calculated from the Mie equations, form a foundation for comparisons to scattering by irregularly shaped particles.

3. Experimental Data

3.1. Dusts

The term “dust” refers to powders of solid particles with sizes ranging roughly from one to a few hundred microns. Examples include mineral particles from deserts and agricultural regions, road dusts, plant fragments, volcanic ash and dusts that occur in the workplace. Described here are some characteristic data from experiments that have measured scattered light from a variety of dusts.

3.1.1. Amsterdam-Granada Data Set

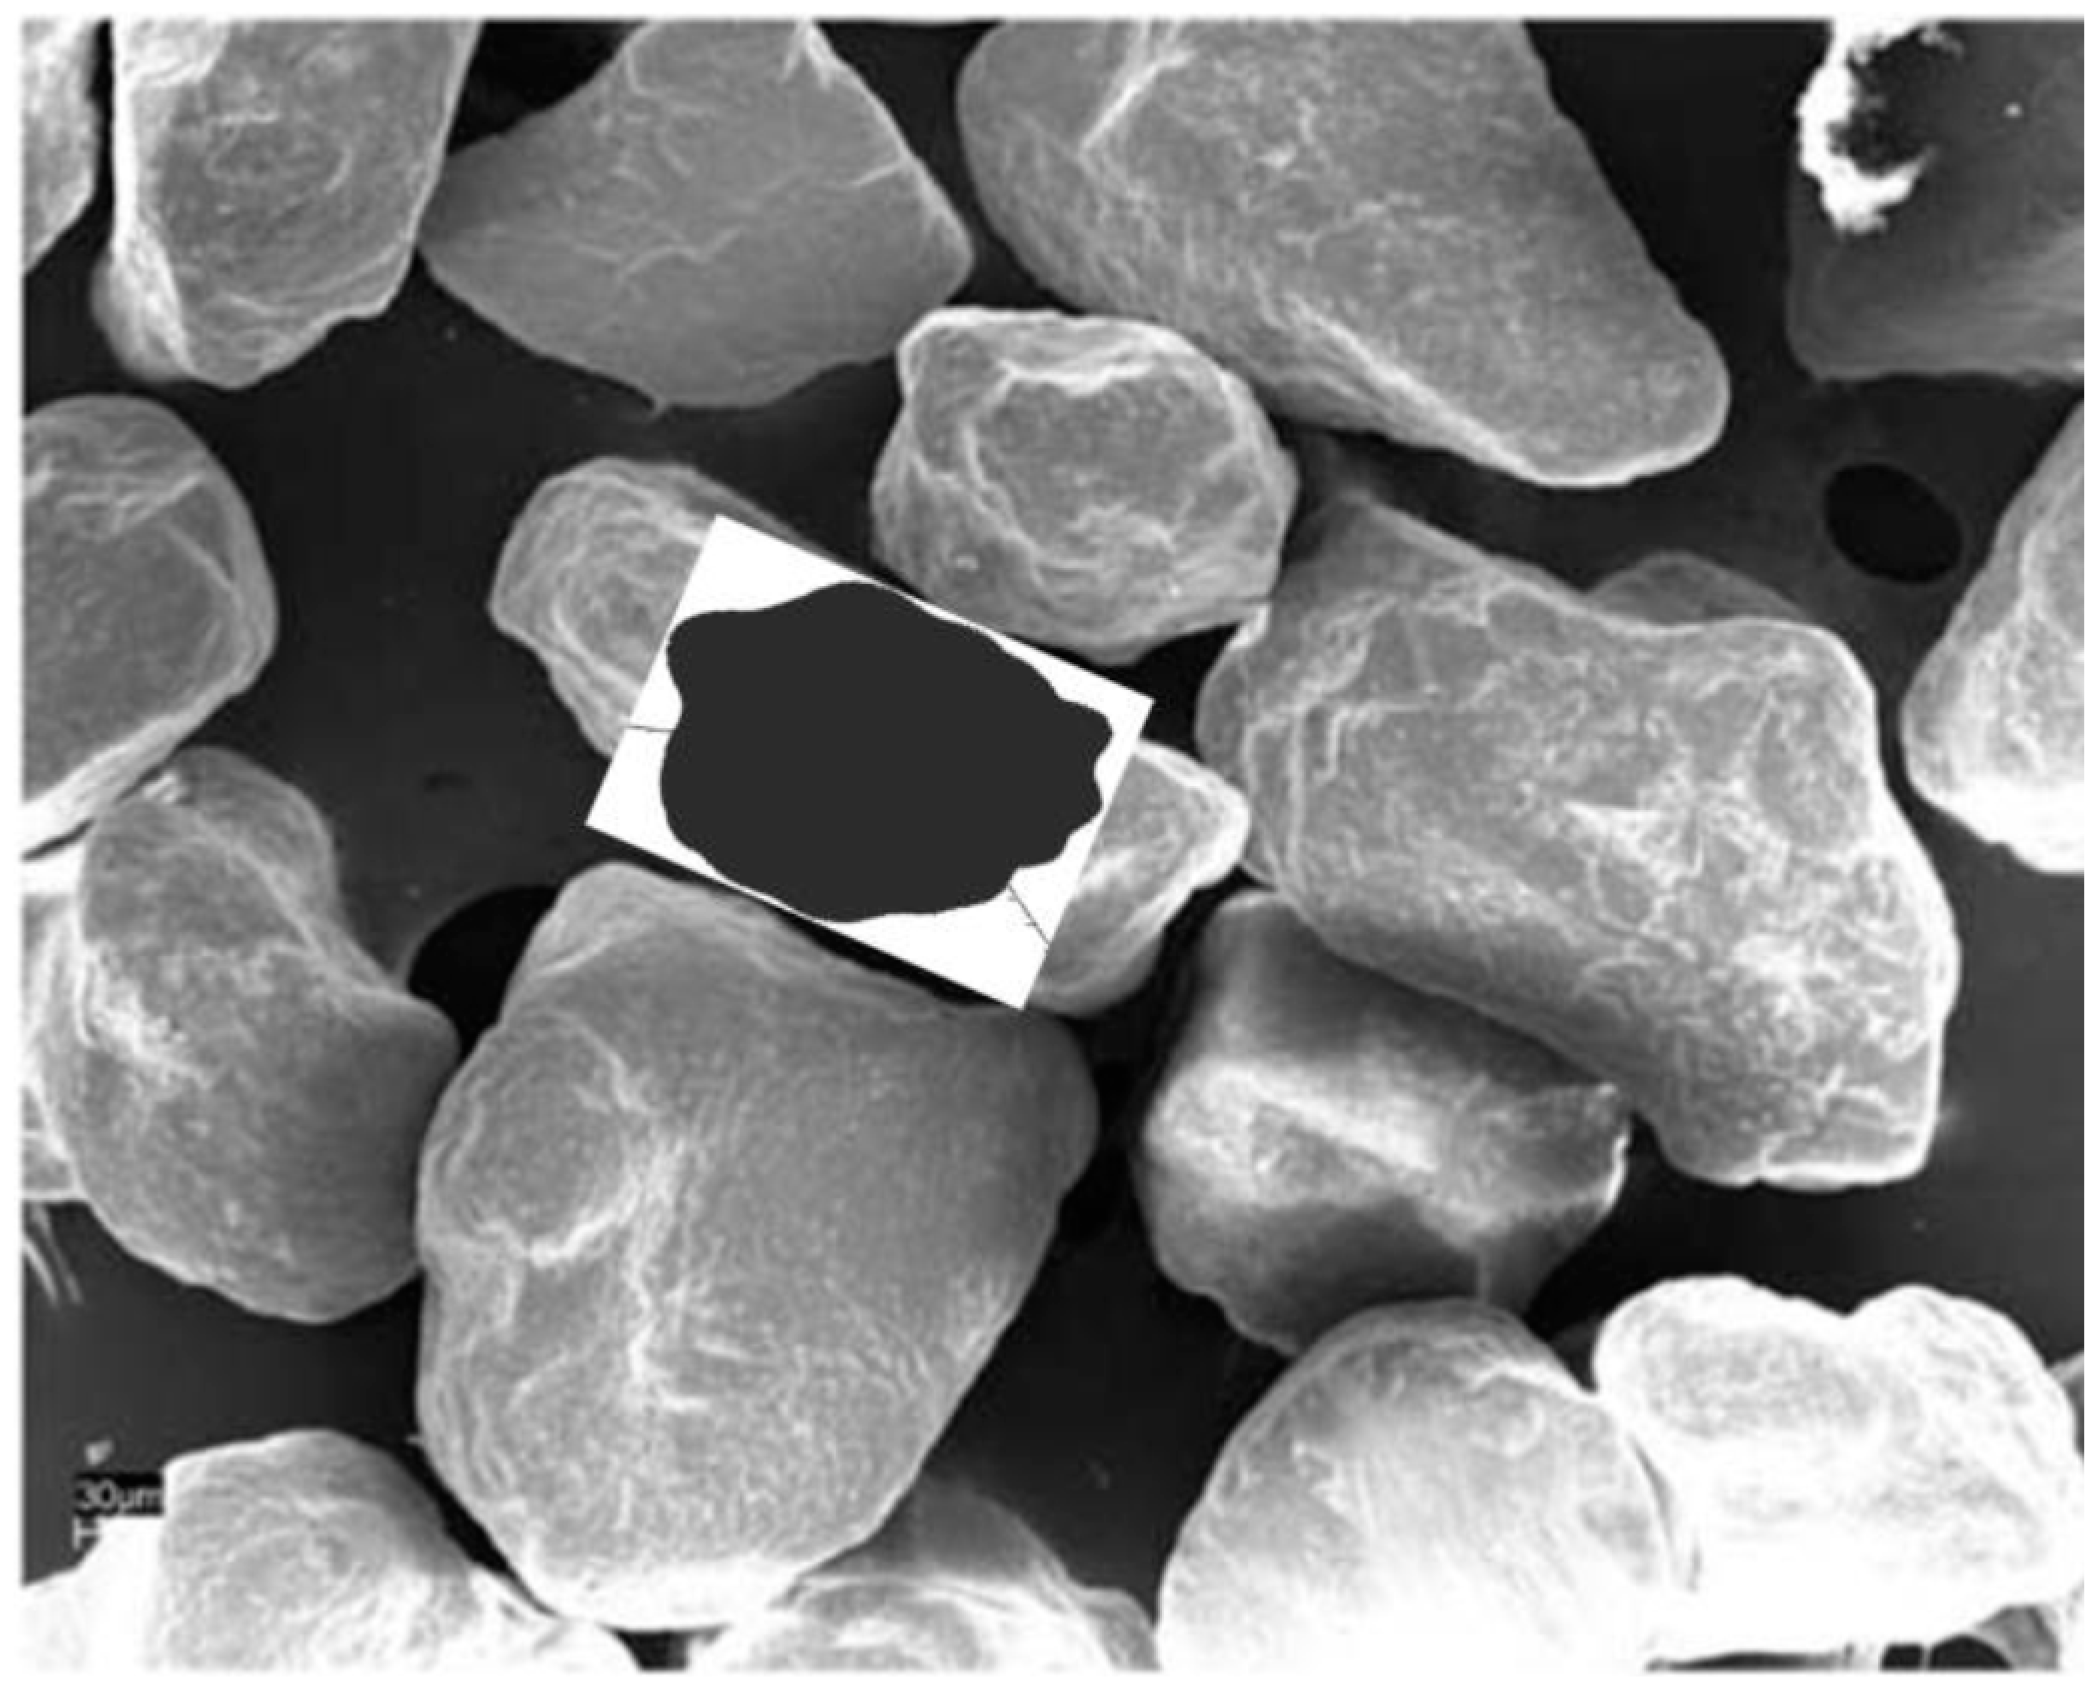
The Amsterdam-Granada group has provided an extensive data set for light scattering from aerosolized dusts [14]. These data were obtained in the lab with light of wavelengths 441.6 nm and 632.8 nm scattered from the aerosols at angles from either 3° or 5° to 177°. Figure 4 shows an example of Saharan dust.
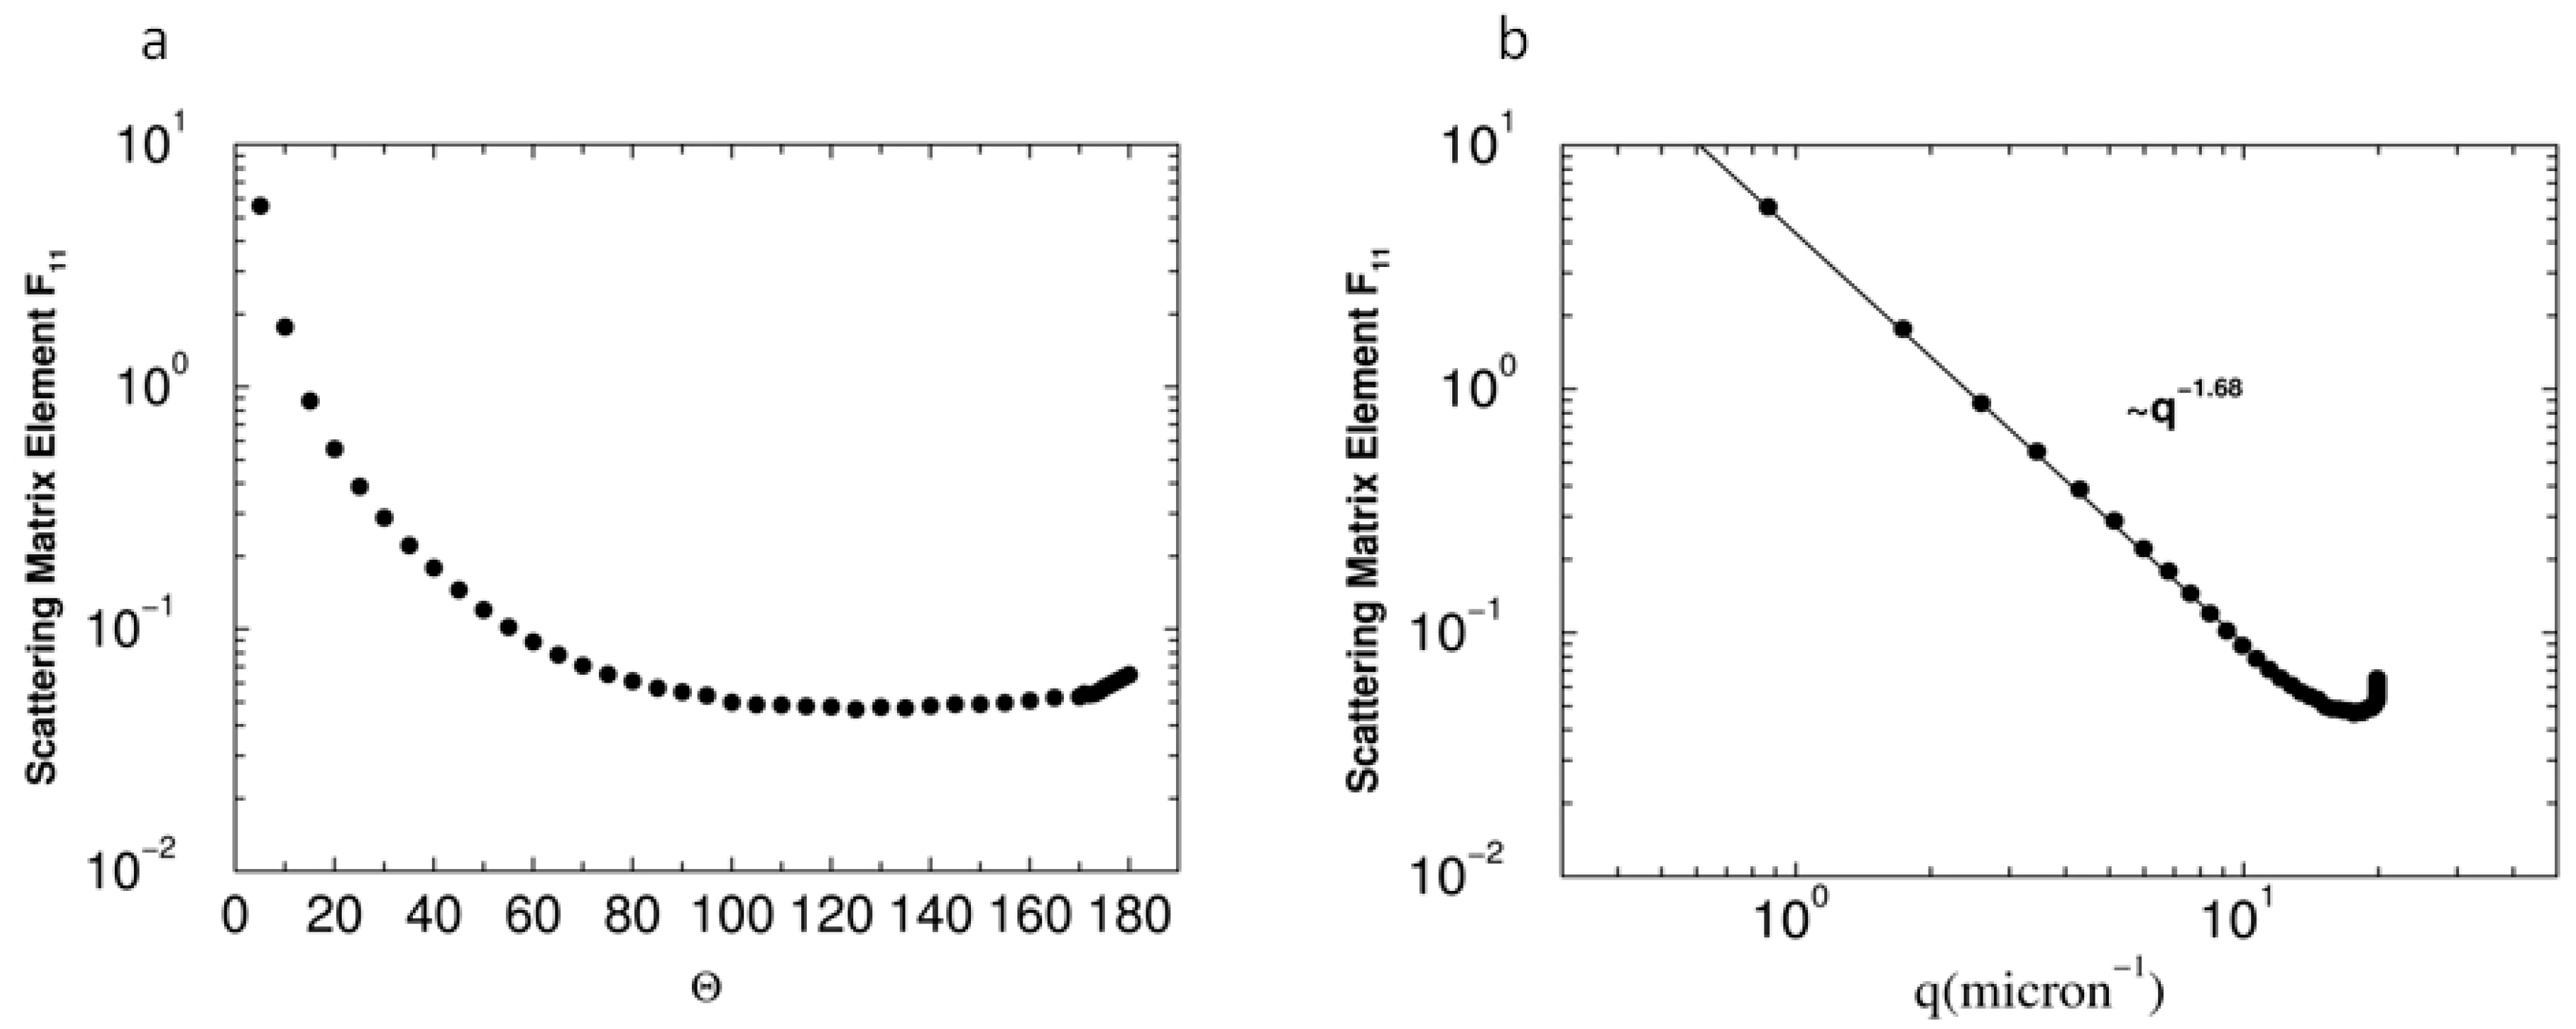
Figure 5 demonstrates the differences between plotting the scattered light intensity versus scattering angle and versus the log of the scattering wave vector magnitude q, i.e., Q-space analysis [16]. The same data are plotted on both the left and right hand sides of the figure. The data are for scattering of unpolarized light from aerosolized Libyan sand [15]. Plotting versus linear angle yields a non-descript curve; plotting versus log q (Q-space analysis) yields a straight line followed by enhanced backscattering. The power of Q-space analysis is apparent.
The bulk of the data in Figure 5, ignoring the enhance backscattering for q > 10 micron−1, follow a straight line to imply a power law with q with an exponent magnitude of 1.68. The Q-space plot shows no change from linearity at small q down to q 0.9 μm−1 where the data end. By analogy with spherical particle scattering, we expect at small q a Guinier regime. Since no Guinier regime is seen, the implication is that the size of the dust particles is greater than the inverse of the smallest available q 0.9 μm, i.e., greater than q−1 1.1 μm. This is consistent with Figure 4.
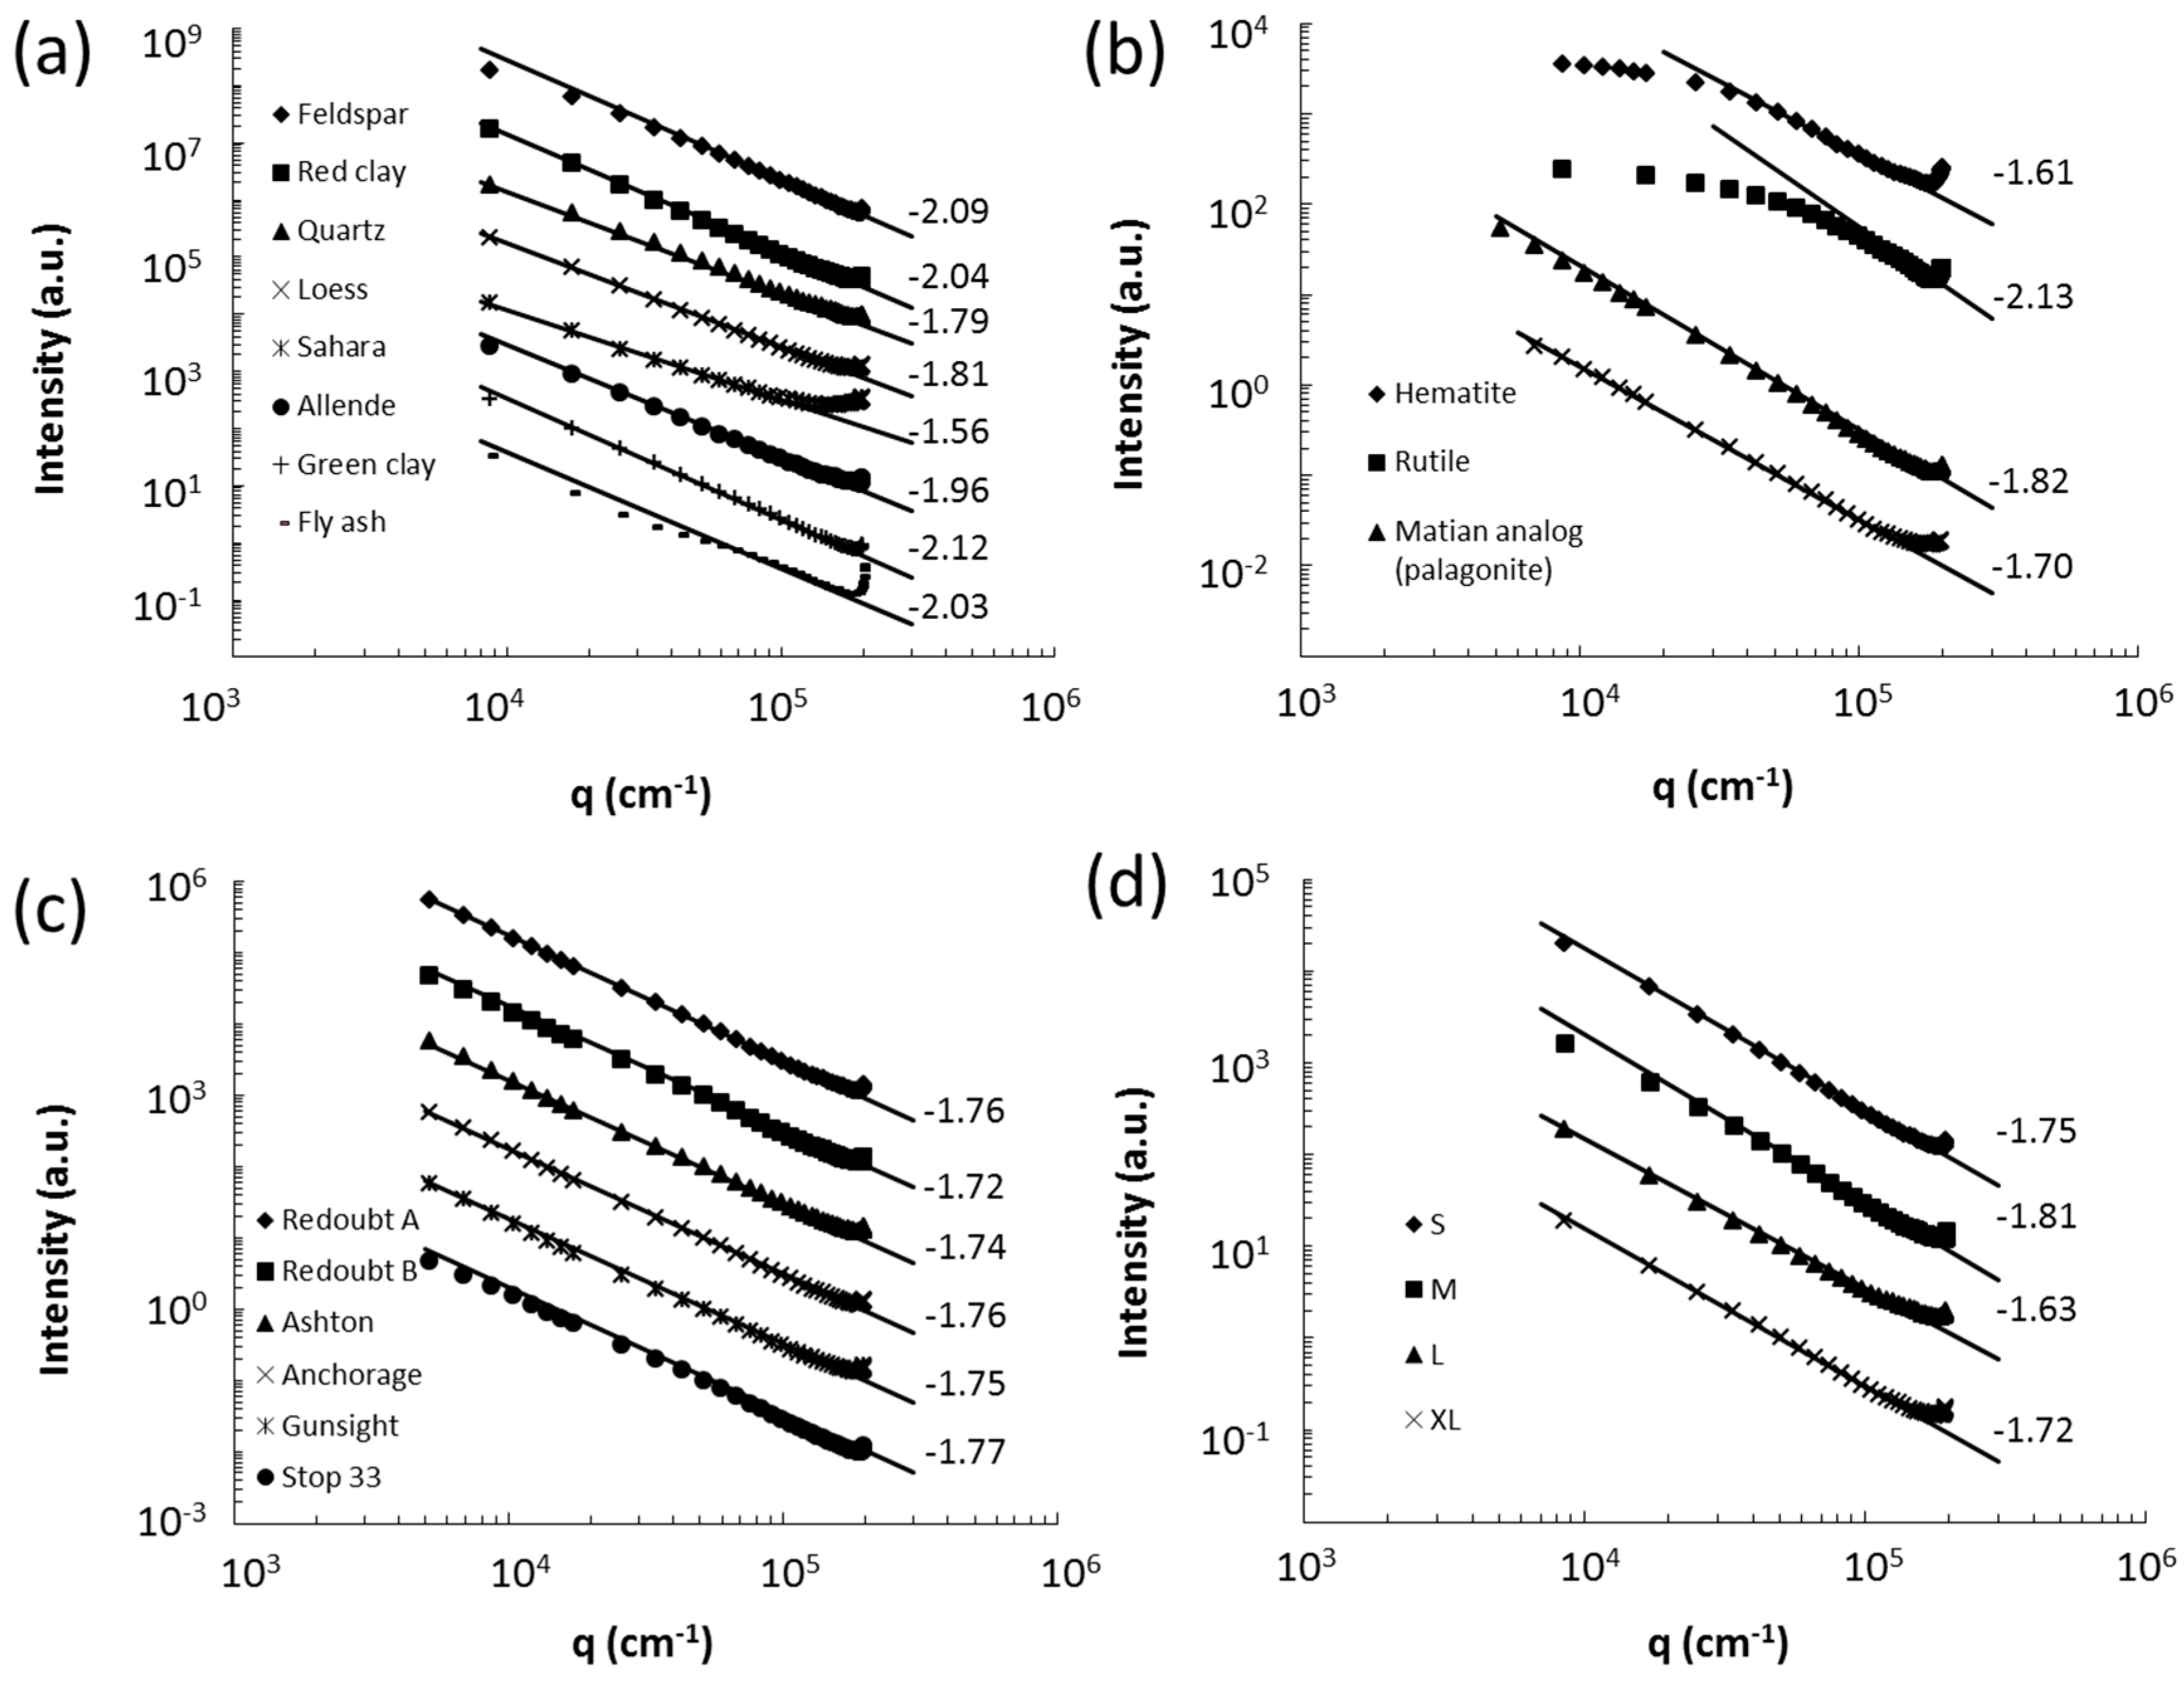
Our group [17] applied Q-space analysis to the entire Amsterdam-Granada data set; a total of 43 aerosol data sets available on the website. Examples are given in Figure 6. Remarkably, in all cases, Q-space analysis revealed plots with extensive linear regions hence very linear power laws with q. Very often enhanced back scattering was observed at large q. Some of the data showed at small q the onset of a Guinier regime. Power law exponents were in the range 1.49 to 2.47.
The most significant feature common to dusts and spheres is a power law regime. However, the power laws with spheres are complex, whereas the dusts display a single power law. Enhanced backscattering occurs for both, but again it is simple for dusts and complex for spheres. A forward scattering lobe and Guinier regimes are expected for dusts. A caveat to this comparison is that the dusts are very polydisperse, the consequences of which have not been explored.

3.1.2. Arizona Road Dust

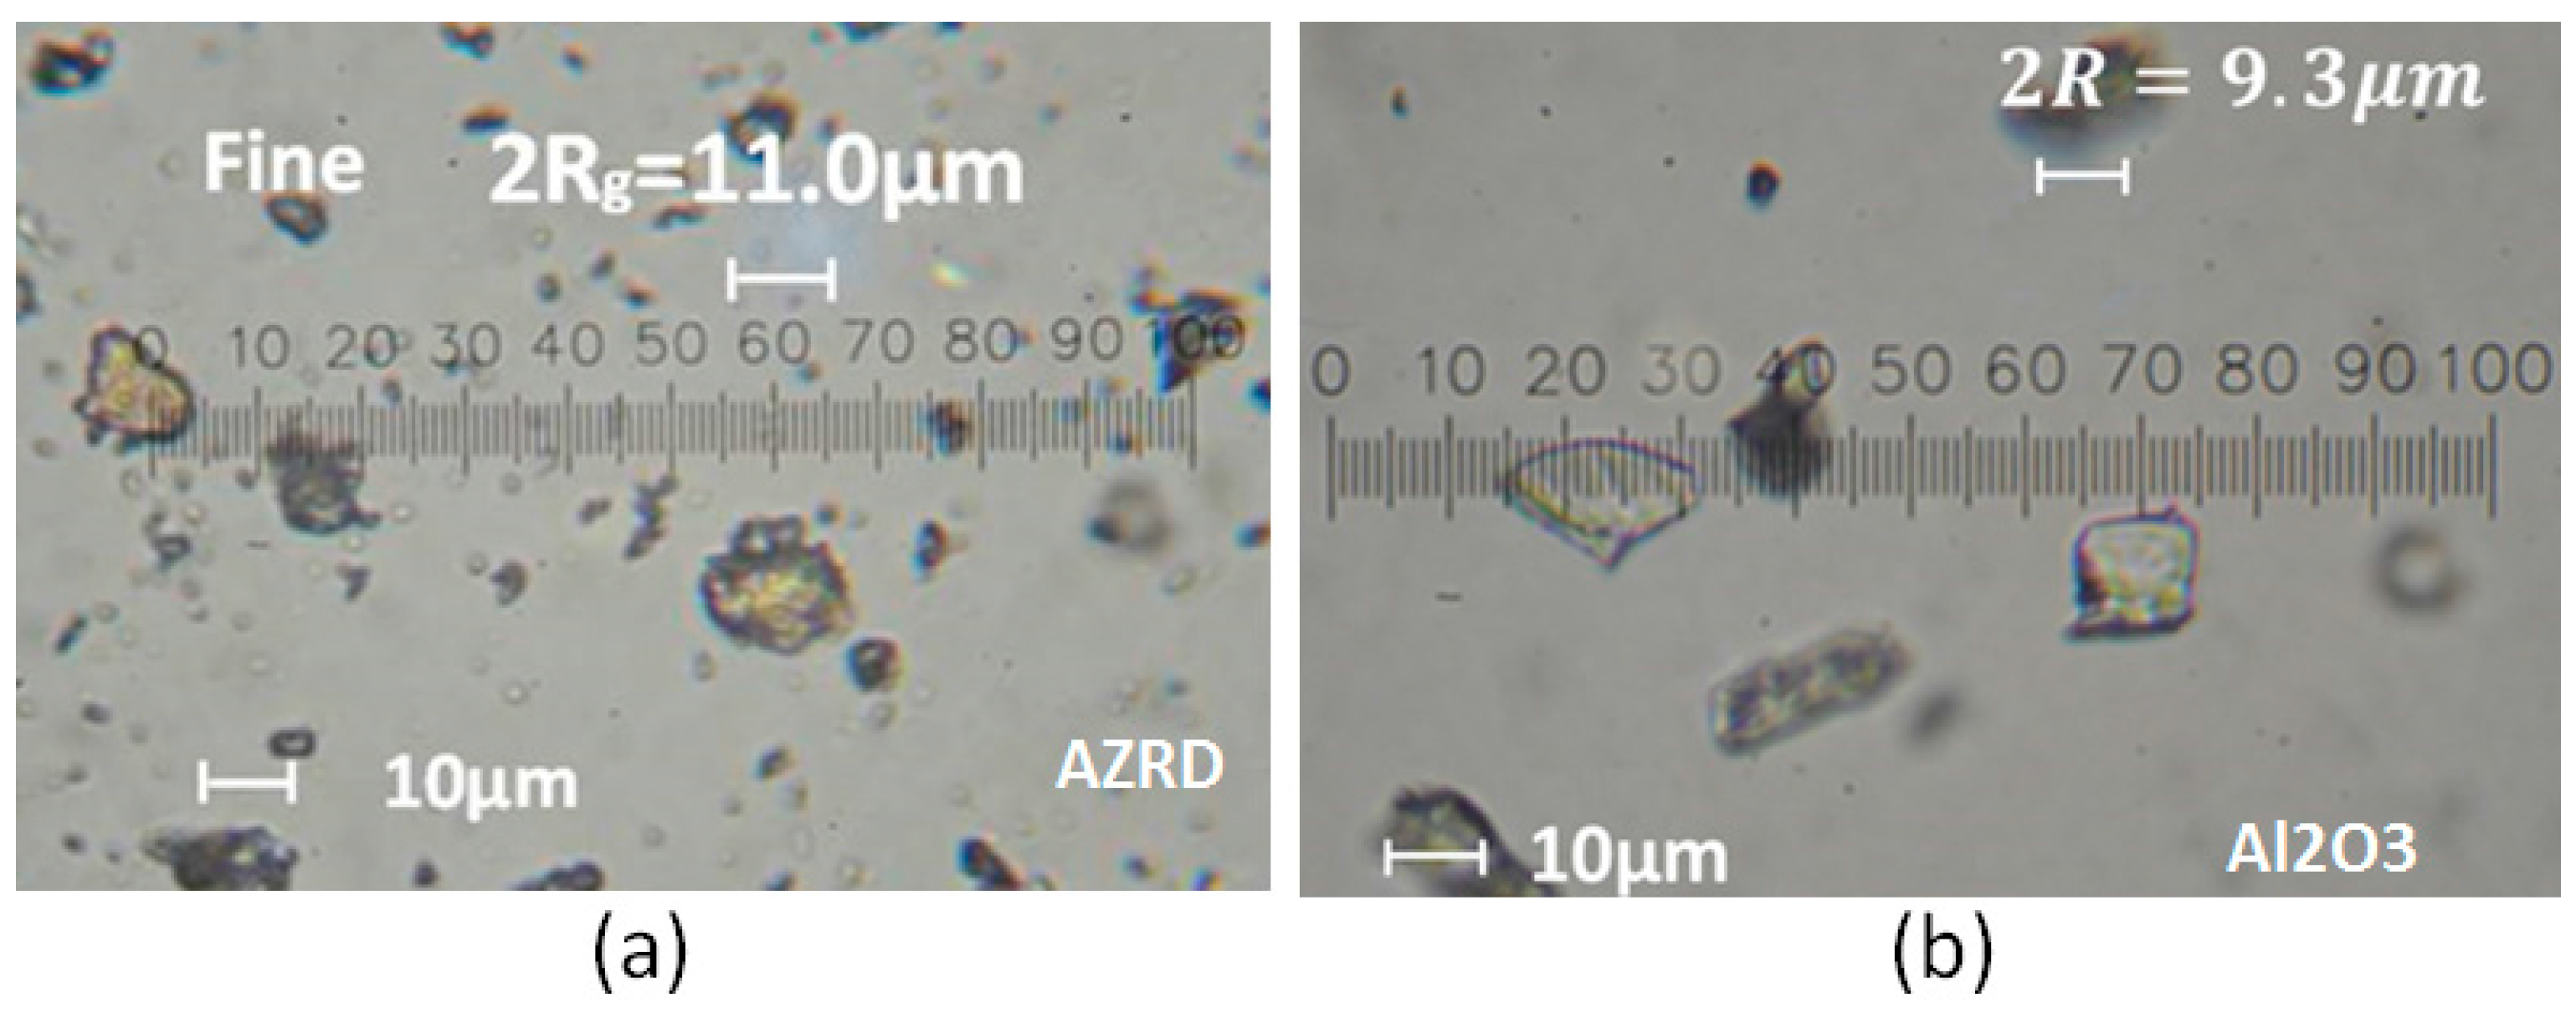
Our group conducted light scattering measurements on Arizona Road Dust (AZRD) over an angular range of 0.32 °   θ   157 ° at a wave length of 532 nm [25]. The scattering apparatus was specifically designed to have access to very small angles to obtain the Guinier regime for large particles. Figure 7a shows an optical microscope picture of the AZRD. Figure 7b shows an optical microscope picture of Al2O3 abrasive powders to be described below.
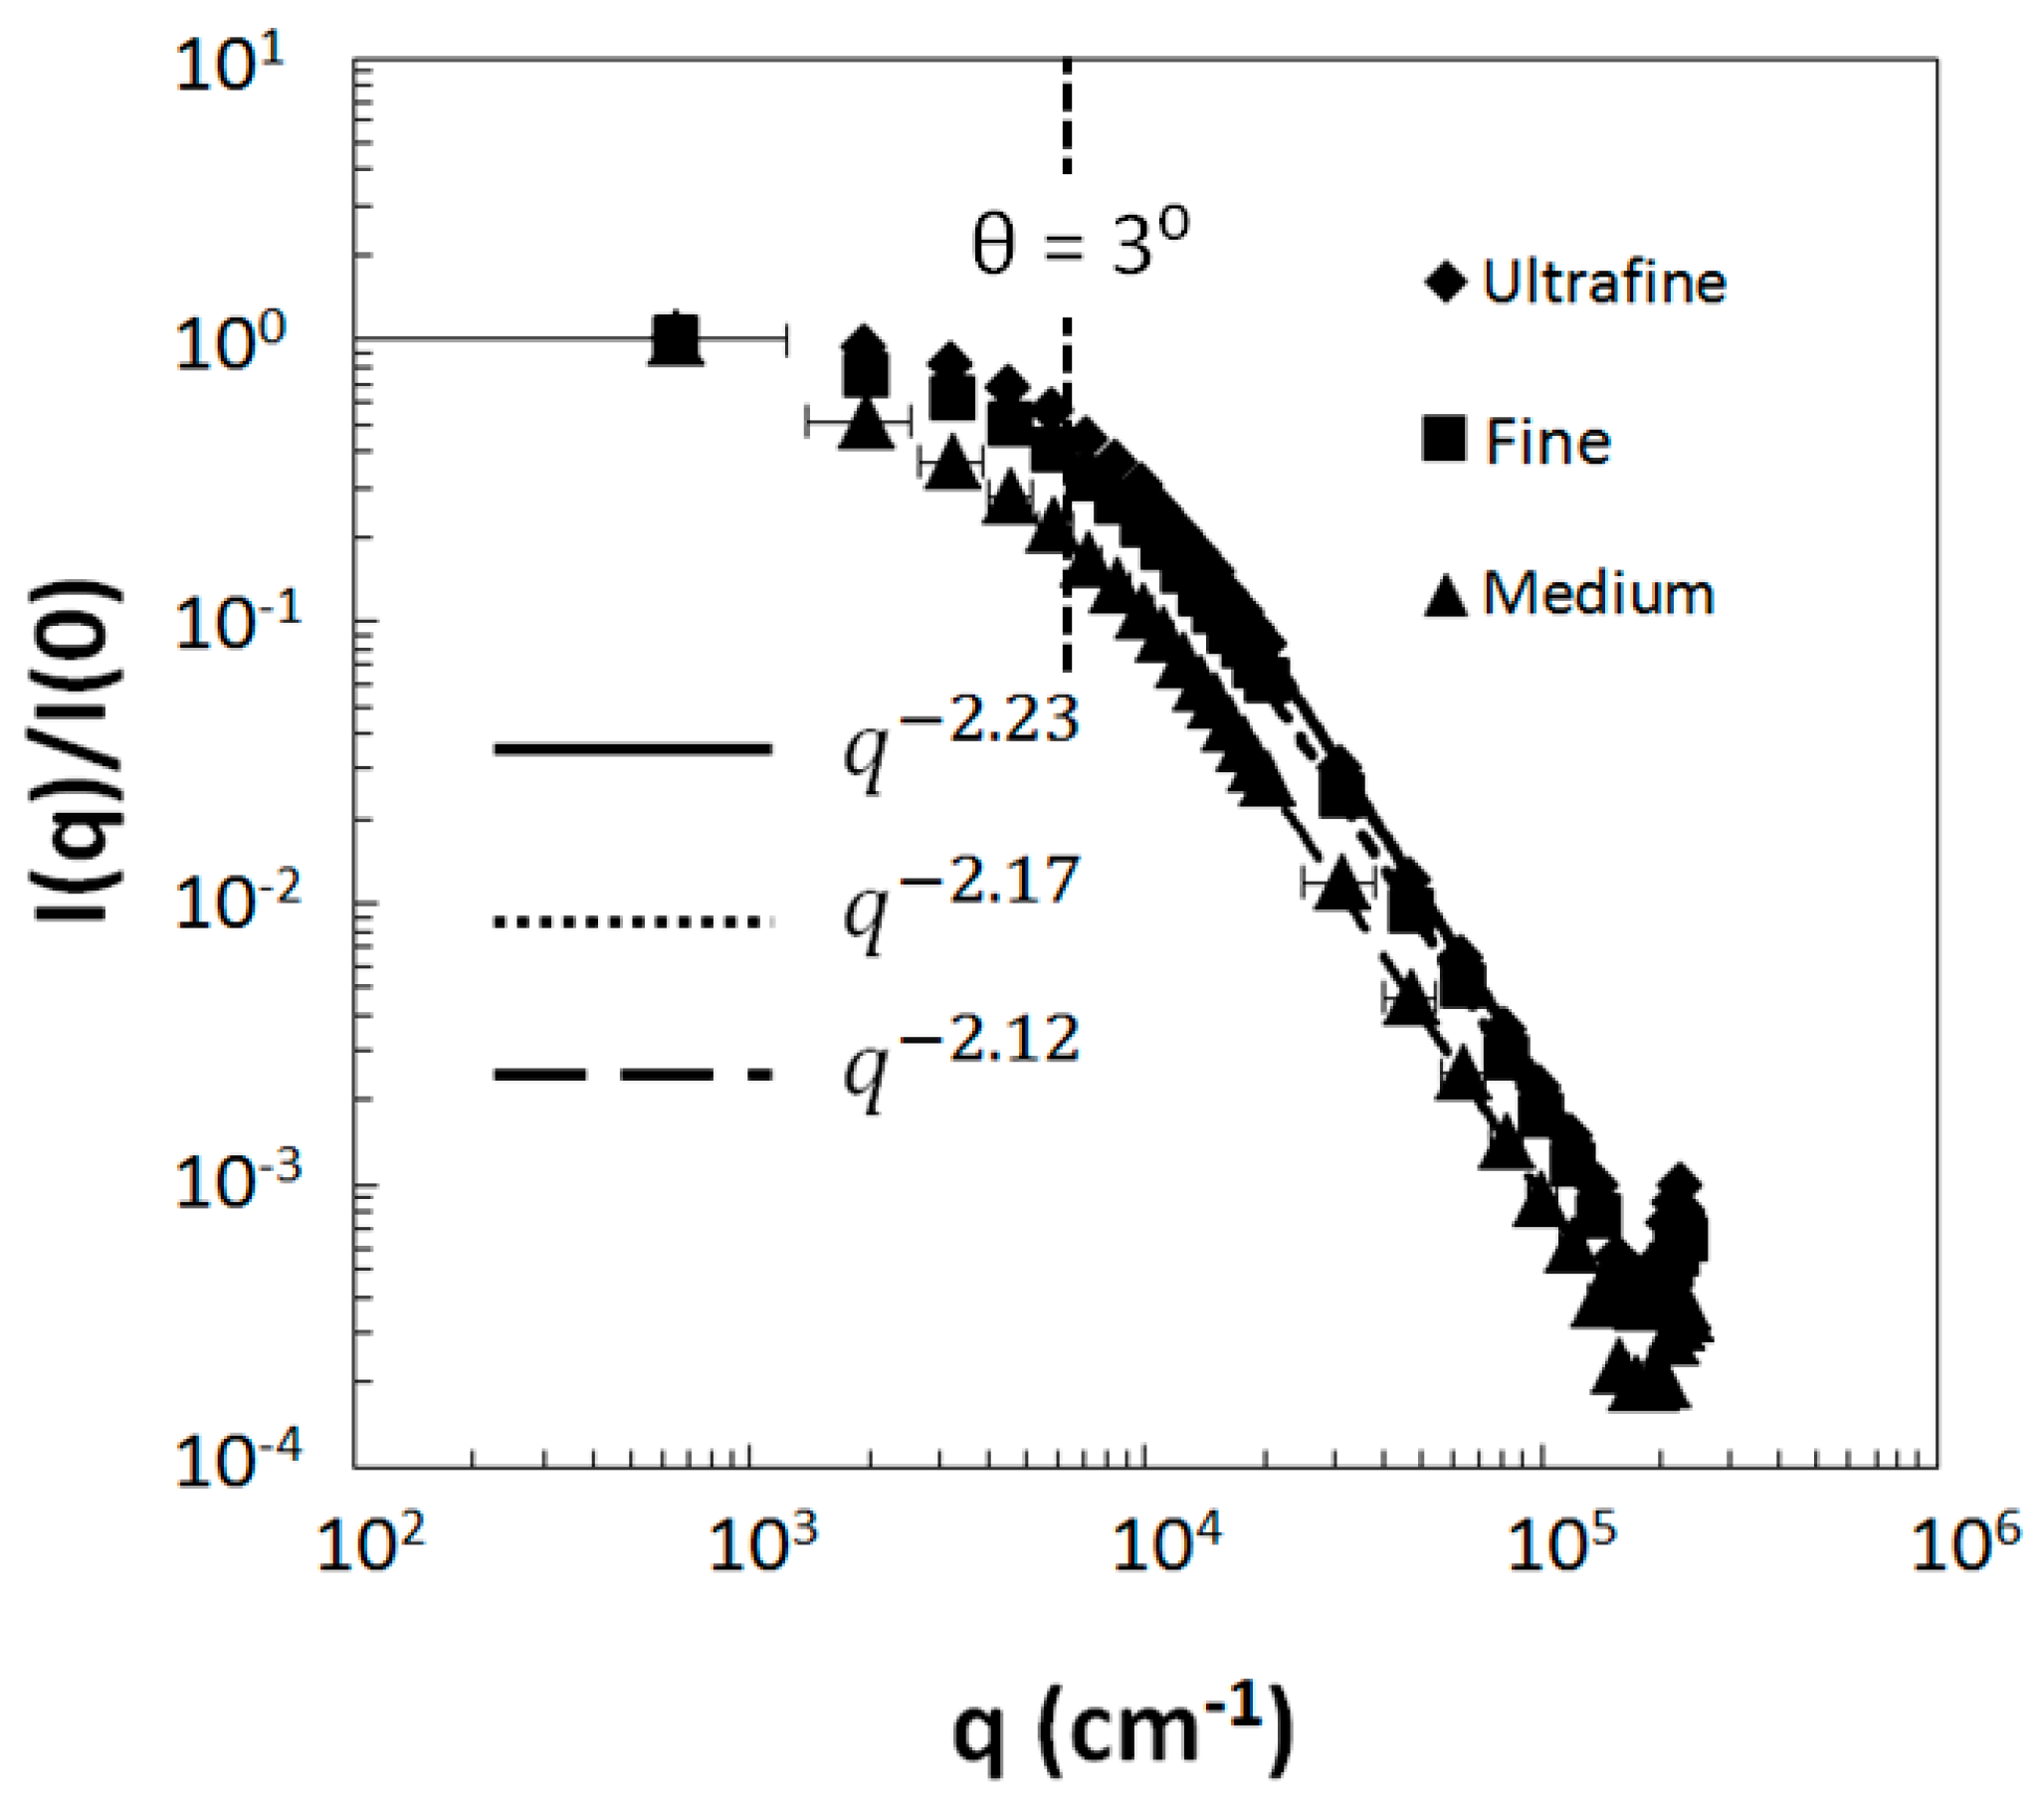
Figure 8 shows the Q-space analysis of the scattering. One sees a hint of a constant forward scattering lobe followed by a Guinier regime, a power law, and at largest q, enhanced backscattering. Note the importance of small angles to gain the Guinier regime for these micron size particles.
Analysis of the Guinier regime involved an iterative procedure, see [26]. That analysis yielded an estimate of mean radii of gyrations of 2.7 μm, 5.5 μm, and 9.7 μm for the Ultrafine, Fine, and Medium dust samples, respectively. These measurements were consistent with optical measurements of the mean particle size when weighted by the tendency of bigger particles to scatter more light proportional to the square of their mean effective radius. The power slopes yield exponent magnitudes of 2.23 , 2.17 , and 2.12 for the Ultrafine, Fine, and Medium dust samples, respectively, each with an error of ±0.05.
We now find that the Arizona Road Dusts and the dusts in the Amsterdam-Granada data set are similar and all show significant power law regimes. The AZRD also shows a Guinier regime and it is reasonable to conclude that the Amsterdam-Granada dust would too if light was collected at angles smaller than 3°. All the dusts show enhanced back scattering.

3.1.3. Al2O3 Abrasive Grits

Our group also studied light scattering by irregularly shaped Al2O3 abrasive powders of various grit sizes [26] with the same apparatus as for the AZRD. These grits were chosen because the size could be systematically varied with the grit number while the material and average shape remained the same. An optical microscope picture of the 600 grit size is given in Figure 7b.
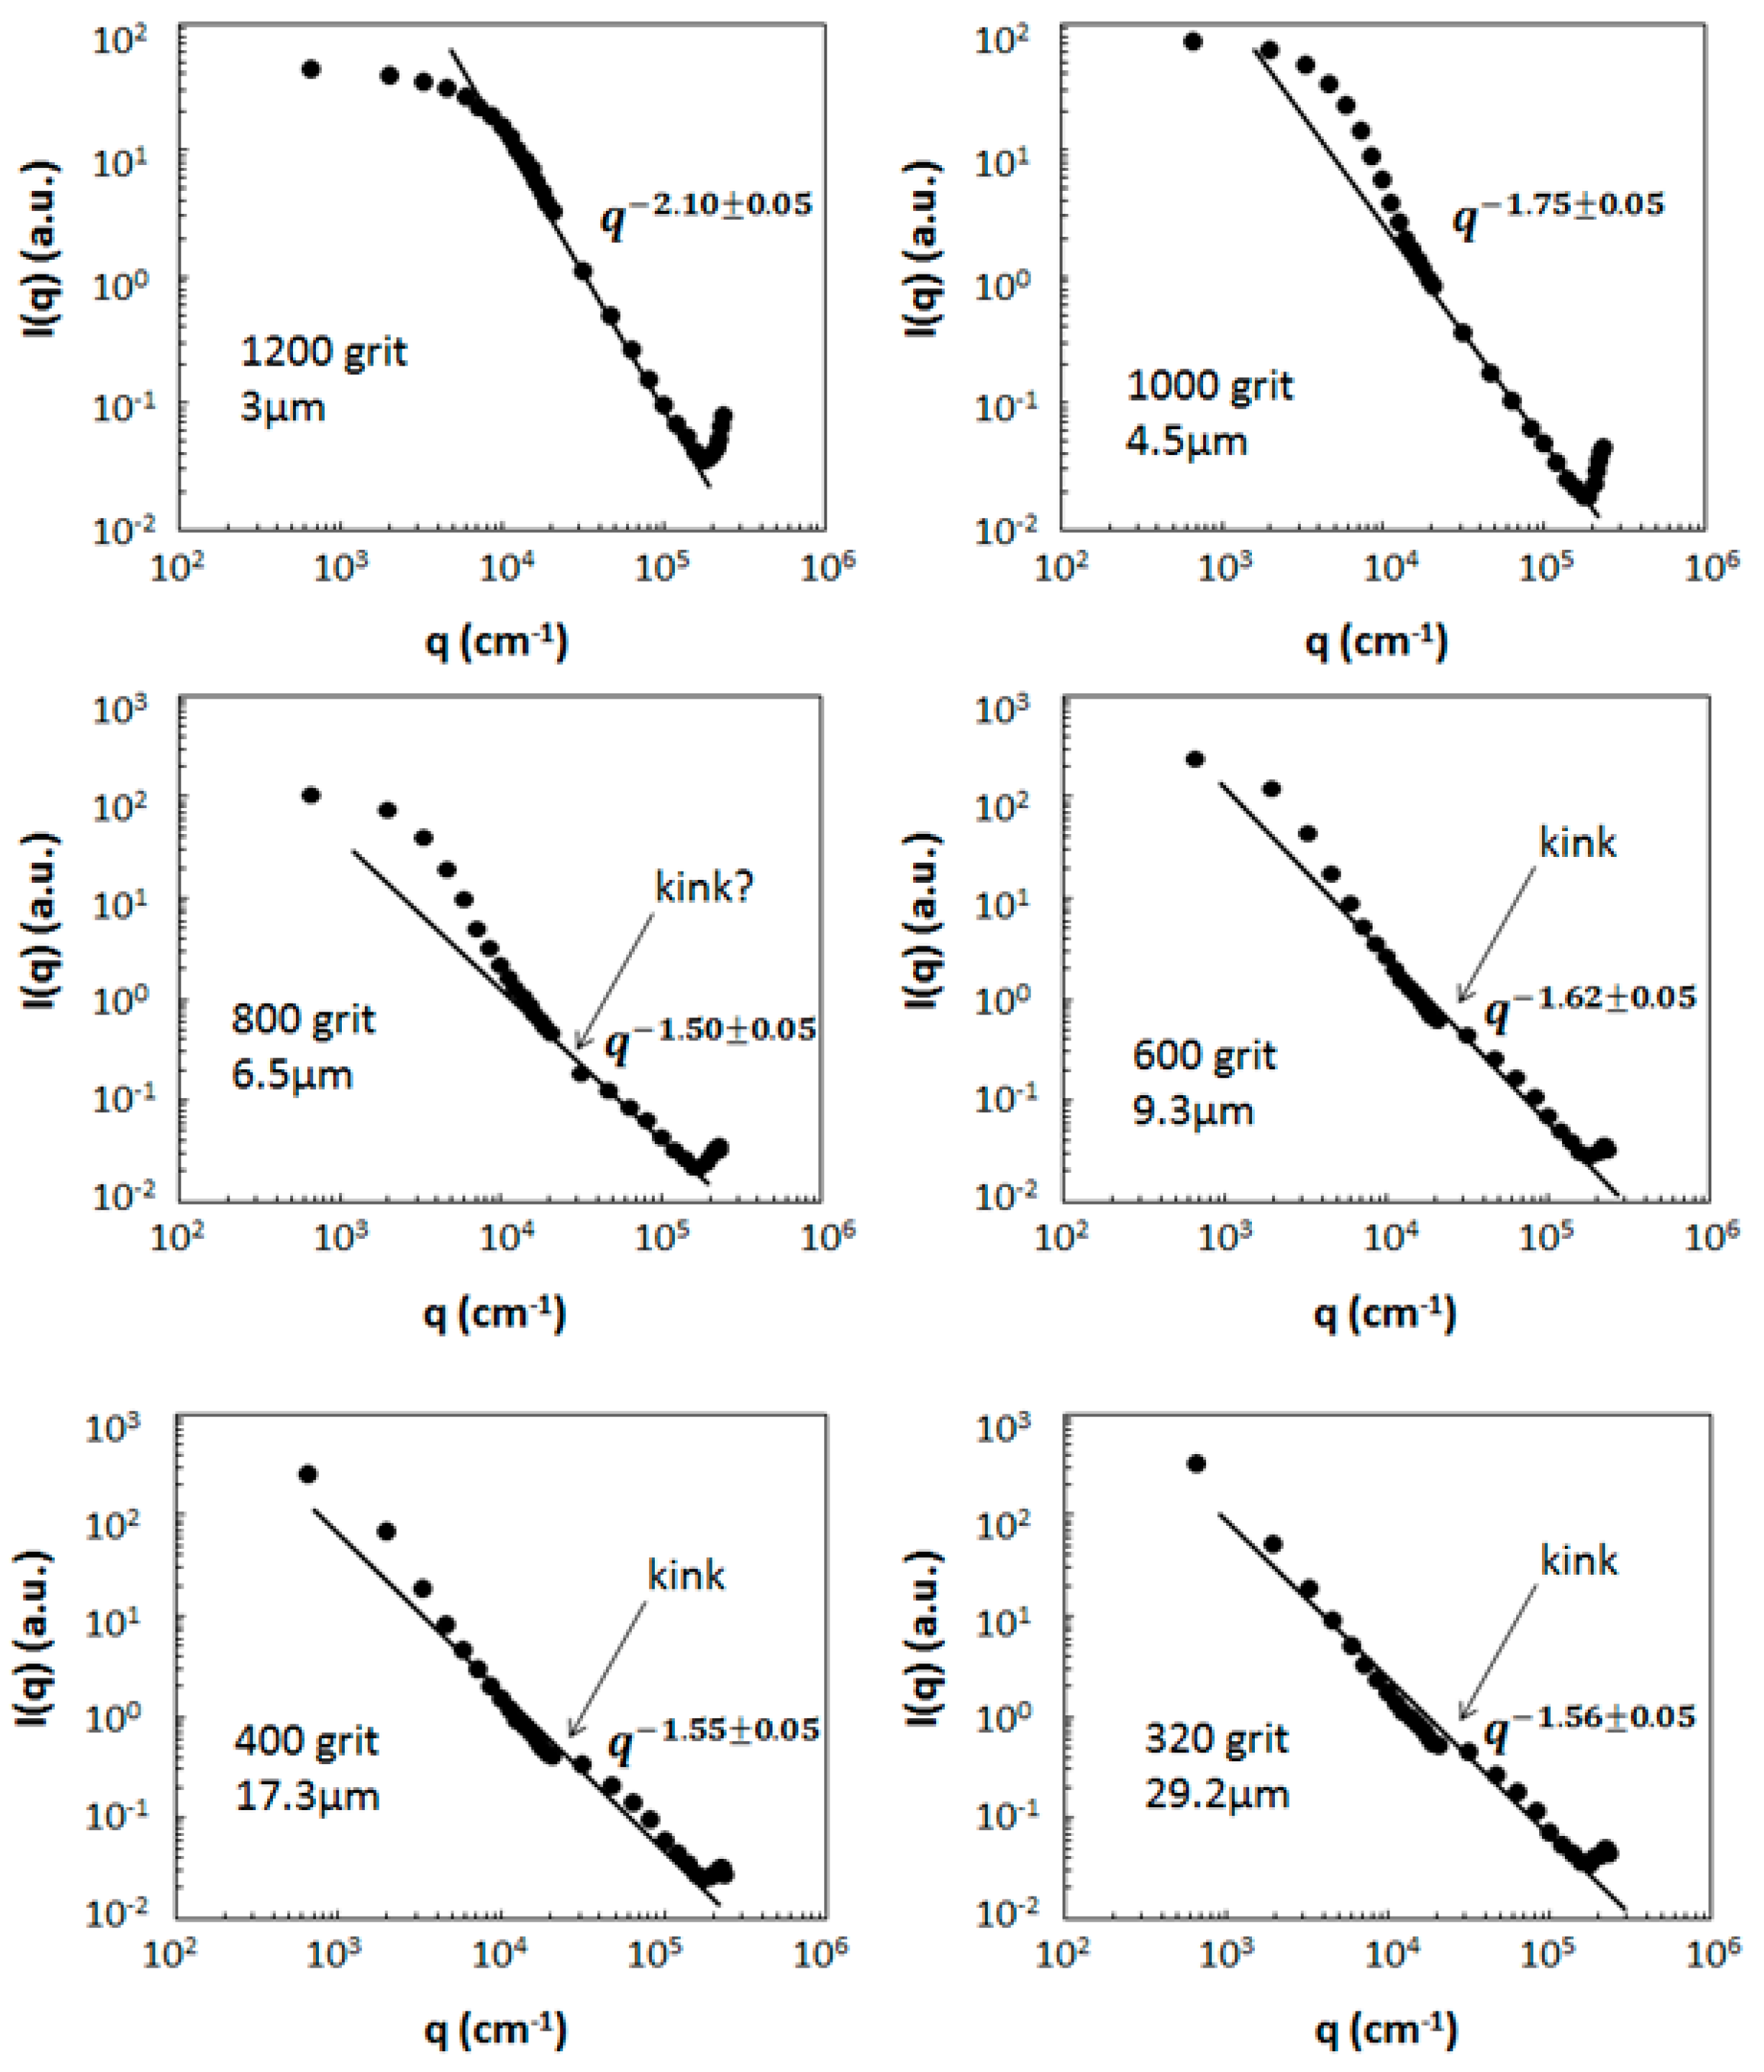
Figure 9 shows the Q-space analysis of the scattering for all six abrasive dusts studied. The scattering shows forward scattering, Guinier, power law, and enhanced backscattering regimes. The exponents of the power laws for Al2O3 abrasives decrease with increasing size.
The Guinier regime slips away as the size increases because the size crosses from smaller than the smallest measured q inversed to larger than the smallest measured q inversed. The smallest q is q = 6.6 × 102 cm−1 (at θ = 0.32°), thus q−1 = 15 μm. A rather convoluted analysis of the Guinier regime for the 1200, 1000, and 800 grits led to mean perimeter diameters of 5.2 µm, 8.4 µm, and 14.4 µm, respectively. These are about a factor of two bigger than the sizes claimed by the manufacturer and labeled in Figure 2. However, these measurements, although about a factor of two larger than the sizes claimed by the manufacturer, are consistent with these values when effects for light scattering weighting are included.
Similar to the Amsterdam-Granada and Arizona road dust particles, the abrasive grits show a power law regime. However, unlike the Amsterdam-Granada and Arizona road dust particles, the largest three abrasives, for which ρ 100 , show a kink in the power law. The reason for this kink is uncertain.

3.2. Fractal Aggregates

Fractal aggregates have scaling dimensions less than the Euclidean dimensions of space. Thus the mass scaling dimension is Dm < d and the surface scaling dimension is Ds < d − 1; where d is the spatial dimension, typically d = 3. Light scattering by fractal aggregates has been reviewed in 2001 [27]. Often the fractal aggregate structure is well described by the diffusion limited cluster-cluster aggregation (DLCA) model with a fractal dimension of D = Dm = Ds = 1.78.
Light scattering by fractal aggregates can be well described by the Rayleigh-Debye-Gans (RDG) limit although deviations on the order of tens of percent can occur [27]. This is also the diffraction limit where ρ → 0. This limit is obtained more so for lager aggregates because the overall density of the aggregate decreases with increasing size. This occurs because D = Dm < d, e.g., D = 1.78 < 3.
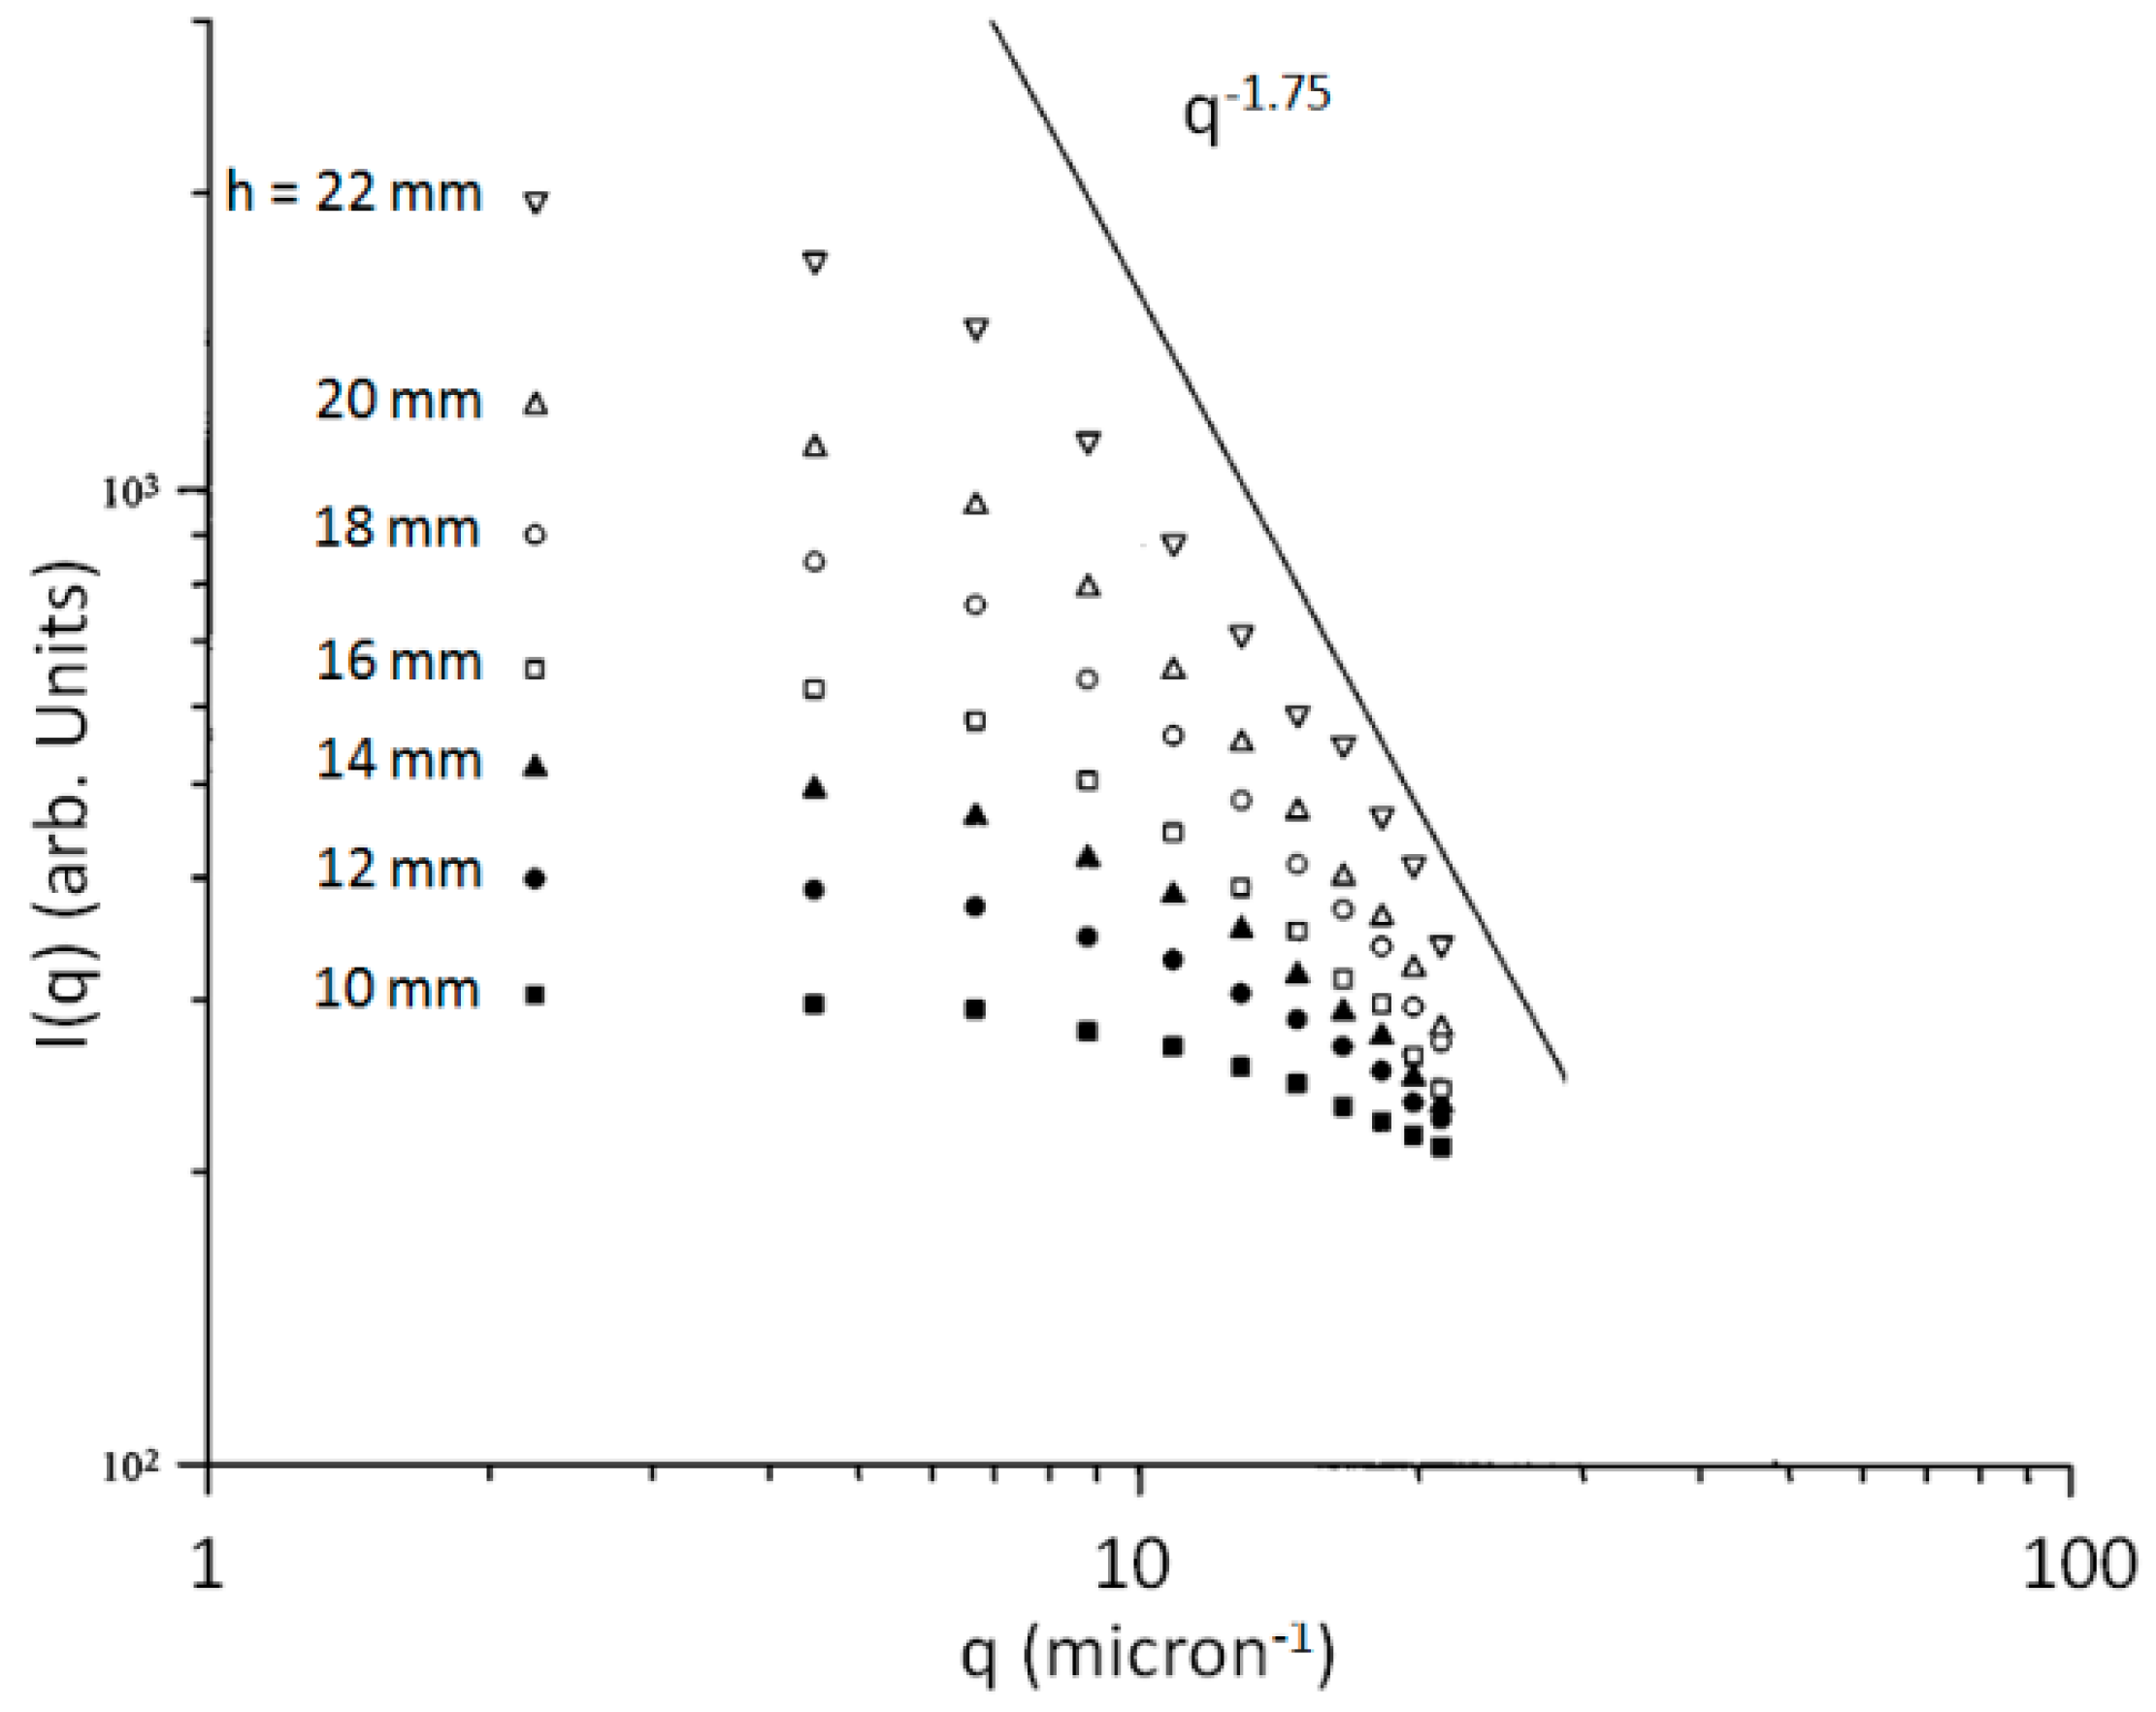
Figure 10 contains some early data from our lab showing light scattering from soot in a methane/oxygen premixed flame. The optical wavelength was λ = 514.5 nm. Soot is typically composed of roughly spherical monomers with diameters of approximately 30 nm. These monomers aggregate together via diffusion limited cluster-cluster aggregation to yield aggregates with the DLCA morphology and fractal dimension of D 1.78. The refractive index of soot is not precisely defined but is something like m = 1.6 + 0.6i. In our experiment, a flat flame burner with a circular porous frit and an overhead stagnation plate was used. Such a flame is quasi-one-dimensional so that the soot is uniform in the horizontal direction across the flame but grows in size due to aggregation with distance above the flame, the height above burner, h. One can see in Figure 10 that the scattering increases and the Guinier regime moves to smaller q with increasing h; both indicating growing aggregates.
Overall, one sees a constant forward scattering lobe at small q, followed by a Guinier regime and finally a developing power law regime at largest q. The power law is approaching q 1.75 to imply a fractal dimension of D = 1.75 for the soot aggregates in the flame. No enhanced backscattering is seen, but note that the maximum scattering angle used was 120°; hence such scattering could have been missed.

4. Theoretical Calculations

4.1. Spheroids

Mixtures of randomly oriented spheroids have been proposed as models for desert dust light scattering [29]. The spheroidal shape can be obtained by rotating an ellipse about either its major axis to yield a prolate spheroid or its minor axis to yield an oblate spheroid. Prolate spheroids are elongated balls like rugby balls, whereas oblates are squished balls like disks. If the axis of rotation has a semi-diameter of a, the spheroid will have two other semi-diameters that are equal to which we can assign a length of b. Then, the shape can be described by the aspect ratio f = a/b. If f > 1, the spheroid is prolate. If f < 1, the spheroid is oblate. If f = 1, the spheroid is a sphere.
Here, we present our initial studies of spheroidal particle light scattering analyzed via Q-space analysis. The orientationally averaged light scattered by the spheroids was calculated using a well-known and widely tested T-matrix (TM) code found freely available on NASA’s Goddard Institute website [30,31]. Indices of refraction were m = 1.3 ,   1.4 ,   1.5 and volume equivalent radii, R v e q , were in the range 1   μ m to 6   μ m . The wavelength was λ = 0.532   μ m . The structure factor was calculated with a numerical Fourier transform.
For many of these non-spherical shapes it was found that the normalization by spherical particle Rayleigh scattering, Equation (2), and use of the spherical particle internal coupling parameter, Equation (4), was insufficient to achieve a good description of the scattering in Q-space. This occurs because these equations strictly hold only for spheres. Recently we have generalized these equations for non-spherical shapes [32]. The results apply to orientationally averaged scattering which is the most common situation in practice. Briefly, in general, the Rayleigh differential cross section for any shape is [4]
d C s c a ,   R a y / d Ω = k 4 V 2 | α ( m ) | 2
In Equation (7), V is the volume of the particle and α ( m ) the average volume polarizability, which is a function of the complex index of refraction m with functionality dependent upon shape. The same reformulation led to a general definition of the internal coupling for any arbitrary shape as
ρ = 2 π k V A   α ( m )
where A is the projected area of the scattering object in the direction of the incident light.
To calculate | α ( m ) | for an arbitrary shape, the discrete dipole approximation (DDA) was used [33]. In DDA the index m, volume V, wavelength λ and thus k and arbitrary shape are set; DDA then calculates the differential scattering cross-section. Equation (7) implies that a plot of this scattering cross-section divided by k4 versus V2 has a slope of | α ( m ) | 2 .
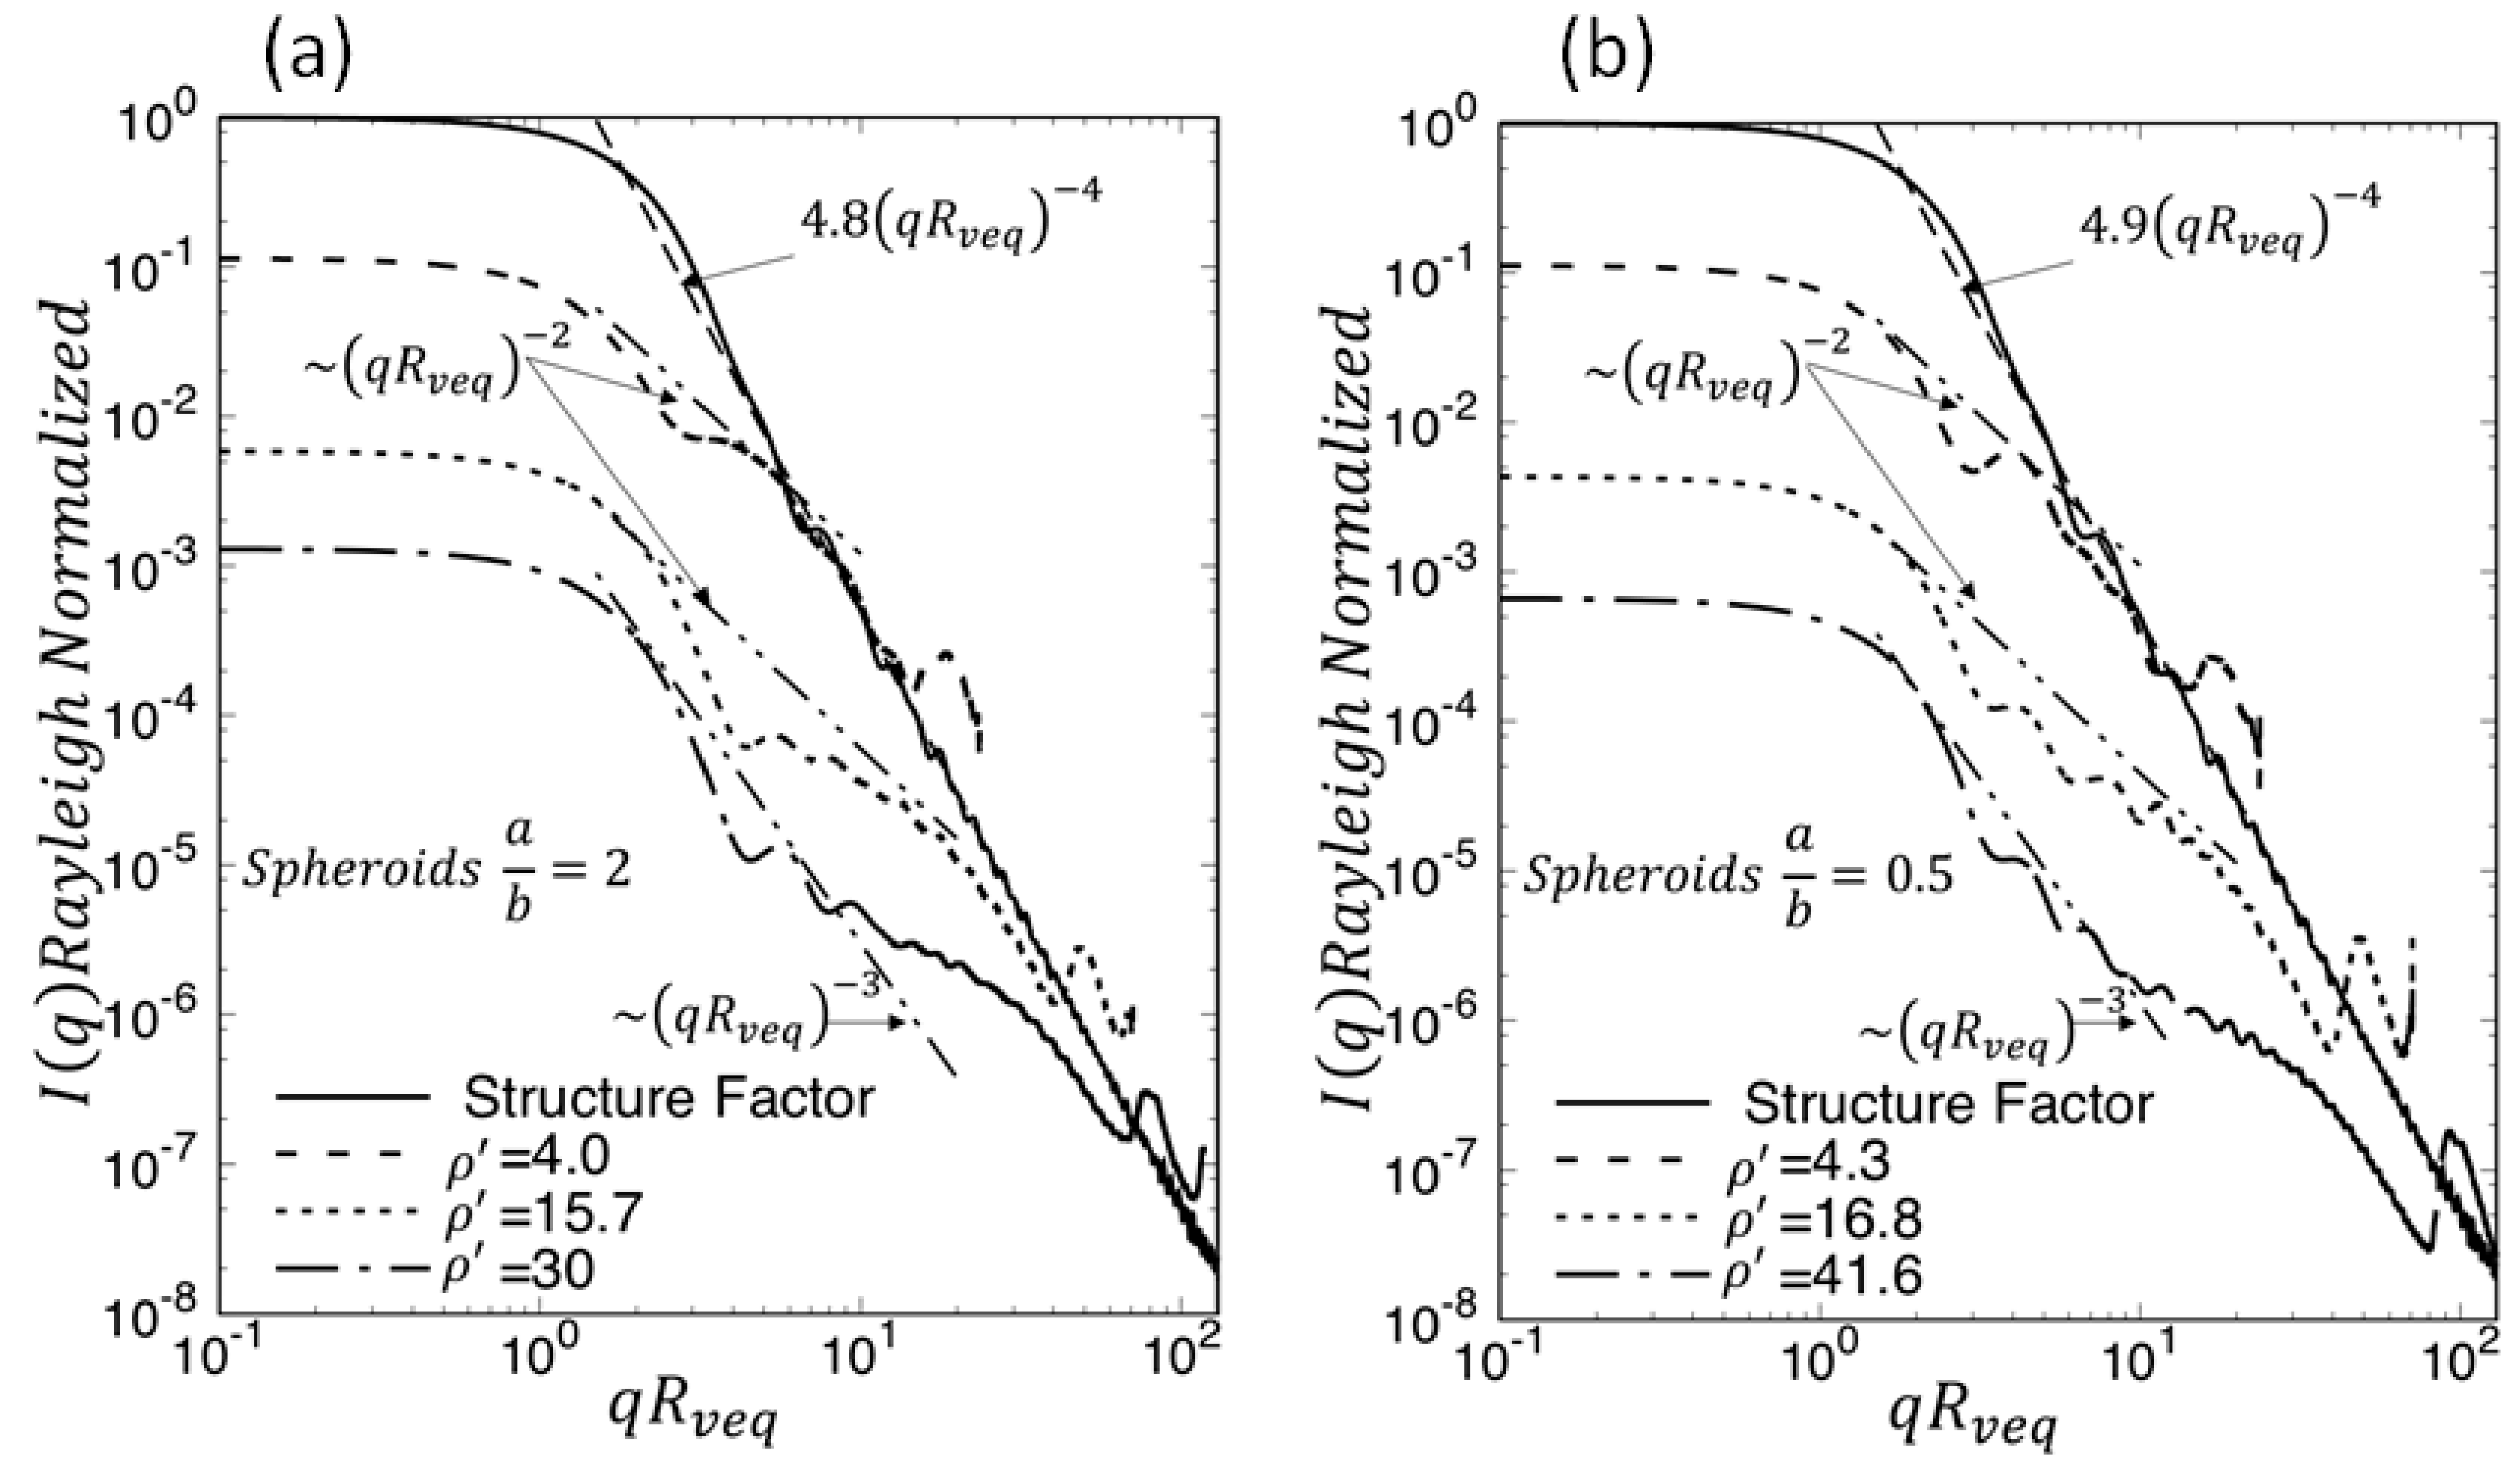
The Rayleigh normalization and ρ for spheroids used this newly developed method. Figure 11 shows scattering for prolate and oblate spheroids with two-to-one aspect ratios. Comparison to Figure 1 for spheres shows very strong similarities. Although we do not present here an explicit analysis of the forward scattering, one can quantitatively verify from Figure 11 and the values of ρ that feature 7 holds for these spheroids. All eight of the features for spheres listed above are present for spheroids.

4.2. Irregular Spheres

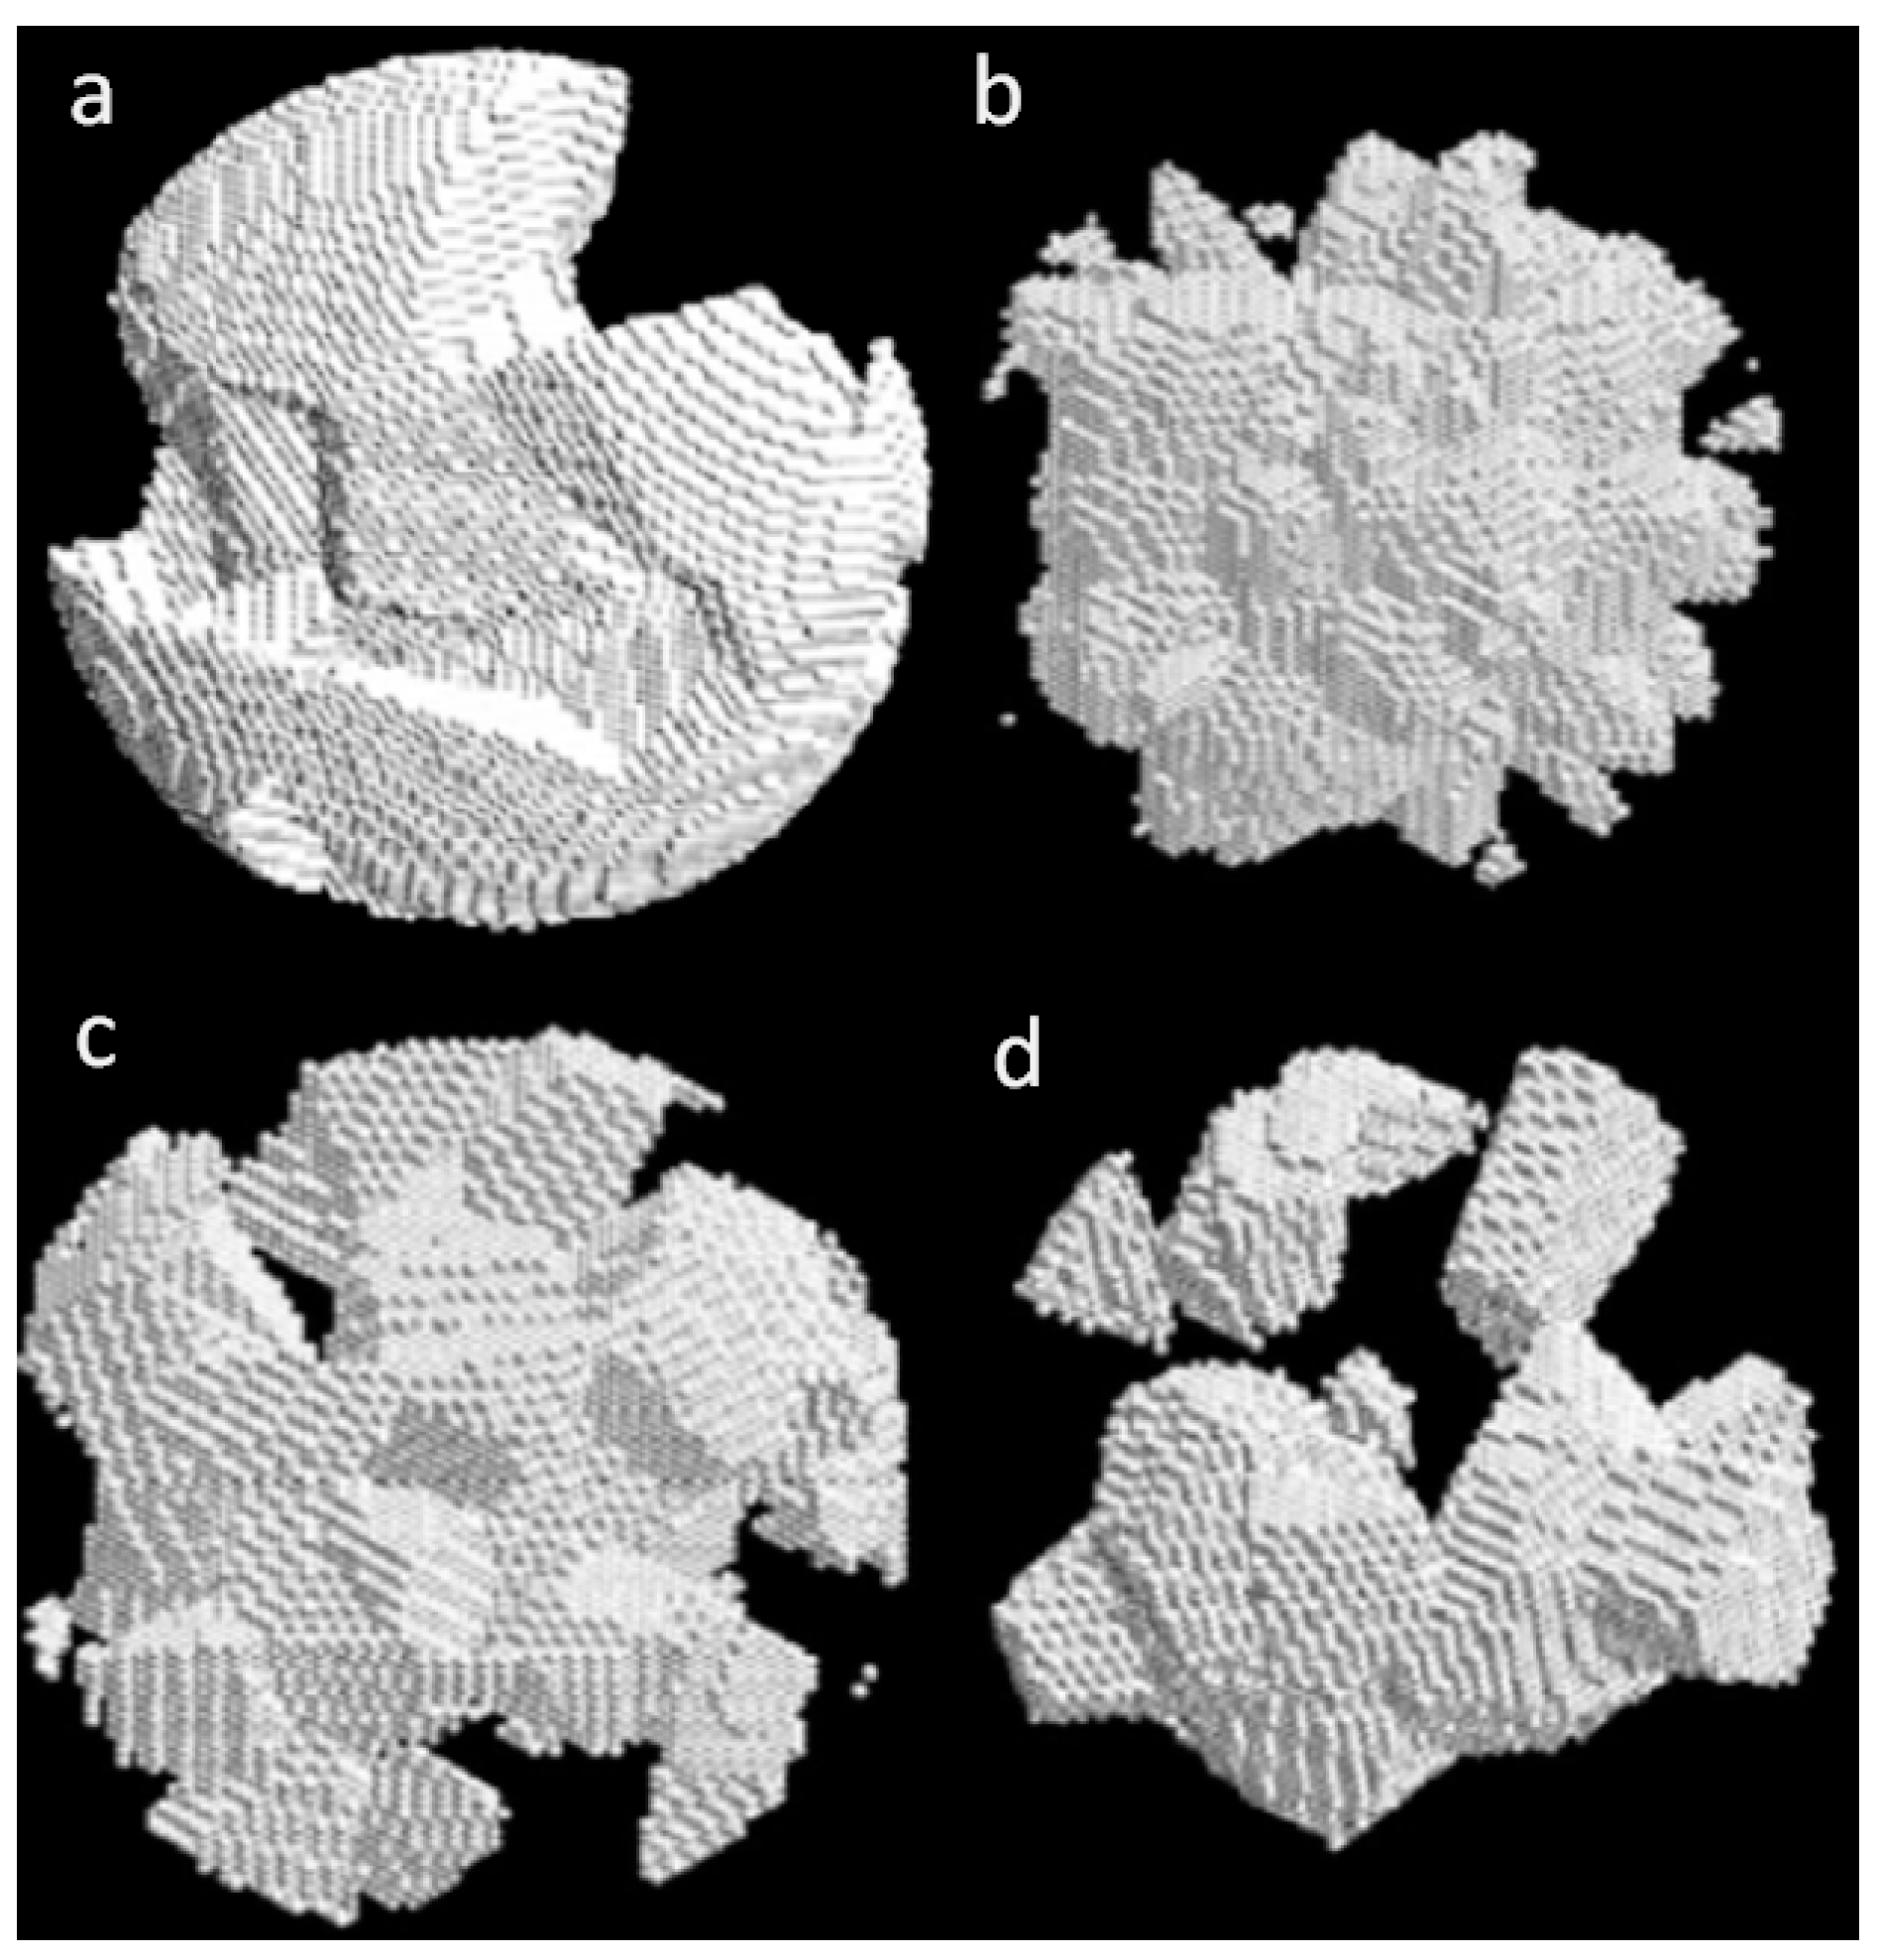
Our group has applied Q-space analysis to irregular spheres [34]. These were created with an algorithm that started with a sphere and then perturbed it in various ways [35,36,37]. Four different types of irregular spheres were produced: strongly damaged spheres, rough surface spheres, pocked spheres, and agglomerated debris particles, and their family portrait is in Figure 12. For each type, three refractive indices were used: m = 1.313, 1.5 + 0.1i and 1.6 + 0.0005i. The size parameter kR ranged from 2 to 14 with steps of 2. For a wavelength of 0.532 μm, these values correspond to radii of R = 0.17 to 1.2 μm.
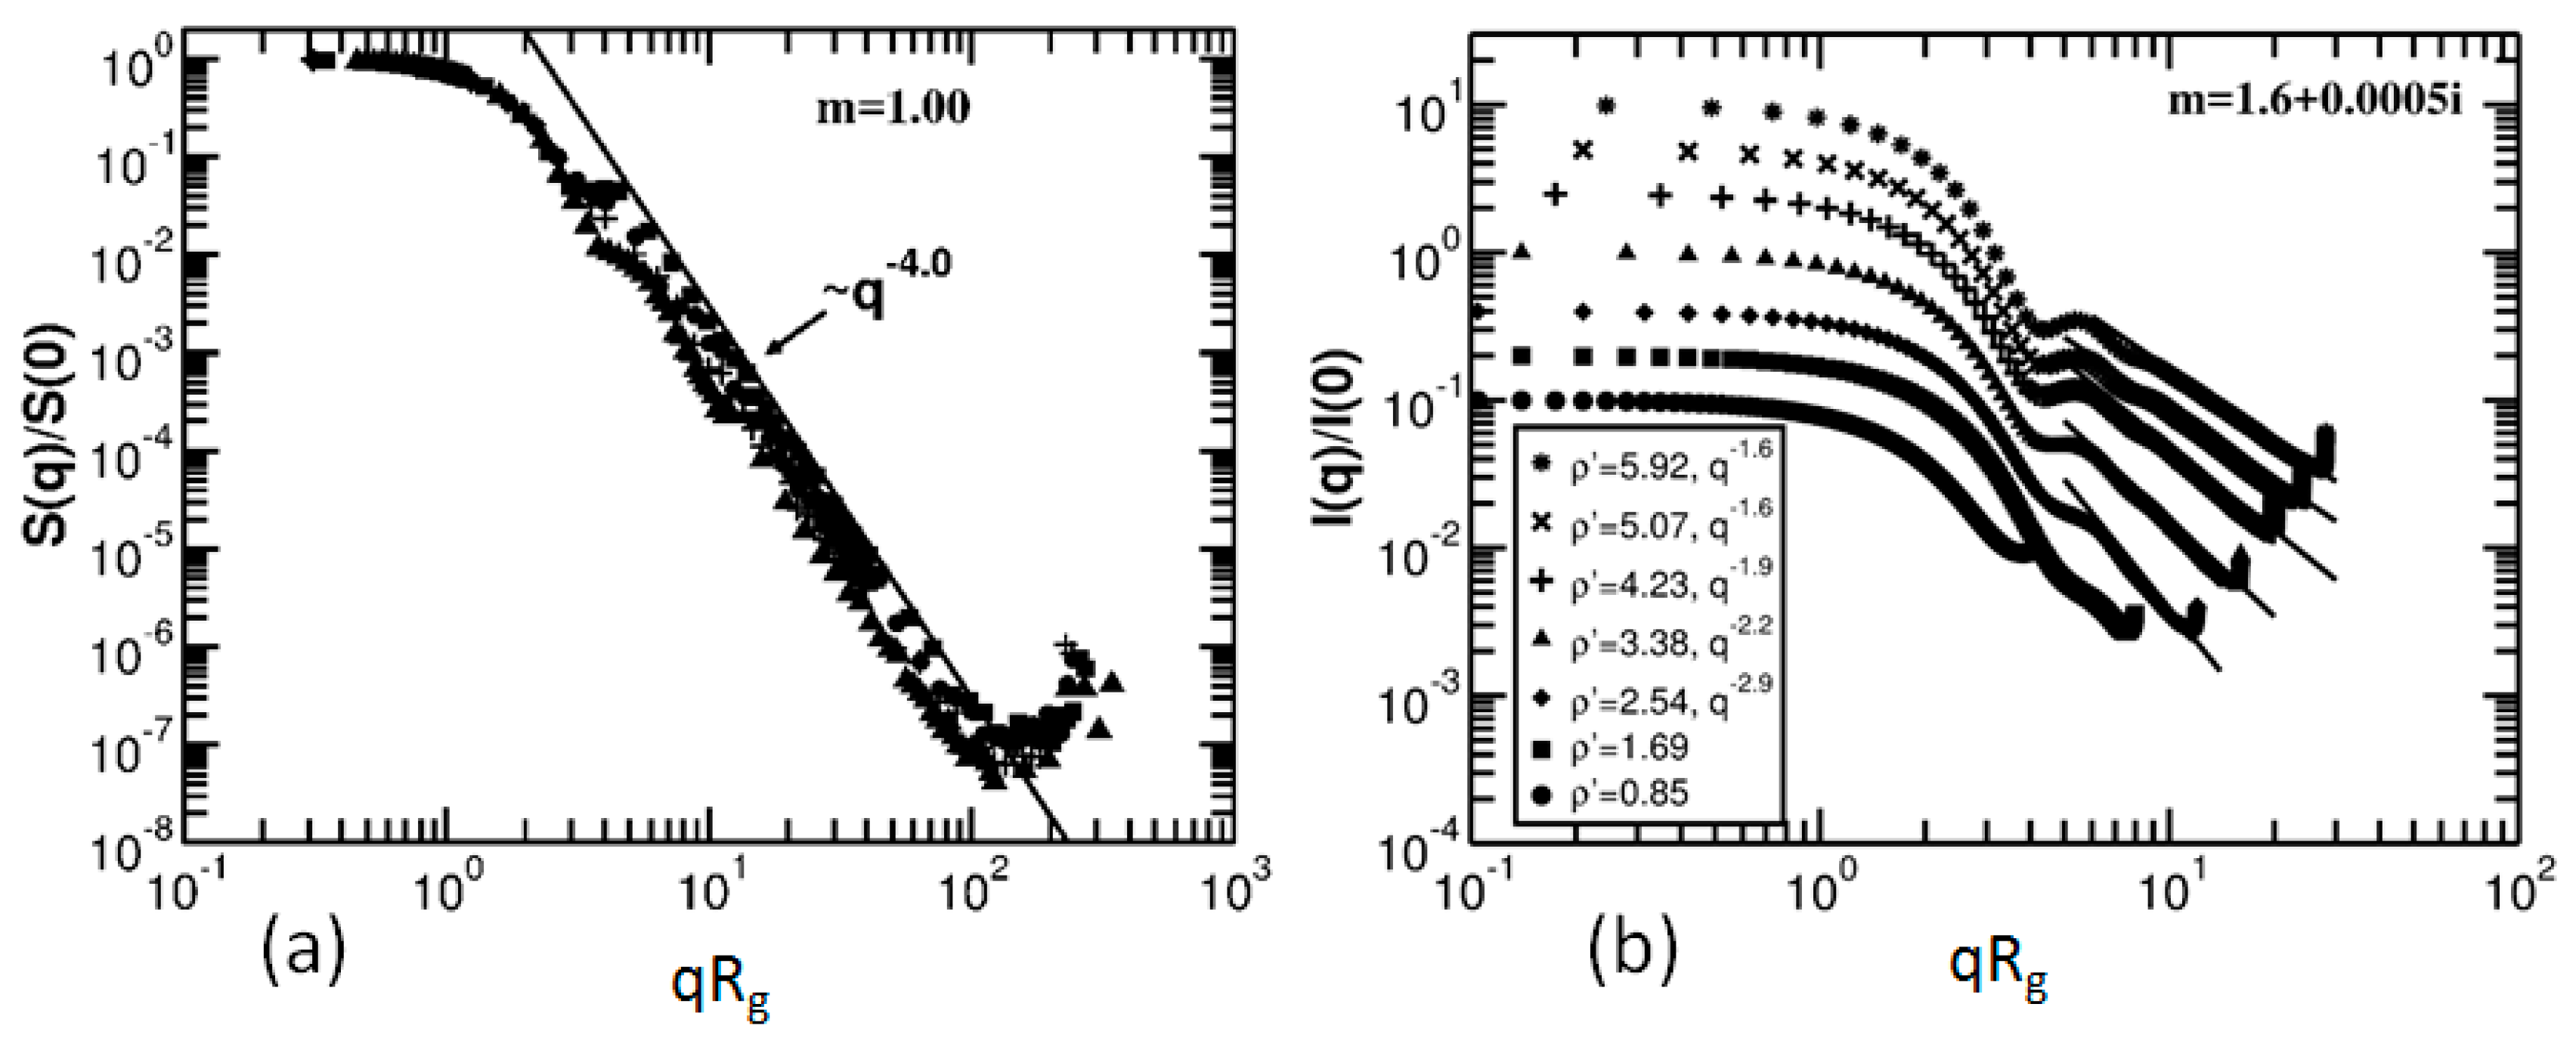
Figure 13 shows a Q-space analysis of the scattering by agglomerated debris particles [34] calculated via DDA [38,39,40]. Before we deal with the light scattering, note that the plot, Figure 13a, displays the structure factor, S(q), of the particle. The structure factor can be described in a few equivalent ways: it is the square of the Fourier transform of the particle’s structure; it is the diffraction pattern for waves emanating from the particle; and it is the m 1.00 limit, hence ρ = 0 limit, for the light scattering from the particle. The structure factor shows a forward scattering lobe, a Guinier regime, and a power law regime. The apparent enhanced backscattering is consequence of the real space cubic lattice spacing of approximately Rg/100 that the real space particle was represented on and hence of no consequence. The power law regime has an exponent of −4. When dealing with structure factors, the power law regime is usually referred to as the Porod regime [9] and the exponent is—(d + 1) where d is the spatial dimension of the particle, typically d = 3. More generally, the Porod regime exponent is—(2DmDs) where Dm and Ds are the mass and surface scaling dimensions of the particle, respectively [41]. We can conclude that the particle has scaling dimensions of Dm = 3 and Ds = 2.
Figure 13b shows the orientationally averaged scattered light intensity for a refractive index of m = 1.6 + 0.0005i for seven different size parameters hence seven different internal coupling parameters as marked. In this work the spherical forms for the Rayleigh scattering and internal coupling parameter were used. These finite refractive indices change the ρ = 0 structure factor in the Porod regime. The power law remains for about one order of magnitude in qR, but the slope decrease with increasing size parameter kR. This occurs as the internal coupling parameter ρ increasing from less than one to nearly six, and we infer that the increased internal coupling is the cause of the Porod regime slope change. Similar results were obtained for pocked and strongly damaged spheres, but the power law regime for the rough spheres had strong ripples that masked any possible power law. Another feature is the occurrence of some enhanced backscattering with increasing ρ . Finally, note the dip near qR 3.5.
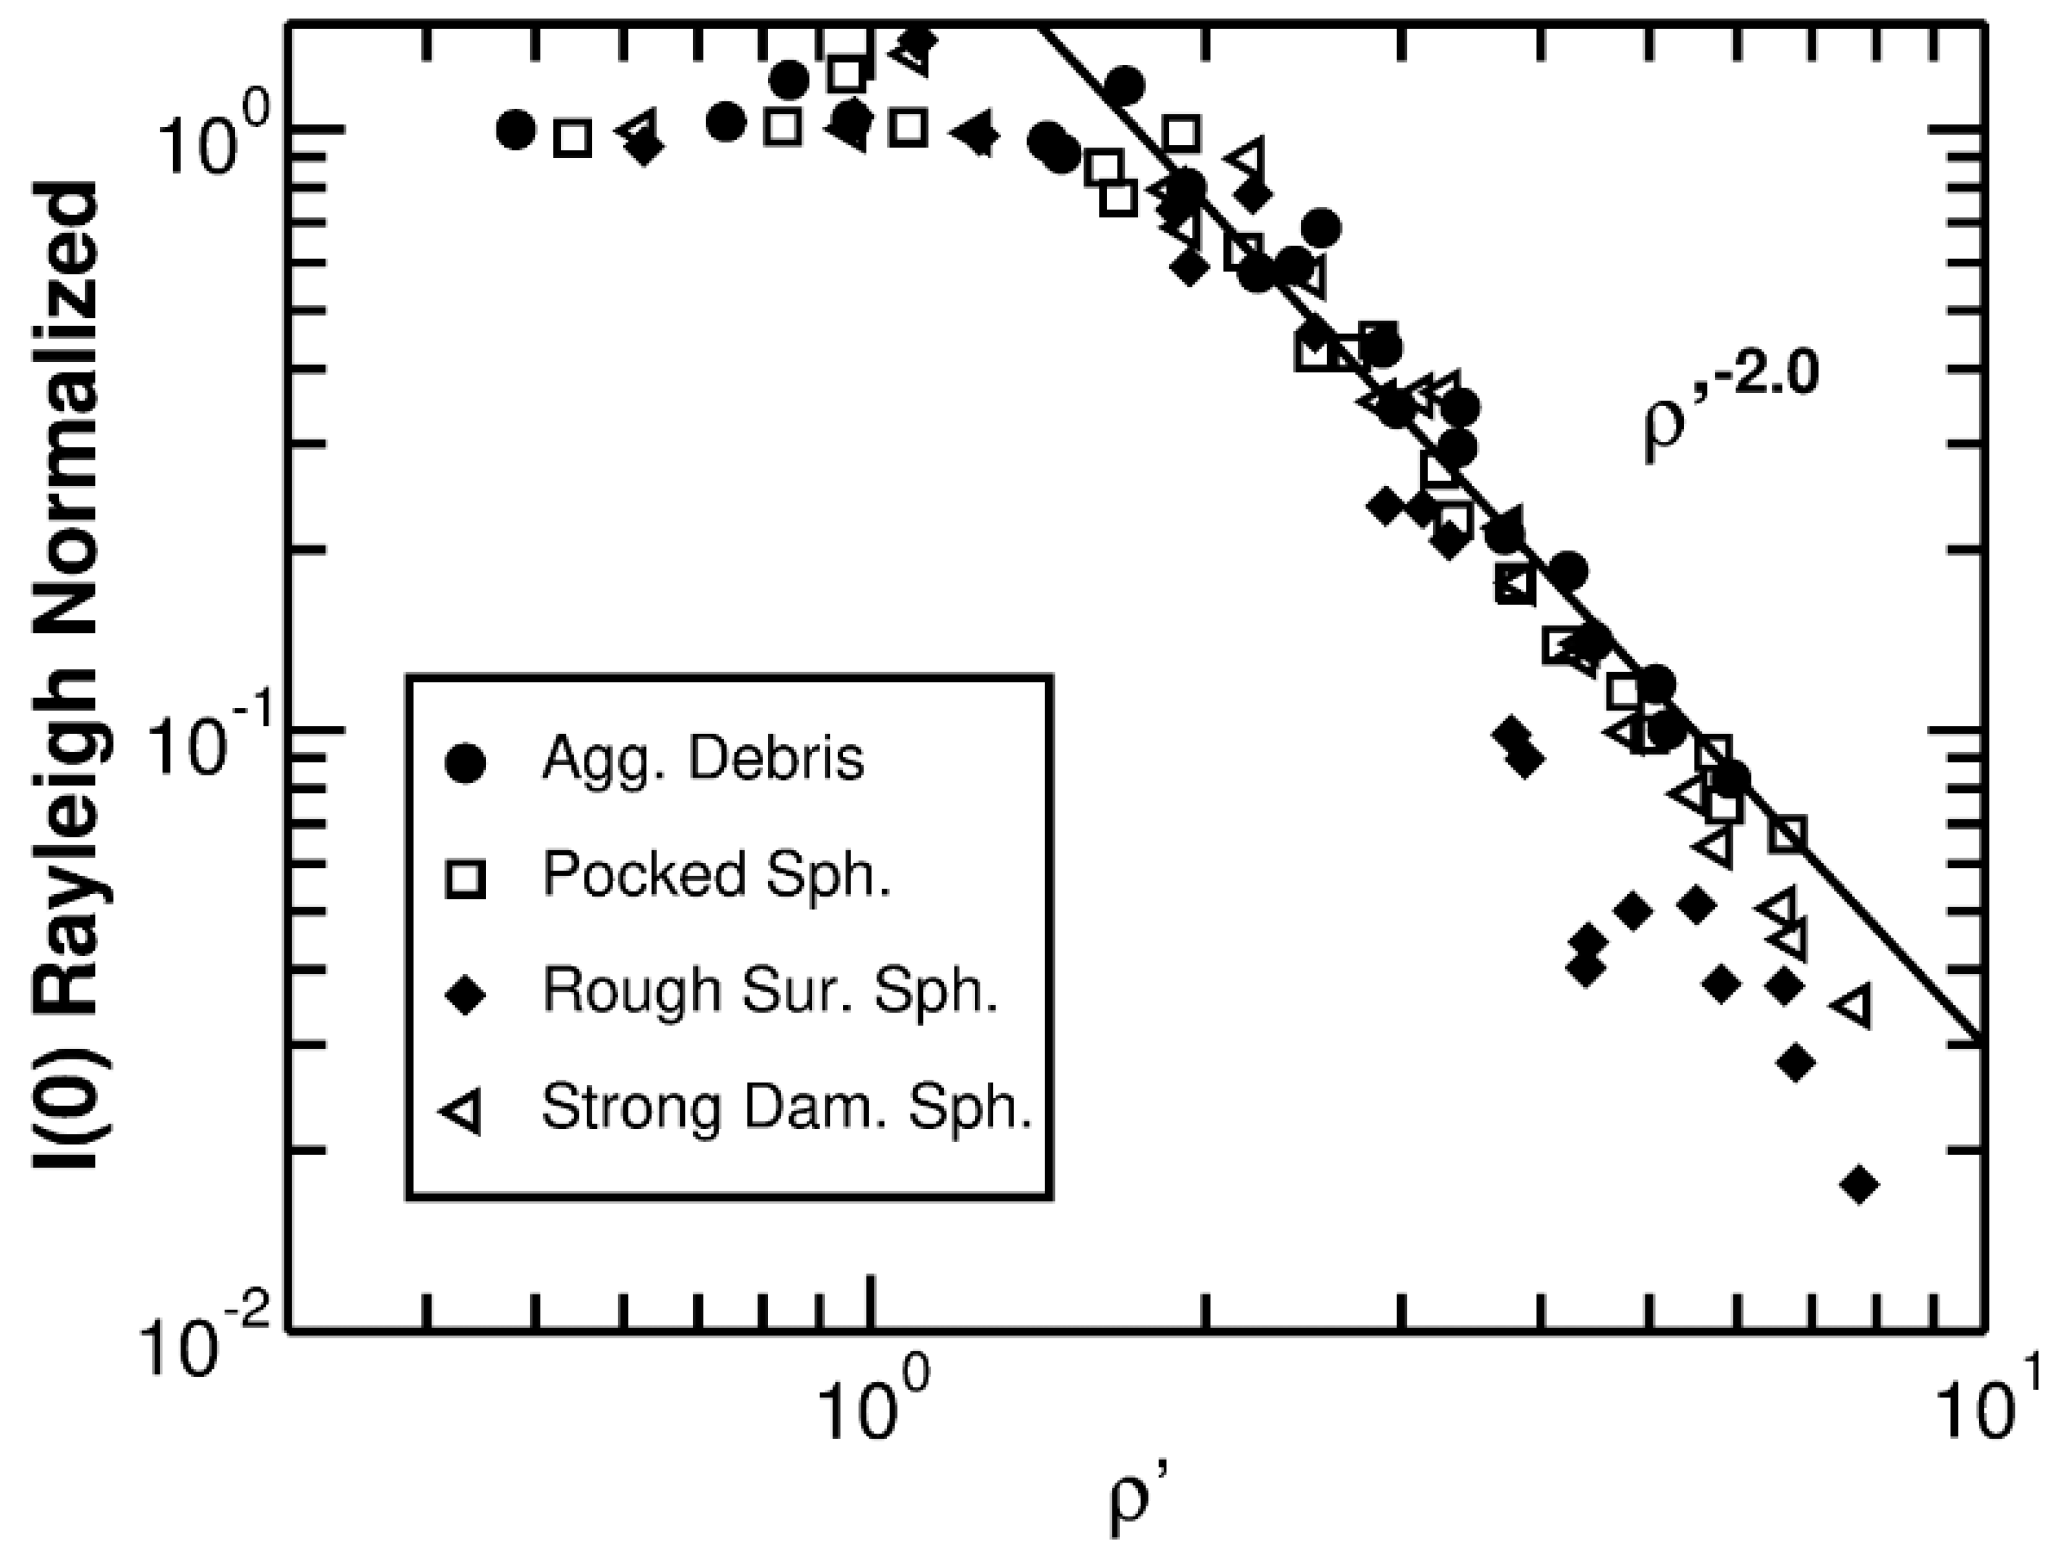
Figure 14 shows the behavior of the Rayleigh normalized forward scattered intensity as a function of the internal coupling parameter. This plot is analogous to Figure 2a for spheres. All four irregular spheres with all three refractive indices, m = 1.313, 1.5 + 0.1i and 1.6 + 0.0005i are plotted in the figure. Within the scatter of the data, Figure 14 shows a universal functionality of the forward scattering with the internal coupling parameter, and the functionality is very similar to that found for spheres (Figure 2).

4.3. Gaussian Random Spheres

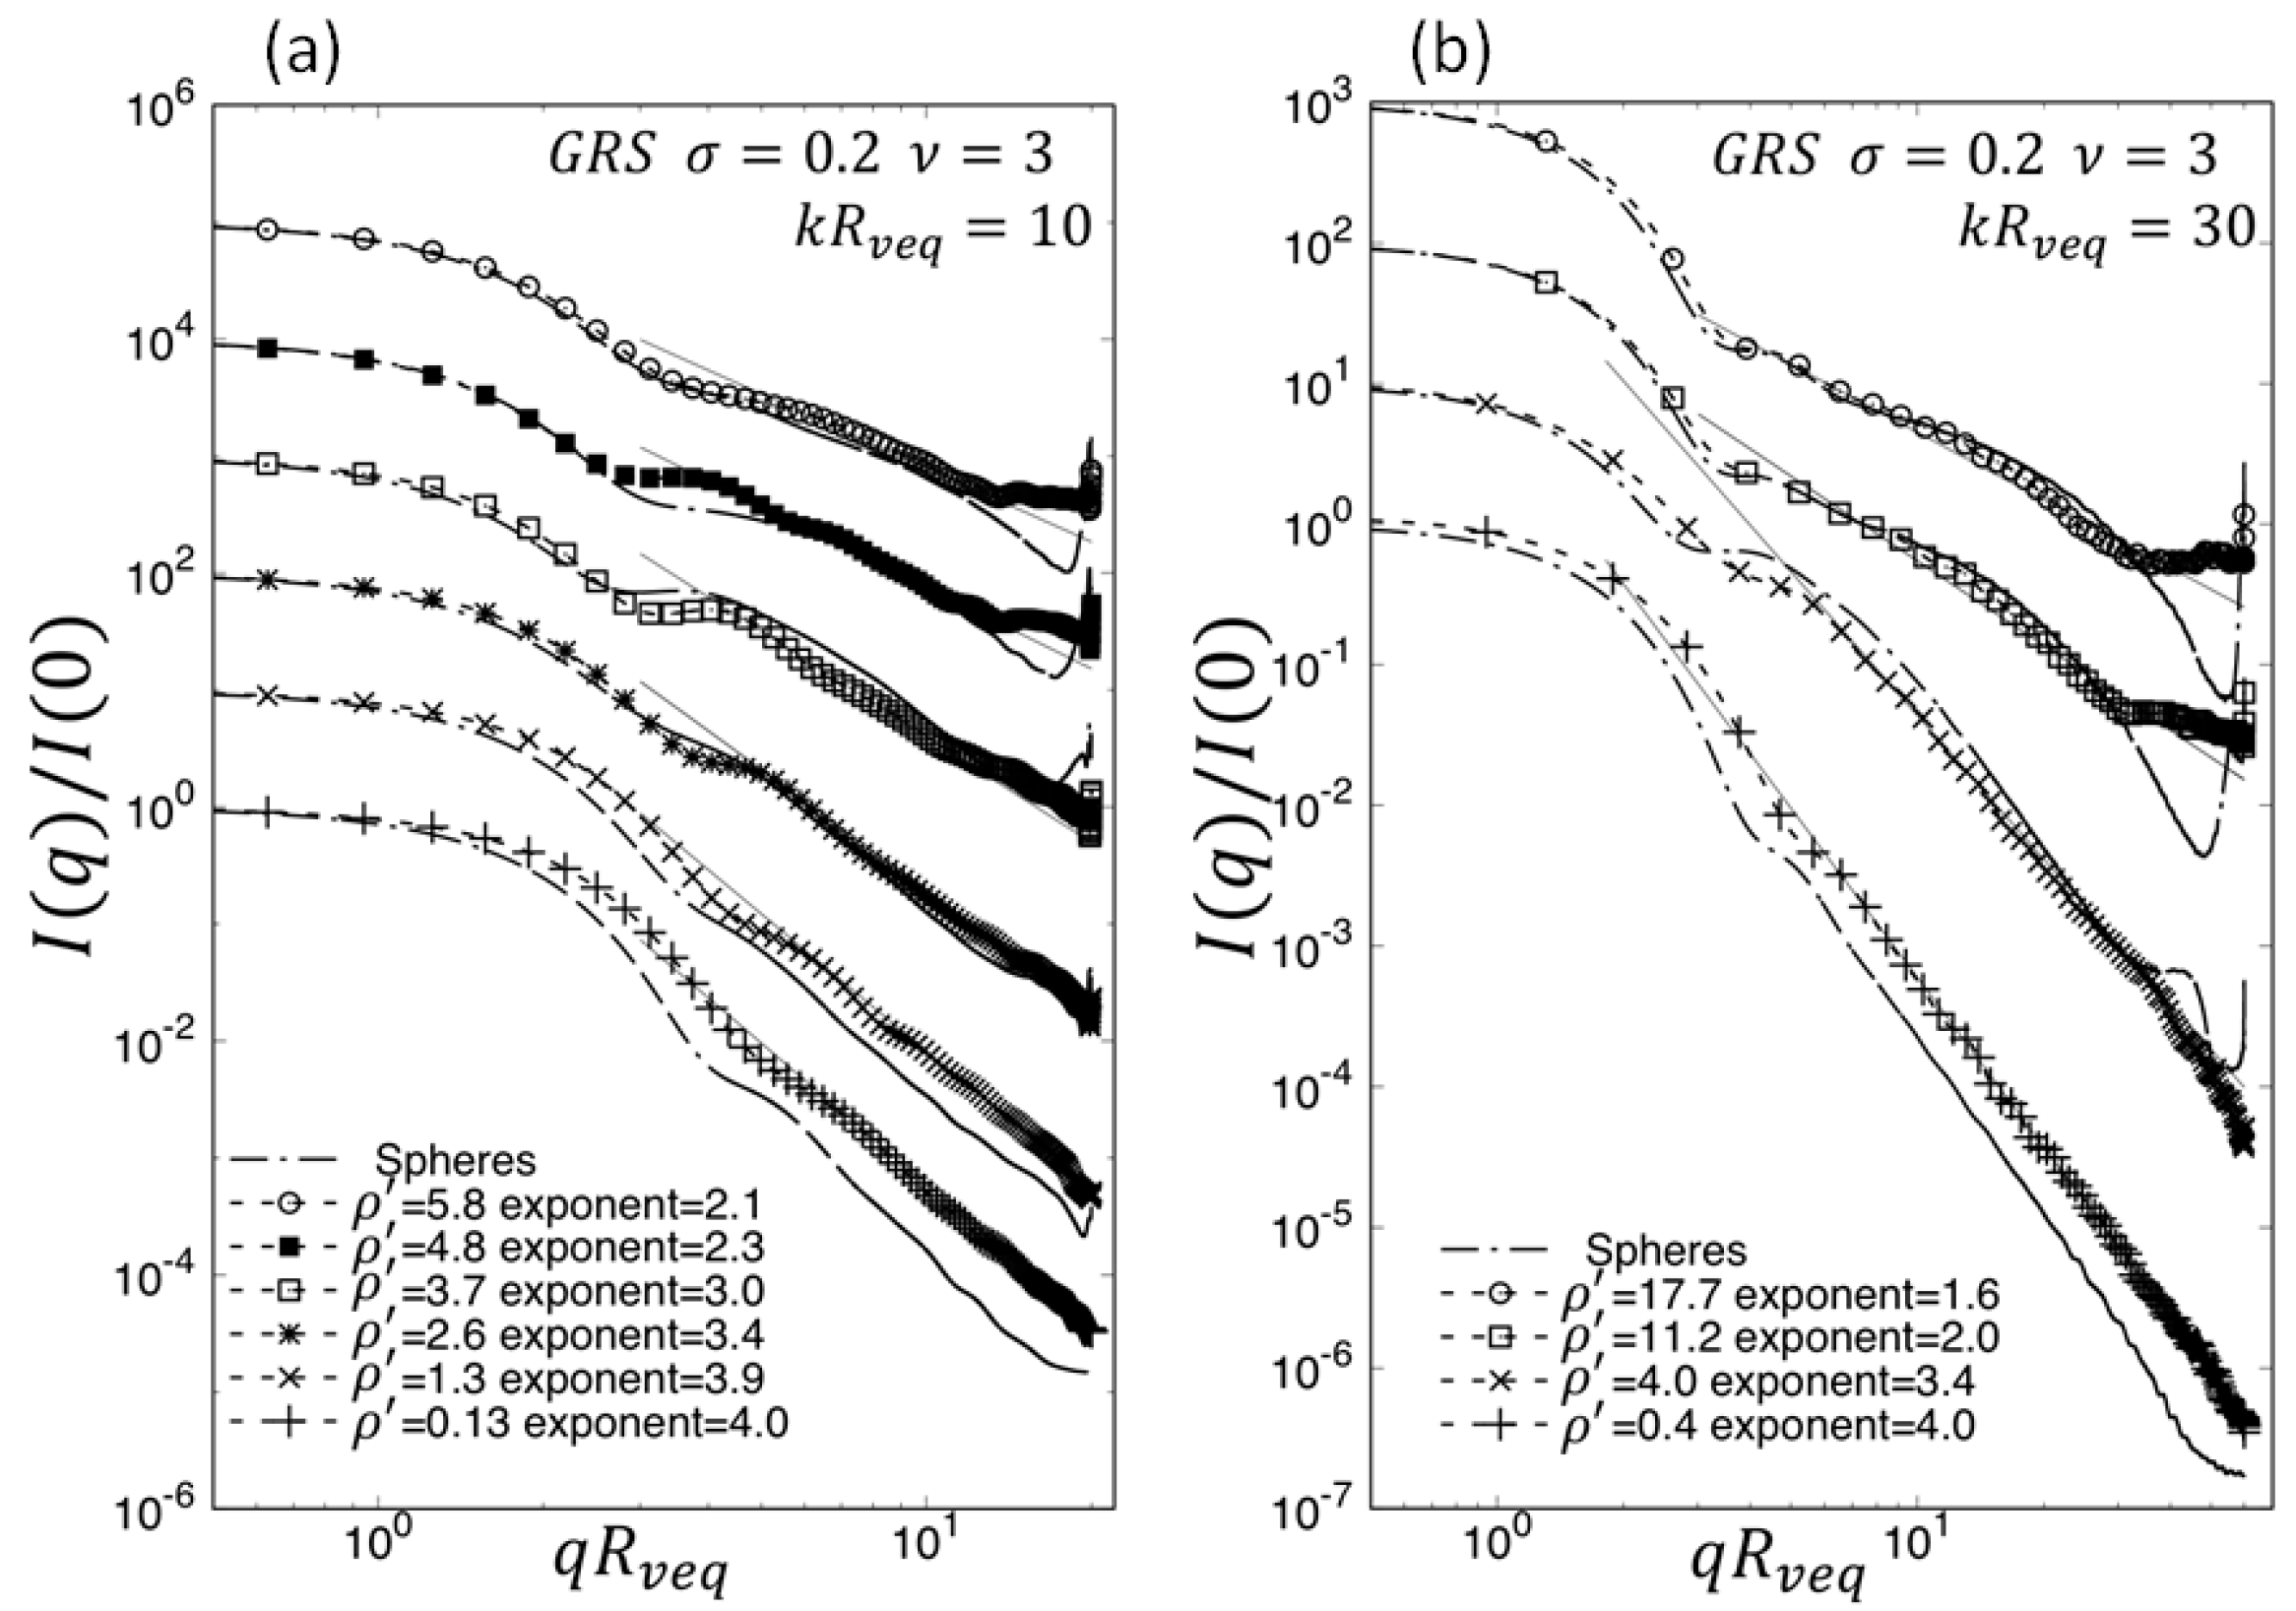
A Gaussian Random Sphere (GRS) can be made to have shapes similar to dust particles. GRS’s are based on smooth, random fluctuations relative to an underlying spherical shape [42]. The insert of Figure 4 shows an example of a GRS. GRS’s are characterized by three parameters: (1) σ, the relative standard deviation of the distribution of deviations from a perfect sphere in the radial direction; (2) ν, the power law index of the covariance function which controls the number of bumps and dips in the tangential direction; and (3) R, the mean radius from which deviations occur and that sets the overall size of the particle.
Figure 15 shows the light scattering properties of GRSs [43] calculated using a discrete dipole approximation algorithm [38,39,40]. The GRSs had σ = 2 and ν = 3 and the scattering was orientationally averaged. Scattering features include a forward scattering lobe, a Guinier regime near qReq 1, a small dip near a qReq 3, a power law regime, and hints at enhanced backscattering. The exponent of the power law is −4 when the internal coupling parameter ρ is small. This is consistent with this limit being the structure factor and the particles have mass and surface scaling dimensions of Dm = 3 and Ds = 2, respectively. With increasing ρ , the exponent magnitude decreases. Note that in this work the spherical form for the internal coupling parameter was used with no significant error.
Included in Figure 15 are plots of scattering by perfect spheres as calculated with the Mie equations. The spheres have a modest size distribution with geometric width of 1.2 to eliminate interference ripples. The spheres and the GRS display similar scattering behavior with ρ except when ρ ≥ 2, in the backscattering regime. There the GRS scattering spans a dip that appears in the sphere scattering near qR kR to 2kR, but does not have the sharp increase at 2kR (which corresponds to θ = 180°) that the spheres have. When ρ ≥ 5, a simple enhanced backscattering appears.

4.4. Thickened Clusters

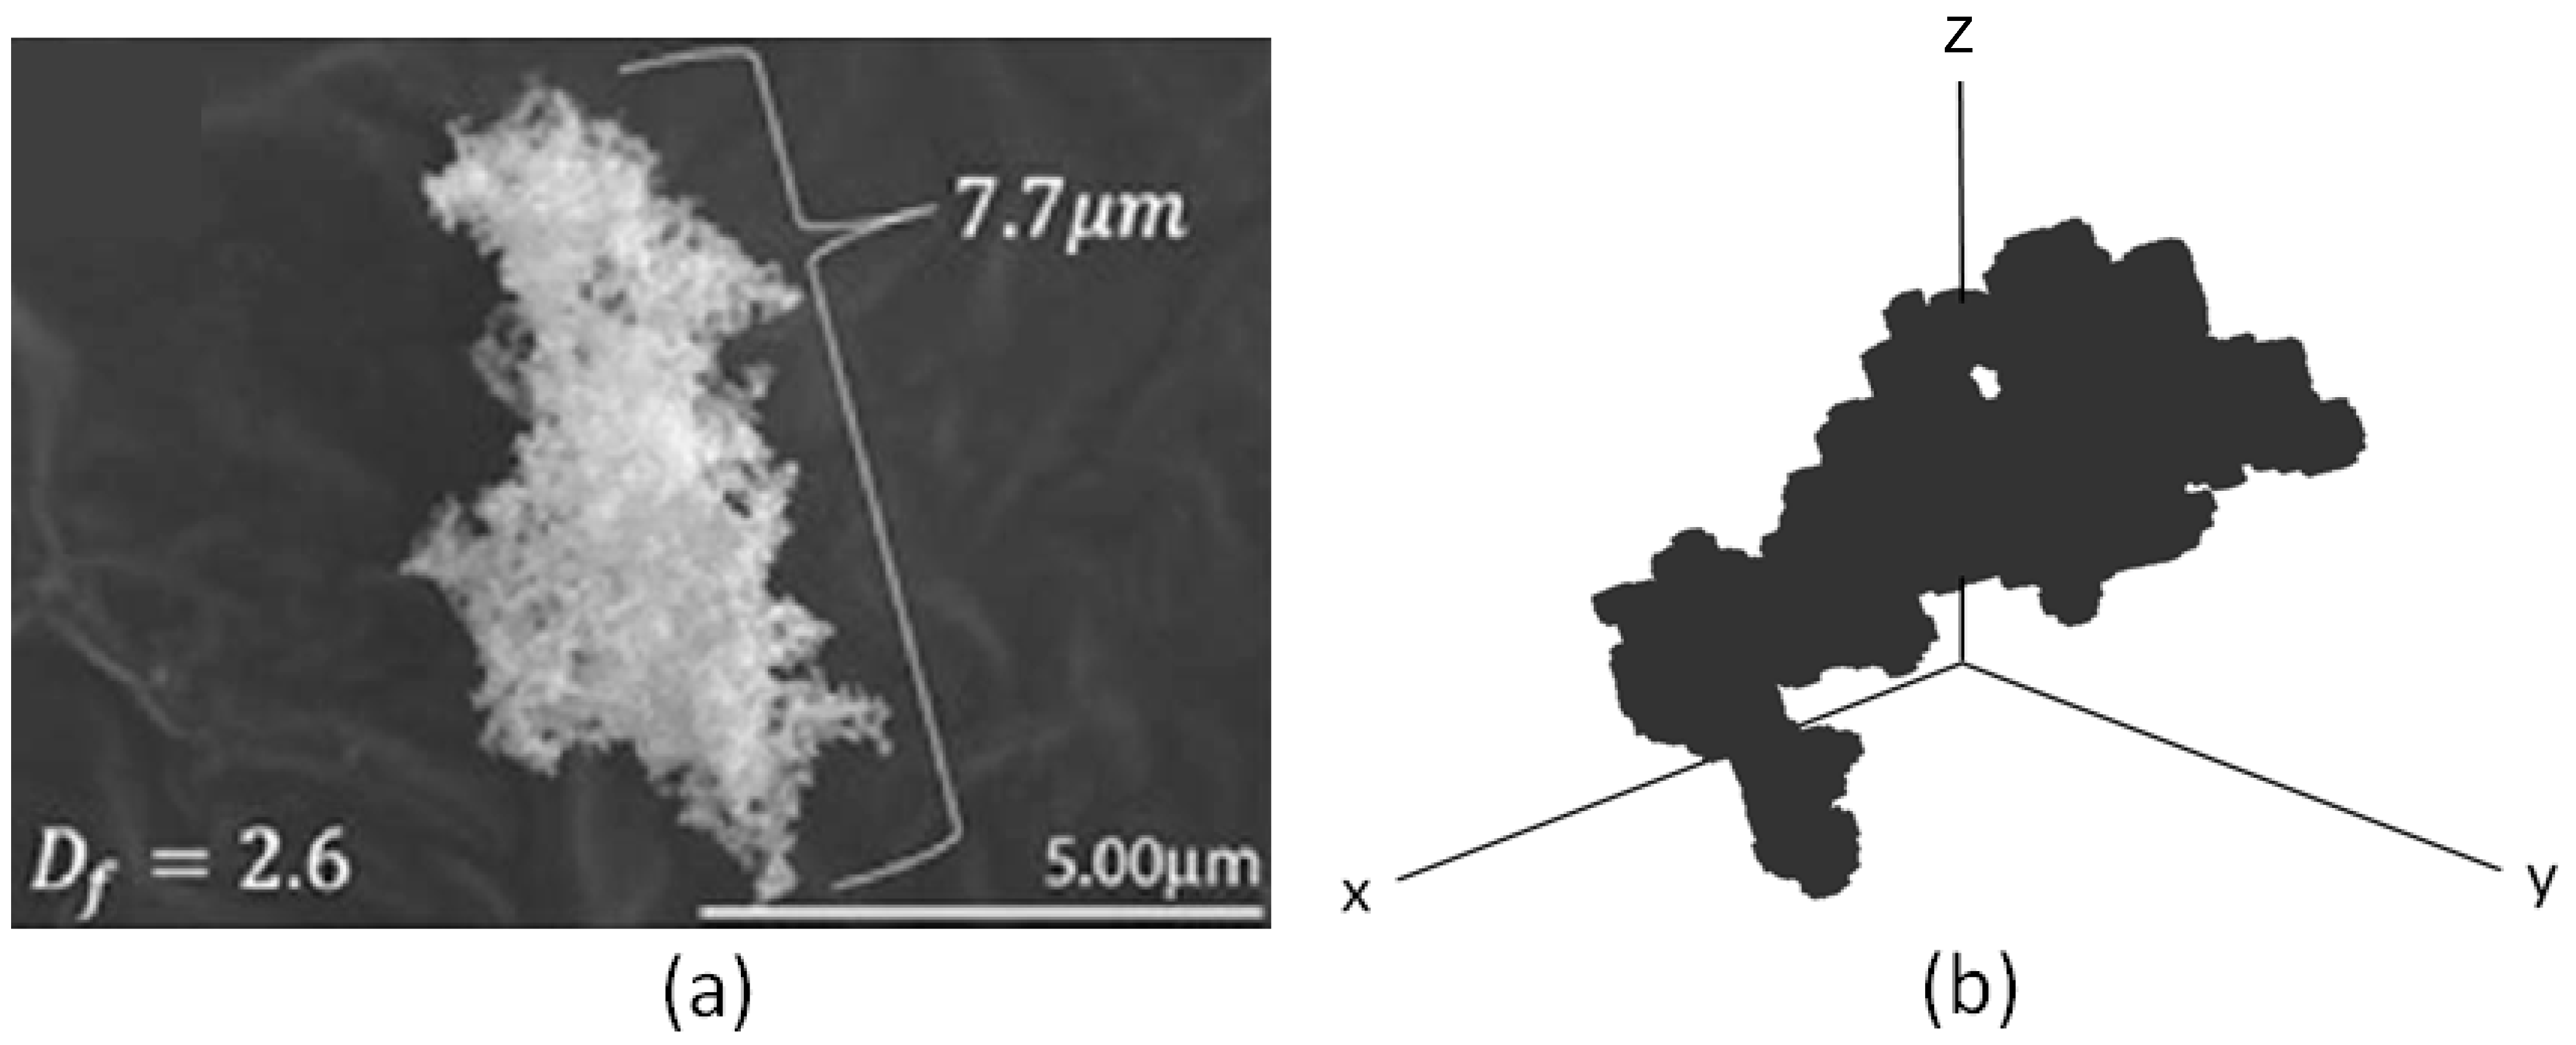
Some clusters found in the atmosphere are rather large and appear denser than DLCA aggregates. An example is given in Figure 16a. In an attempt to study the light scattering properties of such clusters, we have constructed clusters with a computer algorithm. The construction process starts with a 3D, cubic point lattice. Added to these points at random are spheres with diameter equal to the lattice spacing. Ultimately, as more spheres are added, the lattice percolates; a percolation cluster with fractal dimension D 2.5 is formed. Clusters so conceived were then used as the backbone for the dust particle. To make the fractal dimension match the spatial dimension of three, the backbone cluster was thickened by filling the neighboring sites. Figure 16b shows an example of a thickened percolation cluster.
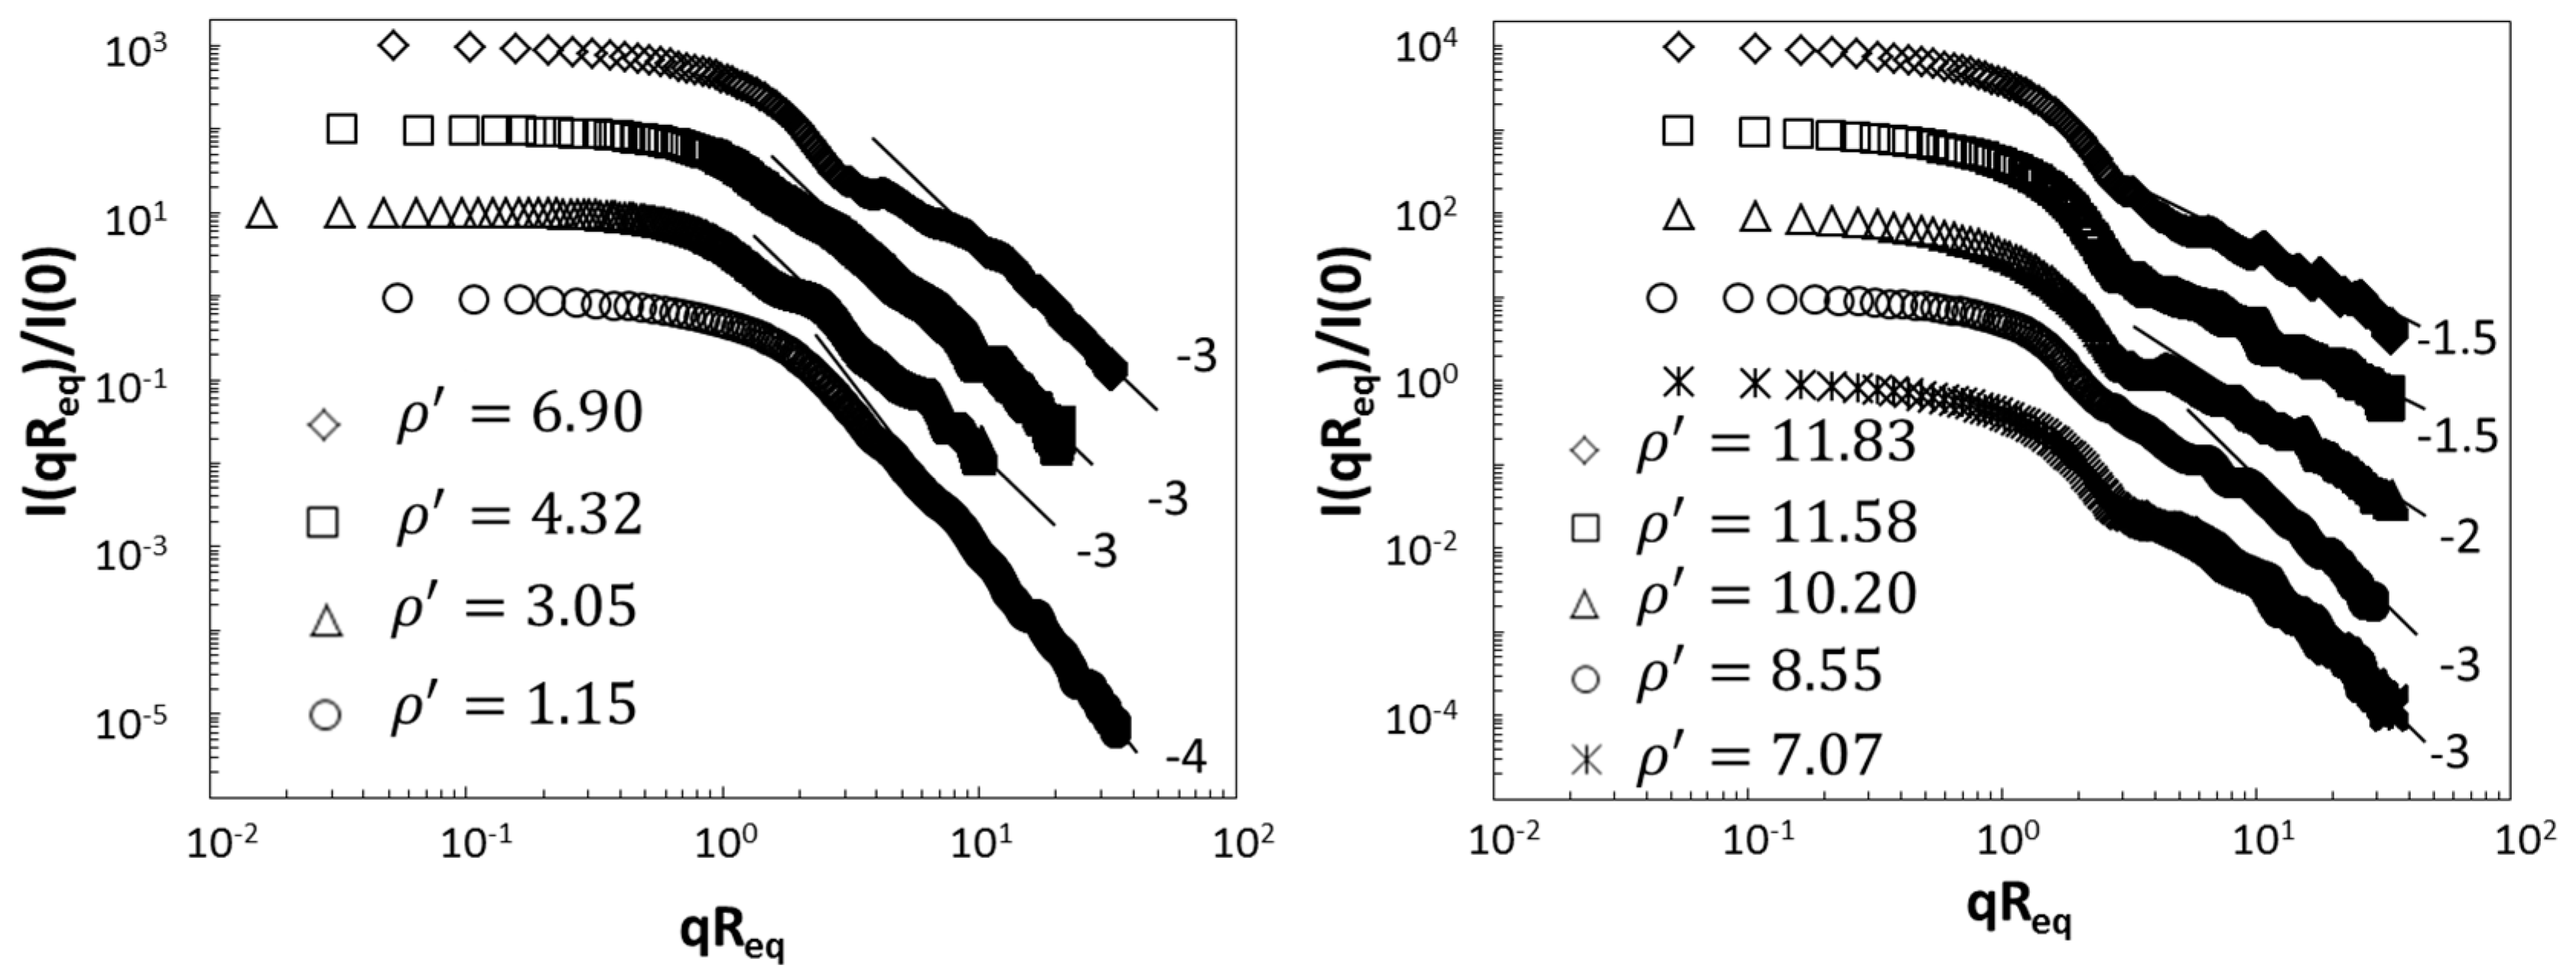
The rotationally averaged scattered intensity was calculated using a DDA code developed by our group [17,43,45]. All thickened cluster DDA calculations were done with 100 random orientations on particles comprised of (3–6) × 105 dipoles. All DDA runs for these particles were at k|m|d ≤ 0.6 where d is the dipole spacing, well below the commonly cited standard for DDA accuracy of k|m|d ≤ 1 [46]. To further insure the accuracy of our DDA runs, we compared the equivalent sized spheres set at the same dipole resolution, λ, and m to the results from Mie solutions. We found the error between the numerical methods reported Csca values were always less than 10% and at the smallest ρ the error was ca. 1%. It should also be noted that previous work has shown that spherical particles produce the largest errors in DDA and the error for randomly shaped 3D objects is expected to be much smaller [46,47],. Then with the application of Q-space analysis as shown in Figure 17, one finds a constant forward scattering lobe, a Guinier regime, a minor dip near qR 3, followed by power law regimes. There is no enhanced backscattering, but note that ρ < 12. As before, the magnitude of the exponents decrease with increasing ρ . Note that in this work the spherical form for the internal coupling parameter was used with no significant error.

4.5. Ice Crystals

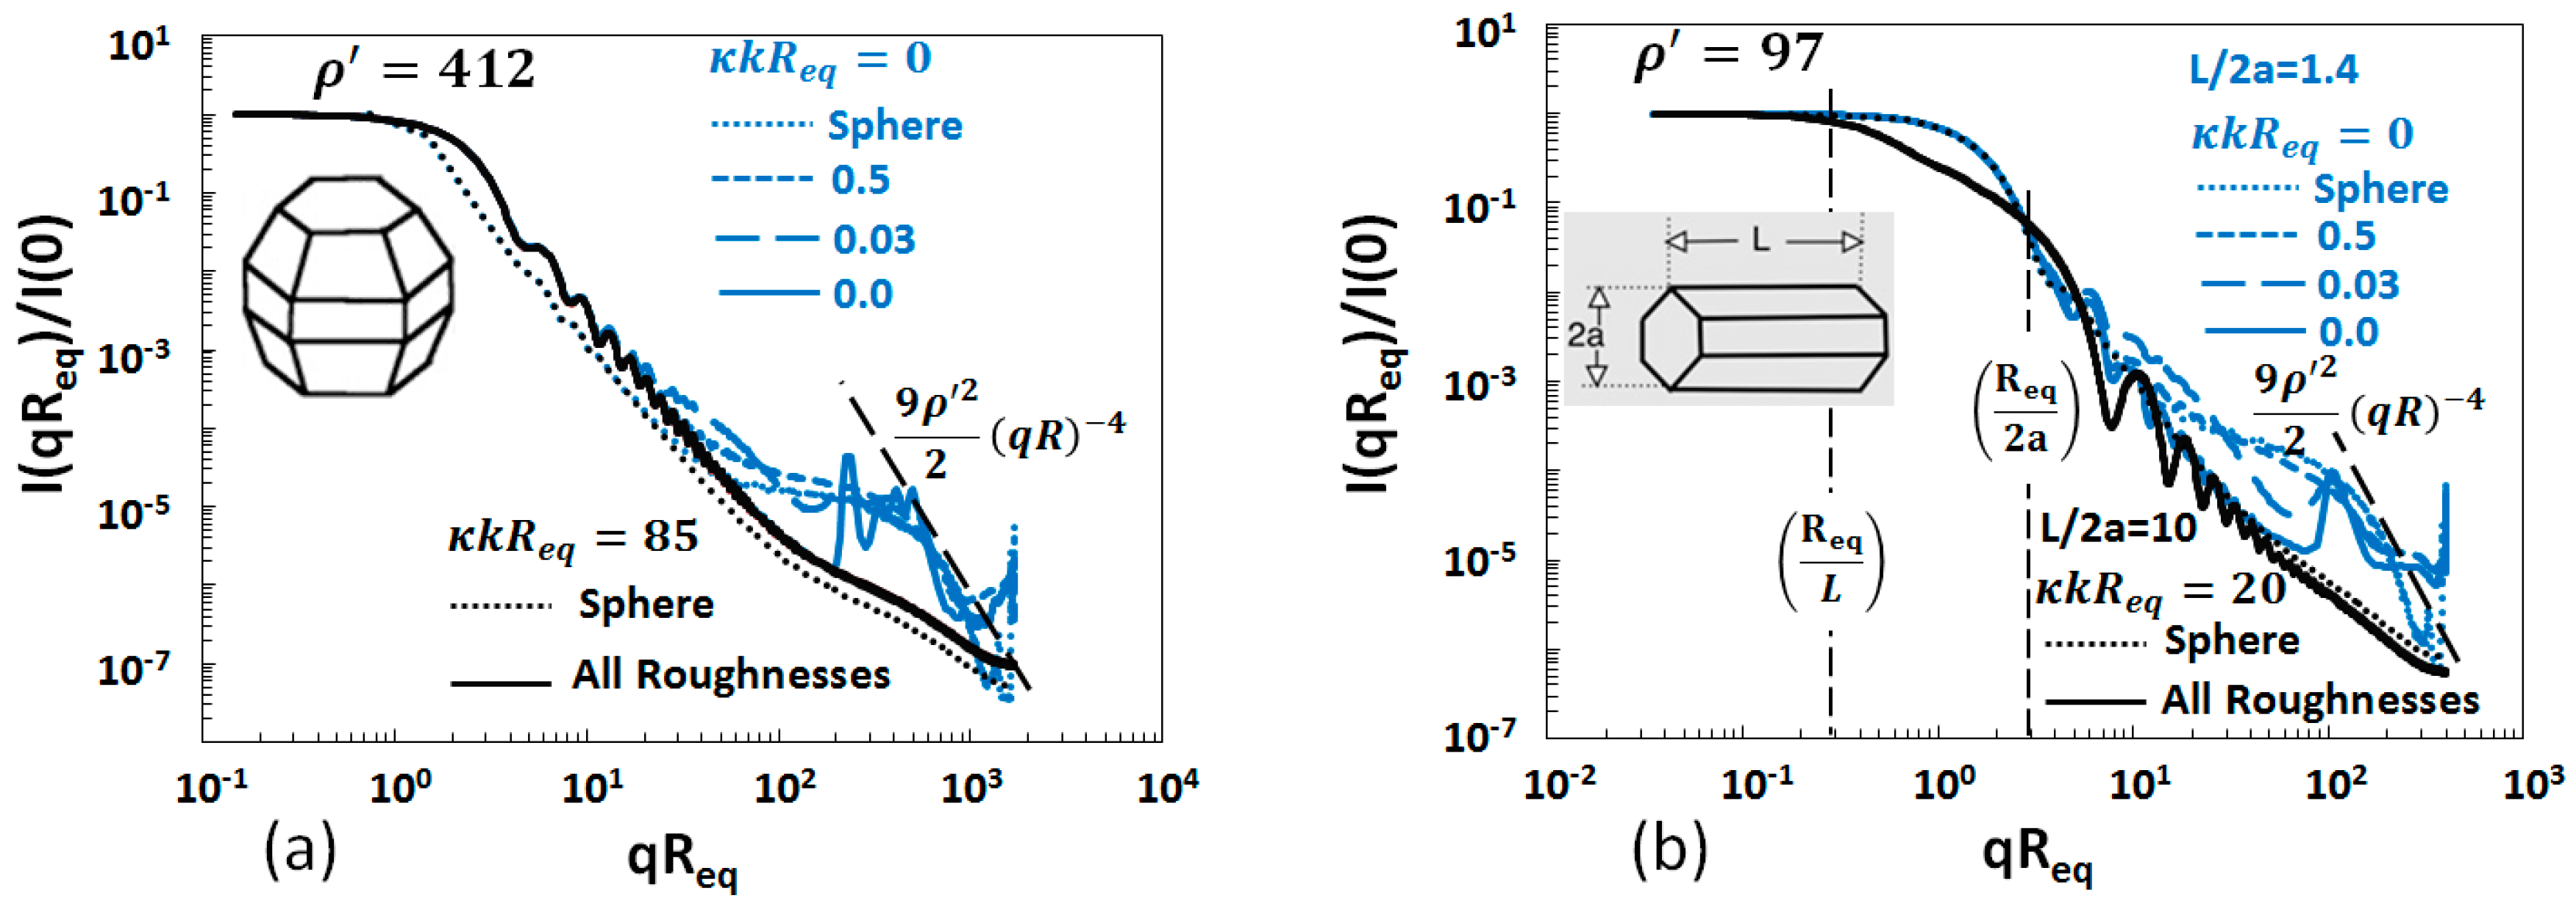
Our group has recently applied Q-space analysis to a variety of ice crystal shapes [10]. Such crystals occur in the atmosphere, for example, in cirrus clouds. Nine crystal shapes were studied: droxtal, solid column, 8-column aggregate, plate, 5-plate aggregate, 10-plate aggregate, hollow column, hollow column rosette, and solid column rosette all with three degrees of surface roughness, namely, σ = 0.0 (smooth), σ = 0.03 (moderately rough), and σ = 0.5 (severely rough). The scattering calculations are described in [48].
Figure 18 presents the Q-space analysis of the angular scattering functionality, proportional to the phase function, for the ice crystals. The shape generalized Rayleigh scattering and internal coupling parameters were used [32]. The optical wavelength was λ = 0.53   μ m , the maximum dimensions of the various shapes were D = 2 ,   6   and   20   μ m and the refractive index was m = 1.31. R e q is volume equivalent radius. Corresponding ρ s for maximum dimensions D = 2 ,   6 ,   20   μ m are labeled next to the scattering curves.
Figure 19 presents the Rayleigh normalized forward scattering for the ice crystals. In most cases the behavior of the forward scattering for the ice crystal is very similar to that for spheres, Figure 2b. However, Droxal shows unexplained computational problems in the range 5 ≤ ρ ≤ 50. 5-plate and 10-plate show variation with the smoothness with the roughest closest to the sphere behavior. Despite these differences, the general similarity to spheres is striking and had not been previously recognized.
Figure 20 illustrates the effects of the imaginary part of the refractive index κ and extreme aspect ratio.
The Q-space analysis of Figure 18, Figure 19 and Figure 20 shows many features in common for scattering by spheres and the ice crystals which evolve with the internal coupling parameter ρ in a similar manner. These features are:
  • The forward scattering lobe when q R e q < 1 behavior is very similar to that of spheres when the Rayleigh scattered intensity and internal coupling parameter are generalized for these shapes.
  • Both spheres and ice crystals have a Guinier regime near q R e q 1 . Unlike spheres, however, crystals with large aspect ratios can show two Guinier regimes.
  • Both spheres and ice crystals have a complex power law regime beyond the Guinier regime when 1 q R e q < 2 k R . This regime includes a (qReq)−3 functionality, for non-aggregate crystals, that starts to occur with large ρ very likely due to 2d diffraction from the projected crystal shape. Similar to spheres, hump structure also appears centered near ρ . At larger q R e q , there is a tendency to approach the spherical particle diffraction limit (RDG) of 9 ( q R e q ) 4 . Aggregate ice crystals have a more uniform power law regime similar to fractal aggregates.
  • The parameter κ k R , plays the same role for both shapes by removing the hump near qReq ρ .
  • In many cases, the ice crystals have enhanced backscattering near q R e q 2 k R e q , ( θ = 180 ° ) similar but not the same as for spheres.
  • The evolution of the scattering evolves away from the 3D diffraction with increasing ρ for all shapes including spheres.
Surface roughness plays a minor role in these features except in the hump region where smooth surfaces give a wavy structure to the hump.

5. Discussion

We have reviewed the light scattering properties of spheres, a great many types of dusts, fractal aggregates, spheroids, irregular spheres, Gaussian random spheres, thickened clusters and nine types of ice crystals. Our perspective has been the novel Q-space perspective in which the scattered intensity is plotted versus the magnitude of the scattering wave vector q on a logarithmic scale rather than the conventional linear plot versus the scattering angle θ. We find or infer that the scattering for all these shapes have the following same features:
1.
A forward scattering lobe of constant intensity, i.e., q and θ independent, appears when q R < 1 . This condition is equivalent to θ < λ/2πR. The magnitude of the forward scattering is that of its generalized Rayleigh scattering, IRay, when ρ ≤ 1, and IRay/ ρ 2 when ρ ≥ 10. We remark that for spheres approximately half of the total scattered light occurs when qR < π (θ < λ/2R) [6,13,49] and when κkR < 0.1, and nearly all the scattered light appears in this forward lobe when κkR > 10.
2.
A Guinier regime near q R 1 (θλ/2πR).
3.
A power law regime when 1 ≤ qR ≤ 1.5kR (λ/2πRθ ≤ 90 to 100°). This power law regime can be very complex as for spheres, spheroids, Gaussian random spheres and ice crystals, or it can be a single power law as for many of the dusts, fractal aggregates, irregular spheres, and thickened clusters. In all cases the power law regime evolves with the internal coupling parameter ρ .
Other features that often occur are:
4.
A dip near qR 3 to 4 (θ λ/2R) immediately after the Guinier regime appears for all shapes except the dusts and the DLCA aggregates. Recall that the dusts samples were polydisperse and this could smooth away any dip present in a single size scattering.
5.
A (qR)−3 regime at large ρ appears for spheres, spheroids and the non-aggregate ice crystals. This is due to the onset of 2d Fraunhofer diffraction, thus it is expected that all non-aggregate shapes would have this regime at ρ .
6.
A “hump” regime centered near qR ρ when ρ ≥ 30 for spheres, spheroids and, remarkably, ice crystals. This hump disappears when κkR ≥ 3. We expect this hump to appear as the 2D Fraunhofer diffraction, (qR)−3 regime appears at large ρ for all shapes except aggregates.
7.
An enhanced backscattering regime appears when qR ≥ 1.5 (θ ≥ 110°) for all shapes except the ice crystal aggregates, DLCA and thickened aggregates. A caveat is that the data for the DLCA aggregate was limited to θ ≤ 120°. The backscattering appears as ρ increases there being no enhanced backscattering in the diffraction limit when ρ = 0. Typically it appears when ρ > 10.
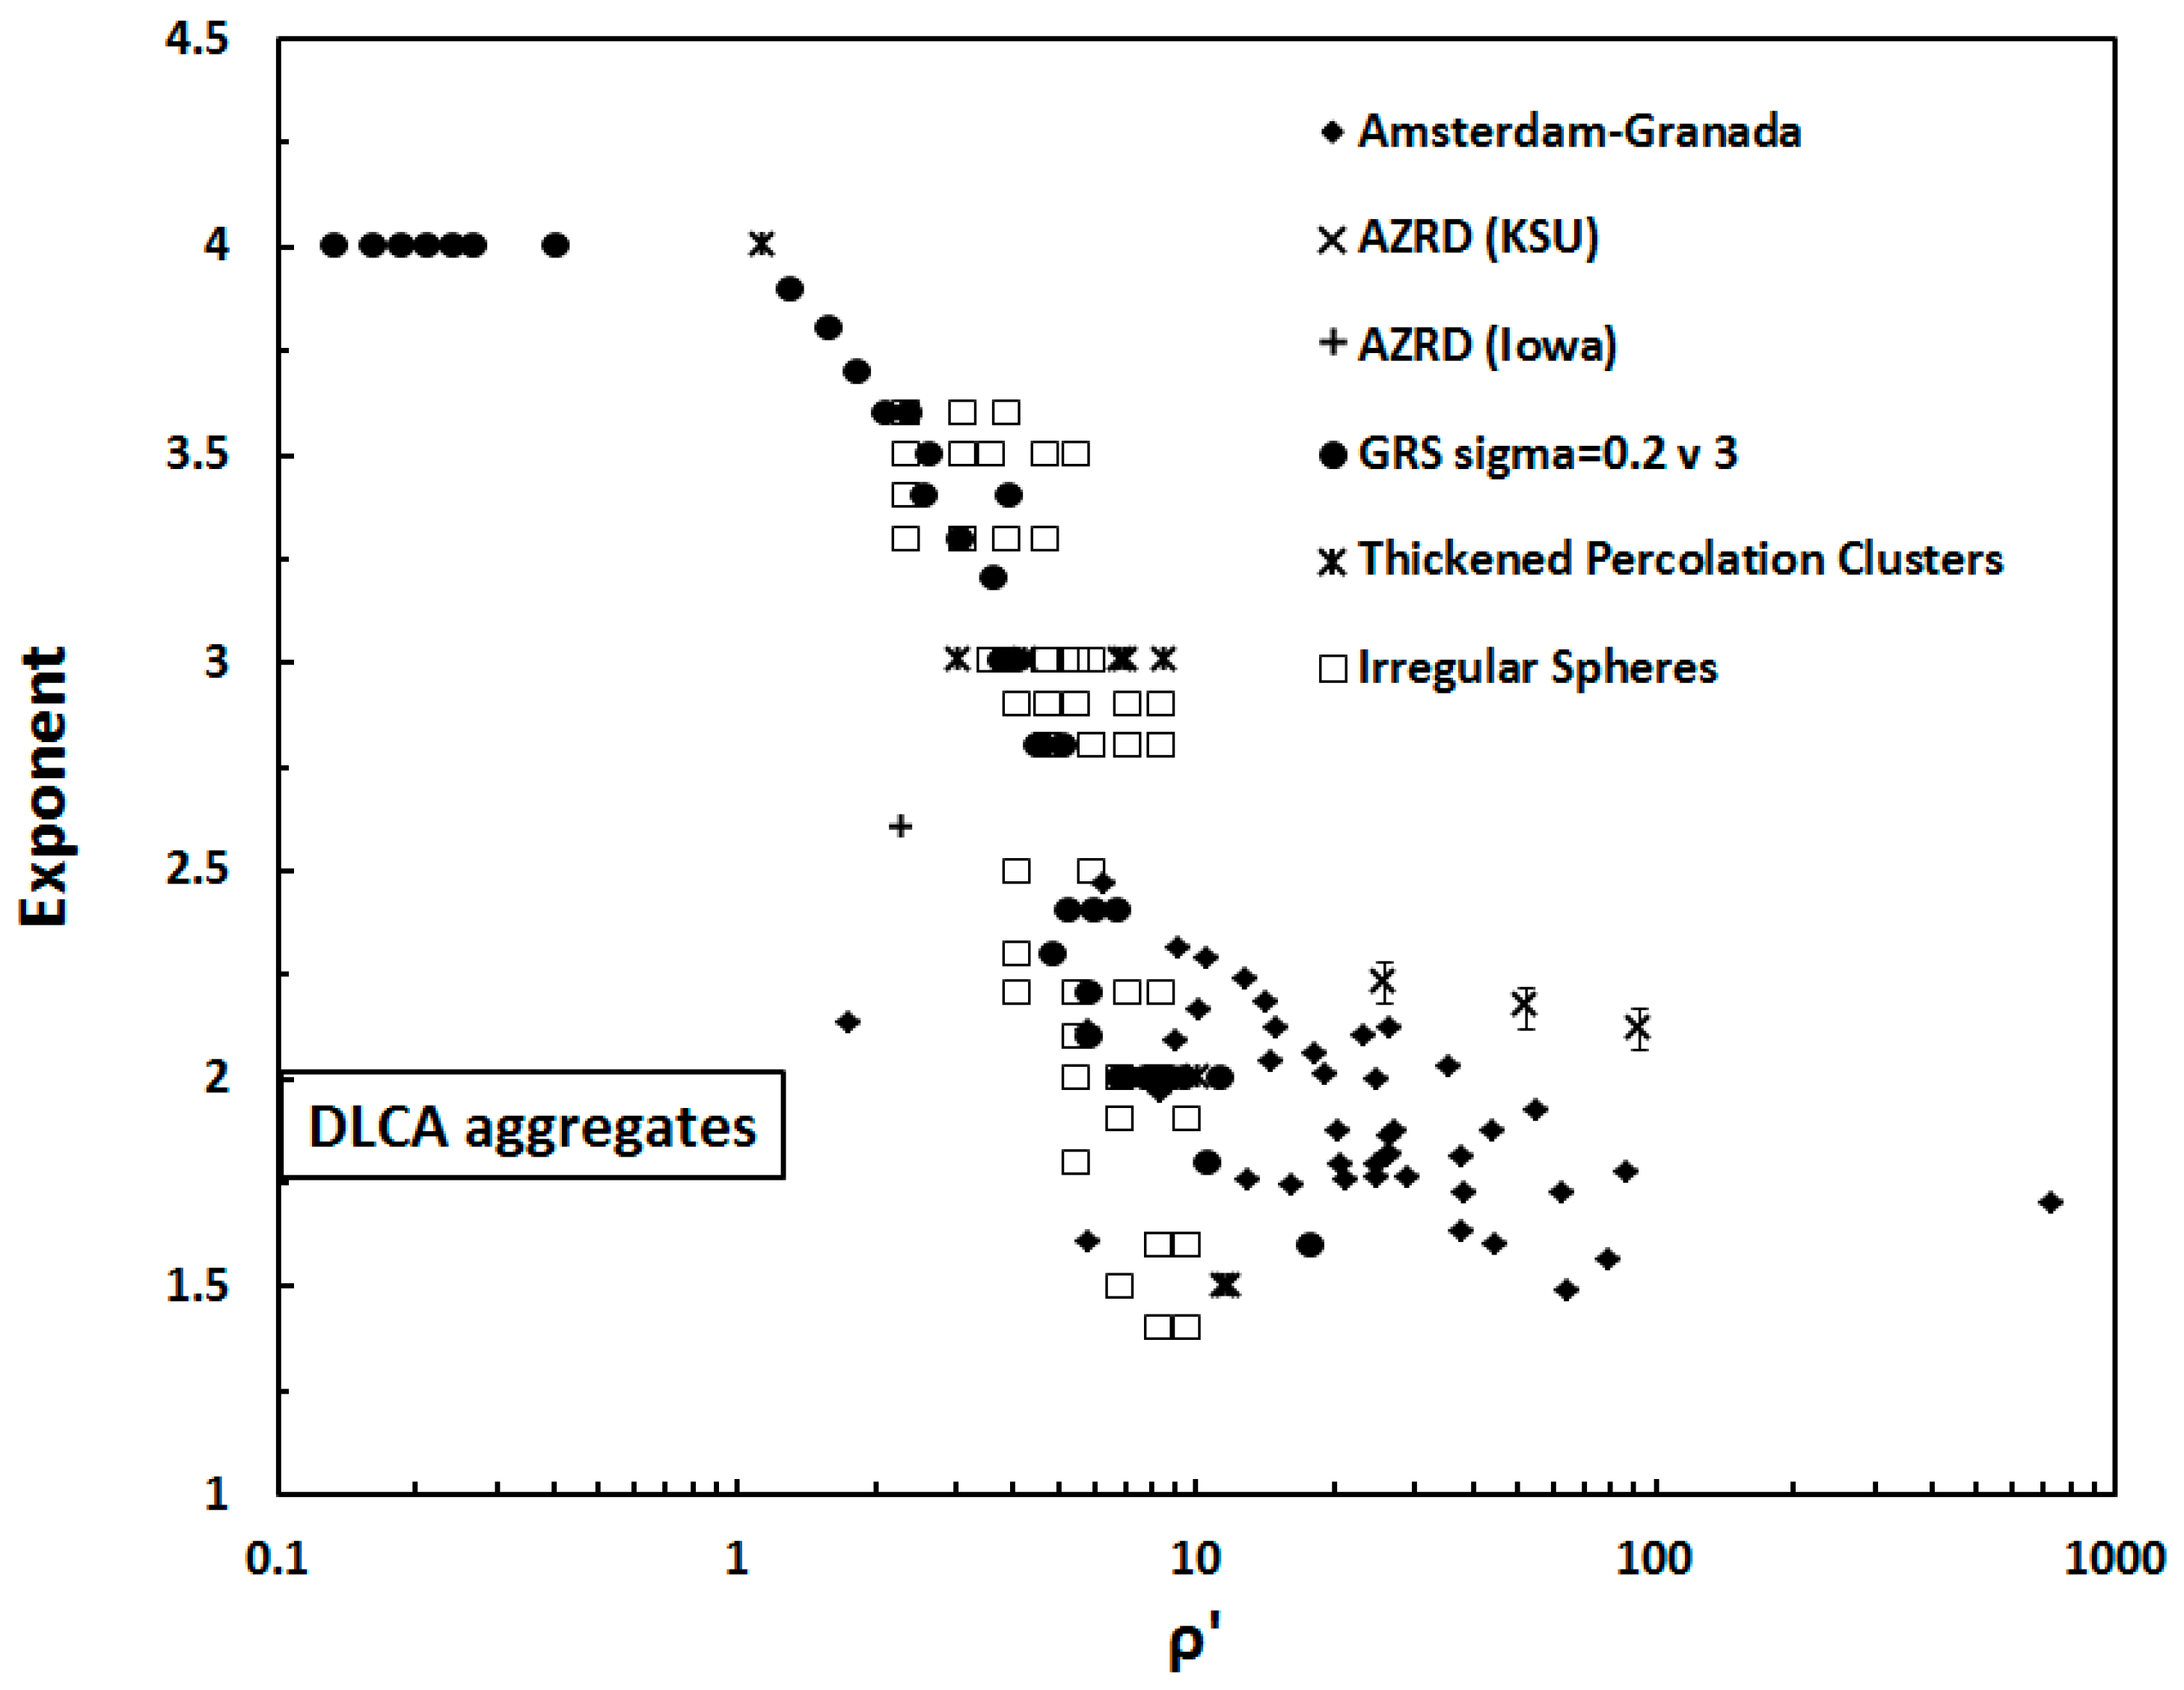
The power law of feature 3 is quite uniform (linear) for all shapes in the diffraction, RDG, ρ = 0 limit, and for the dusts and aggregates at finite ρ . It is approximately uniform for Gaussian random and irregular spheres and small spheres at finite ρ but complex for spheres and non-aggregate ice crystals. When reasonably uniform, we have observed the power law exponent magnitude decreases with increasing ρ . This behavior is shown in Figure 21.
Figure 21 shows that all the particles with a uniform power law except the DLCA fractal aggregates follow on the same trend with the internal coupling parameter ρ regardless of the detail of their structure. The implication is that ρ is a universal parameter for any shape much like it is for spheres as displayed in Figure 1. The magnitude of the exponents start from 4 when ρ is small and decrease until the trend levels off to   1.75 ± 0.25 when ρ 10 .
As alluded to above, in the ρ 0 , diffraction, RDG limit the power law regime in general obeys [41]
I ( q )   ~   q ( 2 D m D s )
where Dm and Ds are the mass and surface scaling dimensions of the scattering particle, respectively. Thus, Figure 21 not only shows an interesting trend in the exponents when the exponent description is viable but also indicates that there are two classes (at least) of non-spherical particles: fractal, with scaling exponents not directly related to the Euclidean dimensions, and non-fractals with canonical Euclidean scaling dimensions.
At this time, we cannot offer a complete explanation for the power laws found empirically above. For the Amsterdam-Granada dust we are suspicious that the broad polydispersity of the samples might have some effect with regard to smoothing the plots in Q-space. Furthermore, although we understand and can calculate the power law exponents in the ρ → 0 limit, we have no explanation for their values when ρ > 1 nor their behavior as a function of ρ .

6. Conclusions

When viewed from Q-space, the scattering phase function of any particle has distinguishing characteristics that can quantitatively describe the scattering. The major characteristics are common to all shapes, thus providing a universal description of particulate light scattering. For all shapes, the scattering evolves with increasing ρ from the diffraction limit where the internal coupling parameter ρ = 0. This evolution is universal for spheres, and we present some evidence that it is universal for other shapes as well. However, this assertion needs further testing.

Acknowledgments

This work was supported by the National Science Foundation under grant no. AGM 1261651 and the Army Research Laboratory under grant no. W911NF-14-1-0352.

Author Contributions

C.M.S. and A.C. conceived and designed the research; Y.W.H. performed the experiments and analyzed the data with C.M.S.; W.R.H. and J.B.M. performed theoretical calculations and analyzed the results with C.M.S. and A.C.; and C.M.S. wrote the paper.

Conflicts of Interest

The authors declare no conflict of interest.

References

  1. Sorensen, C.M.; Fischbach, D.J. Patterns in Mie scattering. Opt. Commun. 2000, 173, 145–153. [Google Scholar] [CrossRef]
  2. Berg, M.J.; Sorensen, C.M.; Chakrabarti, A. Patterns in Mie scattering: Evolution when normalized by the rayleigh cross section. Appl. Opt. 2005, 44, 7487–7493. [Google Scholar] [CrossRef] [PubMed]
  3. Sorensen, C.M. Q-space analysis of scattering by particles: A review. J. Quant. Spectrosc. Radiat. 2013, 131, 3–12. [Google Scholar] [CrossRef]
  4. Van de Hulst, H.C. Light Scattering by Small Particles; Wiley: New York, NY, USA, 1957; p. 470. [Google Scholar]
  5. Kerker, M. The Scattering of Light, and Other Electromagnetic Radiation; Academic Press: New York, NY, USA, 1969; p. 666. [Google Scholar]
  6. Bohren, C.F.; Huffman, D.R. Absorption and Scattering of Light by Small Particles; Wiley: New York, NY, USA, 1983; p. 350. [Google Scholar]
  7. Heinson, W.R.; Chakrabarti, A.; Sorensen, C.M. A new parameter to describe light scattering by an arbitrary sphere. Opt. Commun. 2015, 356, 612–615. [Google Scholar] [CrossRef]
  8. Heinson, W.R.; Chakrabarti, A.; Sorensen, C.M. Crossover from spherical particle Mie scattering to circular aperture diffraction. J. Opt. Soc. Am. A 2014, 31, 2362–2364. [Google Scholar] [CrossRef] [PubMed]
  9. Guinier, A.; Fournet, G. Small-Angle Scattering of X-rays; Wiley: New York, NY, USA, 1955; p. 268. [Google Scholar]
  10. Heinson, Y.W.; Maughan, J.B.; Ding, J.C.; Chakrabarti, A.; Yang, P.; Sorensen, C.M. Q-space analysis of light scattering by ice crystals. J. Quant. Spectrosc. Radiat. 2016, 185, 86–94. [Google Scholar] [CrossRef]
  11. Hecht, E. Optics, 4th ed.; Addison-Wesley: Reading, MA, USA, 2002; p. 698. [Google Scholar]
  12. Wang, G.; Chakrabarti, A.; Sorensen, C.M. Effect of the imaginary part of the refractive index on light scattering by spheres. J. Opt. Soc. Am. A 2015, 32, 1231–1235. [Google Scholar] [CrossRef] [PubMed]
  13. Sorensen, C.M.; Maughan, J.B.; Chakrabarti, A. The partial light scattering cross section of spherical particles. J. Opt. Soc. Am. A. accepted for publication.
  14. Munoz, O.; Moreno, F.; Guirado, D.; Dabrowska, D.D.; Volten, H.; Hovenier, J.W. The amsterdam-granada light scattering database. J. Quant. Spectrosc. Radiat. 2012, 113, 565–574. [Google Scholar] [CrossRef]
  15. Munoz, O.; Volten, H.; Hovenier, J.W.; Nousiainen, T.; Muinonen, K.; Guirado, D.; Moreno, F.; Waters, L.B.F.M. Scattering matrix of large saharan dust particles: Experiments and computations. J. Geophys. Res. Atmos. 2007, 112. [Google Scholar] [CrossRef]
  16. Sorensen, C.M. Q-space analysis of scattering by dusts. J. Quant. Spectrosc. Radiat. 2013, 115, 93–95. [Google Scholar] [CrossRef]
  17. Heinson, Y.W.; Maughan, J.B.; Heinson, W.R.; Chakrabarti, A.; Sorensen, C.M. Light scattering q-space analysis of irregularly shaped particles. J. Geophys. Res. Atmos. 2016, 121, 682–691. [Google Scholar]
  18. Volten, H.; Munoz, O.; Rol, E.; de Haan, J.F.; Vassen, W.; Hovenier, J.W.; Muinonen, K.; Nousiainen, T. Scattering matrices of mineral aerosol particles at 441.6 nm and 632.8 nm. J. Geophys. Res. Atmos. 2001, 106, 17375–17401. [Google Scholar] [CrossRef]
  19. Munoz, O.; Volten, H.; de Haan, J.F.; Vassen, W.; Hovenier, J.W. Experimental determination of scattering matrices of olivine and allende meteorite particles. Astron. Astrophys. 2000, 360, 777–788. [Google Scholar]
  20. Munoz, O.; Volten, H.; de Haan, J.F.; Vassen, W.; Hovenier, J.W. Experimental determination of scattering matrices of randomly oriented fly ash and clay particles at 442 and 633 nm. J. Geophys. Res. Atmos. 2001, 106, 22833–22844. [Google Scholar] [CrossRef]
  21. Shkuratov, Y.; Ovcharenko, A.; Zubko, E.; Volten, H.; Munoz, O.; Videen, G. The negative polarization of light scattered from particulate surfaces and of independently scattering particles. J. Quant. Spectrosc. Radiat. 2004, 88, 267–284. [Google Scholar] [CrossRef]
  22. Munoz, O.; Volten, H.; Hovenier, J.W.; Min, M.; Shkuratov, Y.G.; Jalava, J.P.; van der Zande, W.J.; Waters, L.B.F.M. Experimental and computational study of light scattering by irregular particles with extreme refractive indices: Hematite and rutile. Astron. Astrophys. 2006, 446, 525–535. [Google Scholar] [CrossRef]
  23. Laan, E.C.; Volten, H.; Stam, D.M.; Munoz, O.; Hovenier, J.W.; Roush, T.L. Scattering matrices and expansion coefficients of martian analogue palagonite particles. Icarus 2009, 199, 219–230. [Google Scholar] [CrossRef]
  24. Munoz, O.; Volten, H.; Hovenier, J.W.; Veihelmann, B.; van der Zande, W.J.; Waters, L.B.F.M.; Rose, W.I. Scattering matrices of volcanic ash particles of Mount ST. Helens, Redoubt, and Mount Spurr volcanoes. J. Geophys. Res. Atmos. 2004, 109. [Google Scholar] [CrossRef]
  25. Wang, Y.; Chakrabarti, A.; Sorensen, C.M. A light-scattering study of the scattering matrix elements of arizona road dust. J. Quant. Spectrosc. Radiat. 2015, 163, 72–79. [Google Scholar] [CrossRef]
  26. Heinson, Y.W.; Chakrabarti, A.; Sorensen, C.M. A light-scattering study of Al2O3 abrasives of various grit sizes. J. Quant. Spectrosc. Radiat. 2016, 180, 84–91. [Google Scholar] [CrossRef]
  27. Sorensen, C.M. Light scattering by fractal aggregates: A review. Aerosol Sci. Technol. 2001, 35, 648–687. [Google Scholar] [CrossRef]
  28. Sorensen, C.M.; Oh, C.; Schmidt, P.W.; Rieker, T.P. Scaling description of the structure factor of fractal soot composites. Phys. Rev. E 1998, 58, 4666–4672. [Google Scholar] [CrossRef]
  29. Dubovik, O.; Sinyuk, A.; Lapyonok, T.; Holben, B.N.; Mishchenko, M.; Yang, P.; Eck, T.F.; Volten, H.; Munoz, O.; Veihelmann, B.; et al. Application of spheroid models to account for aerosol particle nonsphericity in remote sensing of desert dust. J. Geophys. Res. Atmos. 2006, 111. [Google Scholar] [CrossRef]
  30. Mishchenko, M.I.; Travis, L.D. Capabilities and limitations of a current FORTRAN implementation of the T-matrix method for randomly oriented, rotationally symmetric scatterers. J. Quant. Spectrosc. Radiat. 1998, 60, 309–324. [Google Scholar] [CrossRef]
  31. Mishchenko, M.I.; Travis, L.D.; Mackowski, D.W. T-matrix computations of light scatteringby nonspherical particles: A review. J. Quant. Spectrosc. Radiat. 2010, 111, 1704–1744. [Google Scholar]
  32. Maughan, J.B.; Chakrabarti, A.; Sorensen, C.M. Rayleigh scattering and the internal coupling parameter for arbitrary shapes. J. Quant. Spectrosc. Radiat. 2017, 189, 339–343. [Google Scholar]
  33. Yurkin, M.A.; Hoekstra, A.G. The discrete dipole approximation: An overview and recent developments. J. Quant. Spectrosc. Radiat. 2007, 106, 558–589. [Google Scholar] [CrossRef]
  34. Sorensen, C.M.; Zubko, E.; Heinson, W.R.; Chakrabarti, A. Q-space analysis of scattering by small irregular particles. J. Quant. Spectrosc. Radiat. 2014, 133, 99–105. [Google Scholar] [CrossRef]
  35. Zubko, E.; Shkuratov, Y.; Kiselev, N.N.; Videen, G. Dda simulations of light scattering by small irregular particles with various structure. J. Quant. Spectrosc. Radiat. 2006, 101, 416–434. [Google Scholar] [CrossRef]
  36. Zubko, E.; Shkuratov, Y.; Mishchenko, M.; Videen, G. Light scattering in a finite multi-particle system. J. Quant. Spectrosc. Radiat. 2008, 109, 2195–2206. [Google Scholar] [CrossRef]
  37. Zubko, E.; Kimura, H.; Shkuratov, Y.; Muinonen, K.; Yamamoto, T.; Okamoto, H.; Videen, G. Effect of absorption on light scattering by agglomerated debris particles. J. Quant. Spectrosc. Radiat. 2009, 110, 1741–1749. [Google Scholar]
  38. Purcell, E.M.; Pennypacker, C.R. Scattering and absorption of light by nonspherical dielectric grains. Astrophys. J. 1973, 186, 705–714. [Google Scholar] [CrossRef]
  39. Yurkin, M.A.; Maltsev, V.P.; Hoekstra, A.G. The discrete dipole approximation for simulation of light scattering by particles much larger than the wavelength. J. Quant. Spectrosc. Radiat. 2007, 106, 546–557. [Google Scholar]
  40. Yurkin, M.A.; Hoekstra, A.G. The discrete-dipole-approximation code ADDA: Capabilities and known limitations. J. Quant. Spectrosc. Radiat. 2011, 112, 2234–2247. [Google Scholar] [CrossRef]
  41. Oh, C.; Sorensen, C.M. Scaling approach for the structure factor of a generalized system of scatterers. J. Nanopart Res. 1999, 1, 369–377. [Google Scholar] [CrossRef]
  42. Muinonen, K.; Zubko, E.; Tyynela, J.; Shkuratov, Y.G.; Videen, G. Light scattering by gaussian random particles with discrete-dipole approximation. J. Quant. Spectrosc. Radiat. 2007, 106, 360–377. [Google Scholar] [CrossRef]
  43. Maughan, J.B.; Sorensen, C.M.; Chakrabarti, A. Q-space analysis of light scattering by gaussian random spheres. J. Quant. Spectrosc. Radiat. 2016, 174, 14–21. [Google Scholar] [CrossRef]
  44. Chakrabarty, R.K.; Beres, N.D.; Moosmuller, H.; China, S.; Mazzoleni, C.; Dubey, M.K.; Liu, L.; Mishchenko, M.I. Soot superaggregates from flaming wildfires and their direct radiative forcing. Sci. Rep. UK 2014, 4, 5508. [Google Scholar] [CrossRef] [PubMed]
  45. Berg, M.J.; Sorensen, C.M. Internal fields of soot fractal aggregates. J. Opt. Soc. Am. A 2013, 30, 1947–1955. [Google Scholar]
  46. Zubko, E.; Petrov, D.; Grynko, Y.; Shkuratov, Y.; Okamoto, H.; Muinonen, K.; Nousiainen, T.; Kimura, H.; Yamamoto, T.; Videen, G. Validity criteria of the discrete dipole approximation. Appl. Opt. 2010, 49, 1267–1279. [Google Scholar] [CrossRef] [PubMed]
  47. Yurkin, M.A.; de Kanter, D.; Hoekstra, A.G. Accuracy of the discrete dipole approximation for simulation of optical properties of gold nanoparticles. J. Nanophoton. 2010, 4, 041585. [Google Scholar]
  48. Yang, P.; Bi, L.; Baum, B.A.; Liou, K.N.; Kattawar, G.W.; Mishchenko, M.I.; Cole, B. Spectrally consistent scattering, absorption, and polarization properties of atmospheric ice crystals at wavelengths from 0.2 to 100 µm. J. Atmos. Sci. 2013, 70, 330–347. [Google Scholar]
  49. Brillouin, L. The scattering cross section of spheres for electromagnetic waves. J. Appl. Phys. 1949, 20, 1110–1125. [Google Scholar] [CrossRef]
  50. Curtis, D.B.; Meland, B.; Aycibin, M.; Arnold, N.P.; Grassian, V.H.; Young, M.A.; Kleiber, P.D. A laboratory investigation of light scattering from representative components of mineral dust aerosol at a wavelength of 550 nm. J. Geophys. Res. Atmos. 2008, 113, 693–702. [Google Scholar] [CrossRef]
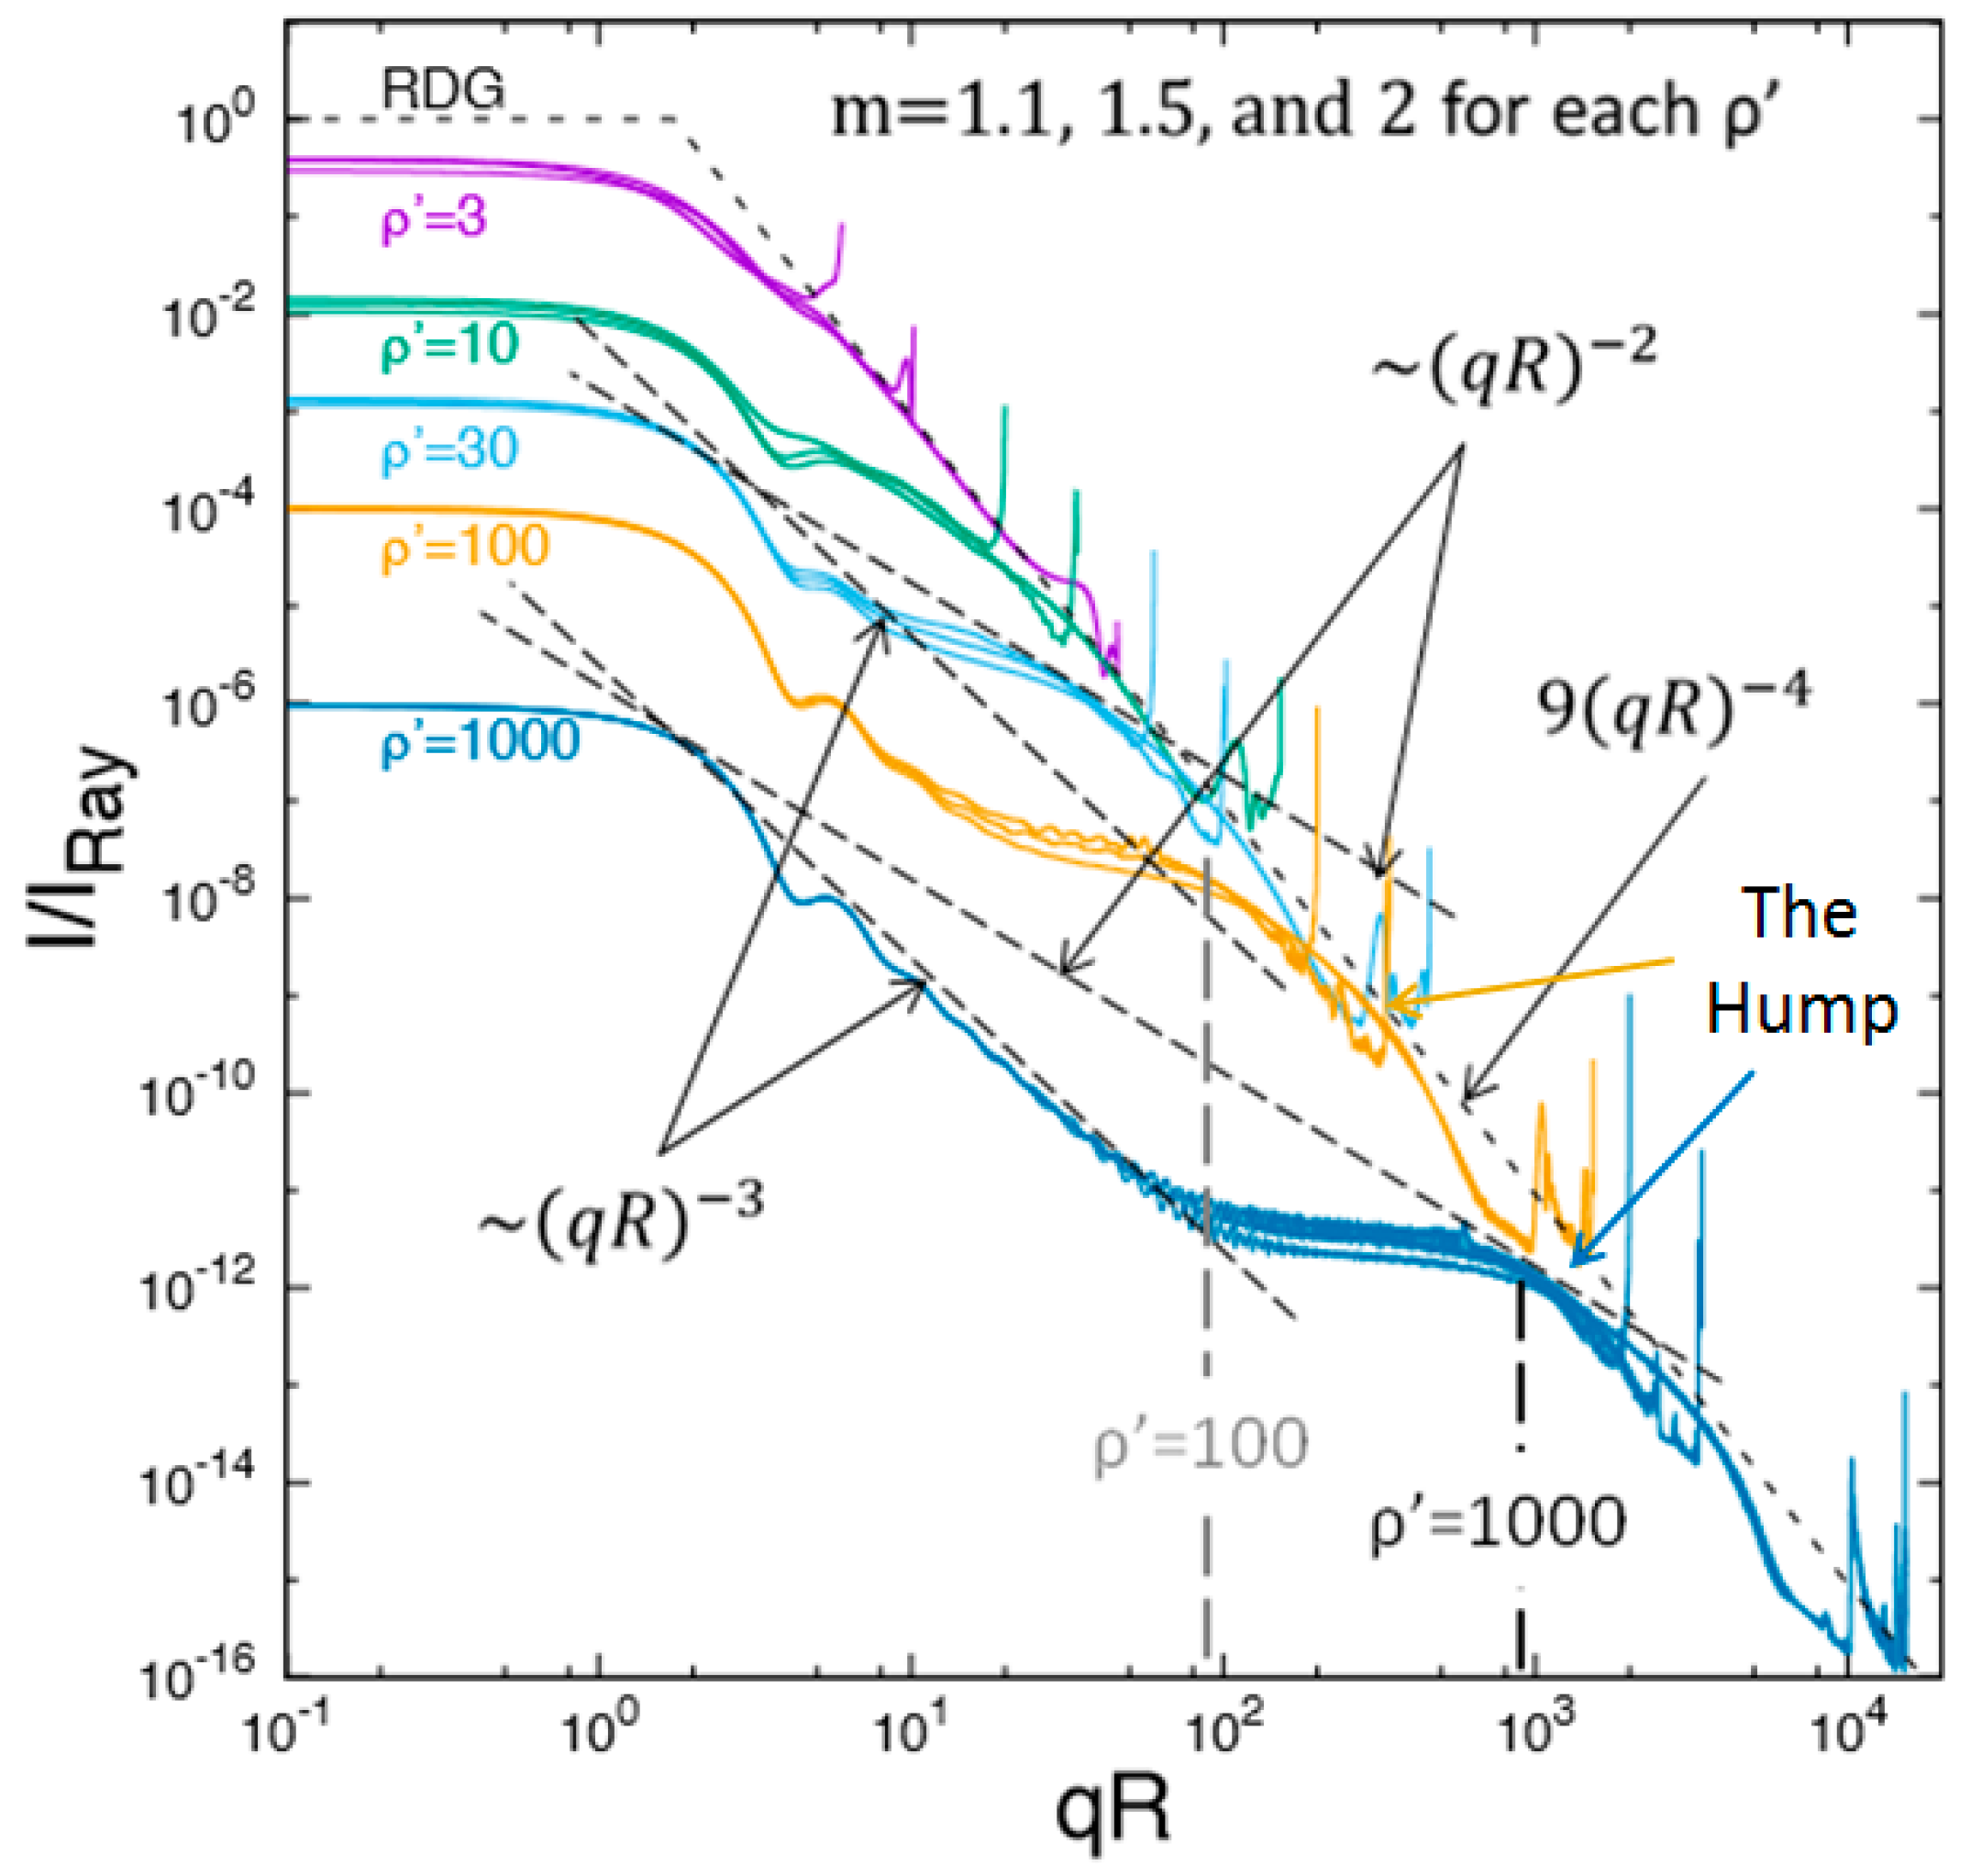
Figure 1. Q-space analysis of spheres for the RDG limit ( ρ 0 , dashed line) and ρ = 3, 10, 30, 100, and 1000. Rayleigh normalized scattering intensity is plotted versus qR. The scattering curves with the same ρ fall on top of each other (despite widely ranging R and m). Various power laws and the Hump (for ρ = 100 and 1000) are indicated. A small size distribution (20% log-normal size distribution) has been applied to eliminate the interference ripples. From [10].
Atmosphere 08 00068 g001
Figure 2. (a) Rayleigh normalized forward scattering, I ( 0 ) / I R a y , versus ρ ; and (b) Rayleigh normalized forward scattering multiplied by ρ 2 versus ρ . From [10].
Atmosphere 08 00068 g002
Figure 3. Comparison between the scattered light from spheres with ρ = 235 (e.g., real refractive index n = 1.5 and kR = 400) and κ k R   =   0 , thus without absorption, and κ k R   =   10 , thus with significant absorption (If kR = 400, κ = 0.025). (a) Normalized intensity plotted logarithmically versus qR (From [10]). (b) Normalized intensity plotted linearly versus the scattering angle θ.
Atmosphere 08 00068 g003
Figure 4. Saharan dust particles from [15] with a model Gaussian random sphere for comparison. Scale bar at lower left is 30 microns.
Atmosphere 08 00068 g004
Figure 5. The F11 Mueller matrix element (scattered intensity for unpolarized incident light) for light scattering from Saharan dust: (a) scattering plotted vs. scattering angle θ; and (b) scattering plotted vs. the scattering wave vector magnitude, q. From [3].
Atmosphere 08 00068 g005
Figure 6. Q-space plots of the S11 matrix element (scattered intensity for unpolarized incident light) for light scattering from some of the Amsterdam-Granada data set [14]. (a) Feldspar, Redy clay, Quartz, Loess, Sahara [18], Allende [19], Green clay, and Fly ash [20] measured at λ = 441.6   nm ; (b) Hematite [21,22], Rutile [22], Martian analog (palagonite) [23], and Sahara sand (Libya) [15] measured at λ = 632.8   nm ; (c) Volcanic ash (Redoubt A, Redoubt B, Spurr Ashton, Spurr Anchorage, Spurr Gunsight, Spurr Stop 33) [24] measured at λ = 632.8   nm ; and (d) Olivine S, Olivine M, Olivine L, and Olivine XL [19] measured at λ = 441.6   nm . In all graphs the lines are power law fits to the data and the number to the right of the plot is the power law exponent. From [17].
Atmosphere 08 00068 g006
Figure 7. Optical microscope pictures of: (a) Arizona Road Dust (AZRD) from [25]; and (b) Al2O3 abrasive powders from [26]. Sizes, 2Rg and 2R, infered from Guinier analysis of the scattered light are given.
Atmosphere 08 00068 g007
Figure 8. Scattered intensity from Arizona Road Dust for unpolarized incident light versus q normalized at the smallest q. Dashed vertical line indicates where the scattering angle is 3°. From [25].
Atmosphere 08 00068 g008
Figure 9. Scattered intensity (arbitrary units) versus the magnitude of the scattering wave vector q for six different sizes of Al2O3 abrasive grits. The manufacturer’s size is labeled in each figure. Power law regimes are indicated by straight lines and the power law is labeled. From [26].
Atmosphere 08 00068 g009
Figure 10. Scattered light intensity versus q for in-flame soot as a function of height above the burner surface, h. The flame was a methane/oxygen premixed flame with a carbon/oxygen ratio of 0.75 [28].
Atmosphere 08 00068 g010
Figure 11. Rayleigh normalized scattered intensity versus qRveq (volume equivalent radius) for spheroids: (a) prolate spheroids; and (b) oblate spheroids with aspect ratios f = 2 and 1/2, respectively. Plots with different generalized internal coupling parameters ρ are given. The structure factor is when ρ = 0.
Atmosphere 08 00068 g011
Figure 12. Irregular spheres: (a) strongly damaged; (b) rough surface; (c) pocked spheres; and (d) agglomerated debris particles.
Atmosphere 08 00068 g012
Figure 13. Q-space analysis of the scattering by agglomerated debris particles of different internal coupling parameters, ρ . (a) The structure S(q) factor (m → 1.00). Seven size parameters from kR = 2 to 14 are superimposed. (b) Light scattering with refractive index as marked at seven different internal coupling parameters ρ . When a power law could be fit, the fit line is shown and the power law qx is labeled in the key. These plots were shifted up and down for visibility. Adapted from [34].
Atmosphere 08 00068 g013
Figure 14. Rayleigh normalized forward scattering versus the internal coupling parameter ρ for four different types of irregular spheres and three different refractive indices, m = 1.313, 1.5 + 0.1i and 1.6 + 0.0005i (hence a total of 12 sets of data).
Atmosphere 08 00068 g014
Figure 15. Forward normalized scattered intensity of GRSs compared to spheres for (a) k R v e q   =   10 , m = 1.01−1.5; and (b) k R v e q = 30 , m = 1.01−1.5. The dashed lines with data points are the computational data from DDA calculations. Dash-dot lines are Mie calculations for a size distribution of spheres with ρ values of the most probable radius equivalent to the ρ values of the GRSs, and a geometric deviation in the sphere size distribution of σ = 1.2 . Solid lines are power laws ( q R e q ) x with exponent x given in the legend. Note that the curves have been shifted up by factors of 10 to separate them. From [43].
Atmosphere 08 00068 g015
Figure 16. (a) SEM images of a typical soot superaggregate obtained from sampling of smoke plumes from the Nagarhole, India forest fire [44]. (b) A thickened percolation cluster, from [17].
Atmosphere 08 00068 g016
Figure 17. Scattered intensity versus qReq for thickened percolation clusters. Lines are the power law fits and the numbers to the right of the plots are the exponents of the power law. A different multiplication factor is applied to the intensity for each plot for clarity.
Atmosphere 08 00068 g017
Figure 18. Q-space analysis of scattering by nine different ice crystal shapes. Plotted is the Rayleigh normalized scattering intensity, I/IRay, versus qReq. Three different values of the internal coupling parameter ρ and three values of roughness, 0.0 (smooth), 0.03 (moderately rough) and 0.5 (severely rough) are shown for each shape. Lines for various power laws are marked. Pictures of the shapes are also included. Adapted from [10].
Atmosphere 08 00068 g018
Figure 19. Rayleigh normalized forward scattering intensity, I(0)/IRay, multiplied by the square of the internal coupling parameter, ρ 2, versus ρ for nine different ice crystal shapes with three different values of roughness, 0.0 (smooth), 0.03 (moderately rough) and 0.5 (severely rough). Included are pictures of the shapes. These plots were adapted from [10] with values for ρ > 103 deleted due to suspected computational problems. The interested reader is referred to [10].
Atmosphere 08 00068 g019
Figure 20. Comparisons between the light scattered from: (a) a droxtal ice crystal; and (b) two solid column structures with different aspect ratios, with and without absorption and, in each case, volume equivalent spheres. All the ice crystals and the spheres with significant absorption, as indicated by κkR > 1, lose the hump and the glory. Note also the two Guinier regimes for the solid columns with κ k R e q = 20 match q R e q = ( L / R e q ) 1 and q R e q = ( 2 a / R e q ) 1 . Adapted from [10].
Atmosphere 08 00068 g020
Figure 21. The exponents of the power laws versus the internal coupling parameter ρ . DLCA fractal aggregates typically have ρ < 1 and an exponent equal to the fractal dimension D 1.8. Amsterdam-Granada data are from [14]; AZRD (Iowa) data are from [50]. Graph is from [17].
Atmosphere 08 00068 g021