Article

The Use of a Spectral Nudging Technique to Determine the Impact of Environmental Factors on the Track of Typhoon Megi (2010)

Institute of Meteorology and Oceanography, National University of Defense Technology, Nanjing 211101, China
*
Author to whom correspondence should be addressed.
Atmosphere 2017, 8(12), 257; https://doi.org/10.3390/atmos8120257
Submission received: 3 October 2017 / Revised: 7 December 2017 / Accepted: 7 December 2017 / Published: 20 December 2017
(This article belongs to the Special Issue Tropical Cyclones and Their Impacts)

Abstract

:
Sensitivity tests based on a spectral nudging (SN) technique are conducted to analyze the effect of large-scale environmental factors on the movement of typhoon Megi (2010). The error of simulated typhoon track is effectively reduced using SN and the impact of dynamical factors is more significant than that of thermal factors. During the initial integration and deflection period of Megi (2010), the local steering flow of the whole and lower troposphere is corrected by a direct large-scale wind adjustment, which improves track simulation. However, environmental field nudging may weaken the impacts of terrain and typhoon system development in the landfall period, resulting in large simulated track errors. Comparison of the steering flow and inner structure of the typhoon reveals that the large-scale circulation influences the speed and direction of typhoon motion by: (1) adjusting the local steering flow and (2) modifying the environmental vertical wind shear to change the location and symmetry of the inner severe convection.

1. Introduction

Although the forecasting accuracy of typhoon tracks has been effectively improved in recent years through observations, numerical simulations, data assimilation and studies of the physical mechanisms affecting typhoon movement [1], the accurate prediction of abnormal typhoon tracks, including their continuous changes and abrupt deflection, is still not possible [2]. Therefore, an extensive study of the physical mechanism underlying the abnormal motion of typhoons is fundamental to improving their simulation and prediction.
Typhoon Megi (2010) was the most powerful typhoon over the western North Pacific Ocean in 2010. It was generated in an ocean area southwest of Guam on 11 October and made landfall at Luzon Island on 18 October. On 23 October, Megi made a second landfall over Fujian province in China and dissipated the next day. From 0600 UTC 19 October to 1200 UTC 20 October, Megi entered the South China Sea (SCS) and suddenly made a sharp northward turn, which was the most noteworthy feature during its life and led to difficulties in predicting its track. This unusual track change was not predicted accurately by any of the leading operational centers, making it difficult for the prevention and reduction of typhoon damage. Several studies have investigated the sudden track deflection of Megi by considering the effects of major weather systems on the typhoon system and its inner structure [3,4,5]. Based on the studies of Kieu et al. [6] and Peng et al. [7], large-scale environmental flow plays the most important role in Megi’s movement. Besides, it has been shown that the western Pacific subtropical high (WPSH) and an approaching eastward-moving mid-latitude trough played an important role in Megi’s sudden northward deflection [8]. And Megi’s northward track deflection was mainly determined by the influence of mid-latitude circulation [9].
Because the movement of a typhoon is mainly determined by the large-scale environmental flow [10,11], it is critical for a limited-area model to appropriately describe the large-scale background circulation. To ensure that the large-scale environmental flow simulated by a limited-area model remains similar to observations or analysis, Waldron et al. [12] proposed a spectral nudging (SN) technique, which was then implemented by Storch et al. [13]. The main purpose of SN technique is to correct the simulated large-scale circulation without deteriorating regional scales. Up to now, the SN technique has been widely used in regional climate models. Many studies have shown that it can improve the simulation of typhoon climatological activity [14,15]. Recently, some studies have used the SN technique in typhoon case studies. Feser and Storch [16] used the SN technique in the simulation of typhoon Winnie (1997). It was found that the SN technique could improve the simulation of Winnie’s motion and the evolution of the typhoon. Li et al. [17] conducted a high-resolution simulation of typhoon Longwang (2005) with the Weather Research and Forecasting (WRF) model and found that the SN technique could effectively simulate the formation and evolution of the typhoon. Wang et al. [18] adopted an approach that combined dynamical initialization and SN to produce a simulated track and intensity of Megi (2010) that was very similar to the observation. Thus, it has been demonstrated that the SN technique can effectively improve typhoon simulation and especially the simulation of a typhoon track.
However, the effects of environmental factors on the typhoon track are extremely complicated. Different physical factors in the environmental field will have different impacts on the deflection of a typhoon track. On the other hand, environmental factors will interact with other outside forcings (e.g., topographic forcing) or the inner structure of the typhoon itself, leading to the deflection of a typhoon track. Megi was under the influence of several systems and several factors during the change in its track, in which it experienced different large-scale circulation systems and passed over the high terrain of Luzon Island. Thus, its path included not only a deflection period after leaving Luzon Island but also a notable period of southward movement when approaching and landing on the island. Therefore, investigating the effect of different factors (dynamical or thermal) of the environmental field on Megi’s track during its evolution will not only help to select a proper configuration for the application of the SN technique but also enable a better understanding of the physical mechanisms by which environmental factors affect the typhoon track.
In this study, the SN technique is used in the simulation of typhoon Megi and sensitivity tests are conducted to investigate the effect of different environmental factors of the environmental field on Megi’s track before and after it passes over Luzon Island. The experimental design in this study is different from that of many previous studies [19,20,21,22,23] in which SN is often used to correct large-scale circulation in the upper atmosphere levels. Therefore, the experimental design in this study has certain limitations and is unlikely to get optimal simulation results. Since the purpose is to investigate the impact of different environmental field, which affects specificity of the experimental design in this study, SN will be adopted at all model levels regardless of environmental field at upper or lower levels.
The experimental design and SN technique are introduced in Section 2. Section 3 describes the sensitivity tests and results. Section 4 explores the physical mechanism of large-scale environmental effects on the typhoon track in the different periods. A discussion of the results and the conclusions of the study are given in Section 5.

2. Experimental Design and SN

2.1. Experimental Design of Numerical Simulation

The numerical simulations presented in this study are conducted using the WRF model (WRFV3.4), which is developed by a collaboration of research institutions, including the National Centers for Environmental Prediction (NCEP) and the National Center for Atmospheric Research (NCAR). The model’s initial and lateral boundary conditions are interpolated from the NCEP Final Operational Global Analysis (FNL) and the input sea surface temperature (SST) data are obtained from the National Oceanic and Atmospheric Administration (NOAA) SST analysis. The model integrates from 0600 UTC 17 October to 0600 UTC 21 October. The simulation period contains the southward moving period when the typhoon approaches and moves over Luzon Island, as well as the deflection period after it leaves the island. There are 246 × 176 grid points in each of the zonal and meridional directions, with a horizontal grid spacing of 18 km and 36 vertical layers between the model top at 50 hPa and the surface. The selected simulation range covers the full range of the movement of Megi during the simulation period and contains the major weather systems that affect its track, i.e., the WPSH, a continental high-pressure system in the northeast of China and the South Asian High (SAH). After conducting several tests with different configuration of physical parameterization schemes, we select the one (Table 1) with the best simulation result as the configuration of physical parameterization schemes for the control experiment (CTRL). WRF Single-Moment 6-class (WSM6) scheme is an option of microphysics schemes in WRF.
Figure 1 shows the simulated typhoon track of CTRL compared with the observation. To quantitatively analyze the accuracy of the track simulated by CTRL and the following sensitivity tests, the error of the typhoon track is calculated:
E r r o r = ( x obs x model ) 2 + ( y obs y model ) 2
where x obs x model and y obs y model are the zonal and meridional distances between the observation and model results, respectively. The mean errors for the first 24, 48, 72 and 96 h of the typhoon track simulated by CTRL are calculated and are 23, 20, 37 and 86 km, respectively. It can be seen that the error of the first 48 h integration is small but increases rapidly during the latter 48 h. From the observed typhoon track (Figure 1, 0600 UTC 19 October (i.e., 48 h after the initial integration time) is determined to be the deflection moment when the southwestward moving typhoon begins to turn northward. By setting this moment as the demarcation point, the errors before and after the deflection moment are 20 and 160 km, respectively. In conclusion, CTRL precisely simulates the deflection moment as well as the speed and direction of typhoon movement before the deflection. However, the simulated track after the deflection needs to be improved.
The background circulation patterns of NCEP and CTRL are analyzed in this section (Figure 2). Before the deflection moment (Figure 2a), the strong WPSH around 20°–25° N and the continental high in the northeast of China prevents the typhoon from moving northward. The anticyclonic circulation south of the high joins with the cyclonic circulation north and northwest of the typhoon, forming a strong jet that forces the typhoon to move westward. Compared to the background circulation simulated by CTRL (Figure 2c), there is a minor deviation in the 500 hPa geopotential height field between the CTRL and the NCEP. The positions of the WPSH and the continental high are precisely simulated by the CTRL. The deviation in the 850 hPa wind field is also minor. Thus, the simulated typhoon track is similar to the observed track before the deflection, both moving southwestward. However, after the deflection moment (Figure 2b), the subtropical high moves eastward at the 500 hPa level and its influence on the evolution and movement of the typhoon reduces. Due to the abrupt enhancement of the cross-equatorial flow, the southwester south of the typhoon is rapidly enhanced, which leads the typhoon to turn to north. At this moment, the geopotential height field simulated by CTRL (Figure 2d) has a large deviation from the NCEP. The simulated subtropical high does not move eastward. The simulated cross-equatorial flow is so strong and the simulated west wind at the 850 hPa level is much stronger than that in the NCEP, leading to the track simulated by CTRL deviating to the east after the track deflection.
In all, the simulation result of CTRL precisely reflects the southward landfall process, the deflection moment as well as the speed and direction of typhoon movement before the deflection. However, due to the simulated error of large-scale environmental field, the simulated error of Megi’s deflection process is significant.

2.2. The SN Technique

The aim of the SN technique is to add a new term to the tendencies of the variables that relax the selected part of a spectrum to the corresponding waves from a reanalysis, ensuring that the model simulates large-scale components that are close to the reanalysis data [12,13,24]. First, a nudged model variable Ψ is selected and then decomposed together with the corresponding reanalysis variable Ψa:
Ψ ( λ , ϕ , t ) = j = J m , k = K m J m , K m α j , k m ( t ) exp ( i j λ / L λ ) exp ( i k ϕ / L ϕ )
Ψ a ( λ , ϕ , t ) = j = J a , k = K a J a , K a α j , k a ( t ) exp ( i j λ / L λ ) exp ( i k ϕ / L ϕ )
where λ and φ are, respectively, the zonal and meridional coordinates, t represents time, L λ and L ϕ are the zonal and meridional extensions of area, respectively, Jm and Km are the highest wave numbers decomposed from the model variables and Ja and Ka are the highest wave numbers decomposed from the reanalysis variables. The nudging terms are obtained by Ψ minus Ψa multiplied by a coefficient:
j = J a , k = K a J a , K a η j , k [ α j , k a ( t ) α j , k m ( t ) ] exp ( i j λ / L λ ) exp ( i k ϕ / L ϕ )
with the coefficient η j , k , which can vary with height. The overall SN technique can be mathematically expressed as follows:
Ψ t = L ( Ψ ) j = J a , k = K a J a , K a η j , k [ α j , k a ( t ) α j , k m ( t ) ] exp ( i j λ / L λ ) exp ( i k ϕ / L ϕ )
where L is the model operator. As a result of SN, a specific model variable can be selected and constrained close to the reanalysis variable at a specific scale or height.
Thus, the SN technique can reduce the simulated large-scale environmental flow deviation. It can also reflect the influence of different environmental factors on the simulation results by selecting the nudging variables. In this study, SN in the WRF model is applied to reduce the deviation of the simulated large-scale environmental flow. The SN scheme in the WRF model can be used to select and nudge zonal and meridional wind components (u, v), potential temperatures (θ) and geopotential (Φ). It can also nudge at all levels or only above a specified model level. In SN, the zonal and meridional wave numbers (Ja and Ka) are chosen to correspond to the chosen spatial scales in the zonal and meridional directions. In this study, sensitivity tests are conducted by selecting nudging variables to obtain the optimal parameter configuration for the simulation of typhoon Megi and to analyze the physical mechanisms by which environmental factors affect the typhoon track. It’s important to note that for operational practice, we don’t have the reanalysis field during the entire integration period, except for the initial time. Therefore, sensitivity tests which nudge over all simulation intervals in this study render this work unrealistic for most practical applications. Besides, the initial and boundary conditions for this study are taken from the NCEP FNL reanalysis. This reanalysis data is good for research purposes but it’s in general not a good proxy for actual forecasts. In spite of this limitation, investigating the physical mechanism of typhoon track based on spectral nudging technique still has important theoretical significance.

3. Effect of Different Large-Scale Environmental Factors

3.1. Sensitivity Tests

According to the available nudging variables in the WRF model, sensitivity tests are undertaken by selecting different nudging variables (Table 2). SN1 nudges zonal and meridional wind components; SN2 nudges wind components and geopotential; SN3 nudges potential temperature; and SN4 nudges all of the available variables in the WRF model. Because the wind and geopotential fields reflect the dynamical features of the environmental field, while the potential temperature field reflects the thermal features, SN1 and SN2 reflect the influence of dynamical factors of the large-scale environmental field, while SN3 reflects the influence of thermal factors of the large-scale environmental field. SN4 reflects the joint influence of dynamical and thermal factors. Considering the basic spatial scale of a typhoon, the wave numbers chosen in the sensitivity tests are Ja = 4 and Ka = 3, which corresponds to spatial scales of 1000 km in both the zonal and meridional directions.

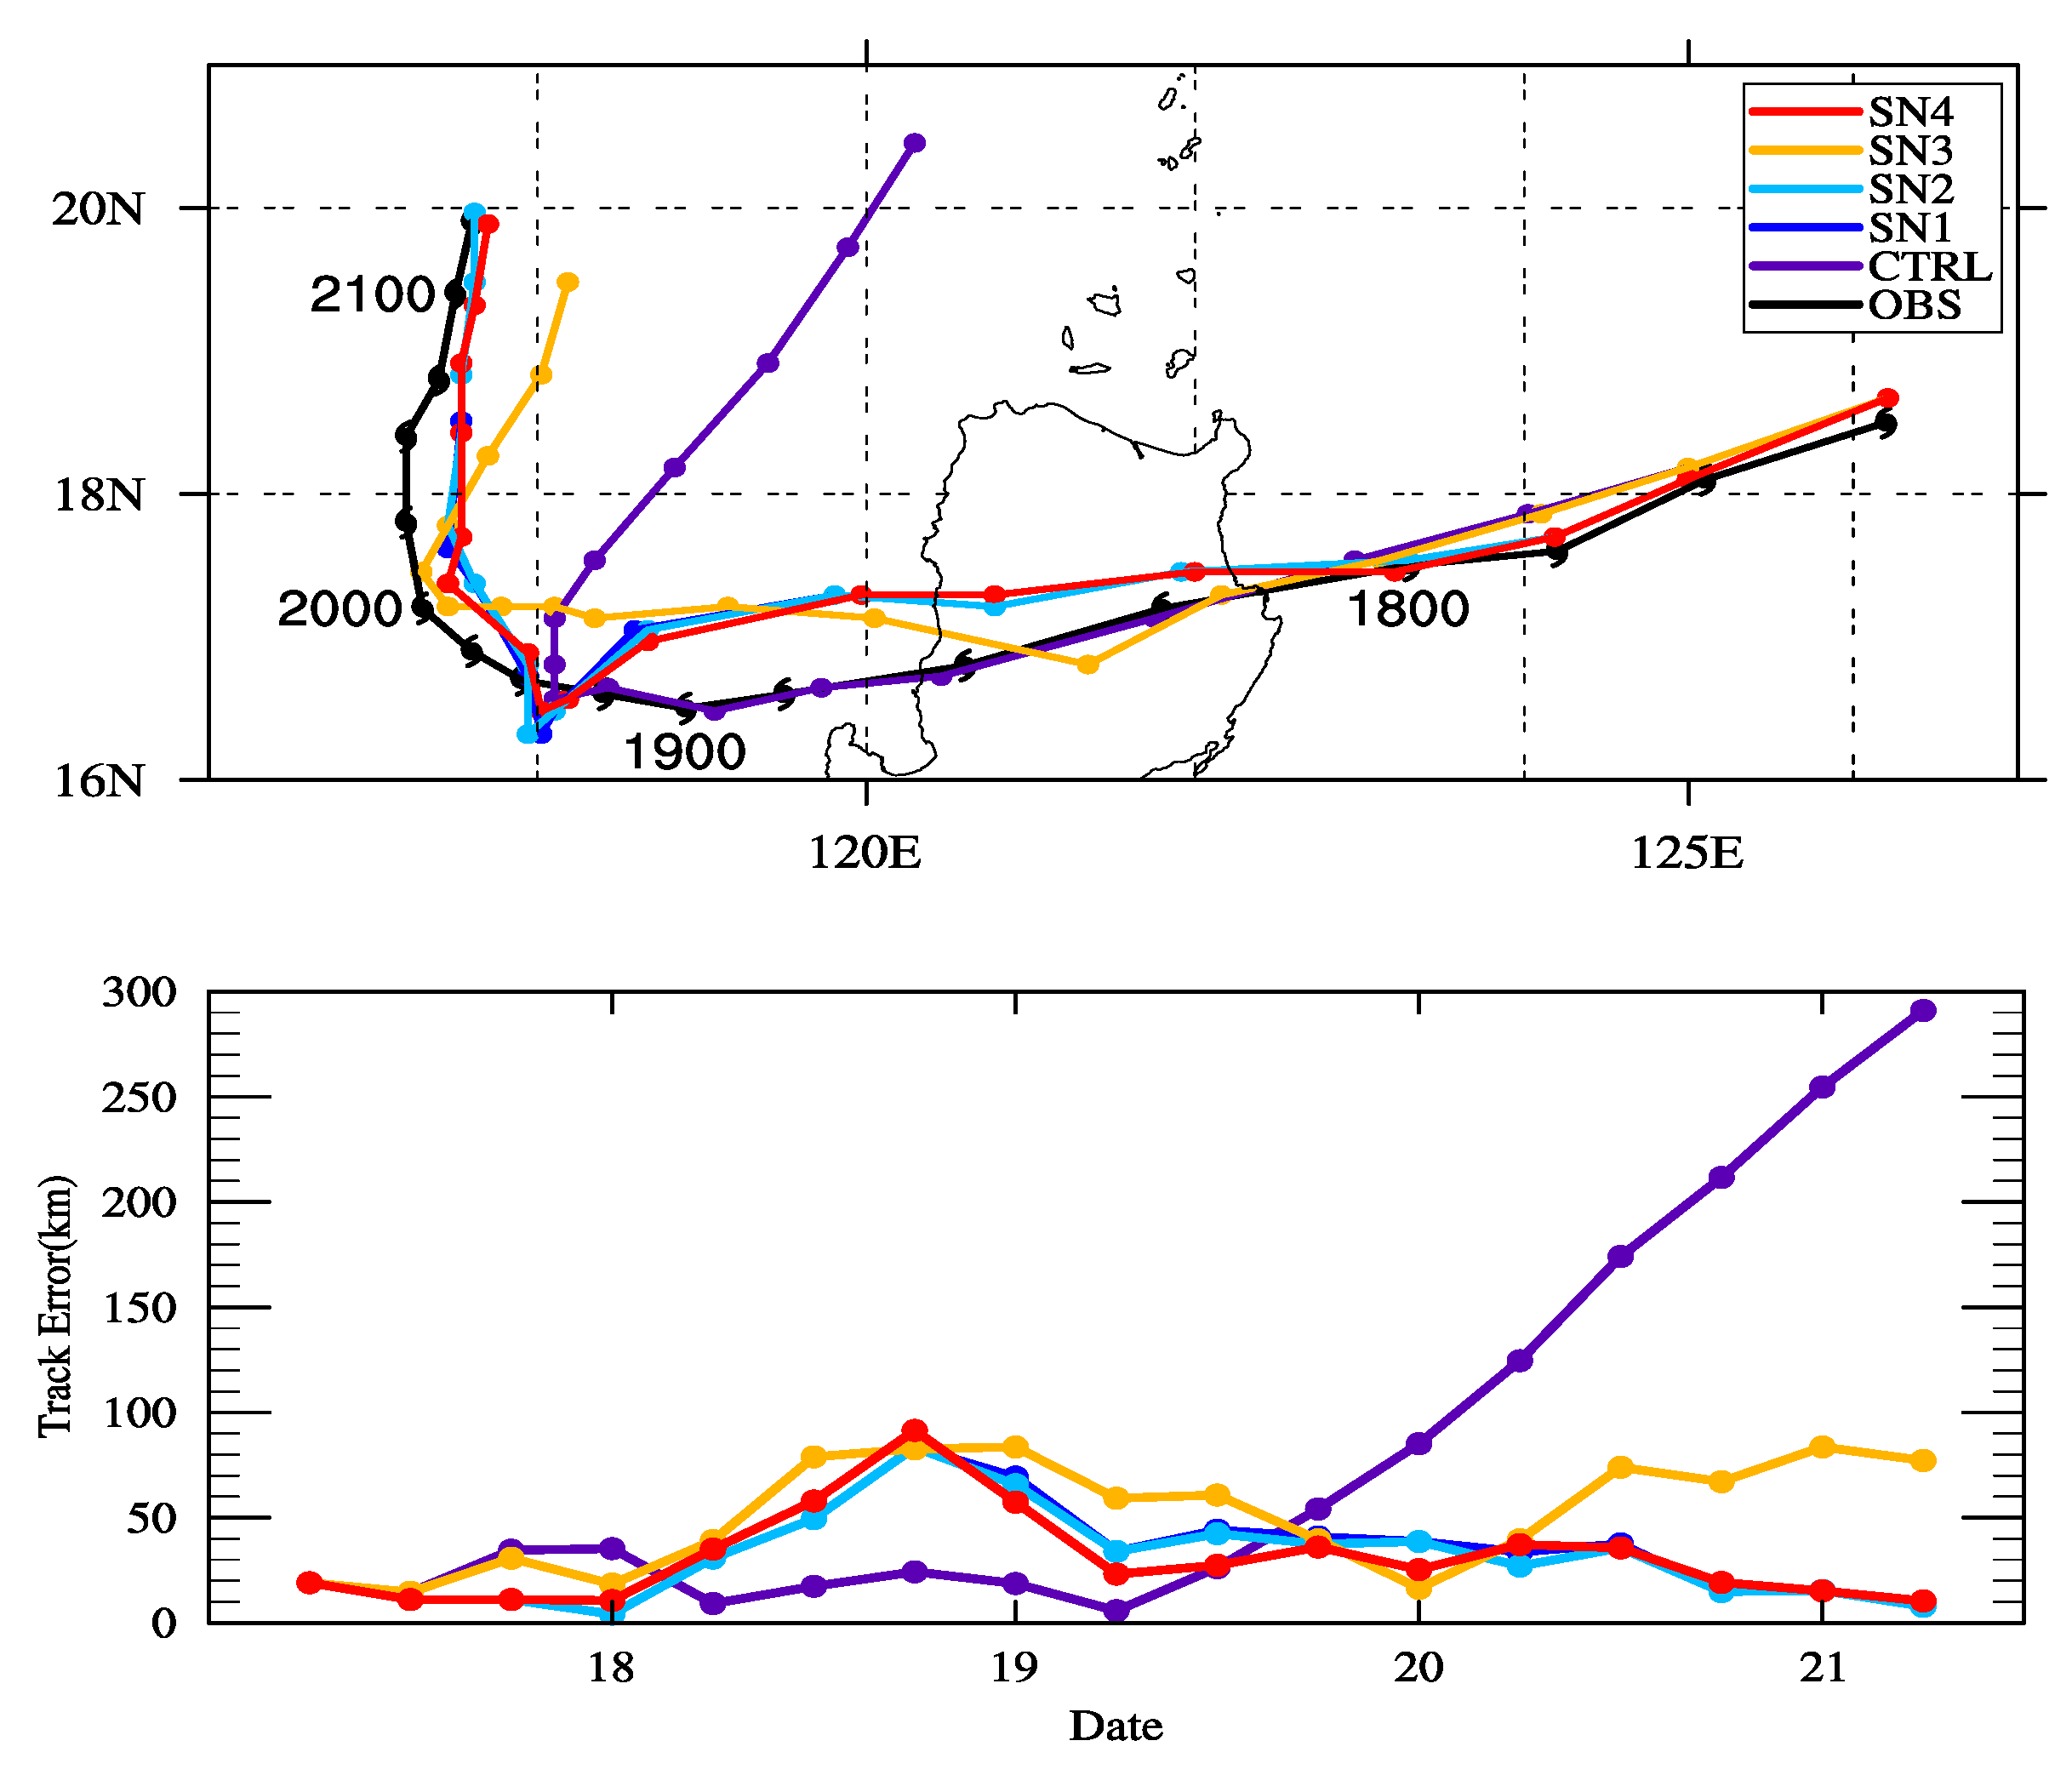
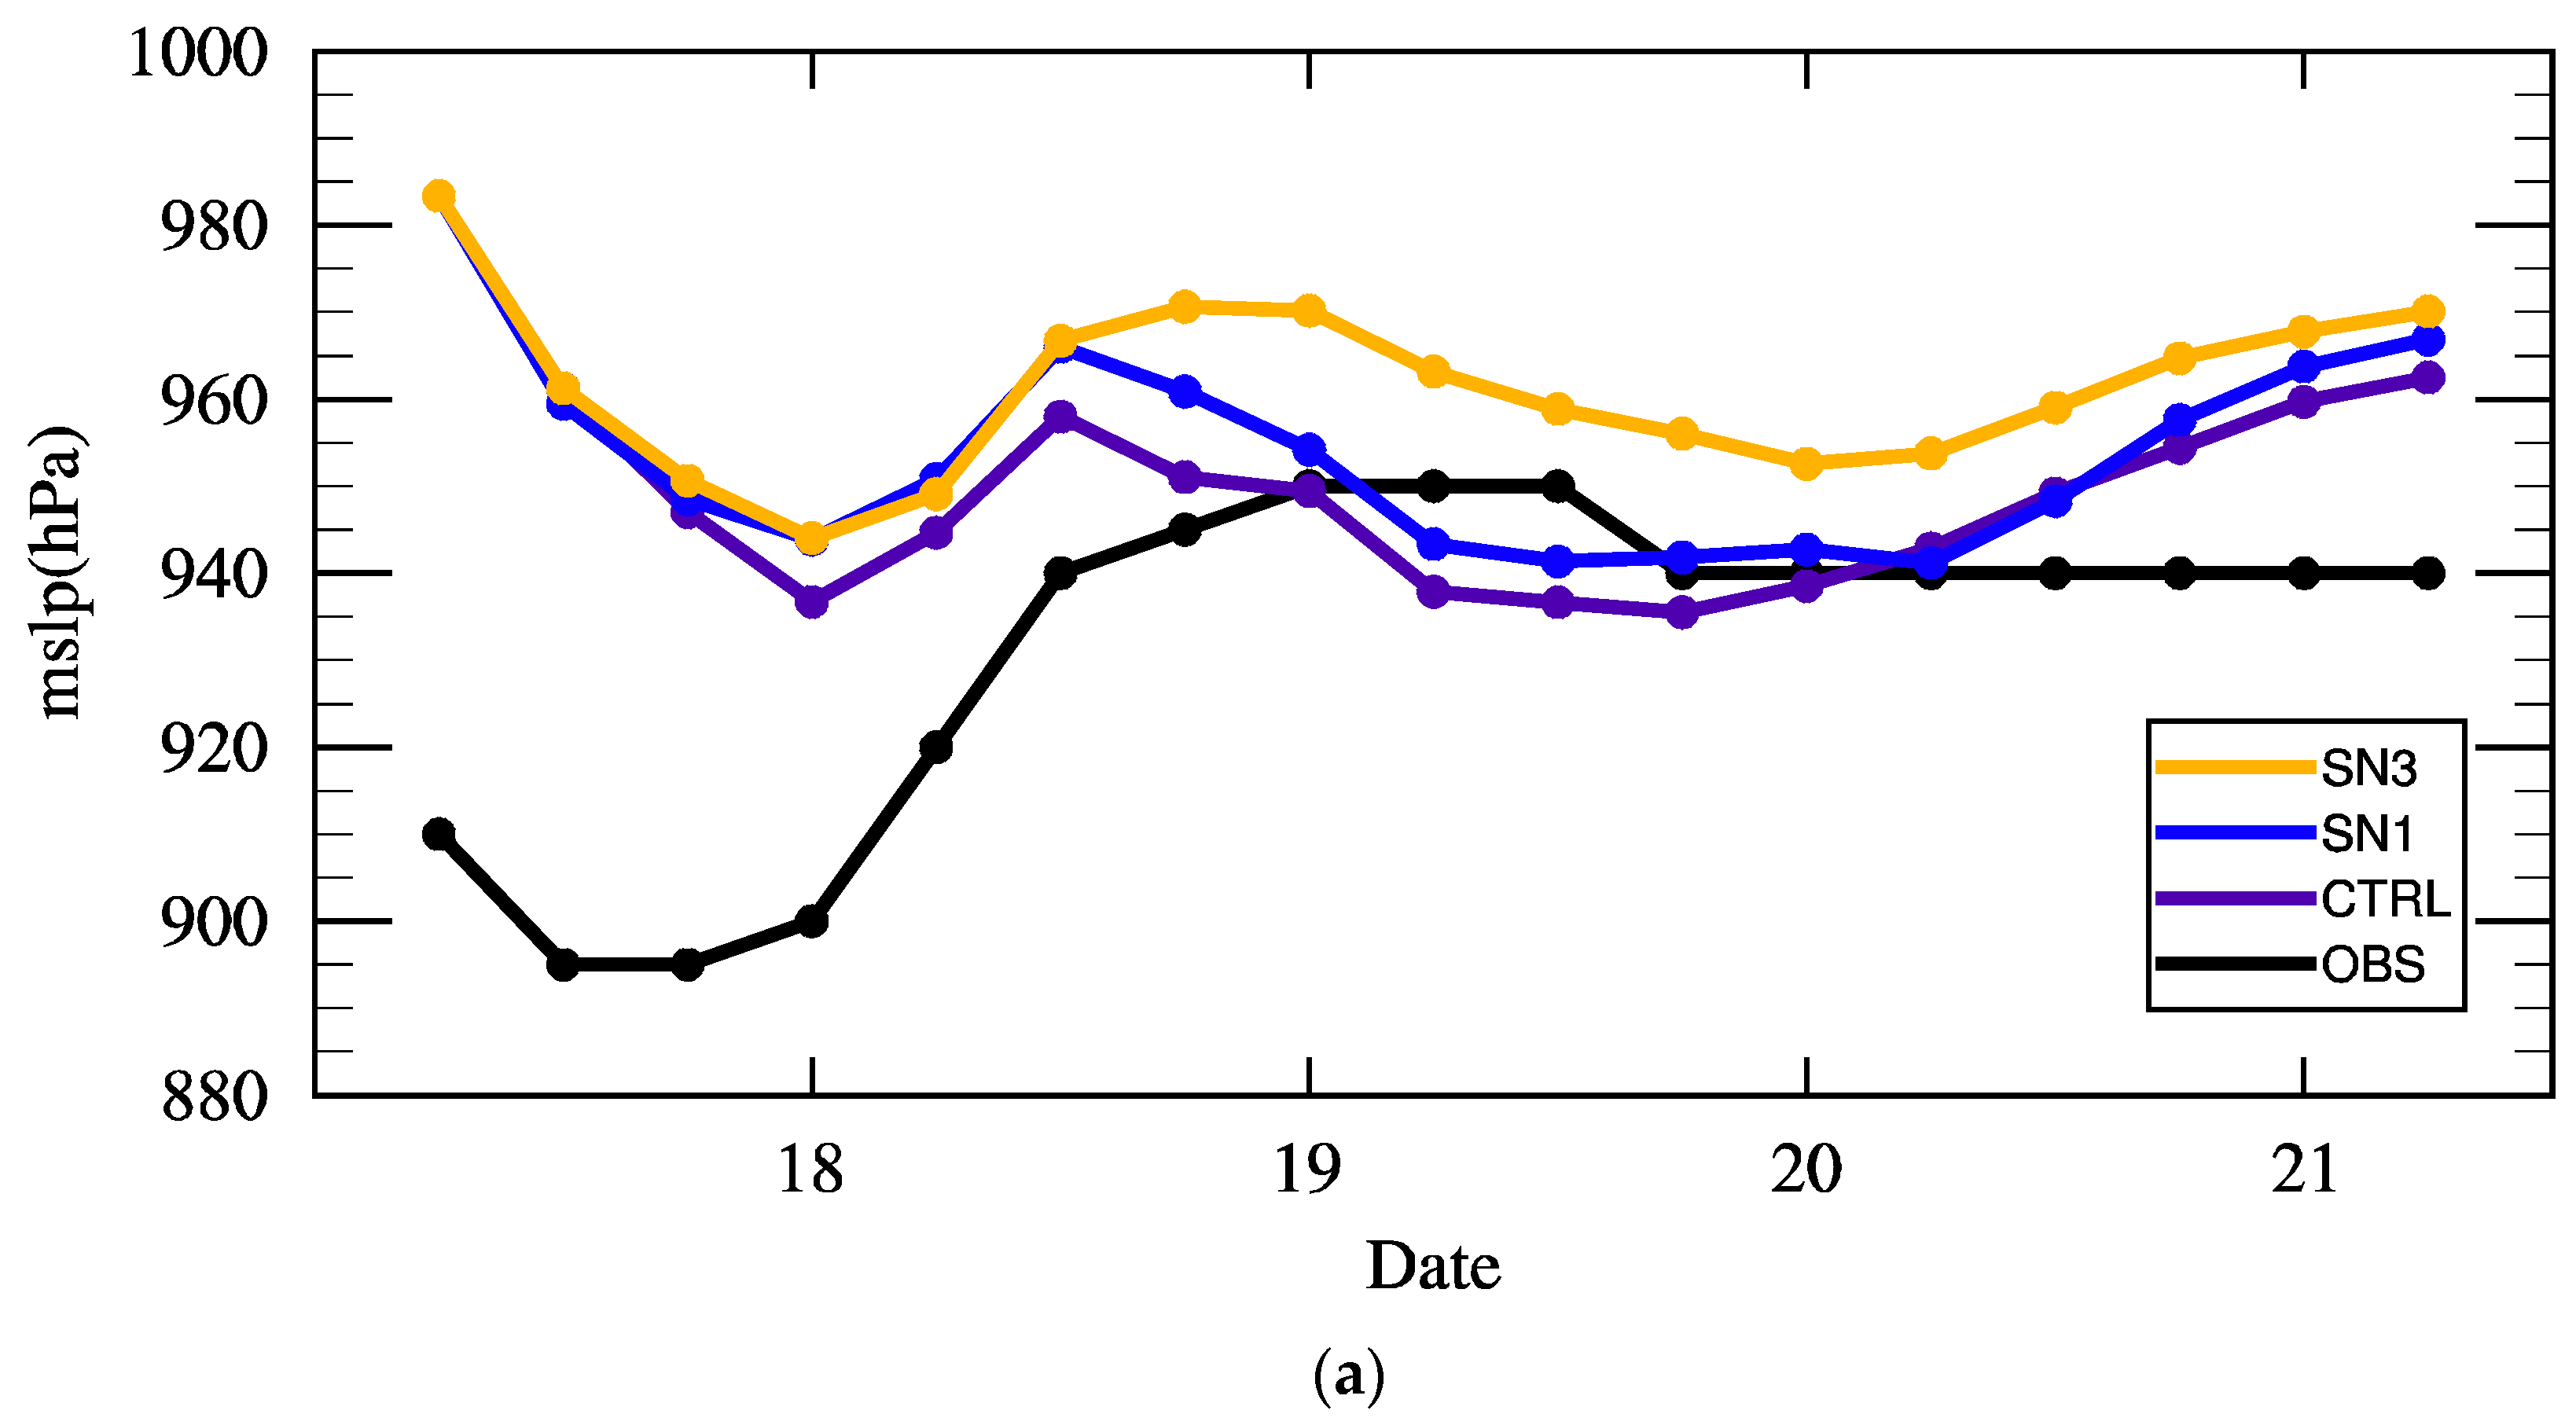
3.2. Simulation Results

Figure 3 displays the simulated tracks and temporal evolution of the track errors in the sensitivity tests compared with CTRL. It can be seen that the tracks simulated by SN1, SN2 and SN4 are generally very similar. Although deflection moment simulated by these three tests is nearly 6 h later than the observed deflection moment, the simulated typhoon tracks are very similar to the observed track. This is particularly true in the period after the deflection, during which the tracks simulated by these three tests are greatly improved compared with CTRL, which deviates far from the observed track. It is important to note that in these three tests, the simulated typhoon is moving westward stably when it approaches and lands on Luzon Island (0000 UTC 18 October to 0600 UTC 19 October); thus, the simulated typhoon tracks clearly deviate to the north compared with CTRL and the observed track. The deflection moment simulated by SN3 is about 18 h later than the observed deflection moment and the simulated track after the deflection is improved compared with the CTRL but still deviates to the east. The mean track errors during the different simulation periods are calculated (Table 3). The mean track errors of the sensitivity tests are smaller than that of CTRL in the original integration period (0–24 h) and the whole integration period (0–96 h) but increased substantially in the integration period (0–48 h) when the typhoon passes over Luzon Island. Overall, the use of SN improves the track simulation when the typhoon is over the ocean and especially improves the simulation of Megi’s northward deflection, its move speed and direction after the deflection. However, the simulated tracks in tests using SN deviates from the observed track when the typhoon passes over high terrain.
The effect of different variables on the typhoon track during different periods is assessed. In the whole simulation period, SN4, which nudges all available variables and SN2, which nudges the wind and geopotential (dynamical factor) fields, has the smallest mean track errors, each with a value of 31 km. SN1, which only nudges the wind field, has a mean track error of 32 km, slightly larger than that of SN2 and SN4. SN3, which only nudges the potential temperature (thermal factor), has a mean track error of 52 km. Based on the observed typhoon track, we define a landfall period from 0600 UTC 18 October to 1800 UTC 18 October and a deflection period from 0600 UTC 19 October to 1200 UTC 20 October. Mean track errors in these two periods are calculated. During the deflection period, CTRL has the largest mean track error, with a value of 82 km. The mean track errors of tests where SN is applied are all greatly reduced, especially SN4, whose mean track error decreases to 32 km, with an apparent improvement of track simulation. However, during the landfall period, CTRL has the smallest mean track error, with a value of 17 km. The mean track errors of tests where SN is applied all increases, especially SN3, whose mean track error increases to 69 km. The mean track error of SN1 and SN2 is smaller than that of SN3 but at 53 km is still three times larger than that of CTRL.
From the analysis above, it can be concluded that during the whole simulation period, the typhoon track is more sensitive to the effects of environmental dynamical factors than the effects of environmental thermal factors. Because the large-scale wind field and geopotential height field are related to geostrophic balance, nudging just wind (geopotential) or both wind and geopotential produces no obvious distinction in the simulation results. During the different simulation period, nudging the environmental field could improve the simulation of the typhoon’s northward deflection. But when the typhoon crosses over high terrain, the simulated tracks deviate substantially.
It’s important to note that sensitivity tests integrated from 1200 UTC 17 to 0600 UTC 21 are conducted. Simulation results (figure not shown) are similar to that of previous study. Therefore, the simulation results above can be representative to investigate the mechanism of typhoon motion.

4. Analysis of the Influence of Environmental Variables

From the results of the sensitivity tests, it is found that tests using SN improves the track simulation. Because different environmental variables have different influences on the typhoon, the typhoon track responds differently to environmental dynamical factors and thermal factors. Nudging just the wind or both wind and geopotential produces no obvious distinction in the simulation results. The remainder of this section considers the influence of environmental dynamical and thermal factors on the typhoon track based on SN1 and SN3.

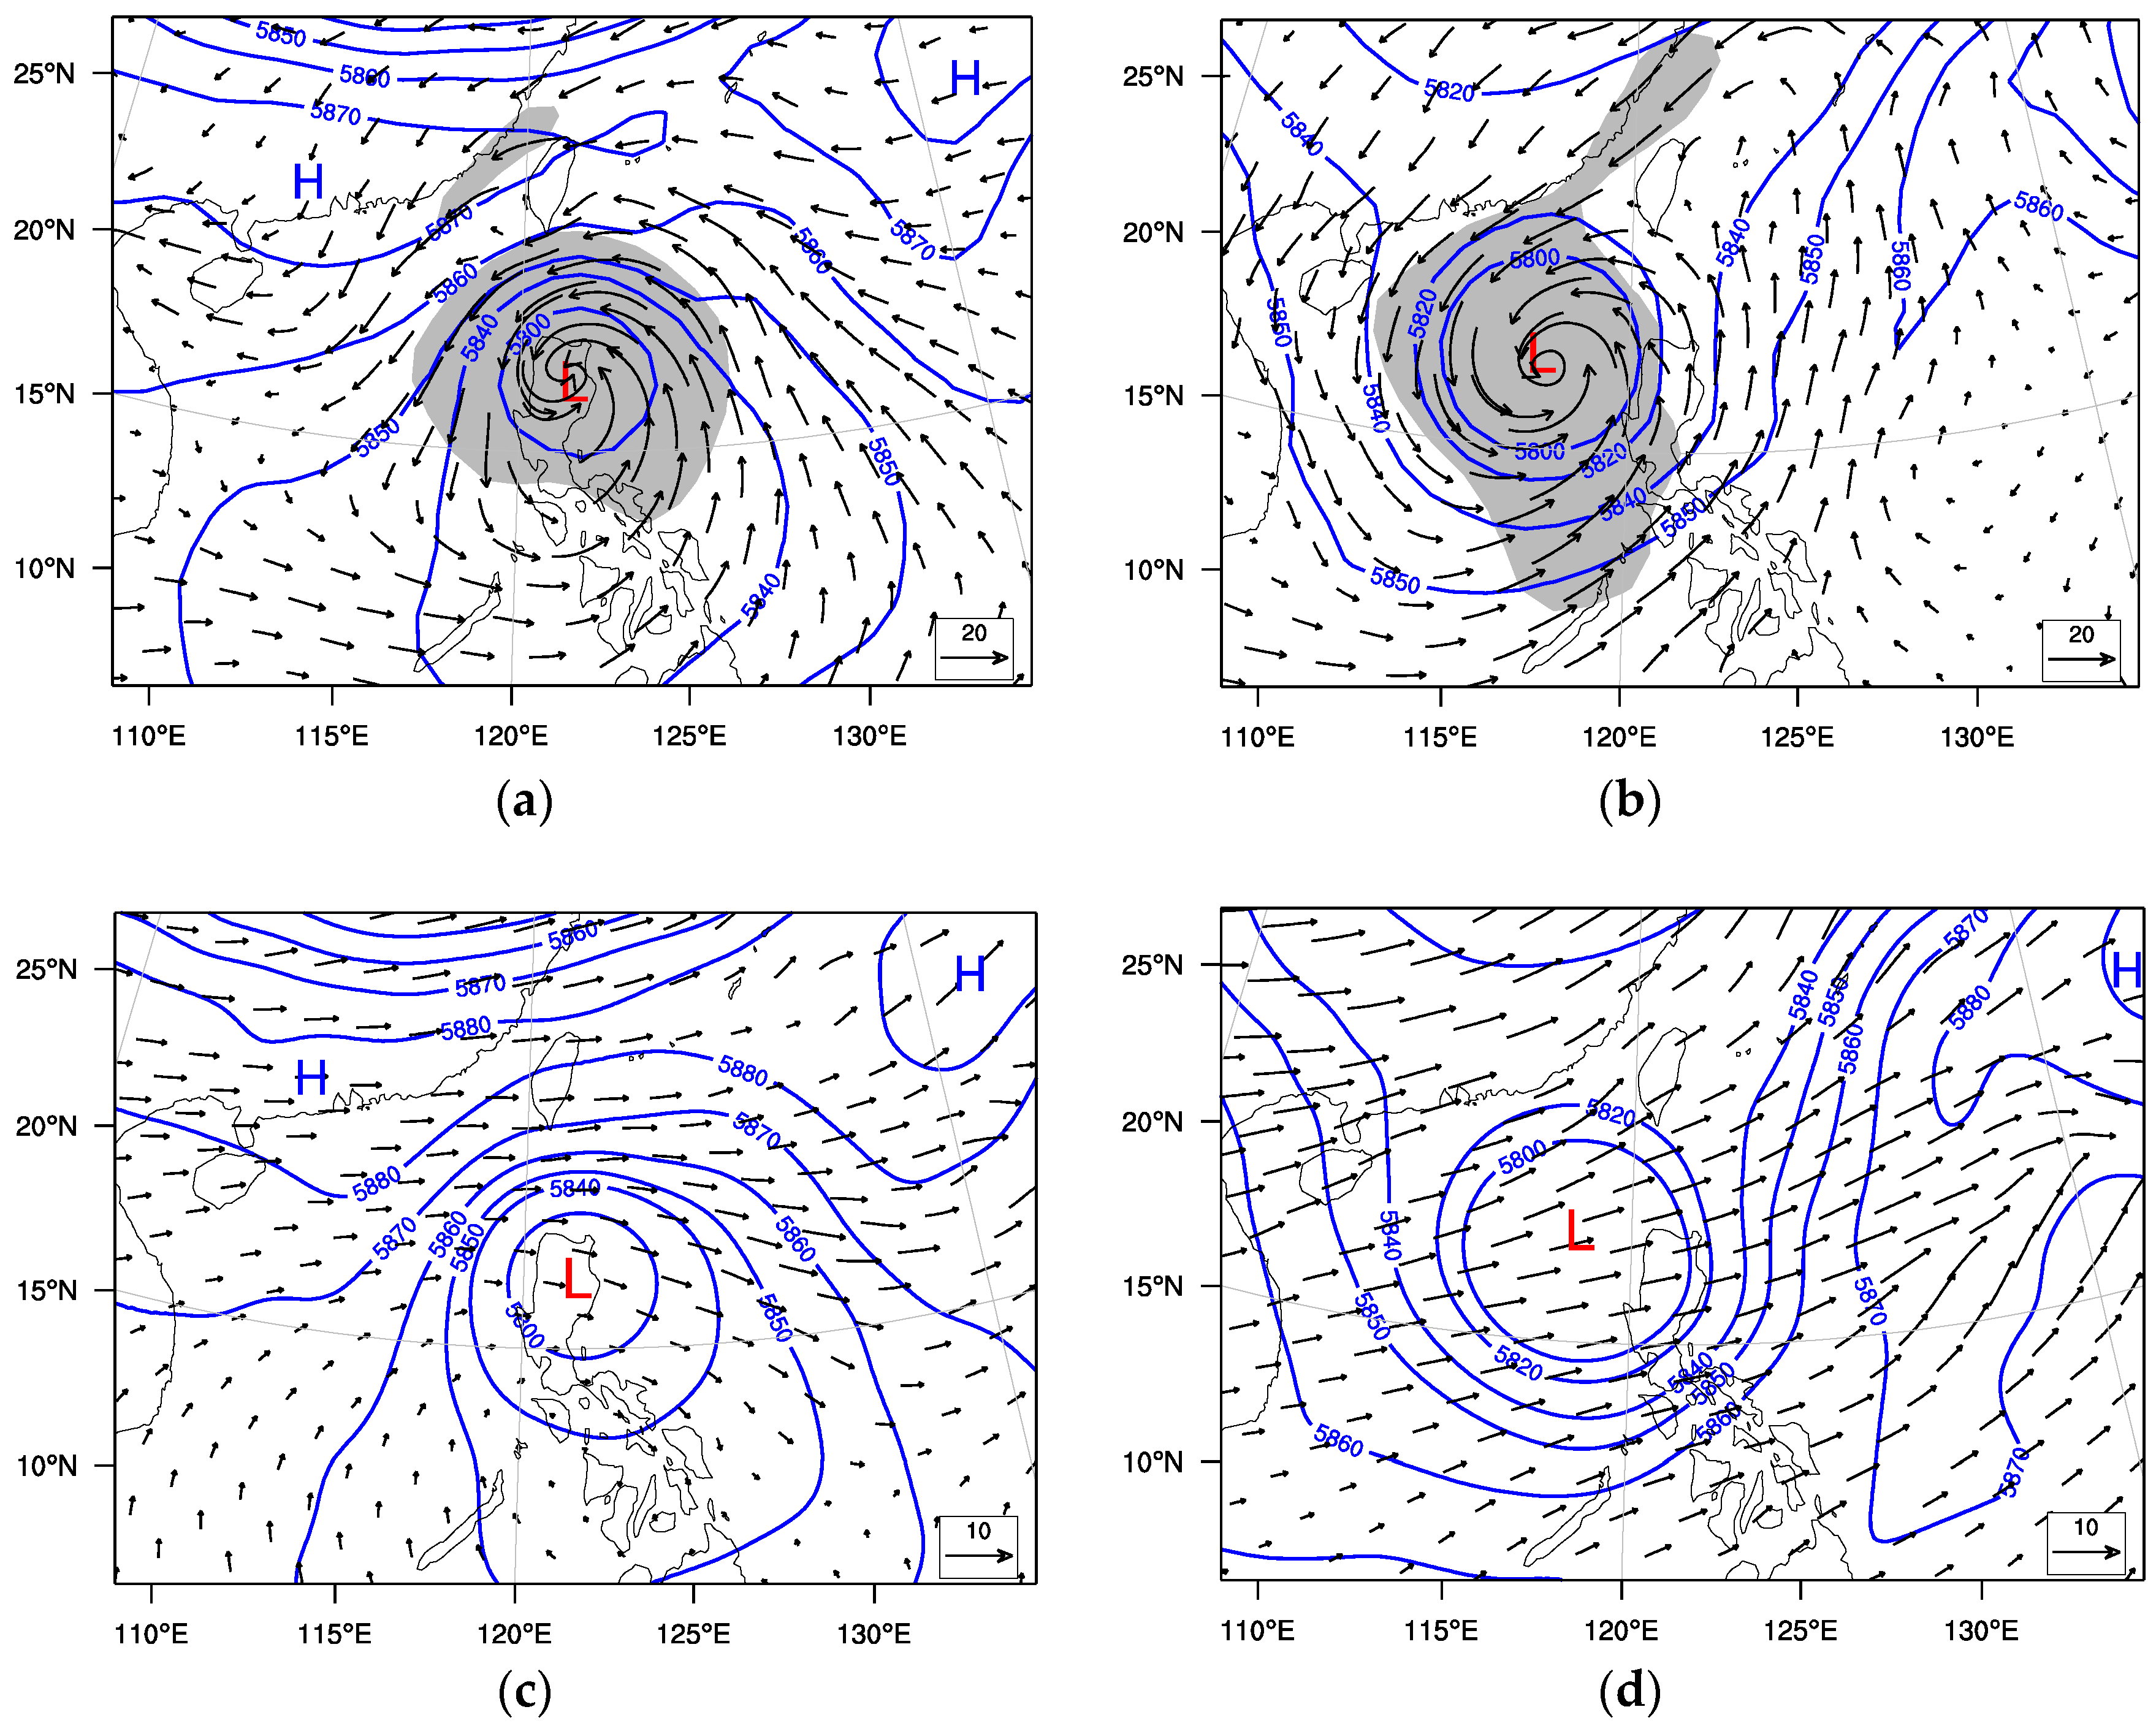
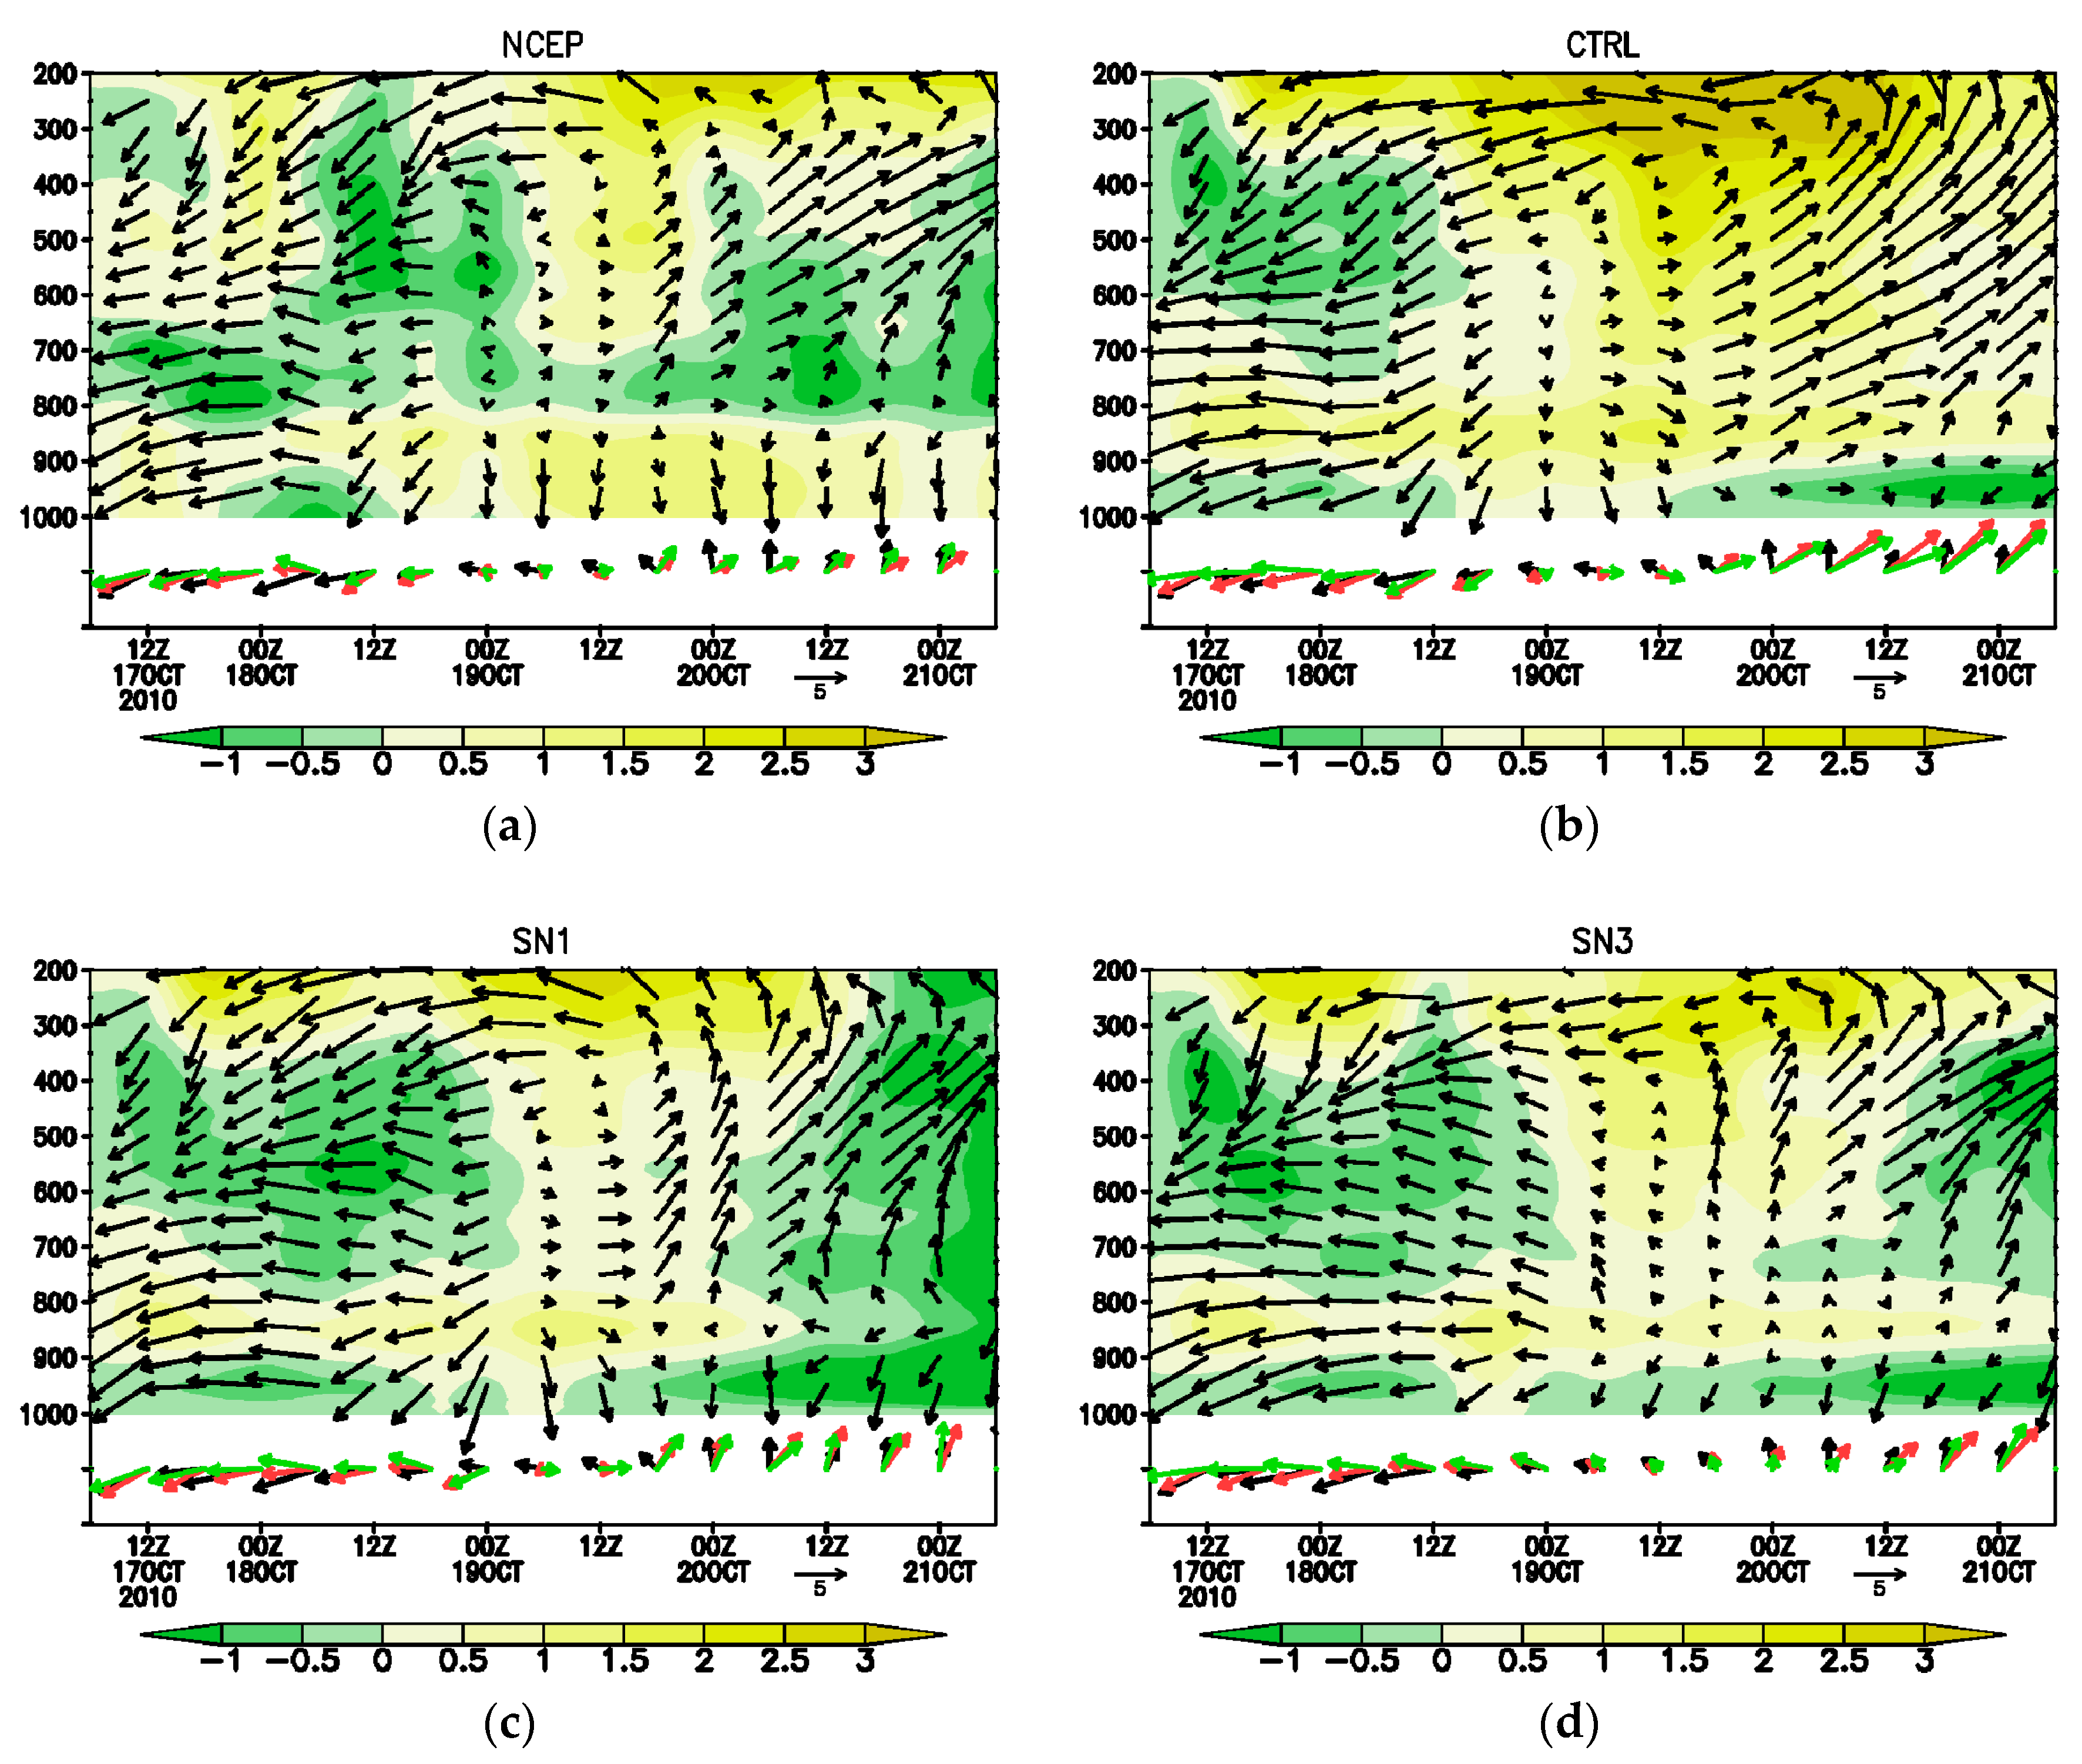
4.1. Effect on the Overall Typhoon System

A large number of studies have suggested that the track and intensity of a typhoon system is closely related to the large-scale background flow and thermal structure [25,26]. Based on their studies, the environmental mean wind at each vertical level of a 10° × 10° rectangular area around on the typhoon center is calculated, as well as the temporal evolution of the steering flow of the whole (850–300 hPa) and lower (800–600 hPa) troposphere (Figure 4a).
Compared to the average direction vectors of the typhoon during the 6 h observation (Figure 4a), it can be seen that from the beginning integration moment to 0000 UTC 18 October, the environmental mean winds at all tropospheric levels are northeaster or east wind and the steering flow of the whole or lower troposphere is also northeaster. This corresponds with the typhoon’s fast westward movement while deviating to the south. At 0600 UTC 18 October, the typhoon lands on Luzon Island. The steering flow of the whole or lower troposphere is predominantly the east wind component but a south wind component is also present. This south wind component is more obvious in the lower troposphere, which is not in accordance with the typhoon’s southward track when crossing over the island. Xu et al. [27] analyzed the relationship between the steering flow of both the whole (850–300 hPa) and lower troposphere (800–600 hPa) and the Megi (2010) track. The results also showed that when the typhoon crossed over the island, there was a deviation between the environmental wind direction and the typhoon’s direction of movement. In this period, the typhoon’s movement is probably mainly affected by other elements (e.g., terrain). By 1200 UTC 18 October, the typhoon has crossed over Luzon Island and entered the SCS, continuing to move westward. From 0000 UTC 19 October onward, the steering flow of the whole and lower troposphere weakens, slowing down the typhoon’s westward movement. At 0600 UTC 19 October, the environmental mean wind in the lower troposphere begin to turn to a southwester, while the wind in the upper troposphere is still an east wind. At this moment, the typhoon’s direction of movement begins to turn northward. At 1800 UTC 19 October, the steering flow of the whole and lower troposphere is enhanced and a strong northeastward steering flow is maintained from this moment. Thus, the typhoon’s direction of movement gradually turns from westward to the northward. By 1200 UTC 20 October, the typhoon has completed the northward deflection process and continues moving northward. After the deflection, the steering flow of the lower troposphere is in correlation with the typhoon’s movement. In all, the steering flow plays an important role during the original integration period and after the deflection, especially the steering flow of lower troposphere (800–600 hPa). But the large-scale environmental flow has no obvious impact on the typhoon track when it crosses over the island.
Comparing the environmental mean wind and steering flow among CTRL, SN1 and SN3, it can be seen that from the beginning integration moment to 0000 UTC 18 October, the steering flow of lower troposphere in CTRL points to the west (Figure 4b). This explains the fact that the simulated track by CTRL moves eastward and deviates to the north slightly. Meanwhile, the environmental mean wind and steering flow in SN1 (Figure 4c) are mainly northeaster, corresponding with the typhoon’s westward movement while deviating to the south. During the period when the typhoon passes over Luzon Island, the deviation of the environmental mean wind and steering flow between SN1 and NCEP is small, corresponding with the simulated track deviating to the north. However, the steering flow of the lower troposphere in CTRL is a northeaster, which modifies the south wind component of the environmental steering flow and successfully simulates the southward track when the typhoon passes over the island. After 1200 UTC 19 October, there is a large eastward component in the steering flow in CTRL, corresponding with the fact that the simulated track deviates substantially to the east. The deviation of the environmental mean wind and steering flow between SN1 and NCEP is very small. Steered by the modified steering flow, the simulated track is very similar to the observed track. From the temporal evolution of the steering flow of the whole and lower tropospheres in SN3 (Figure 4d), it can be seen that the steering flow in SN3 is modified less than in SN1 and thus there is no significant impact on the typhoon track.
To determine the relationship between environmental thermal factors and the typhoon intensity and track, we define the present temperature anomaly as the difference in the mean temperature in the core area (2° × 2°) between the present time and the initial time. Comparing the temporal evolution of the temperature anomaly (Figure 4a), the mean temperature anomaly of the whole troposphere (Figure 5b) and the intensity of the typhoon (Figure 5a), it can be seen that from 0600 UTC 17 October to 0000 UTC 18 October the mean temperature anomaly of the whole troposphere is almost positive, with a positive area located at 600–400 hPa or below 800 hPa. In this period, the intensity of the typhoon is slightly enhanced. From 0000 UTC 18 October to 0000 UTC 19 October, the typhoon passes over Luzon Island. In this period, the mean temperature anomaly of the whole troposphere is negative and the maximum value of the negative area is located at 600–400 hPa, in correlation with the weakened typhoon intensity. From 1200 UTC 19 October to 1800 UTC 19 October, the temperature anomaly of the upper troposphere is positive, while for the lower troposphere it is negative but small and the mean temperature anomaly of the whole troposphere is also positive. In this period, the intensity of the typhoon is enhanced for a short time. After 1800 UTC 19 October, the intensity of the typhoon is maintained. The temperature anomaly of the upper troposphere is positive, while that of the lower troposphere is negative and the mean temperature anomaly of the whole troposphere is negative and almost consistent over time. In all, when the typhoon passes over the island, the mean temperature anomaly of the whole troposphere is negative, in correlation with the weakened intensity of the typhoon. When the typhoon passes over the ocean surface, the mean temperature anomaly of the whole troposphere is positive and the intensity of the typhoon is enhanced. The analysis described above confirms that the temperature anomaly in the core area reflects the evolution of a warm-core structure in the typhoon center and has an important influence on the evolution of typhoon intensity [28]. The temperature anomaly of the middle and upper tropospheres has the most significant impact on typhoon intensity.
Comparing the modification to the temperature anomaly in CTRL and the sensitivity tests in the core area, it can be seen that the results simulated by SN1 (Figure 4c) and SN3 (Figure 4d) are similar to the environmental field in terms of their variation and magnitude. However, the intensity simulated by SN1 and SN3 is weaker than that in CTRL (Figure 4a), especially SN3, in which the simulated intensity is the weakest. The analysis described above shows that nudging the large-scale environmental field, especially the thermal environmental field, weakens the thermal feedback of the convection process, leading to a decrease in the mean temperature in the core area during the whole simulation period, with an associated decrease in the simulated intensity. However, it also modifies the phenomenon whereby the simulated intensity is stronger than the observation for a short period after 0000 UTC 19 October in CTRL; thus, it improves the simulation of the typhoon track to a certain extent.

4.2. Interaction with the Inner Structure of the Typhoon

Many studies have shown that the inner structure of a typhoon is an important factor in the evolution of a typhoon track [29,30]. He [31] defined the movement speed of a typhoon center as V 0 and expressed the accelerated speed of typhoon movement generated by adiabatic heating as follows:
d V 0 d t = 1 C p T ( Q V ) ¯
where   represents the average volume, ( ) ¯ represents the average horizontal area, Cp is the specific heat at constant pressure, Q is the adiabatic heating rate in a unit mass of air per unit time and V is the steering speed of area-averaged flow field at a certain height, which can be considered to be the environmental mean speed of the area influenced at this height. Q V is the adiabatic heating rate multiplied by the local steering speed, with a value in direct proportion to the value of the adiabatic heating rate and local steering speed. The direction of Q V depends on the heating property. When Q > 0 (heating), its direction accords with the direction of the steering speed. Using the formula above, it is possible to qualitatively analyze the influence of heating due to cumulus convective condensation on typhoon movement. If the area of precipitation is centered on the left side of the typhoon’s direction of movement, the direction of the accelerated speed generated by adiabatic heating is the opposite of the typhoon’s direction of movement; thus, the heating due to cumulus convective condensation will make the typhoon slow down. In a similar way, if the area of precipitation is centered on the right side of the typhoon’s direction of movement, the typhoon will speed up. If the area of precipitation is located at the front of the typhoon, it will deviate to the left. If the area of precipitation is located at the back of the typhoon, it will deviate to the right.
Based on the theoretical analysis above, Figure 6 and Figure 7 show the distribution of the typhoon’s inner severe convection and wind field at low (850 hPa) and middle (500 hPa) levels as simulated by CTRL and sensitivity tests, at both the moment of making landfall (0600 UTC 18 October) and deflection (0600 UTC 20 October), respectively. Based on the previous analysis of the environmental mean wind, at the making-landfall moment (0600 UTC 18 October) the local steering flow at 850 and 500 hPa is mainly an east wind (Figure 4a). The areas with large radar reflectivity at 850 hPa (Figure 6d) in CTRL are mainly concentrated in the southern and northern parts of the typhoon inner core, which are blocked by the high terrain of Luzon Island west of the typhoon. At 500 hPa (Figure 6a), areas of large radar reflectivity are apparent in the northern, western and southern parts of the typhoon inner core, which indicates that the convective process on the left and right sides of the typhoon’s direction of movement is relatively homogeneous but the convective process at the front of the typhoon is more severe than at the back. Thus, heating due to cumulus convective condensation at this point has little impact on the speed of the typhoon but it makes the typhoon deviate to the left, causing the typhoon track to deviate to the south. In SN1, the areas of large radar reflectivity at 850 hPa (Figure 6e) and 500 hPa (Figure 6b) are centered in the eastern part of the typhoon inner core. Thus, the convective process at the back of the typhoon is relatively strong, making the local steering flow deviate to the right and the typhoon track deviate to the north. In SN3, there are areas of large radar reflectivity at 850 hPa (Figure 6f) in the northern and southern parts of the typhoon inner core, with a small area of large radar reflectivity in the northern part at 500 hPa (Figure 6c). Generally, the distribution of areas with large radar reflectivity is relatively uniform; thus, the impact of convective processes on the typhoon track is relatively small. In addition, the distribution of wind speed is related to the distribution of severe convection. In CTRL (Figure 6a,b) the areas with a large wind speed are located on the northern and western sides of the typhoon inner core, while the distribution of areas with a large wind speed are relatively uniform in SN1 (Figure 6b,e) and SN3 (Figure 6c,f). Because the wind on the western side of the typhoon is mainly a strong north wind, it causes the typhoon to deviate to the south. Thus, the distribution of areas with a large wind speed contributes to the simulated track deviating to the south in CTRL. Therefore, under the combined effect of the steering flow and the distribution of severe convection, as well as the impact of strong wind centers, the simulated typhoon location and track are similar to the observation in CTRL during the landfall period.
At the moment of deflection (0600 UTC 20 October), the local steering flow at 850 and 500 hPa is mainly a southeaster (Figure 4a). In CTRL, the areas with large radar reflectivity at 850 hPa (Figure 7d) and 500 hPa (Figure 7a) are centered in the southern part of the typhoon inner core, indicating that the convective process at the back of the typhoon is relatively strong, causing it to deviate to the north. In SN1, the distribution of areas with large radar reflectivity at 850 hPa (Figure 7e) are uniform and the areas at 500 hPa (Figure 7b) are centered in the northwestern and southeastern parts of the typhoon. Generally, the distribution is relatively uniform; thus, the impact of the convective process on the typhoon track is relatively small. In SN3, there are small areas with large radar reflectivity on the southeastern side at both 850 hPa (Figure 7f) and 500 hPa (Figure 7c), which slows the typhoon down slightly. The distribution of wind speed is also related to the distribution of severe convection at this point. The areas with a large wind speed are located on the southeastern side of the typhoon inner core in CTRL (Figure 7a,b), while they are located on the eastern side in SN1 (Figure 7b,e). The distribution is relatively uniform in SN3 (Figure 7c,f). The wind at the southern side of the typhoon is mainly a westerly wind, which causes the typhoon to deviate to the east. Thus, the distribution of areas with a large wind speed causes the simulated track to deviate to the east in CTRL. In all, during the deflection period, the distribution of severe convection and wind speed causes the simulated typhoon to deviate to the east. Thus, the typhoon track simulated by CTRL deviates substantially to the east compared to the observed track.
The distributions of severe mesoscale convective systems and strong wind in the typhoon core area are controlled and influenced by the large-scale environmental field to a great extent. Rogers et al. [32] conducted a high-resolution numerical simulation of hurricane Bonnie (1998) and proved that the accumulated rainfall was distributed symmetrically across the track when the vertical shear was strong and across track. It is generally acknowledged that the maximum precipitation area is located on the left side of the wind shear vector in the eye area [33,34]. Environmental wind shear can affect the asymmetric flow in the eye area in a variety of ways. The vertical wind shear can generate vortex tilt. During the initial state of vortex tilt, the associated balance response will produce an updraft in the downshear direction [35,36,37]. In addition, the vertical wind shear affects the development, movement and symmetrization process of convective cloud formation. In a quasi-balanced downshear environment, a direction of movement to the left of mesoscale severe convective bands provides favorable conditions for the genesis and development of convective cells [38].
Based on the studies referred to above, Figure 8 shows the environmental mean wind profiles at both the moment of making landfall (0600 UTC 18 October) and deflection (0600 UTC 20 October). The vertical wind shear is measured by the shear of the environmental mean wind between 200 and 850 hPa. At 0600 UTC 18 October, the wind shear vectors in CTRL (Figure 8a) and SN3 (Figure 8c) point to the west, while in SN1 (Figure 8b), the wind shear vector points to the south. According to the theory that the maximum precipitation area is located on the left side of the wind shear vector in the eye area, the southern part of the typhoon inner core in CTRL and SN3, as well as the western part in SN1, should be the areas of severe convection, which corresponds with the distribution of radar reflectivity at this point (Figure 6). At 0600 UTC 20 October, the wind shear vectors in CTRL (Figure 8d) and SN1 (Figure 8e) point to the southwest and northwest, respectively, while the wind shear vector in SN3 (Figure 8f) points to the northwest, while deviating westward. The areas with large radar reflectivity are located in the southern part of the typhoon inner core in CTRL. In SN1, the distribution of areas with large radar reflectivity is relatively uniform, with areas of large reflectivity in the southwestern part of the typhoon inner core in SN3 (Figure 7). Generally, the distribution of radar reflectivity corresponds to the vertical wind shear. Therefore, it is concluded that the large-scale environmental adjustment modifies the environmental vertical wind shear to change the location and symmetry of the inner severe convection, thus affecting the deflection of typhoon track.
In conclusion, the large-scale environmental field interacts with the inner structure of the typhoon, influencing the distribution of severe convection and wind speed in the core area and affecting the typhoon track. Large-scale environmental adjustments change the environmental vertical wind shear, causing the location and symmetry of severe convection in the core area to change, thus influencing the typhoon track.

5. Conclusions and Discussion

In this study, an SN technique is applied to improve the simulation of typhoon Megi (2010). Sensitivity tests are conducted to investigate the effect of different large-scale environmental factors on the typhoon’s movement and to enable a detailed discussion of the response of its movement to the main factors.
It is found that the adoption of the SN technique to nudge different variables effectively decreases the mean track error during the whole period and the effect of dynamical factors is more significant than the effect of thermal factors. Comparing the mean track error during different periods of the typhoon’s evolution, it is found that the adoption of the SN technique improves the simulated track when the typhoon is moving over the ocean but increases the simulation error when the typhoon passes over high terrain. A further diagnostic analysis of the results of sensitivity tests indicate that the nudging of large-scale environmental flow could directly adjust the local steering flow and influence the typhoon track. During the original integration period and the deflection period, this direct large-scale wind flow adjustment effectively modifies the local steering flow of the whole and lower troposphere; thus, achieving the goal of improving the simulation of the typhoon track. During the landfall period, SN1 weakens the low-level wind field adjustment generated by high terrain and the typhoon system itself in CTRL, increasing the error of the simulated track in SN1. On the other hand, large-scale environmental adjustment changes the environmental vertical wind shear, causing the location and symmetry of severe convections in the core area to change and therefore the typhoon track changes as well. After adjusting the large-scale environmental thermal factors, the environmental wind field responds and the simulated intensity of the typhoon is relatively weak. This influences the movement of the typhoon to a certain extent but the impact of environmental thermal factors is not significant compared to the impact of environmental dynamical factors.
The SN technique improves the simulated typhoon track by nudging background information in the simulation process but it weakens the simulation of relatively small-scale physical processes, which is likely due to the limited experimental design by spuriously amplifying the role of large-scale circulation at the lower atmosphere levels. Therefore, future studies should construct and optimize the initial vortex of similar typhoons and then analyze the effect of the inner processes on the typhoon track under the impact of external forcing.

Acknowledgments

This research was primarily supported by National Natural Science Foundation of China (41275002, 41775055).

Author Contributions

Xingliang Guo performed the experiments and wrote this paper. Wei Zhong conceived the idea and designed the structure of this paper.

Conflicts of Interest

The authors declare no conflict of interest.

References

  1. Rappaport, E.N.; Franklin, J.L.; Avila, L.A.; Baig, S.R.; Beven, J.L.; Blake, E.S.; Burr, C.A.; Jiing, J.G.; Juckins, C.A.; Knabb, R.D.; et al. Advances and challenges at the national hurricane center. Weather Forecast. 2008, 24, 395–419. [Google Scholar] [CrossRef]
  2. Galarneau, T.J.J.; Davis, C.A. Diagnosing forecast errors in tropical cyclone motion. Mon. Weather Rev. 2013, 141, 405–430. [Google Scholar] [CrossRef]
  3. Coronel, R.M.; Sawada, T.; Iwasaki, T. Impacts of Surface Drag Coefficient and Planetary Boundary Layer Schemes on the Structure and Energetics of Typhoon Megi (2010) during Intensification. J. Meteorol. Soc. Jpn. 2016, 94, 55–73. [Google Scholar] [CrossRef]
  4. Li, M.; Ping, F.; Chen, J.; Xu, L. A simulation study on the rapid intensification of Typhoon Megi (2010) in vertical wind shear. Atmos. Sci. Lett. 2016, 17, 630–638. [Google Scholar] [CrossRef]
  5. Wang, H.; Wang, Y. A Numerical Study of Typhoon Megi (2010). Part I: Rapid Intensification. Mon. Weather Rev. 2014, 142, 29–48. [Google Scholar] [CrossRef]
  6. Kieu, C.Q.; Nguyen, T.M.; Hoang, M.T.; Ngo-Duc, T. Sensitivity of the Track and Intensity Forecasts of Typhoon Megi (2010) to Satellite-Derived Atmospheric Motion Vectors with the Ensemble Kalman Filter. J. Atmos. Ocean. Technol. 2012, 29, 1794–1810. [Google Scholar] [CrossRef]
  7. Peng, S.; Qian, Y.K.; Lai, Z.; Hao, S.; Chen, S.; Xu, H.; Wang, D.; Xu, X.; Chan, J.C.; Zhou, H.; et al. On the mechanisms of the recurvature of super typhoon Megi. Sci. Rep. 2014, 4, 4451. [Google Scholar] [CrossRef] [PubMed]
  8. Qian, C.; Zhang, F.; Green, B.W.; Zhang, J.; Zhou, X. Probabilistic evaluation of the dynamics and prediction of Supertyphoon Megi (2010). Weather Forecast. 2013, 28, 1562–1577. [Google Scholar] [CrossRef]
  9. Shi, W.L.; Fei, J.F.; Huang, X.G.; Cheng, X.P.; Ding, J.L.; He, Y.Q. A numerical study on the combined effect of midlatitude and low-latitude systems on the abrupt track deflection of Typhoon Megi (2010). Mon. Weather Rev. 2015, 142, 2483–2501. [Google Scholar] [CrossRef]
  10. Chan, J.C.L.; Gray, W.M. Tropical cyclone movement and surrounding flow relationships. Mon. Weather Rev. 1982, 110, 1354–1374. [Google Scholar] [CrossRef]
  11. Liang, J.; Wu, L. Sudden track changes of tropical cyclones in monsoon gyres: Full-physics, idealized numerical experiments. J. Atmos. Sci. 2015, 72, 1307–1322. [Google Scholar] [CrossRef]
  12. Waldron, K.M.; Paegle, J.; Horel, J.D. Sensitivity of a spectrally filtered and nudged limited-area model to outer model options. Mon. Weather. Rev. 1996, 124, 529–547. [Google Scholar] [CrossRef]
  13. Storch, H.V.; Langenberg, H.; Feser, F. A spectral nudging technique for dynamical downscaling purposes. Mon. Weather Rev. 2000, 128, 3664–3673. [Google Scholar] [CrossRef]
  14. Knutson, T.R.; Sirutis, J.J.; Garner, S.T.; Held, I.M.; Tuleya, R.E. Simulation of the recent multidecadal increase of atlantic hurricane activity using an 18-km-grid regional model. Bull. Am. Meteorol. Soc. 2007, 88, 1549–1565. [Google Scholar] [CrossRef]
  15. Cha, D.; Jin, C.; Lee, D.; Kuo, Y. Impact of intermittent spectral nudging on regional climate simulation using weather research and forecasting model. J. Geophys. Res. Atmos. 2011, 116, 10103. [Google Scholar] [CrossRef]
  16. Feser, F.; Storch, H.V. Regional modelling of the western pacific typhoon season 2004. Meteorol. Z. 2008, 17, 519–528. [Google Scholar] [CrossRef] [PubMed]
  17. Li, J.; Tang, J.P.; Fang, J. High-resolution numerical simulation of typhoon Longwang (2005) with the spectrum nudging technique. J. Trop. Meteorol. 2015, 21, 311–325. [Google Scholar]
  18. Wang, H.; Wang, Y.Q.; Xu, H.M. Improving simulation of a tropical cyclone using dynamical initialization and large-scale spectral nudging: A case study of typhoon megi (2010). J. Meteorol. Res. 2013, 27, 455–475. [Google Scholar] [CrossRef]
  19. Cha, D.; Lee, D. Reduction of systematic errors in regional climate simulations of the summer monsoon over East Asia and the western North Pacific by applying the spectral nudging technique. J. Geophys. Res. 2014, 114, 14108. [Google Scholar] [CrossRef]
  20. Barcikowska, M.; Feser, F. The influence of spectral nudging on typhoon formation in regional climate models. Environ. Res. Lett. 2012, 7, 014024. [Google Scholar]
  21. Choi, S.J.; Lee, D.K. Impact of spectral nudging on the downscaling of tropical cyclones in regional climate simulations. Adv. Atmos. Sci. 2016, 33, 730–742. [Google Scholar] [CrossRef]
  22. Gómez, B.; Miguez-Macho, G. The impact of wave number selection and spin-up time in Spectral Nudging. Q. J. R. Meteorol. Soc. 2017, 143, 1772–1786. [Google Scholar] [CrossRef]
  23. Schubert-Frisius, M.; Feser, F.; von Storch, H.; Rast, S. Optimal Spectral Nudging for Global Dynamical Downscaling. Mon. Weather Rev. 2017, 145, 909–927. [Google Scholar] [CrossRef]
  24. Miguez-Macho, G.; Stenchikov, G.L.; Robock, A. Spectral nudging to eliminate the effects of domain position and geometry in regional climate model simulations. J. Geophys. Res. Atmos. 2004, 109, 1025–1045. [Google Scholar] [CrossRef]
  25. Marks, F.D.J.; Houze, R.A.J.; Gamache, J.F. Dual-aircraft investigation of the inner core of hurricane norbert. Part I: Kinematic structure. J. Atmos. Sci. 1993, 50, 3221–3243. [Google Scholar] [CrossRef]
  26. Wu, R.S. Preface some problems of typhoon study. J. Nanjing Univ. 2007, 43, 567–571. [Google Scholar]
  27. Xu, L.; Cui, X.P.; Gao, S.T.; Huang, Y.J. Cause analysis of sudden track change of Typhoon Megi. Trans. Atmos. Sci. 2015, 38, 658–669. (In Chinese) [Google Scholar]
  28. Chen, H.; Zhang, D.L.; Carton, J.; Atlas, R. On the rapid intensification of hurricane wilma (2005). Part I: Model prediction and structural changes. Weather Forecast. 2011, 26, 885–901. [Google Scholar] [CrossRef]
  29. Holland, G.J. Tropical cyclone motion: Environmental interaction plus a beta effect. J. Atmos. Sci. 1983, 40, 328–342. [Google Scholar] [CrossRef]
  30. Carr, L.E.; Elsberry, R.L. Analytical tropical cyclone asymmetric circulation for barotropic model initial conditions. Mon. Weather Rev. 1992, 120, 269–283. [Google Scholar] [CrossRef]
  31. He, H.Y. A study on typhoon movement. I: The effect of diabatic heating and horizontal temperature distribution. J. Trop. Meteorol. 1995, 1, 1–9. (In Chinese) [Google Scholar]
  32. Rogers, R.; Chen, S.; Tenerelli, J.; Willoughby, H. A numerical study of the impact of vertical shear on the distribution of rainfall in hurricane bonnie (1998). Mon. Weather Rev. 2003, 131, 21–38. [Google Scholar] [CrossRef]
  33. Franklin, J.L.; Lord, S.J.; Feuer, S.E.; Marks, F.D. The kinematic structure of hurricane gloria (1985) determined from nested analyses of dropwindsonde and doppler radar data. Mon. Weather Rev. 1993, 121, 2433–2451. [Google Scholar] [CrossRef]
  34. Wong, M.L.M.; Chan, J.C.L. Tropical cyclone intensity in vertical wind shear. J. Atmos. Sci. 2004, 61, 1859–1876. [Google Scholar] [CrossRef]
  35. Jones, S.C. The evolution of vortices in vertical shear. I: Initially barotropic vortices. Q. J. R. Meteorol. Soc. 1995, 121, 821–851. [Google Scholar] [CrossRef]
  36. Wang, Y.; Holland, G.J. Tropical cyclone motion and evolution in vertical shear. J. Atmos. Sci. 1996, 53, 3313–3332. [Google Scholar] [CrossRef]
  37. Frank, W.M.; Ritchie, E.A. Effects of environmental flow upon tropical cyclone structure. Mon. Weather Rev. 1999, 127, 2044–2061. [Google Scholar] [CrossRef]
  38. Zhong, W.; Lu, H.C.; Zhang, D.L. The disgnoses of quasi-balanced flows in asymmetric intense hurricane. Chin. J. Geophys. 2008, 51, 657–677. (In Chinese) [Google Scholar] [CrossRef]
Figure 1. Simulated typhoon track by CTRL (in purple) compared with the observed track (in black).
Atmosphere 08 00257 g001
Figure 2. NCEP geopotential height at 500 hPa (unit: hPa), wind field at 850 hPa, areas where wind speed is more than 15 ms−1 (dashes) at (a) 0600 UTC 18 and (b) 0600 UTC 20; simulated geopotential height at 500 hPa (unit: hPa), wind field deviation between the simulation result and NCEP at 850 hPa at (c) 0600 UTC 18 and (d) 0600 UTC 20.
Atmosphere 08 00257 g002
Figure 3. Simulated typhoon tracks and temporal evolution of track errors (unit: km) in the first group of sensitivity tests; where black, purple, blue, sky blue, brown, red correspond with observation, CTRL, SN1, SN2, SN3, SN4, respectively.
Atmosphere 08 00257 g003
Figure 4. Temporal-spatial evolution of environmental mean wind (black wind vector, units: ms−1), temperature anomaly in the core area (dashes, units: K) and steering flow (wind vectors, units: ms-1) in (a) NCEP, (b) CTRL, (c) SN1 and (d) SN3. The environmental mean wind is calculated by 10° × 10° rectangle area centering at the typhoon center. The temperature anomaly is the difference of the mean temperature in the core area (2° × 2°) between the present time and initial time. Black wind vectors below represent the average direction vectors by six hours by observation. Red and green vectors respectively represent steering flow of the whole troposphere (850–300 hPa) and lower troposphere (800–600 hPa).
Atmosphere 08 00257 g004
Figure 5. Temporal evolution of observed and simulated (a) minimum sea level pressure(units: hPa) and (b) mean temperature anomaly of the whole troposphere (units: K); where black, purple, blue, brown respectively correspond with observation (NCEP), CTRL, SN1, SN3.
Atmosphere 08 00257 g005aAtmosphere 08 00257 g005b
Figure 6. Distribution of radar reflectivity (dashes, units: dBZ) and wind speed (solid lines, units: m s−1) by CTRL (a,d), SN1 (b,e), SN3 (c,f) at 500 hPa (ac) and 850 hPa (df) at the making-landfall moment (0600 UTC 18); red typhoon symbols represent the simulated typhoon centers while purple typhoon symbols represent the observed typhoon centers.
Atmosphere 08 00257 g006
Figure 7. Distribution of radar reflectivity (dashes, units: dBZ) and wind speed (solid lines, units: m s−1) by CTRL (a,d), SN1 (b,e), SN3 (c,f) at 500 hPa (ac) and 850 hPa (df) at the deflection moment (0600 UTC 20); red typhoon symbols represent the simulated typhoon centers while purple typhoon symbols represent the observed typhoon centers.
Atmosphere 08 00257 g007
Figure 8. Environmental mean wind profile of CTRL (a,b), SN1 (b,e), SN3 (c,f) at 0600 UTC 18 (ac) and 0600 UTC 20 (df). The stars in the figure represent the coordinate system’s origin.
Atmosphere 08 00257 g008
Table 1. Physical parameterization schemes for CTRL.
MicrophysicsWSM6
Longwave RadiationRRTM
Shortwave RadiationDudhia
Surface LayerMonin-Obukhov
Land SurfaceNoah
Planetary Boundary layerMYNN2.5
Cumulus ParameterizationKain-Fritsch
Table 2. Experimental design of sensitivity tests.
TestsVariablesHeight RangeWavenumbers
CTRLNoNoNo
SN1(u, v)all levelsJa = 4, Ka = 3
SN2(u, v) Φall levelsJa = 4, Ka = 3
SN3Θall levelsJa = 4, Ka = 3
SN4(u, v) Φ θall levelsJa = 4, Ka = 3
Table 3. Mean track errors in the first 24, 48, 72, 96 h and during different periods (units: km).
Tests0–24 h0–48 h0–72 h0–96 hLandfall PeriodDeflection Period
CTRL232037861782
SN1153436325339
SN2153335315337
SN3254744526947
SN4173534316032

