Article

Estimating Uncertainty in Global Mercury Emission Source and Deposition Receptor Relationships

by
Francesco De Simone
1,*,
Ian M. Hedgecock
1,
Francesco Carbone
1,
Sergio Cinnirella
1,
Francesca Sprovieri
1 and
Nicola Pirrone
2
1
CNR-Institute of Atmospheric Pollution Research, Division of Rende, UNICAL Polifuzionale, 87036 Rende, Italy
2
CNR-Institute of Atmospheric Pollution Research, Area della Ricerca Roma 1, Via Salaria, 00015 Monterotondo, Italy
*
Author to whom correspondence should be addressed.
Atmosphere 2017, 8(12), 236; https://doi.org/10.3390/atmos8120236
Submission received: 24 October 2017 / Revised: 23 November 2017 / Accepted: 24 November 2017 / Published: 29 November 2017
(This article belongs to the Special Issue Atmospheric Metal Pollution)

Abstract

:
Establishing mercury (Hg) source-receptor (SR) relationship matrices provides a tool to improve the understanding of the geographic relationship between regions of Hg release and its eventual deposition. SR relationship matrices are therefore a useful starting point for the development of policies aimed at reducing the impact of Hg emissions from anthropogenic activities (Hganthr) on sensitive ecosystems and areas potentially at risk of Hg contamination. A global Chemical Transport Model (CTM) has been used to simulate the emission, transport and fate of Hganthr from 12 source regions, considering a range of uncertainty in the modelled chemical and physical processes. This ensemble of simulations gives an estimate of the Hg deposition which derives from each source region, as well as an estimate of the uncertainty of the calculated deposition flux. The uncertainty has been calculated using the bootstrap method to estimate this uncertainty in terms of the normalised confidence interval amplitude of the mean (NCIAM). Within the calculated confidence ranges, for almost all regions the contribution to the Hg deposition flux from remote sources is greater than that from domestic sources. Europe and South Asia, where the contributions are statistically indistinguishable, are exceptions, as is East Asia, with local sources dominating the Hg deposition flux. East Asia is the single most important remote source region for most receptor regions. The results yield such high uncertainties in the deposition flux for many receptor regions that the results are unlikely to be taken into consideration by policy makers. This uncertainty is particularly relevant when considering the “domestic” contribution to regional deposition, highlighting the need for more studies to resolve remaining uncertainties in the atmospheric Hg cycle, and Hganthr emission inventories.

1. Introduction

Mercury (Hg) is considered to be a global pollutant since it threatens ecosystems which are remote from its emission sources, due principally to its long range transport in the atmosphere [1]. The Minamata Convention on Mercury (http://www.mercuryconvention.org/), October 2013, aims to reduce mercury contamination resulting from anthropogenic activities [2].
The assessment of the magnitude of the impact of anthropogenic Hg (Hganthr) from a given region has on ecosystems in other regions requires the characterisation of how Hg is released to the atmosphere. That is to say, knowledge of the amount and location of Hganthr emissions as well as information concerning their speciation and injection height distribution within the atmosphere. These emissions characteristics differ significantly among the various Hganthr emission sectors, but play an important role in determining the fraction of Hganthr which will be deposited rapidly and how much will be transported further afield [3].
The trans-boundary dispersion of Hganthr over longer distances and its eventual deposition also depends on the physical and chemical processes which occur in the atmosphere, including, but not limited to, red-ox reactions, global circulation patterns and the type and frequency of precipitation events, all of which vary over time, and generally also differ from year to year [4,5,6].
A number of studies have sought to establish source-receptor relationships for Hg deposition and concentration fields at both regional [7,8] and global scales [9,10], for present conditions, or specific events, and for future emission scenarios [9]. Most of these studies were performed considering primarily the uncertainty range in the emission estimates and only in part, if at all, the inevitable variations in model output due to the uncertainties inherent in modelling atmospheric Hg processes.
In Wang et al. [8], a number of emission “scenarios” were investigated, to determine the impact of Hganthr emissions with the intention of identifying emission sectors deserving priority in terms of regulatory policy. In AMAP/UNEP [10], an assessment of uncertainty in SR relationship apportionment related to Hg deposition was made, using multi-model (GLEMOS [11], GEOS-Chem [12,13], GMHG [14,15,16]) simulations of atmospheric Hg transport and fate. The study sought to quantify deposition to major geographical regions and ocean basins worldwide as a function of emission source region. The models involved differ significantly in their formulation, spatial resolution, and the representation of the physical and chemical processes Hg undergoes in the atmosphere. Nonetheless the range of values obtained for the SR-Matrix does provide a measure of the uncertainty associated with the knowledge gaps related to Hg processes, as represented in the CTMs used in the study (see Fiore et al. [17], for an example). Moreover, the models all used the same global inventory of Hg anthropogenic emissions, AMAP/UNEP [18], with little variation in Hg speciation. Simulations with other inventories were not performed, nor were model parameters varied, some of which, such as injection height and the oxidation mechanism within the same model, have been identified as having a noticeable effect on the simulated fate of Hganthr [3].
Models used to study the fate of mercury, are deterministic, and as such, the results they provide cannot be defined as either “true” or “false”, they are generally described as somewhat “better” or rather “worse”. It is important, if these models are to serve a purpose in the support of policy and management decisions, that an estimate of the uncertainty associated with their results is forthcoming [19].
Another class of SR studies has been based on a fully coupled, multi-reservoir biogeochemical box model based on GEOS-Chem developed to investigate the Hg cycle [20,21]), and used to evaluate global SR relationships on a multi-millennial time scale (see also the recent work by Chen et al. [22]). In these studies, the uncertainties considered are limited to a number of the model inputs, however including a large number of process uncertainties would be impractical for this modelling approach.
This study seeks to provide an estimate of the cumulative uncertainty in SR relationships for Hg deposition, taking into account, as far as possible, the individual uncertainties associated with model inputs and parameters which influence the atmospheric Hganthr cycle. A comparison is made of the ‘domestic’ versus ‘remote’ Hganthr emission contribution to each region’s deposition, and their respective uncertainties have been evaluated.
Sensitivity model runs have been carried out using the on-line Hg CTM ECHMERIT, for different years, employing three different anthropogenic Hg emission inventories. Further runs varying a number of the assumptions and model parametrisations regarding both Hganthr release characteristics, and the processes Hg undergoes in the atmosphere, were performed to produce an ensemble of simulations. Thus taking into account the range of the most important variables influencing the atmospheric Hg cycle, and specifically Hg deposition.
Using this ensemble an evaluation of the mean Hganthr deposition due to each source for each receptor, and their relative confidence intervals (CI, at 95% level), were modelled using the bootstrap [23] technique. This provides a quantitative estimate of the uncertainty associated with the mean deposition values, in terms of the normalised confidence interval amplitude for the mean (NCIAM), as described in Section 2.

2. Materials and Methods

Two sets of simulations were performed using the global Hg CTM ECHMERIT [24,25], based on the fifth generation General Circulation Model ECHAM5 [26,27]. The first set considers all emissions, marine, biomass burning etc. as well as anthropogenic sources. Three different anthropogenic inventories were used, referred to here as AMAP [18], EDGAR [28] and STREETS [9,29]. The second set of experiments included only anthropogenic Hg emissions, which were tagged on the basis of their source region. These were then used to perform the source-apportionment of Hganthr deposition, to finally evaluate the relative uncertainty, the object of this study.
The emissions of Hganthr were tagged in the model according the definition of source regions, as showed in Figure 1, following the definition of HTAPv2 (http://www.htap.org/) initiative, and then used to perform the source apportionment of Hganthr deposition.
The Hganthr emission inventories, where not already in NetCDF format were converted at their native resolution, and mapped using the HTAPv2 mask (http://www.htap.org/) file using the large fraction area method included in the Climate Data Operators (CDO) [30].
The emission fields were then interpolated onto the ECHMERIT T42 horizontal grid (roughly 2.8 by 2.8 at the equator) using the mass conserving remapping tool of CDO, and onto its 19 vertical levels (up to 10 hPa), using the relevant prescribed, derived or operationally defined, height distributions [3,18,28,31].
The results of the runs were required to compare reasonably with field measurements, in order to be included in the analysis and also to be not too similar to each other (tested using the the horizontal pattern correlation method [32,33]). This was done to avoid, as far as possible, bias in the subsequent bootstrap analysis [23].
Within each set of simulations, runs were conducted varying parameters and model assumptions, covering a range of all reasonable uncertainties, as explained in detail below. The BASE simulation uses meteorological data from 2010 and makes use of the O3/OH oxidation scheme, with oxidant fields imported from the MOZART model [34].
As there remains some uncertainty concerning atmospheric Hg oxidation process [35,36,37], simulations were also run including an oxidation mechanism based on bromine, with oxidant fields from the p-Tomcat model [38,39].
Two runs with hypothetical speciation ratios (100% Hg ( g ) 0 and 50:50 Hg ( g ) 0 : Hg II ( g ) ) were also evaluated. Further runs were also performed using meteorological input from different years but maintaining the same emissions.
The first set of simulations includes Hg emissions from biomass burning, mapped to those of CO as estimated by the FINNv1 inventory [40], by using a global averaged enhancement ratio ( 1.54 × 10 7 ) [41,42]. Emissions from oceans were calculated on-line in the model as described in De Simone et al. [25], whereas prompt re-emission of deposited Hg was included only in the first set of simulations [43]. For the second set this process was switched-off to address only the direct deposition of Hganthr. A spin-up period of 4 years was employed for both sets of simulations, and the results from the fifth year, namely 2010, were then considered for the analysis.
A summary of the simulations performed can be found in Table 1. A number of the runs in the first set of simulations are very similar to those discussed in De Simone et al. [3], where the results were found to agree reasonably well with both atmospheric Hg concentration and Hg deposition flux fields for the year under study (2010). The variation of model parametrisations investigated did not lead to statistically significant (95% confidence level) model performance, indicating that none of them may be considered either unreasonable or unrealistic.
The results from the second set of the simulations which were used for the source apportionment of Hganthr deposition, are clearly not comparable to observations but serve to calculate the ensemble of the SR matrices. This final ensemble of SR-matrices were then used as input data to infer the statistical proprieties regarding the simulated Hganthr deposition fluxes.
All the statistical metrics, and the relative confidence intervals (CI, at the 95% level) were calculated using the bootstrap method [23]. Bootstrapping is a statistical technique that has been proposed and successfully used in the analysis of output from mathematical models, since it has two attributes making it very attractive in such a context: it is particularly useful when dealing with small sample sizes, and importantly makes no assumptions regarding the distribution of the sample data [23].
Bootstrapping makes use of data sampling with replacement (resampling) from an approximating distribution, to estimate in a robust way the properties of almost any statistic. Commonly, it is used to estimate population parameters such as the mean or the variance and to derive estimates of their confidence intervals. In this case, as is common when using this method, the distribution from which the resampling takes place is the empirical set of observations available, i.e., the model outputs. It is implemented by performing a number of resamples with replacement, of the observed data set, with each resampled data set having the same size as the original.
Starting from the single sample of the SR-matrices, bootstrapping involves, for each matrix cell, taking the original data set of the results from the 8 simulations and sampling to obtain new samples (10,000) of the same size of the original data set. For each of these bootstrap samples the mean was calculated, producing a histogram of bootstrap means, where the median (50%) is the estimated mean and the values at the 2.5% and 97.5% percentile represent the bounds of the CI for the estimated mean at a 95% level of confidence.
The estimated mean of the matrix of cells, and its respective CI, was then used to calculate the normalised confidence interval amplitude for the mean (NCIAM), which is used as a measure of the associated uncertainty (see, for example, Seddon et al. [44]). The confidence interval amplitude was normalised using the corresponding mean value,
NCIAM = 100 × B o o t M e a n 50 % ( B o o t M e a n 97.5 % B o o t M e a n 2.5 % )
where B o o t M e a n 50 % , B o o t M e a n 97.5 % , and B o o t M e a n 2.5 % are the median and the 97.5% and 2.5% percentile values of the histogram of the means of the bootstrapped samples. Values of the NCIAM greater than 100% correspond to a total uncertainty larger than the mean value itself.
The evaluation of the CI for the mean allows source regions for a given receptor to be compared in order to rank their impact. This same process was further applied to the raw model simulations to provide also an estimate of uncertainty directly at the model grid level.
The bootstrap resampling and the statistical calculations were performed using the NCAR Command Language (NCL, https://www.ncl.ucar.edu/).

3. Results

The fate of Hganthr depends particularly on its emission characteristics, in terms of speciation and the emission height, and how the emissions interact temporally and spatially with meteorological factors determining atmospheric transport and precipitation patterns. During transport the distribution of atmospheric Hg oxidants plays an important role. Generally speaking, the emission speciation and injection height distribution are the major contributors to the uncertainty in the simulated Hganthr deposition flux within a given region. Variation in the Hg oxidation mechanism employed in the model, atmospheric circulation and precipitation patterns yield greater uncertainty in the deposition far away from a given emission source.
Analysis of the NCIAM reveals that the global uncertainty in the annual mean deposition flux of Hganthr from each of the source regions in Figure 1, shows very different distributions. Since the ensemble of simulations includes a reasonable range of the factors potentially influencing modelled deposition, this variation in “uncertainty distribution” reflects the complex interactions between emission and transport and how these differ from region to region.
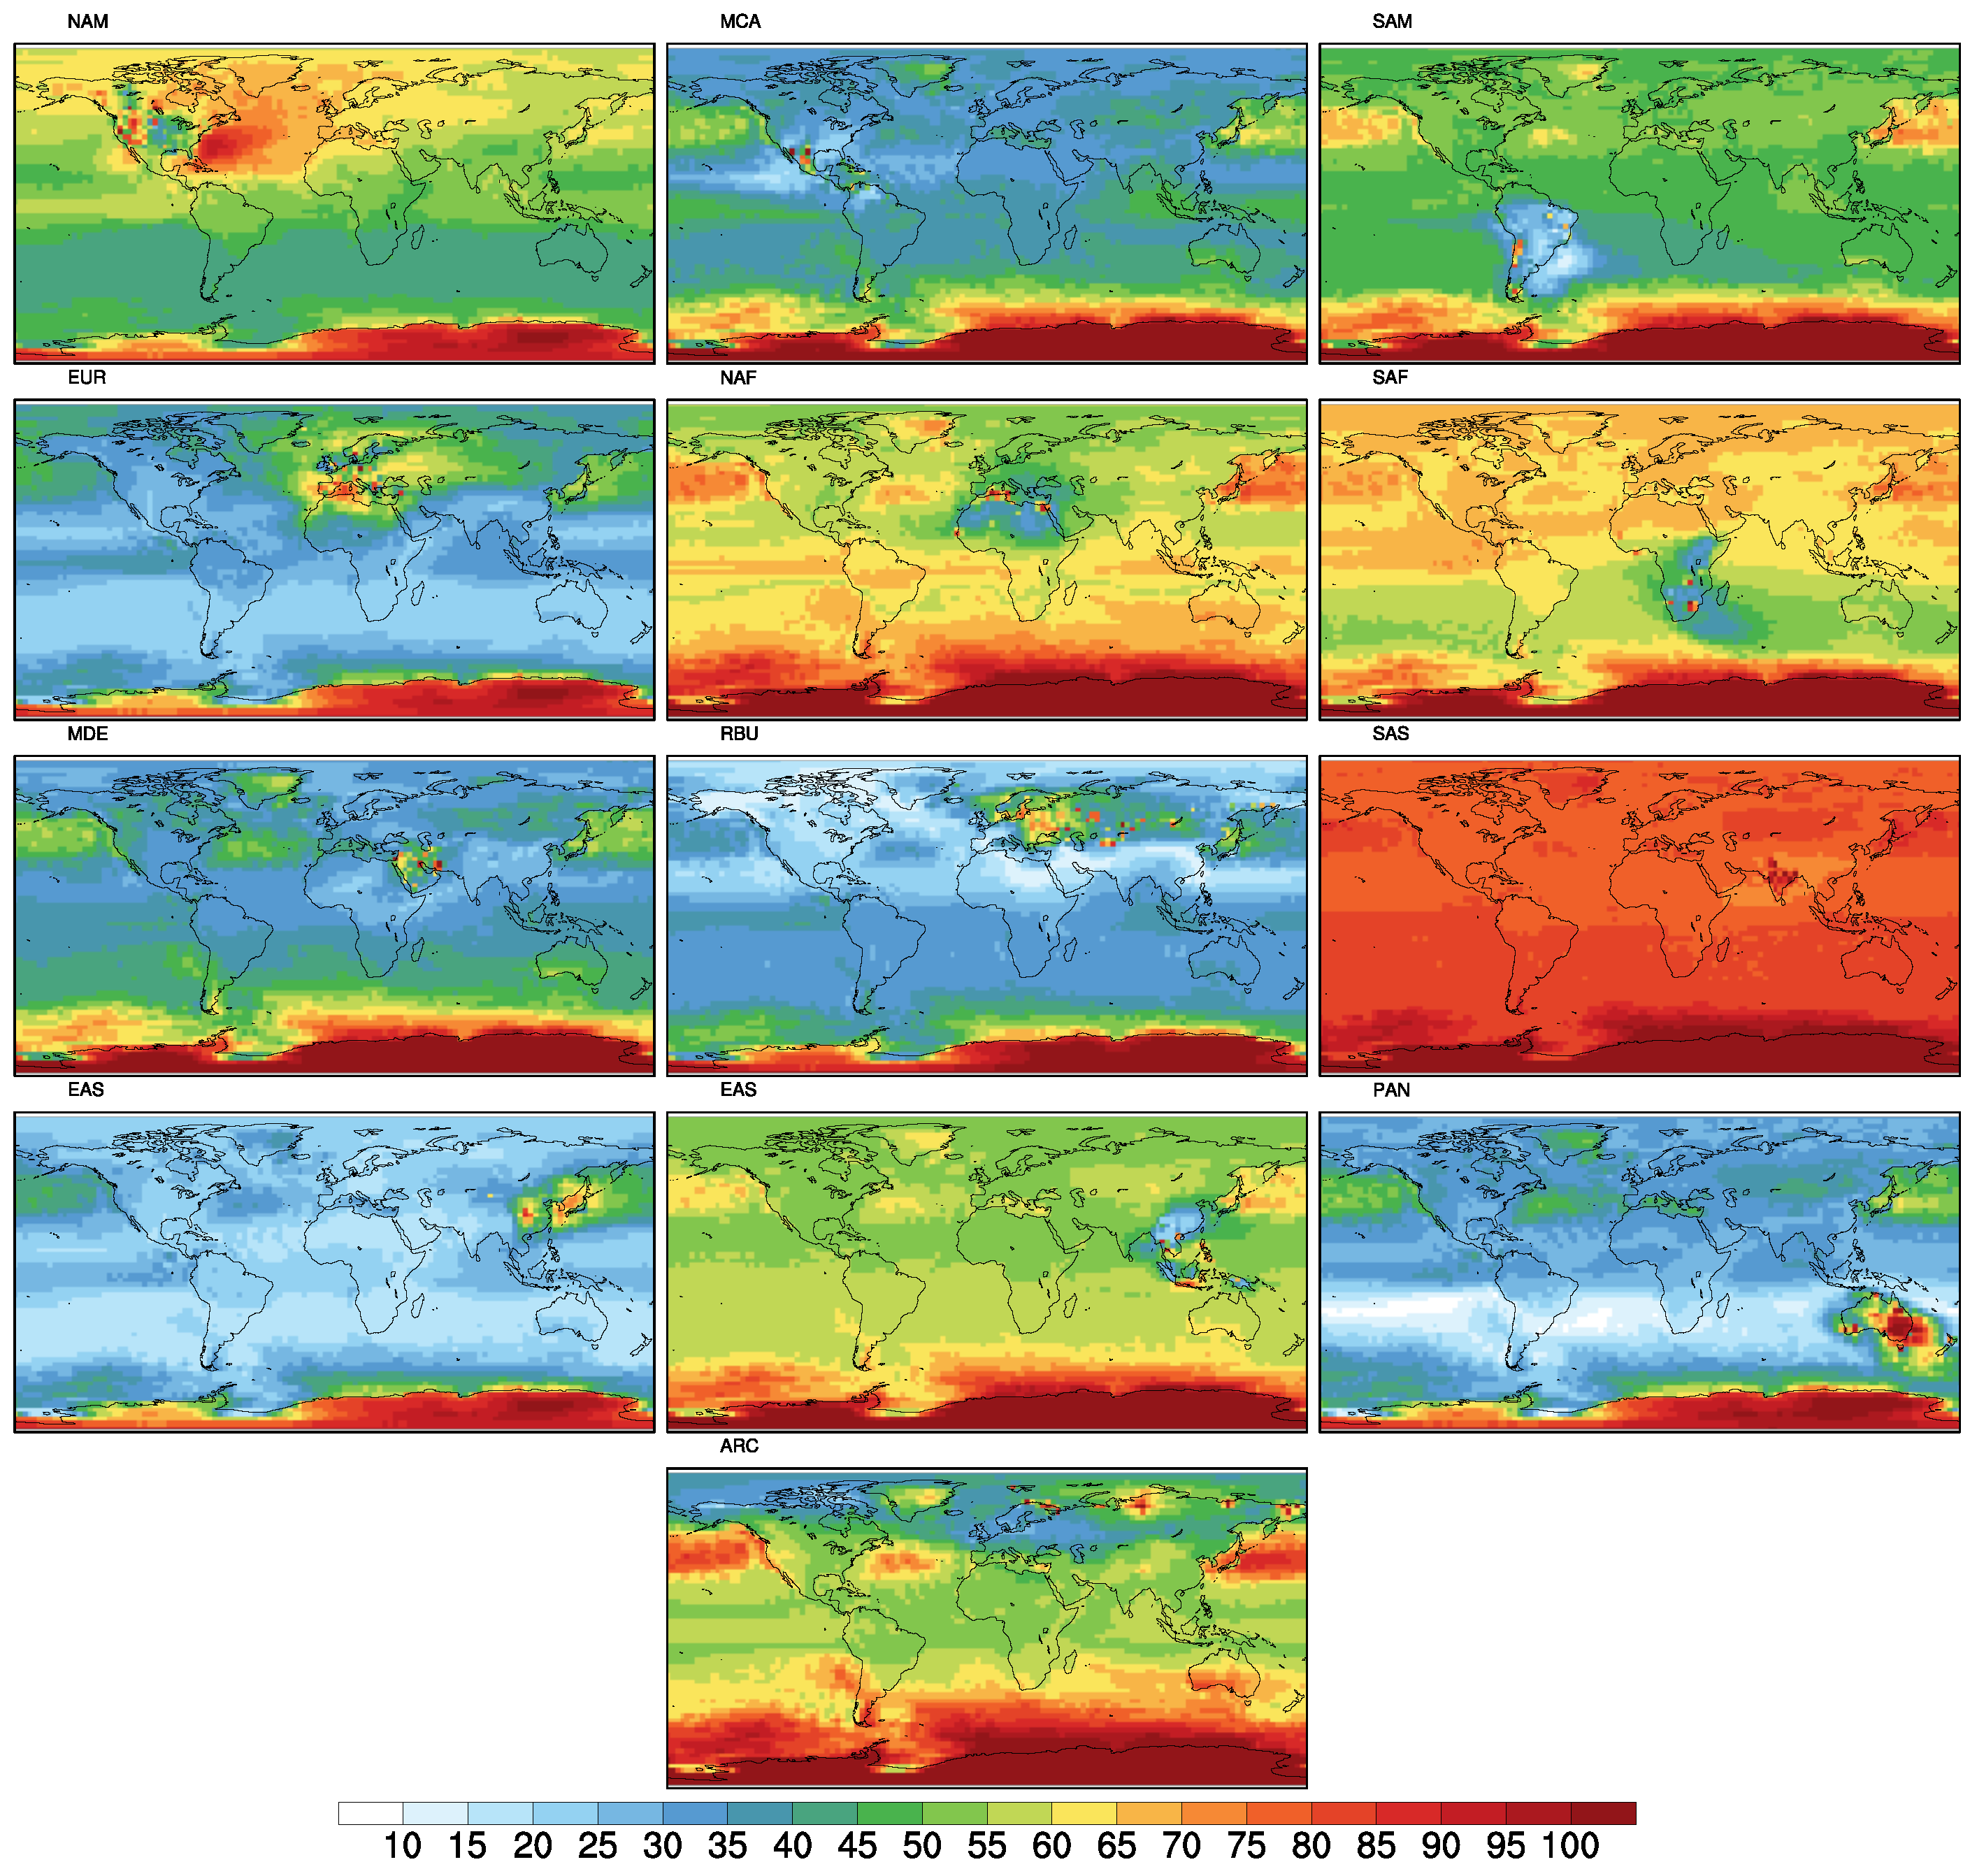
Figure 2 shows the global distribution of NCIAMs of the Hganthr total deposition fluxes due to each source region, obtained from the ensemble of runs listed in Table 1. Two things immediately stand out, namely, the large uncertainty in the deposition flux due to emissions of Hganthr from South Asia, and the large uncertainty associated with deposition to Antarctica from all source regions.
The uncertainty in the normalised mean deposition fluxes of Hganthr from South Asia is very different from the other source regions. For most source regions there are significant parts of the world where the normalised mean uncertainty is 50% or less, this is not the case at all for South Asia, where worldwide the uncertainty associated with the mean Hganthr deposition flux is over 65%. In contrast the deposition of Hganthr arising from emissions from Middle and Central America, for example, shows an uncertainty below 50% almost everywhere.
The region which is an exception in the case of Middle and Central America and which stands out for all of the source regions presented in Figure 2, is Antarctica. The reason for the high uncertainty in the mean annual deposition Hganthr flux is due to the very different results which are obtained using the alternative O3/OH and Br oxidation mechanisms. There are a number of reasons behind this one is the high concentration of Br predicted by models at high southern latitudes, another is that using the O3/OH much of the Hganthr emitted in the tropics and sub-tropics is rapidly oxidised, and eventually deposited, close to source, (due to the relatively higher concentrations of O3/OH in these regions compared to mid-latitudes) and hence not transported. This difference was also seen in a modelling study of Hg emissions from biomass burning when performing simulations with the two mechanisms [42].
A number of regions show high uncertainty hot-spots within the source region itself (or just trans-boundary), as is noticeable in North America, Europe, Central Asia and Russia, East Asia, Pacific, Australia and New Zealand and the Arctic. For other regions, the transport, atmospheric chemistry and deposition processes and their interaction, cause the Hganthr emitted to give rise to higher uncertainty in the total annual deposition flux far away from the source, as is the case for South America, Southern Africa and Northern Africa, and as mentioned above, particularly South Asia.
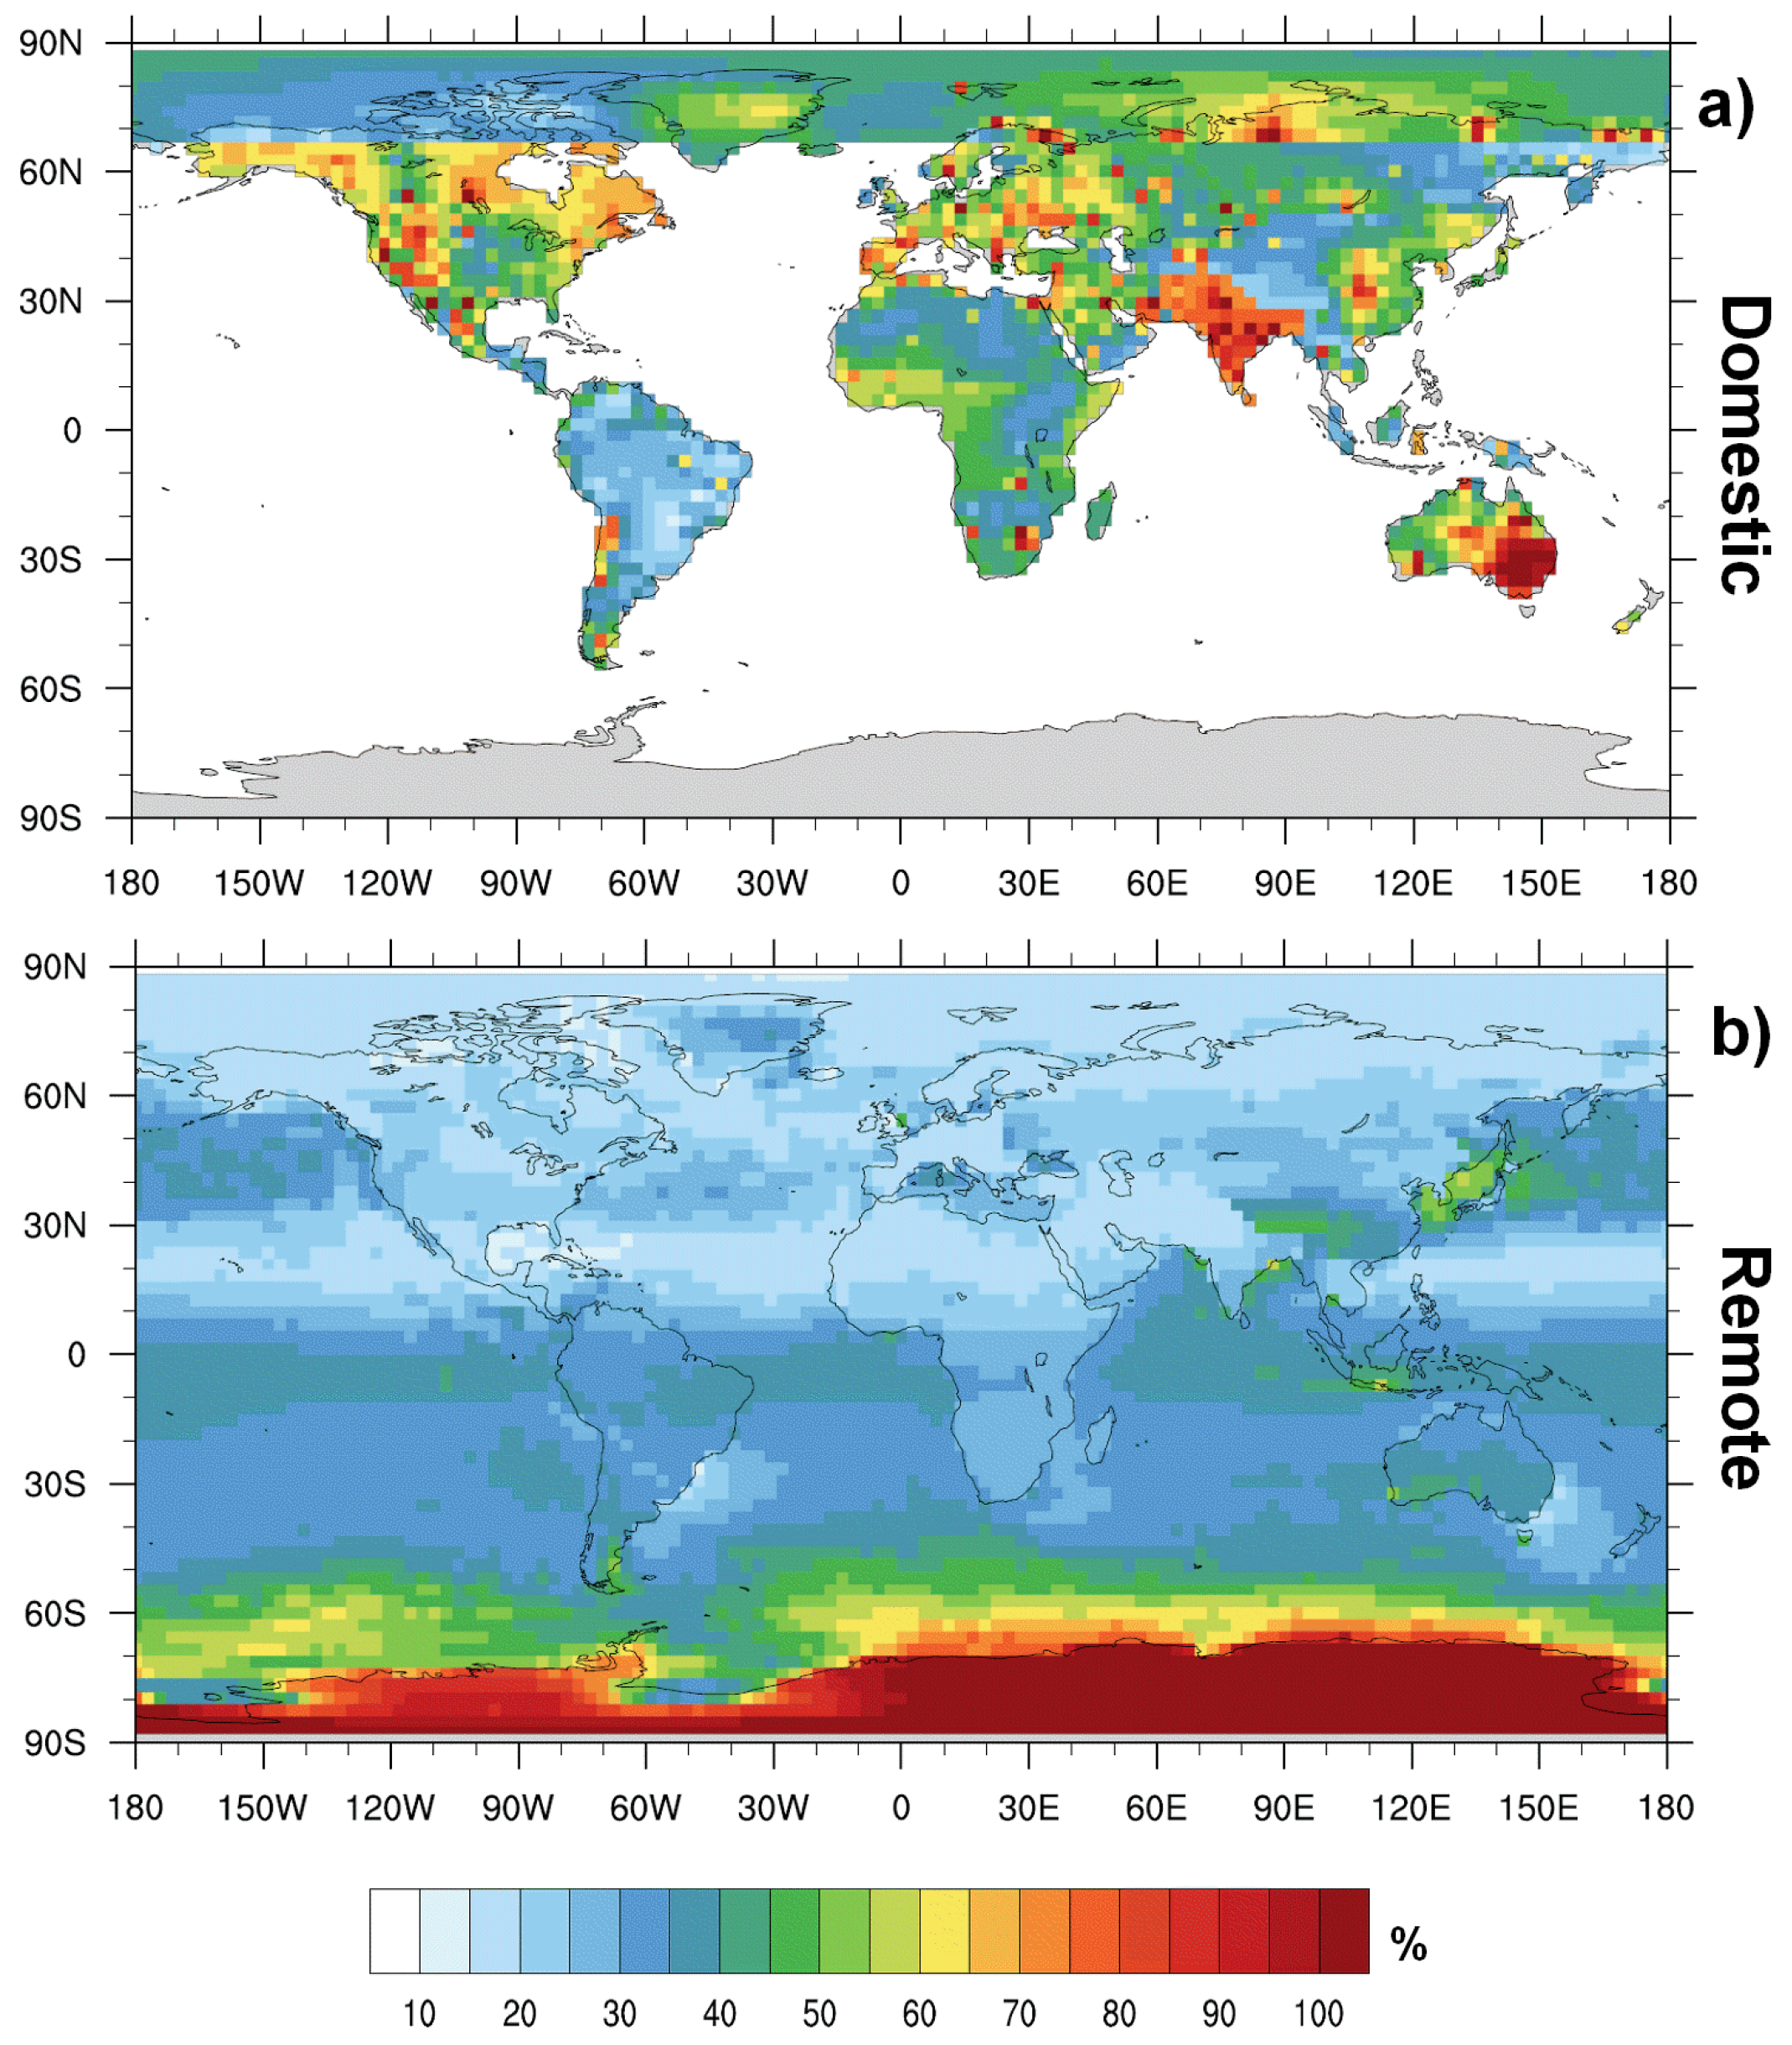
The source regions as defined in figure Figure 1 are also potential receptors for the Hganthr emissions from all the other regions as a result of long range transport. For each cell in the model the the contribution to the Hganthr deposition flux from sources within the same region and those from outside the region have been determined and the uncertainty in these fluxes calculated. The domestic “hot-spots” of uncertainty stand out starkly in panel (a) of Figure 3, while the far less uncertain contribution of non-local sources to the Hganthr deposition flux is immediately evident in panel (b) of the same figure. The domestic source contribution to Hganthr deposition is most uncertain in the world’s industrialised regions, particularly South Asia, but also North America, Europe, south-eastern Australia and to a lesser extent East Asia. Values over 100% indicate that the uncertainty is greater than the mean value itself. The reason for the high uncertainty from the long-range contribution to Hganthr deposition in Antarctica is as described above. For the rest of the world however the uncertainty in the mean flux is generally less than 50% and tends to be lower in the northern rather than the southern hemisphere.

Uncertainty in the Source-Receptor Matrix

The individual simulations used to produce the maps of the uncertainty distribution discussed above were used to calculate the set of source receptor matrices used as input to the statistical model. The details are summarised in the estimated uncertainty Source-Receptor matrix, in Table 2, which reports, for each of the receptor regions (horizontal), the mean (and the relative confidence interval at a 95% level) of the Hganthr total deposition (Mg/year) due to each of the source regions (vertical). The table provides a comprehensive summary of the results, and contains significant information, however it is a little unwieldy. Therefore the heat-maps in Figure 4 were prepared to give an “at a glance” overview of the results.
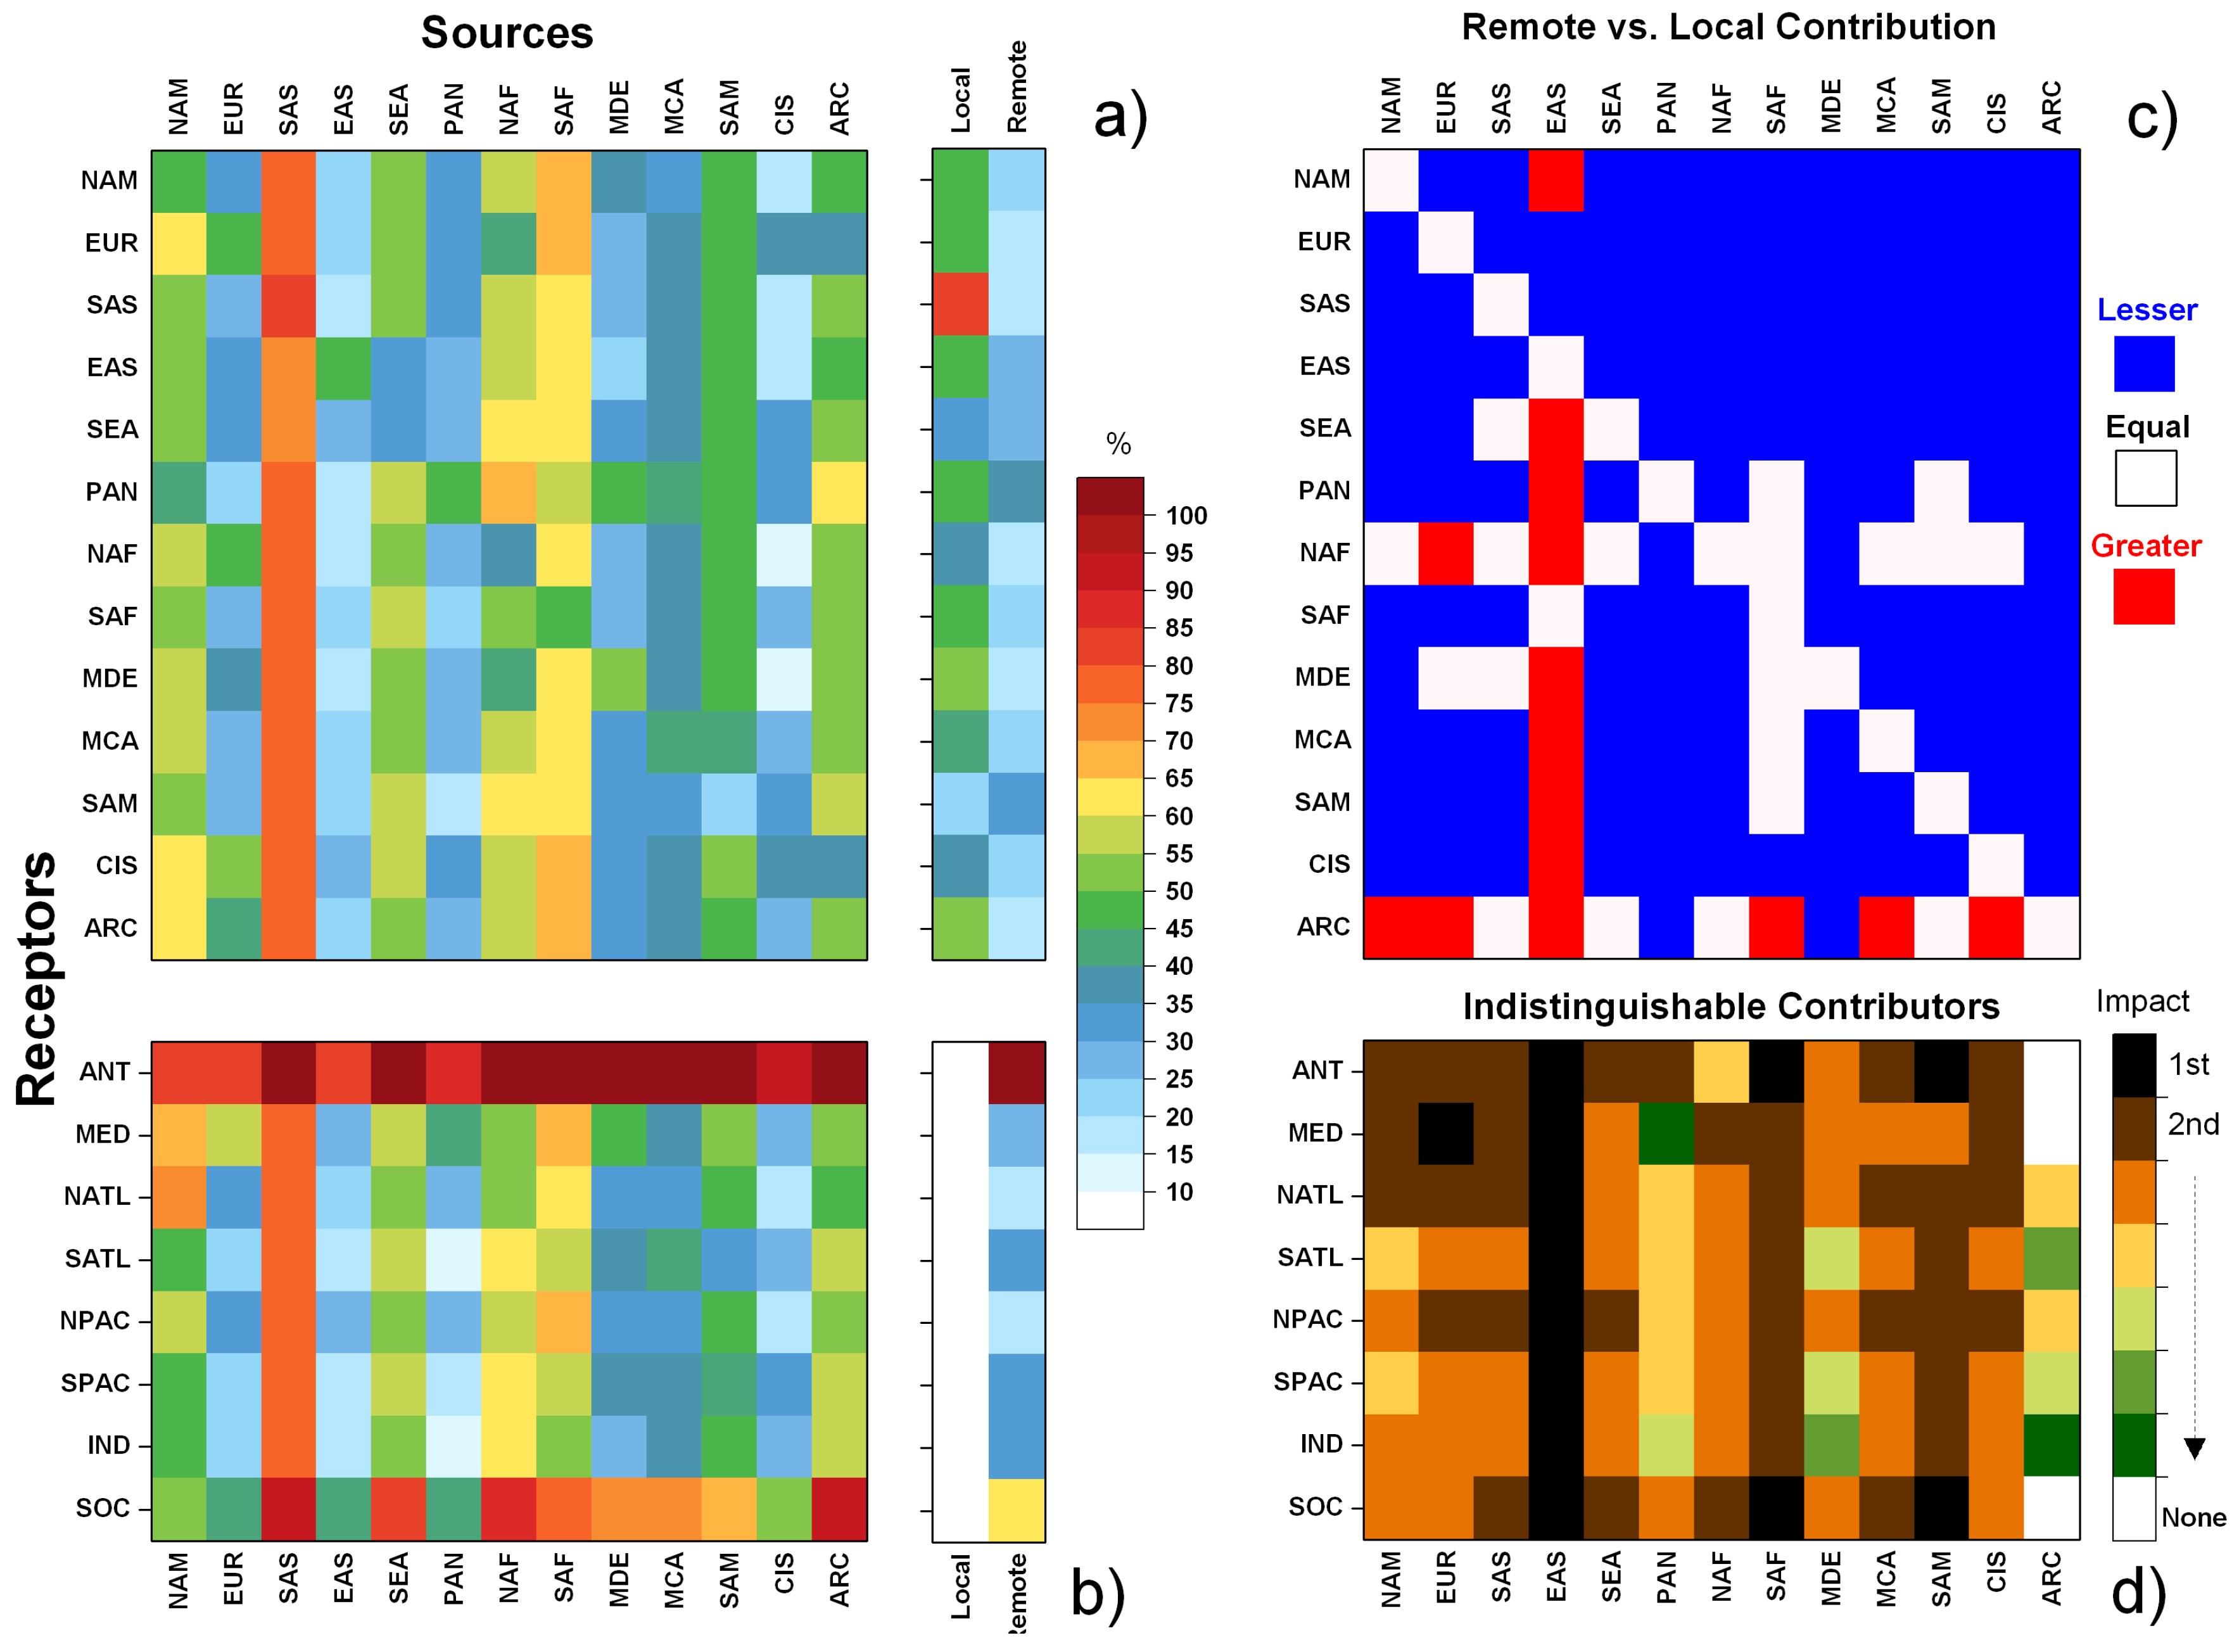
Panels (a) and (b) of Figure 4, show the NCIAM associated with the deposition of Hganthr from each source region to each of the receptors. It is evident that the deposition of Hganthr from a number of source regions is characterised by a greater uncertainty respect to others. This can be seen in the vertical stripes of colours to the high percentage end of the colour bar, noticeably South Asia, South East Asia, North America, Southern and Northern Africa, but also those sources which fall inside the Arctic Circle. The analysis of the heat-maps underlines the conclusions obtained from the underlying geographical distribution of uncertainty seen in Figure 3.
Generally the uncertainty associated with the domestic contribution to Hganthr deposition is the highest (on the main diagonal in panel (a) and shown in the first of the two detached columns on the right hand side of panel (a)). The NCIAM for the domestic contribution lies in the range ≈40% to 55 % for almost all sources, except South East Asia and South America where it is lower, 25% and 40% respectively, and South Asia where it is much higher, ≈80%. Conversely, the uncertainty of the combined remote contributions (second detached column in panel (a)) is lower than the domestic contribution (NCIAM, 18–36%) for all receptor regions except for the southernmost ones, Antarctica and the Southern Ocean. Only in South America is the uncertainty in the remote contribution higher than the uncertainty in the domestic contribution to Hganthr deposition.
In almost all source regions, the confidence range of the calculated mean deposition fluxes the contributions to the deposition flux from domestic and remote Hganthr sources are different. Only in Europe and South Asia are the two contributions indistinguishable (depicted by stars in Table 2). For East Asia the domestic is greater than the remote contribution (83–135 vs. 32–44 Mg/year), whereas for all the remaining regions, it is the remote contribution that makes up the bulk of the Hganthr deposition flux.
To visualise the relationship between the individual receptor and source regions two further heat-maps were produced, Figure 4c,d. Panel (c) shows, using three colours when the long-range contribution of a given source region is less (in blue), greater (in red), or indistinguishable (white) from the domestic contribution. From Figure 4c It is immediately evident how East Asia is the single greatest Hganthr source region for all receptors, apart from Europe and South Asia, where it is significantly lower, and also South Africa where the East Asian contribution is similar to the domestic contribution.
Figure 4d shows, for each ocean basin receptor, the sources whose contributions are statistically indistinguishable (at 95% level of confidence), they are the same colour in the figure. Moreover the colour map indicates the relative importance of the sources relative to that receptor. For example the Hganthr deposition flux to the Mediterranean has two primary source regions whose contributions are essentially the same, Europe and East Asia, both shown in black. The scenario depicted is complex, with most ocean basins receiving contributions from a large number of sources and usually with a number of sources making similar contributions to the Hganthr deposition flux. Hence it is clear that multilateral action would be necessary to reduce the Hganthr contribution to Hg deposition to the world oceans and seas. Two of the more sensitive marine environments, the Mediterranean and the Arctic are characterised by this situation, suggesting that local unilateral action would not have a major effect.

4. Discussion

One of the principal results of this analysis is that the uncertainties regarding the domestic contribution to Hganthr deposition is greater than the uncertainty due to the contribution from remote sources in all source regions. This is essentially due to the relatively poor knowledge of the speciation and the vertical distribution of the Hganthr emissions. This is particularly exacerbated within regions characterised by high Hganthr emissions, and close to emission sources. More field studies are therefore needed to improve current knowledge of the characteristics of Hganthr at its point of release, in order to improve the accuracy of Hg emission inventories and consequently to reduce the uncertainty associated with model results. This is particularly important in determining the local impact of Hganthr at regional and sub-continental scales.
Uncertainty regarding the remote contribution to Hganthr deposition is generally lower than 30% over the Northern Hemisphere, peaking at ≈50% over South East Asia. In the Southern Hemisphere uncertainty is slightly higher (40–60%), particularly over Antarctica where it reaches over 100%. However, especially when looking at Hganthr deposition to ocean basins with delicate ecosystems, the situation is complicated by the fact that many source regions contribute in a manner that are statistically indistinguishable, demonstrating the necessity of coordinated, global multilateral action to reduce the Hg burden.
In order to provide modelling results and scenario-based simulations which can be reasonably used to inform policy decisions seems to be beyond the scope of current modelling systems due particularly to the uncertainty in the characterisation of Hganthr emissions (fluxes, speciation and height), and atmospheric processes (in particular the redox chemistry of Hg).
In terms of the Minamata Convention, Article 19 on Research, development and monitoring, calls on the Parties, to cooperate to develop and improve among other objectives the modelling and monitoring of levels of mercury and mercury compounds in populations and environmental media. However as Gustin et al. [2] observe, “Exchange of Hg among reservoirs (atmosphere, lithosphere, biosphere, and hydrosphere), and the amount present in each reservoir, are estimated using computational models based on limited spatial and temporal measurements of Hg concentrations, particularly in the atmosphere and ocean.
Until the uncertainties concerning the atmospheric cycle of the Hg are resolved, it is necessary to consider the use of quantitative management tools and models, which are able to handle explicitly the scenarios of all possible realistic outcomes, such as stochastic programming, or robust optimisation, which have been exploited successfully in other fields to manage information uncertainty [45,46].

Acknowledgments

We are grateful to Sebastian Rast and colleagues at the Max Planck Institute for Meteorology in Hamburg, Germany for the distribution of their software ECHAM5 and for providing the access to the processed ERA-INTERIM data. We are grateful to Xin Yang for providing the Br/BrO fields from p-Tomcat.

Author Contributions

Francesco De Simone, Ian M. Hedgecock and Sergio Cinnirella conceived and designed the experiments; Francesco De Simone e Francesco Carbone performed the experiment and analyzed the data; Francesco De Simone and Ian M. Hedgecock wrote the paper; Francesca Sprovieri and Nicola Pirrone overseen the scientific work and contributed to founding resources and HPC structures for carrying out the simulations.

Conflicts of Interest

The authors declare no conflict of interest.

Abbreviations

The following abbreviations are used in this manuscript:
NCIAMnormalised confidence interval amplitude for the mean

References

  1. Fitzgerald, W.F.; Engstrom, D.R.; Mason, R.P.; Nater, E.A. The case for atmospheric mercury contamination in remote areas. Environ. Sci. Technol. 1998, 32, 1–7. [Google Scholar] [CrossRef]
  2. Gustin, M.S.; Evers, D.C.; Bank, M.S.; Hammerschmidt, C.R.; Pierce, A.; Basu, N.; Blum, J.; Bustamante, P.; Chen, C.; Driscoll, C.T.; et al. Importance of Integration and Implementation of Emerging and Future Mercury Research into the Minamata Convention. Environ. Sci. Technol. 2016, 50, 2767–2770. [Google Scholar] [CrossRef] [PubMed]
  3. De Simone, F.; Gencarelli, C.N.; Hedgecock, I.M.; Pirrone, N. A modeling comparison of mercury deposition from current anthropogenic mercury emission inventories. Environ. Sci. Technol. 2016, 50, 5154–5162. [Google Scholar] [CrossRef] [PubMed]
  4. Bullock, O.R.; Atkinson, D.; Braverman, T.; Civerolo, K.; Dastoor, A.; Davignon, D.; Ku, J.Y.; Lohman, K.; Myers, T.C.; Park, R.J.; et al. The North American Mercury Model Intercomparison Study (NAMMIS): Study description and model-to-model comparisons. J. Geophys. Res. 2008, 113, 1–17. [Google Scholar] [CrossRef]
  5. Lin, C.J.; Pongprueksa, P.; Lindberg, S.E.; Pehkonen, S.O.; Byun, D.; Jang, C. Scientific uncertainties in atmospheric mercury models I: Model science evaluation. Atmos. Environ. 2006, 40, 2911–2928. [Google Scholar] [CrossRef]
  6. Pongprueksa, P.; Lin, C.J.; Lindberg, S.E.; Jang, C.; Braverman, T.; Bullock, O.R.; Ho, T.C.; Chu, H.W. Scientific uncertainties in atmospheric mercury models III: Boundary and initial conditions, model grid resolution, and Hg (II) reduction mechanism. Atmos. Environ. 2008, 42, 1828–1845. [Google Scholar] [CrossRef]
  7. Dvonch, J.; Graney, J.; Marsik, F.; Keeler, G.; Stevens, R. An investigation of source–receptor relationships for mercury in south Florida using event precipitation data. Sci. Total Environ. 1998, 213, 95–108. [Google Scholar] [CrossRef]
  8. Wang, L.; Wang, S.; Zhang, L.; Wang, Y.; Zhang, Y.; Nielsen, C.; McElroy, M.B.; Hao, J. Source apportionment of atmospheric mercury pollution in China using the GEOS-Chem model. Environ. Pollut. 2014, 190, 166–175. [Google Scholar] [CrossRef] [PubMed]
  9. Corbitt, E.S.; Jacob, D.J.; Holmes, C.D.; Streets, D.G.; Sunderland, E.M. Global source–receptor relationships for mercury deposition under present-day and 2050 emissions scenarios. Environ. Sci. Technol. 2011, 45, 10477–10484. [Google Scholar]
  10. Arctic Monitoring and Assessment Programme (AMAP); United Nations Environment Programme (UNEP). Global Mercury Modelling: Update of Modelling Results in the Global Mercury Assessment 2013; Technical Report; Arctic Monitoring and Assessment Programme: Oslo, Norway; UNEP Chemicals Branch: Geneva, Switzerland, 2015. [Google Scholar]
  11. Travnikov, O.; Ilyin, I. The EMEP/MSC-E mercury modeling system. In Mercury Fate and Transport in the Global Atmosphere; Springer: Berlin, Germany, 2009; pp. 571–587. [Google Scholar]
  12. Amos, H.M.; Jacob, D.J.; Holmes, C.D.; Fisher, J.A.; Wang, Q.; Yantosca, R.M.; Corbitt, E.S.; Galarneau, E.; Rutter, A.P.; Gustin, M.S.; et al. Gas-particle partitioning of atmospheric Hg(II) and its effect on global mercury deposition. Atmos. Chem. Phys. 2012, 12, 591–603. [Google Scholar] [CrossRef] [Green Version]
  13. Holmes, C.D.; Jacob, D.J.; Corbitt, E.S.; Mao, J.; Yang, X.; Talbot, R.; Slemr, F. Global atmospheric model for mercury including oxidation by bromine atoms. Atmos. Chem. Phys. 2010, 10, 12037–12057. [Google Scholar] [CrossRef] [Green Version]
  14. Dastoor, A.; Ryzhkov, A.; Durnford, D.; Lehnherr, I.; Steffen, A.; Morrison, H. Atmospheric mercury in the Canadian Arctic. Part II: Insight from modeling. Sci. Total Environ. 2015, 509, 16–27. [Google Scholar] [CrossRef] [PubMed]
  15. Durnford, D.; Dastoor, A.; Ryzhkov, A.; Poissant, L.; Pilote, M.; Figueras-Nieto, D. How relevant is the deposition of mercury onto snowpacks? Part 2: A modeling study. Atmos. Chem. Phys. 2012, 12, 9251–9274. [Google Scholar] [CrossRef]
  16. Kos, G.; Ryzhkov, A.; Dastoor, A.; Narayan, J.; Steffen, A.; Ariya, P.; Zhang, L. Evaluation of discrepancy between measured and modelled oxidized mercury species. Atmos. Chem. Phys. 2013, 13, 4839–4863. [Google Scholar] [CrossRef]
  17. Fiore, A.M.; Dentener, F.J.; Wild, O.; Cuvelier, C.; Schultz, M.G.; Hess, P.; Textor, C.; Schulz, M.; Doherty, R.M.; Horowitz, L.W.; et al. Multimodel estimates of intercontinental source-receptor relationships for ozone pollution. J. Geophys. Res. 2009, 114, D04301. [Google Scholar] [CrossRef]
  18. Arctic Monitoring and Assessment Programme (AMAP); United Nations Environment Programme (UNEP). Technical Background Report for the Global Mercury Assessment 2013; Technical Report; Arctic Monitoring and Assessment Programme: Oslo, Norway; UNEP Chemicals Branch: Geneva, Switzerland, 2013. [Google Scholar]
  19. Uusitalo, L.; Lehikoinen, A.; Helle, I.; Myrberg, K. An overview of methods to evaluate uncertainty of deterministic models in decision support. Environ. Model. Softw. 2015, 63, 24–31. [Google Scholar] [CrossRef]
  20. Amos, H.M.; Jacob, D.J.; Streets, D.G.; Sunderland, E.M. Legacy impacts of all-time anthropogenic emissions on the global mercury cycle. Glob. Biogeochem. Cycles 2013, 27, 410–421. [Google Scholar] [CrossRef] [Green Version]
  21. Amos, H.M.; Jacob, D.J.; Kocman, D.; Horowitz, H.M.; Zhang, Y.; Dutkiewicz, S.; Horvat, M.; Corbitt, E.S.; Krabbenhoft, D.P.; Sunderland, E.M. Global biogeochemical implications of mercury discharges from rivers and sediment burial. Environ. Sci. Technol. 2014, 48, 9514–9522. [Google Scholar] [CrossRef] [PubMed]
  22. Chen, L.; Zhang, W.; Zhang, Y.; Tong, Y.; Liu, M.; Wang, H.; Xie, H.; Wang, X. Historical and future trends in global source-receptor relationships of mercury. Sci. Total Environ. 2018, 610, 24–31. [Google Scholar] [CrossRef] [PubMed]
  23. Mudelsee, M. Climate Time Series Analysis: Classical Statistical and Bootstrap Methods, 2nd ed.; Springer: Cham, Switzerland; Berlin, Germany; New York, NY, USA; Dordrecht, The Netherlands; London, UK, 2014. [Google Scholar]
  24. Jung, G.; Hedgecock, I.M.; Pirrone, N. ECHMERIT v1.0—A new global fully coupled mercury-chemistry and transport model. Geosci. Model Dev. 2009, 2, 175–195. [Google Scholar] [CrossRef]
  25. De Simone, F.; Gencarelli, C.; Hedgecock, I.; Pirrone, N. Global atmospheric cycle of mercury: A model study on the impact of oxidation mechanisms. Environ. Sci. Pollut. Res. 2014, 21, 4110–4123. [Google Scholar] [CrossRef] [PubMed]
  26. Roeckner, E.; Bäuml, G.; Bonaventura, L.; Brokopf, R.; Esch, M.; Giorgetta, M.; Hagemann, S.; Kirchner, I.; Kornblueh, L.; Manzini, E.; et al. The Atmospheric General Circulation Model ECHAM 5. Part I: Model Description; MPI-Report No. 349, 2003; Technical Report; Max Planck Institute for Meteorology (MPI-M): Hamburg, Germany, 2003. [Google Scholar]
  27. Roeckner, E.; Brokopf, R.; Esch, M.; Giorgetta, M.; Hagemann, S.; Kornblueh, L.; Manzini, E.; Schlese, U.; Schulzweida, U. Sensitivity of Simulated Climate to Horizontal and Vertical Resolution in the ECHAM5 Atmosphere Model. J. Clim. 2006, 19, 3771–3791. [Google Scholar] [CrossRef]
  28. Muntean, M.; Janssens-Maenhout, G.; Song, S.; Selin, N.E.; Olivier, J.G.; Guizzardi, D.; Maas, R.; Dentener, F. Trend analysis from 1970 to 2008 and model evaluation of EDGARv4 global gridded anthropogenic mercury emissions. Sci. Total Environ. 2014, 494, 337–350. [Google Scholar] [CrossRef] [PubMed]
  29. Streets, D.G.; Zhang, Q.; Wu, Y. Projections of Global Mercury Emissions in 2050. Environ. Sci. Technol. 2009, 43, 2983–2988. [Google Scholar] [CrossRef] [PubMed]
  30. Schulzweida, U. CDO User Guide (Climate Data Operators, Version 1.8.1); Technical Report; Max Planck Institute for Meteorology (MPI-M): Hamburg, Germany, 2017. [Google Scholar]
  31. Selin, N.E.; Jacob, D.J.; Park, R.J.; Yantosca, R.M.; Strode, S.; Jaeglé, L.; Jaffe, D. Chemical cycling and deposition of atmospheric mercury: Global constraints from observations. J. Geophys. Res. 2007, 112, D02308. [Google Scholar] [CrossRef]
  32. Santer, B.D.; Taylor, K.E.; Wigley, T.M.; Penner, J.E.; Jones, P.D.; Cubasch, U. Towards the detection and attribution of an anthropogenic effect on climate. Clim. Dyn. 1995, 12, 77–100. [Google Scholar] [CrossRef]
  33. Santer, B.D.; Taylor, K.E.; Wigley, T.M.L.; Johns, T.C.; Jones, P.D.; Karoly, D.J.; Mitchell, J.F.B.; Oort, A.H.; Penner, J.E.; Ramaswamy, V.; et al. A search for human influences on the thermal structure of the atmosphere. Nature 1996, 382, 39–46. [Google Scholar] [CrossRef]
  34. Emmons, L.K.; Walters, S.; Hess, P.G.; Lamarque, J.F.; Pfister, G.G.; Fillmore, D.; Granier, C.; Guenther, A.; Kinnison, D.; Laepple, T.; et al. Description and evaluation of the Model for Ozone and Related chemical Tracers, version 4 (MOZART-4). Geosci. Model Dev. 2010, 3, 43–67. [Google Scholar] [CrossRef] [Green Version]
  35. Hynes, A.J.; Donohoue, D.L.; Goodsite, M.E.; Hedgecock, I.M. Our current understanding of major chemical and physical processes affecting mercury dynamics in the atmosphere and at the air-water/terrestrial interfaces. In Mercury Fate and Transport in the Global Atmosphere: Emissions, Measurements and Models; Pirrone, N., Mason, R.P., Eds.; Springer: Berlin, Germany, 2009; Chapter 14; pp. 427–457. [Google Scholar]
  36. Gustin, M.S.; Amos, H.M.; Huang, J.; Miller, M.B.; Heidecorn, K. Measuring and modeling mercury in the atmosphere: A critical review. Atmos. Chem. Phys. 2015, 15, 5697–5713. [Google Scholar] [CrossRef]
  37. Ariya, P.A.; Amyot, M.; Dastoor, A.; Deeds, D.; Feinberg, A.; Kos, G.; Poulain, A.; Ryjkov, A.; Semeniuk, K.; Subir, M.; et al. Mercury Physicochemical and Biogeochemical Transformation in the Atmosphere and at Atmospheric Interfaces: A Review and Future Directions. Chem. Rev. 2015, 115, 3760–3802. [Google Scholar] [CrossRef] [PubMed]
  38. Yang, X.; Cox, R.A.; Warwick, N.J.; Pyle, J.A.; Carver, G.D.; O’Connor, F.M.; Savage, N.H. Tropospheric bromine chemistry and its impacts on ozone: A model study. J. Geophys. Res. 2005, 110, 1984–2012. [Google Scholar]
  39. Yang, X.; Pyle, J.A.; Cox, R.A.; Theys, N.; Van Roozendael, M. Snow-sourced bromine and its implications for polar tropospheric ozone. Atmos. Chem. Phys. 2010, 10, 7763–7773. [Google Scholar] [CrossRef]
  40. Wiedinmyer, C.; Akagi, S.K.; Yokelson, R.J.; Emmons, L.K.; Al-Saadi, J.A.; Orlando, J.J.; Soja, A.J. The Fire INventory from NCAR (FINN): A high resolution global model to estimate the emissions from open burning. Geosci. Model Dev. 2011, 4, 625–641. [Google Scholar] [CrossRef]
  41. Friedli, H.R.; Arellano, A.F.; Cinnirella, S.; Pirrone, N. Initial estimates of mercury emissions to the atmosphere from global biomass burning. Environ. Sci. Technol. 2009, 43, 3507–3513. [Google Scholar]
  42. De Simone, F.; Cinnirella, S.; Gencarelli, C.N.; Yang, X.; Hedgecock, I.M.; Pirrone, N. Model study of global mercury deposition from biomass burning. Environ. Sci. Technol. 2015, 49, 6712–6721. [Google Scholar] [CrossRef] [PubMed] [Green Version]
  43. Selin, N.E.; Jacob, D.J.; Yantosca, R.M.; Strode, S.; Jaeglé, L.; Sunderland, E.M. Global 3-D land-ocean-atmosphere model for mercury: Present-day versus preindustrial cycles and anthropogenic enrichment factors for deposition. Glob. Biogeochem. Cycles 2008, 22, GB2011. [Google Scholar]
  44. Seddon, A.W.; Macias-Fauria, M.; Long, P.R.; Benz, D.; Willis, K.J. Sensitivity of global terrestrial ecosystems to climate variability. Nature 2016, 531, 229–232. [Google Scholar] [CrossRef] [PubMed]
  45. Beraldi, P.; Violi, A.; Simone, F.D. A decision support system for strategic asset allocation. Decis. Support Syst. 2011, 51, 549–561. [Google Scholar]
  46. Hall, J.W.; Lempert, R.J.; Keller, K.; Hackbarth, A.; Mijere, C.; McInerney, D.J. Robust Climate Policies Under Uncertainty: A Comparison of Robust Decision Making and Info-Gap Methods. Risk Anal. 2012, 32, 1657–1672. [Google Scholar] [CrossRef] [PubMed]
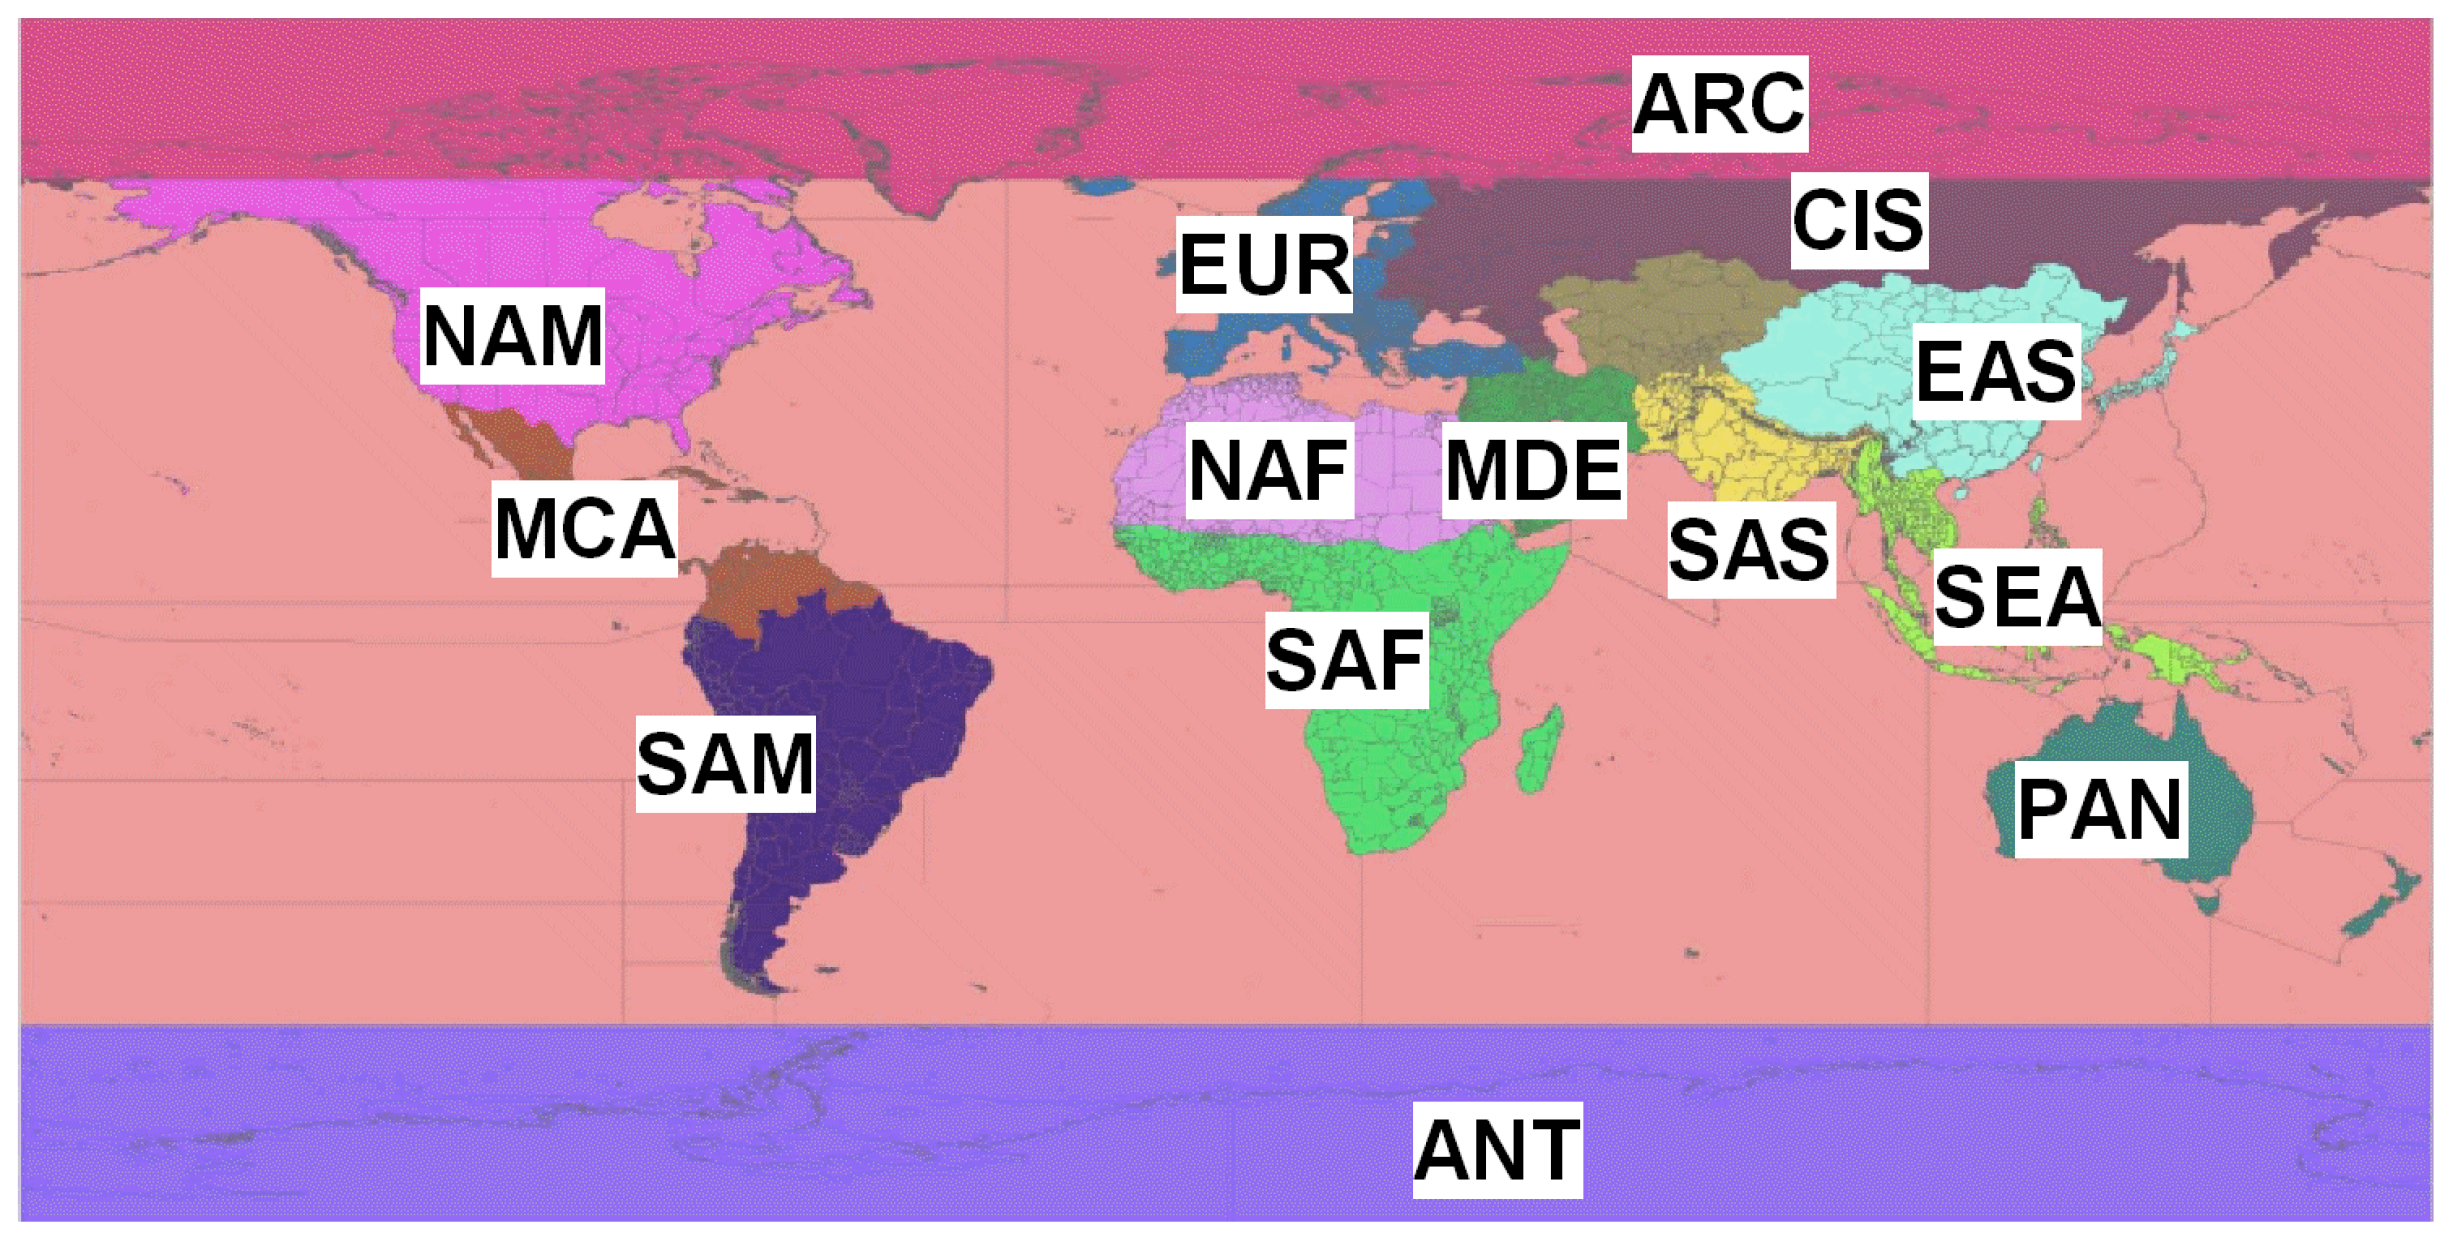
Figure 1. Definition of the source regions used in this study. NAM (US and Canada), EUR (Europe and Turkey), SAS (South Asia), EAS (East Asia), SEA (South East Asia), PAN (Australia and New Zealand), NAF (Northern Africa), SAF (Sub Saharan Africa), MDE (Middle East), MCA (Middle and Central America), SAM (South America), CIS (Russia and Central Asia), ARC (Arctic Circle above 66 N), and ANT (Antarctic below 60 S), as in AMAP/UNEP [10].
Atmosphere 08 00236 g001
Figure 2. Normalised confidence interval amplitudes for the mean (NCIAM) of the total Hganthr deposition due to each of the source regions. Amplitudes were normalised by the mean value in each model cell, therefore values greater than 100% correspond to a total uncertainty larger than the mean value itself. Both mean and CI (at the 95% level) were calculated using the bootstrap method [23], starting from the ensemble of simulations reported in Table 1. The results clearly show how the uncertainty on the deposition due to Hganthr emissions from SAS (South Asia). Uncertainty south of 60 S is due to the very different results from the O3/OH and Br simulations, see Section 3).
Atmosphere 08 00236 g002
Figure 3. Normalised confidence interval amplitudes of the mean (NCIAM) Hganthr annual deposition due to (a) Domestic emissions and (b) Remote emissions. Larger NCIAM values correspond to larger uncertainty in the estimates of the mean. Amplitudes were normalised to the mean value in each model cell, therefore values greater than 100% correspond to a total uncertainty larger than the mean value itself. Both mean and CI (at 95%) were calculated using the bootstrap method [23], starting from the ensemble of simulations reported in Table 1. The uncertainty in the Hganthr deposition flux due to domestic emissions is greater than for remote emissions for almost all regions.
Atmosphere 08 00236 g003
Figure 4. Source-Receptor matrices, in the form of heat-maps, showing, (a,b), the normalised confidence interval amplitudes for the mean (NCIAM) of the Hg total deposition; (c) the comparison between the local and each remote source region contributions (95% CI) and (d) the remote source contributors that are statistically indistinguishable (95% CI), in order of importance. In (d) source contributions that are statistically indistinguishable (at 95% CI) share the same colour. In (a,b) two columns are detached depicting the uncertainty due to the local contribution (i.e., the main diagonal of the SR Matrix) and the overall remote contribution, respectively. Both mean and CI (at 95%) were calculated using the bootstrap method [23] starting from the ensemble of simulations reported in Table 1. Panels (a) and (b) show visually the information in Table 2, highlighting the greater uncertainty in Hganthr deposition from SAS (South Asia), SEA (South East Asia), NAM (North America), Southern (SAF) and Northern Africa (NAF), and also the Arctic (ARC).
Atmosphere 08 00236 g004
Table 1. The simulations performed. Each simulation of the list represent a reasonable variation of a process or parametrisation regarding the atmospheric cycle of Hg, including inventory, injection height, and speciation of emissions, as well as oxidation mechanism for the nominal year 2010. A check mark in the last column indicates those simulations which were used in the uncertainty analysis. The resulting ensemble represents a reasonable range of the uncertainties in Hg processes and parametrisations, and was used as input to the statistical model.
RunInventoryInv. YearMeteo. YearSpeciationVertical profileOxidationInclusion
BASEAMAP-201020102010NativeNativeO3/OH
BASE-2005AMAP-201020102005NativeNativeO3/OH
BASE-1998AMAP-201020101998NativeNativeO3/OH
APBLAMAP-201020102010NativeUniform PBLO3/OH
NSP0AMAP-201020102010as Hg ( g ) 0 NativeO3/OH
NSP50AMAP-20102010201050:50 Hg ( g ) 0 : Hg II ( g ) NativeO3/OH
BRTOAMAP-201020102010NativeNativeBromine
GPBLSTREETS20052010NativeUniform PBLO3/OH
EDGAEDGAR-200820082010NativeNative-SNAPO3/OH
Table 2. Source-receptor Hg deposition uncertainty matrix. For each receptor (rows), the mean (and the relative confidence interval at the 95% level) of the Hganthr total deposition (Mg/year). The final “All Source” column reports the uncertainty in the total deposition due to all emissions sources, highlighting how the uncertainty in Hganthr deposition due to domestic emissions is much greater than that for remote sources for almost all source regions.
NAMEURSASEASSEAPANNAFSAFMDEMCASAMCISARCREMOTEALL-Sources
Deposition to Lands
NAM17.14.73.929.33.20.31.75.30.74.13.24.70.361.7383.7
(13.2–21.5)(4.2–5.6)(2.2–5.2)(26.5–33.5)(2.2–4.0)(0.2–0.3)(1.1–2.1)(3.3–6.8)(0.6–0.8)(3.4–4.6)(2.2–3.8)(4.2–5.0)(0.2–0.4)(54.0–66.9)(369.5–398.9)
EUR1.418.41.180.90.10.61.50.310.92.30.118.1129.2
(1.0–1.9)(14.0–23.1)(0.6–1.4)(7.3–8.9)(0.6–1.1)(0.1–0.1)(0.5–0.7)(0.9–1.9)(0.2–0.3)(0.8–1.1)(0.6–1.1)(2.0–2.8)(0.1–0.1)(16.1–19.4)(118.8–140.4)
SAS0.81.318.27.91.30.10.62.10.51.21.31.40.118.8150.4
(0.6–1.0)(1.2–1.5)(10.7–25.3)(7.2–8.8)(0.9–1.6)(0.1–0.1)(0.4–0.8)(1.4–2.7)(0.4–0.5)(1.0–1.4)(1.0–1.6)(1.3–1.5)(0.0–0.1)(16.6–20.4)(138.7–161.9)
EAS2.64.57.2104.14.50.31.65.30.83.23.25.50.239445.0
(2.0–3.4)(4.0–5.5)(4.2–9.5)(82.9–134.5)(3.7–5.1)(0.2–0.3)(1.1–2.0)(3.3–6.7)(0.7–0.9)(2.5–3.7)(2.3–3.9)(5.0–6.1)(0.2–0.3)(32.3–44.0)(399.8–499.9)
SEA0.60.92.67.53.50.20.52.10.21.21.40.90.118.2118.4
(0.4–0.7)(0.8–1.1)(1.5–3.4)(6.6–8.6)(2.9–4.1)(0.1–0.2)(0.4–0.7)(1.4–2.7)(0.2–0.2)(0.9–1.4)(1.1–1.7)(0.7–1.0)(0.0–0.1)(15.4–20.4)(103.2–127.9)
PAN0.30.50.73.61.12.10.42.60.1120.5012.9111.8
(0.3–0.4)(0.5–0.6)(0.4–0.9)(3.3–3.9)(0.7–1.4)(1.6–2.6)(0.3–0.6)(1.8–3.3)(0.1–0.1)(0.8–1.2)(1.5–2.4)(0.4–0.6)(0.0–0.0)(10.4–15.1)(107.0–115.4)
NAF25.52.314.81.80.22.33.60.621.92.50.137.5231.8
(1.5–2.7)(4.5–7.2)(1.3–3.0)(13.5–16.3)(1.3–2.3)(0.1–0.2)(1.8–2.7)(2.3–4.6)(0.5–0.7)(1.6–2.3)(1.4–2.3)(2.3–2.6)(0.1–0.2)(33.7–39.7)(218.2–242.8)
SAF2.13.84.822.14.50.62.722.90.94.36.53.20.255.8456.5
(1.7–2.8)(3.3–4.3)(2.7–6.4)(19.9–24.3)(3.1–5.6)(0.6–0.7)(1.9–3.3)(17.2–27.9)(0.–1.0)(3.4–5.0)(4.8–7.7)(2.7–3.6)(0.1–0.2)(48.4–61.9)(417.5–486.5)
MDE0.71.61.15.90.80.10.51.41.70.80.81.10.114.995.0
(0.5–0.9)(1.4–2.0)(0.6–1.4)(5.4–6.5)(0.5–1.0)(0.1–0.1)(0.4–0.6)(0.9–1.8)(1.3–2.2)(0.7–1.0)(0.6–1.0)(1.0–1.2)(0.0–0.1)(13.2–16.0)(91.0–98.5)
MCA1.11.21.27.51.10.10.72.30.23.31.31.10.117.9124.2
(0.8–1.4)(1.0–1.4)(0.7–1.6)(6.7–8.3)(0.7–1.3)(0.1–0.1)(0.4–0.8)(1.5–3.0)(0.2–0.2)(2.7–4.1)(1.0–1.6)(0.9–1.2)(0.0–0.1)(15.5–19.7)(112.1–132.6)
SAM1.52.53.116.23.60.729.30.54.112.32.30.146386.6
(1.2–2.0)(2.2–2.9)(1.7–4.1)(14.4–17.9)(2.5–4.5)(0.6–0.7)(1.3–2.6)(6.1–11.7)(0.4–0.6)(3.3–4.7)(10.5–13.6)(1.9–2.6)(0.1–0.2)(38.4–52.6)(349.7–411.8)
CIS3.610.13.227.22.70.21.54.40.82.92.619.50.660355.6
(2.7–4.9)(8.1–13.4)(1.8–4.3)(24.2–31.7)(1.9–3.4)(0.2–0.3)(1.0–1.9)(2.7–5.6)(0.6–0.9)(2.3–3.4)(1.9–3.2)(15.7–23.1)(0.5–0.7)(53.6–66.2)(333.4–380.3)
ARC2.23.91.814.91.50.10.82.50.41.61.53.70.935.1154.0
(1.6–3.0)(3.3–5.0)(1.0–2.4)(13.5–16.9)(1.1–1.9)(0.1–0.1)(0.6–1.0)(1.5–3.1)(0.3–0.4)(1.3–1.9)(1.1–1.8)(3.3–4.3)(0.6–1.1)(31.9–37.8)(144.3–168.1)
ANT0.10.20.31.40.40.20.21.100.410.205.552.4
(0.1–0.2)(0.1– 0.3)(0.1–0.5)(1.0–2.1)(0.2–0.8)(0.1–0.2)(0.1–0.4)(0.6–2.0)(0.0–0.1)(0.2–0.7)(0.5–1.6)(0.1–0.3)(0.0–0.0)(3.3–9.2)(36.5–82.7)
Deposition to Basins
MED0.43.20.42.60.300.40.50.10.30.30.609.241.9;
(0.3–0.6)(2.4–4.3)(0.2–0.5)(2.3–3.0)(0.2–0.4)(0.0–0.0)(0.3–0.5)(0.3–0.7)(0.1–0.2)(0.3–0.4)(0.2–0.4)(0.5–0.7)(0.0–0.0)(8.0–10.5)(38.2–45.9)
NATL14.5138.960.97.70.84.615.41.698.79.40.6155.8843.6
(10.3–20.8)(11.5–15.7)(5.0–11.9)(55.4–67.9)(5.3–9.5)(0.6–0.9)(3.2–5.6)(9.6–19.4)(1.3–1.8)(7.3–10.3)(6.2–10.4)(8.5–10.1)(0.5–0.8)(140.2–165.2)(814.6–865.3)
SATL2.54.15.427.77.323.619.80.97.316.33.90.3101.1760.3
(2.0–3.2)(3.7–4.6)(3.0–7.2)(25.2–29.7)(5.0–9.2)(1.9–2.1)(2.3–4.6)(13.2–24.5)(0.7–1.0)(5.7–8.7)(13.3–18.7)(3.3–4.4)(0.2–0.3)(83.5–115.4)(725.3–790.1)
NPAC16.726.626.9200.424.22.311.539.94.426.425.926.51.6436.32400.8
(13.1–22.3)(23.4–31.7)(15.0–35.7)(179.5–237.0)(17.0–29.8)(1.9–2.5)(7.8–14.5)(24.6–50.7)(3.6–5.1)(21.3–30.0)(18.5–31.1)(24.3–28.5)(1.1–2.0)(388.8–467.0)(2309.8–2471.7)
SPAC6.610.713.172.219.56.68.343.82.220.836.210.10.7251.41869.1
(5.3–8.4)(9.5–12.1)(7.3–17.7)(65.5–78.6)(13.2–24.2)(6.2–7.3)(5.3–10.6)(28.5–54.3)(1.7–2.5)(16.6–24.0)(26.8–42.7)(8.5–11.6)(0.5–0.9)(208.1–285.2)(1786.3–1945.5)
IND4.57.416.551.914.12.75.431.61.811.620.47.10.51761208.0
(3.7–5.8)(6.6–8.4)(9.3–21.8)(47.1–56.5)(9.9–17.3)(2.5–2.8)(3.5–6.9)(22.5–38.4)(1.5–2.1)(9.2–13.5)(14.9–24.1)(6.0–8.1)(0.3–0.6)(145.3–199.2)(1156.5–1254.8)
SOC0.30.40.630.90.30.42.30.10.920.4011.588.2
(0.2–0.3)(0.4–0.5)(0.3–0.9)(2.5–3.7)(0.6–1.3)(0.3–0.4)(0.2–0.6)(1.5–3.3)(0.1–0.1)(0.6–1.2)(1.4–2.7)(0.3–0.5)(0.0–0.0)(8.6–15.7)(70.6–120.7)