Article

Impact of Madden–Julian Oscillation upon Winter Extreme Rainfall in Southern China: Observations and Predictability in CFSv2

1
Laboratory for Climate Studies, & CMA-NJU Joint Laboratory for Climate Prediction Studies, National Climate Center, China Meteorological Administration, Beijing 100081, China
2
Chinese Academy of Meteorological Sciences, Beijing 100081, China
3
Department of Atmospheric Science, School of Environment Studies, China University of Geoscience, Wuhan 430074, China
*
Author to whom correspondence should be addressed.
Atmosphere 2017, 8(10), 192; https://doi.org/10.3390/atmos8100192
Submission received: 31 August 2017 / Revised: 25 September 2017 / Accepted: 27 September 2017 / Published: 30 September 2017
(This article belongs to the Special Issue Madden-Julian Oscillation)

Abstract

:
The impact of Madden–Julian oscillation (MJO) upon extreme rainfall in southern China was studied using the Real-time Multivariate MJO (RMM) index and daily precipitation data from high-resolution stations in China. The probability-distribution function (PDF) of November–March rainfall in southern China was found to be skewed toward larger (smaller) values in phases 2–3 (6–7) of MJO, during which the probability of extreme rainfall events increased (reduced) by 30–50% (20–40%) relative to all days in the same season. Physical analysis indicated that the favorable conditions for generating extreme rainfall are associated with southwesterly moisture convergence and vertical moisture advection over southern China, while the direct contributions from horizontal moisture advection are insignificant. Based on the above results, the model-based predictability for extreme rainfall in winter was examined using hindcasts from the Climate Forecast System version 2 (CFSv2) of NOAA. It is shown that the modulations of MJO on extreme rainfall are captured and forecasted well by CFSv2, despite the existence of a relatively small bias. This study suggests the feasibility of deriving probabilistic forecasts of extreme rainfall in southern China based on RMM indices.

1. Introduction

Extreme weather and climate events are typically responsible for the major environmental disasters in China. These phenomena include droughts, flooding, typhoons, heat and cold waves and generally lead to catastrophic losses of property, agriculture, and human life. According to statistics [1], droughts, snow storms, cold waves, and dust storms occur frequently in northern China, whereas the southern portion of China is seriously affected by rain storms, typhoons, heat waves, and flooding. The largest threat to southern China is heavy rainfall, as this area is more vulnerable to flooding [2,3,4,5]. For example, in early 2008, more than 100 million people were affected by the extreme cold, snow and frozen rain that occurred in southern China and more than 120 people died due to the disaster [3]. Due to the high vulnerability of this region to extreme rainfall, improving prediction of such events is very important for providing improved meteorological services over an extended-range (10–30 days) timescale [6].
The Madden–Julian oscillation (MJO) is one of the primary modes of intraseasonal variability in the tropics [7,8]. The primary features of the MJO have been well documented in many studies [9,10,11,12,13]. For example, the MJO is characterized by a zonal planetary scale dominated by wavenumber 1, where eastward propagation occurs at a rate of about 5 m/s. The global period of MJO’s propagation is approximately 30–60 days. The MJO is characterized by a large amplitude during boreal winter compared with boreal summer. Previous studies have determined that the MJO directly impacts weather in the tropics by modulating tropical cyclone activities [14,15] and rainfall [16]. The impact of MJO is not only confined to the tropics, but also extends into subtropics and mid-to-high latitudes. For example, the precipitation over Southwest Asia, the Americas, and Australia is strongly modulated by the MJO [17,18,19,20].
China, which is mainly located in subtropical and mid-latitudes, is subject to the impacts of MJO, as has been revealed in previous studies. Zhang et al. [21,22], using the Real-time Multivariate MJO (RMM) index [23], showed that summer rainfall in southeastern China clearly decreases as the MJO propagates eastward from the equatorial Indian Ocean to the western Pacific. Similarly, winter rainfall in the Yangtze River basin and southern China also varies with the passage of the MJO-related convection center. Liu and Yang [24] showed that winter rainfall in eastern China anomalously migrates from the Yangtze River valley towards southern China with the eastward propagation of the MJO. Yuan and Yang [25] and Jia et al. [26], also showed similar results, namely that rainfall is significantly enhanced during phases 2 and 3 of the MJO in the Yangtze River basin and South China, but is significantly reduced during phases 6 and 7. Further, Ren and Shen [27], using new observational data, discovered that the impact of the MJO upon rainfall is limited in southern China during the winter, but extends to southern regions and the Tibetan Plateau during the summer, where it is interesting to note that its impact shows a 1–5-day delay. Although knowledge of the MJO’s impact upon rainfall variation in China has progressed remarkably, few people pay attention to the impact of MJO upon extreme rainfall in China, which could be more meaningful [28,29]. Therefore, one main goal of this study is to investigate the impact of MJO upon the probability of extreme rainfall events in southern China during the wintertime.
MJO, as an important influence factor influencing weather variation, can directly link weather forecasting with seasonal predictions and can be used as a major precursor for extended-range forecasting [30]. The predictability of weather forecasts is well-known to be limited to within 2–3 weeks, after which most of the memory of the initial atmospheric values has been lost [31,32,33,34,35,36]. In contrast, for the seasonal prediction, the predictability primarily comes from the boundary conditions of the atmosphere including external dynamic and thermodynamic processes [37]. For the seamless subseasonal-to-seasonal (S2S) prediction, however, both the initial value and boundary conditions need to be taken into consideration. Nowadays, the gap between the weather forecasting and seasonal prediction has gained increasing attention because of large demand from society for longer-term weather forecasting [38]. In the past decade, there has been a significant improvement in MJO prediction skill, with more advanced fully-coupled dynamical climate models involved [39,40,41,42,43,44,45,46]. Until now, models incorporating the RMM index into their predictions have usually been able to forecast more than 20 days in advance, during which the time correlations between predictions and observations are no less than 0.5.
Skillful MJO prediction offers the possibility of probabilistic prediction of extreme rainfall in southern China where MJO has a significant impact. Xavier et al. [28] presented one method to evaluate the predictability of extreme-rainfall probability in Southeast Asia based on hindcasts from the operational GloSea5 forecasting system in the Met Office’s Hadley Center. The results demonstrate that during the passage of MJO, it is feasible to derive probabilistic information about extreme-rainfall events at medium range. In this study, we have also worked to explore the performance of one state-of-the-art operational forecasting model system (CFSv2) for forecasting the relationship between the MJO and extreme rainfall, with the aims of examining predictability of the extended-range probability of extreme rainfall events in southern China.
The remainder of this paper is organized as follows: The data and methodology are given in Section 2; Section 3 presents the influence of MJO upon wintertime extreme rainfall in southern China; furthermore, the physical basis for modulation of MJO on precipitation extremes is briefly analyzed in order to illustrate a potential indicator of extreme events; then, evaluations of CFSv2’ ability to forecast the relationship between the MJO and extreme rainfall is presented in Section 4; and summary and discussion are presented in Section 5.

2. Data and Methods

2.1. Observational Data

The observational data used in this study includes: (1) daily rainfall data from 2400 stations in China covering the period from 1 January 1981 to 31 December 2013, as collected and compiled by the National Meteorological Information Center of the China Meteorological Administration (CMA); (2) NCEP-NCAR daily reanalysis data [47], including wind, vertical velocity and specific humidity covering the same period as the rainfall data; and (3) the RMM index developed by Wheeler and Hendon [4], as download from the website of the Australia Meteorological Bureau (http://www.bom.gov.au/climate/mjo/).

2.2. Forecast Data

Our analysis is based on the hindcasts from CFSv2 [48]. Seo et al. [39] evaluated the MJO forecasts from the National Centers for Environmental Prediction (NCEP) Climate Forecast System (CFS), and showed that the model could successfully predict MJO behavior about 15 days in advance. Wang et al. [41] further assessed the MJO-prediction skill of CFS version 2 (CFSv2) and found that it could be extended to 20 days. Fu et al. [40] showed that, during the period of the cooperative Indian Ocean Experiment on Intraseasonal Variability in the Year 2011 (CINDY2011)/Dynamics of the MJO (DYNAMO), MJO-mode forecasting could be performed 13, 25, and 28 days in advance by the Global Forecast System (GFS) atmosphere-only model, the CFSv2, and the hybrid coupled general circulation model of the University of Hawaii, respectively. The hindcasts used in this study were initialized from the Climate Forecast System Reanalysis (CFSR) [49]. Due to data availability, we analyzed the CFSv2 45-day hindcasts initialized daily from 1 January 1999 to 31 December 2010. For each initial day, four forecasts were made every six hours at 00Z, 06Z, 12Z, and 18Z, forming a daily four-member ensemble mean.

2.3. Methods

The main methods used in this study are referred to by Xavier et al. [28]. The eight phases and amplitude of the MJO were defined by the RMM index during 1981–2013. Zhang and Dong [50] showed that boreal winter (December–March) is the primary peak season for MJO. Xavier et al. [28] chose November–March as the winter season and showed that the rainfall was increased (decreased) over Southeast Asia during the convectively active (suppressed) phases of MJO. Adopting a similar approach, wintertime in this paper is defined as the period from 1 November to 31 March. MJO composites are constructed for MJO phases 1–8 with normalized MJO amplitude greater than 1. Moreover, based on percentile-based threshold method [51], an extreme event was defined by a daily rainfall amount greater than the 90th (95th) percentile of the rainy days in the winters of 1981–2013, which is referred to as the 90th (95th) extremes.

3. Impact of MJO upon Extreme Rainfall

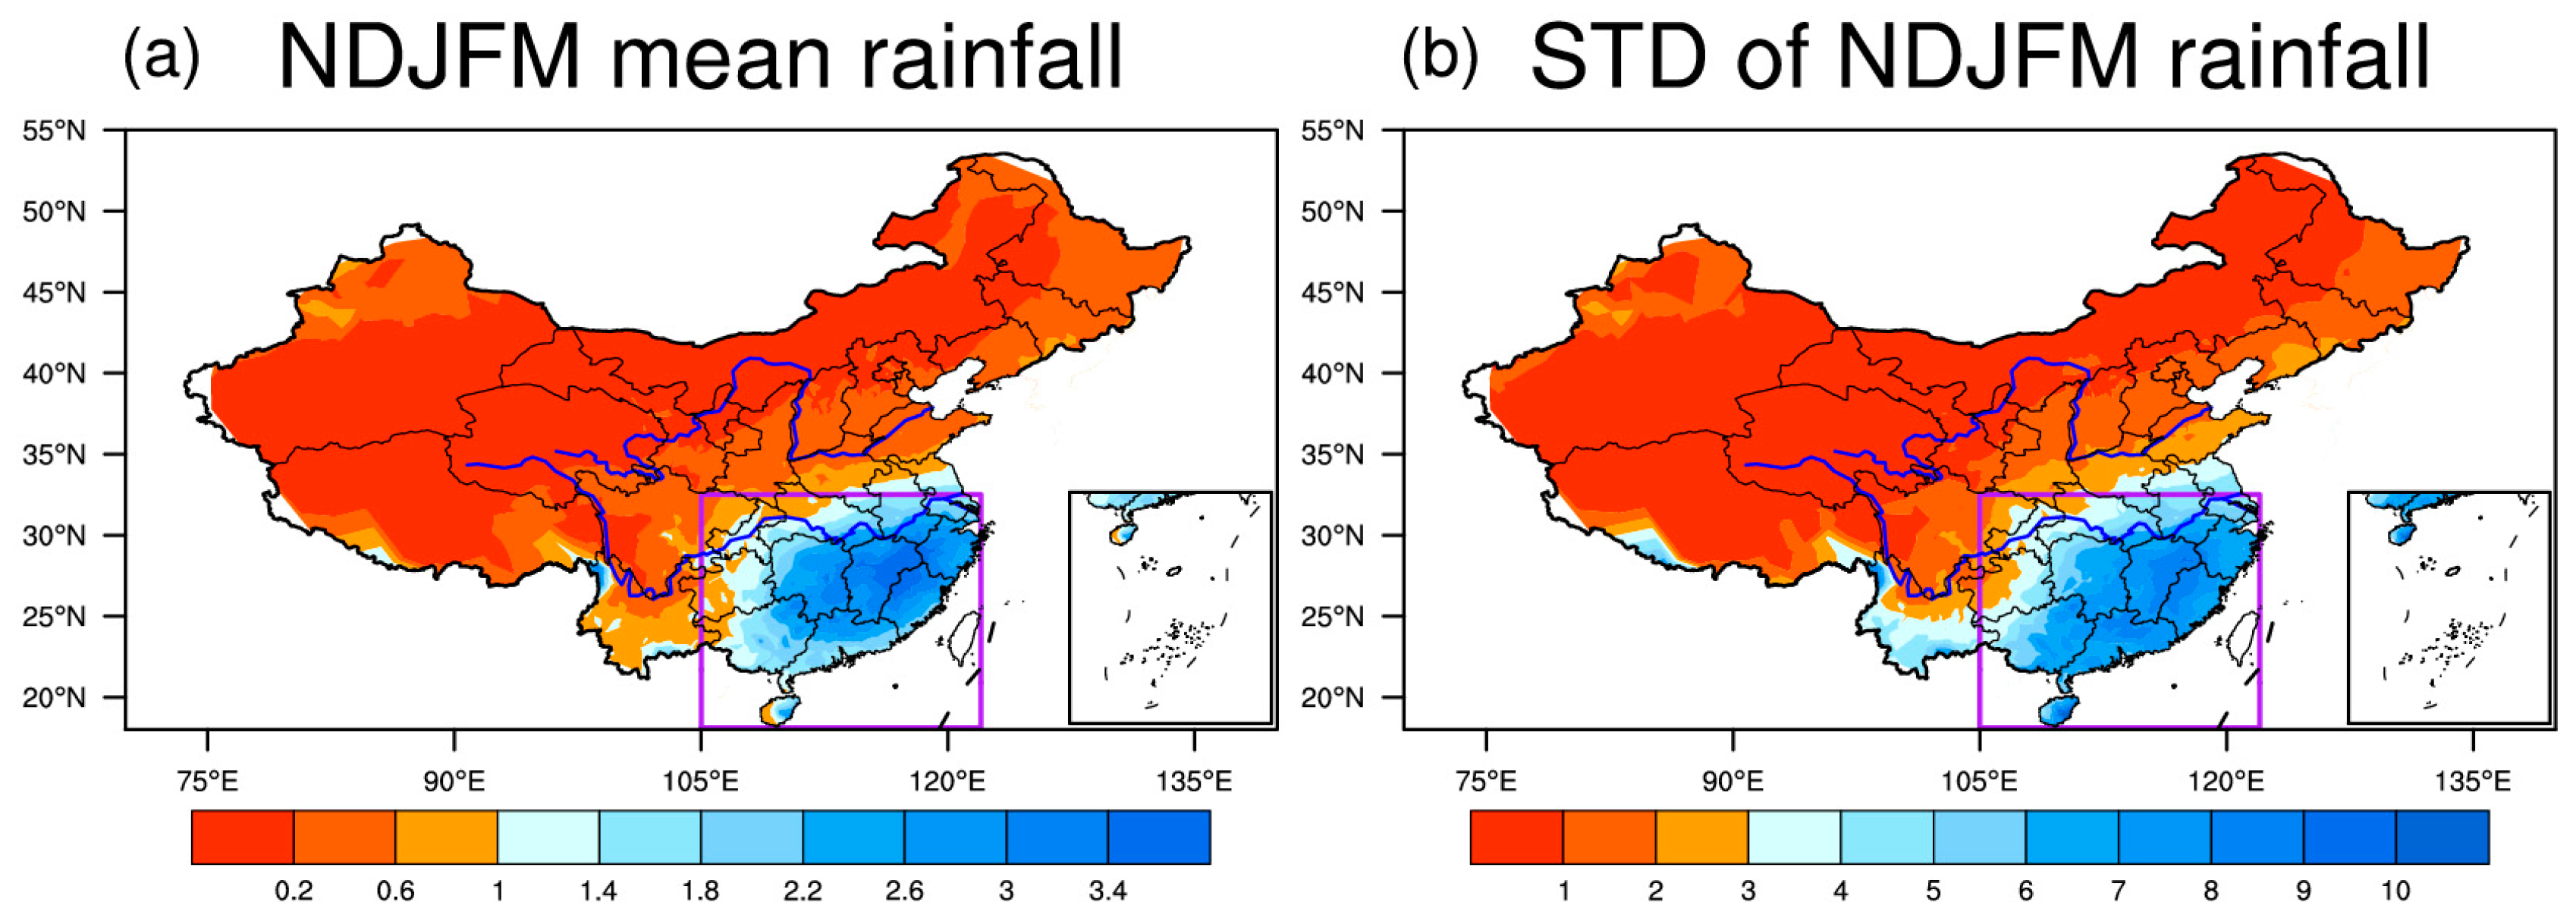
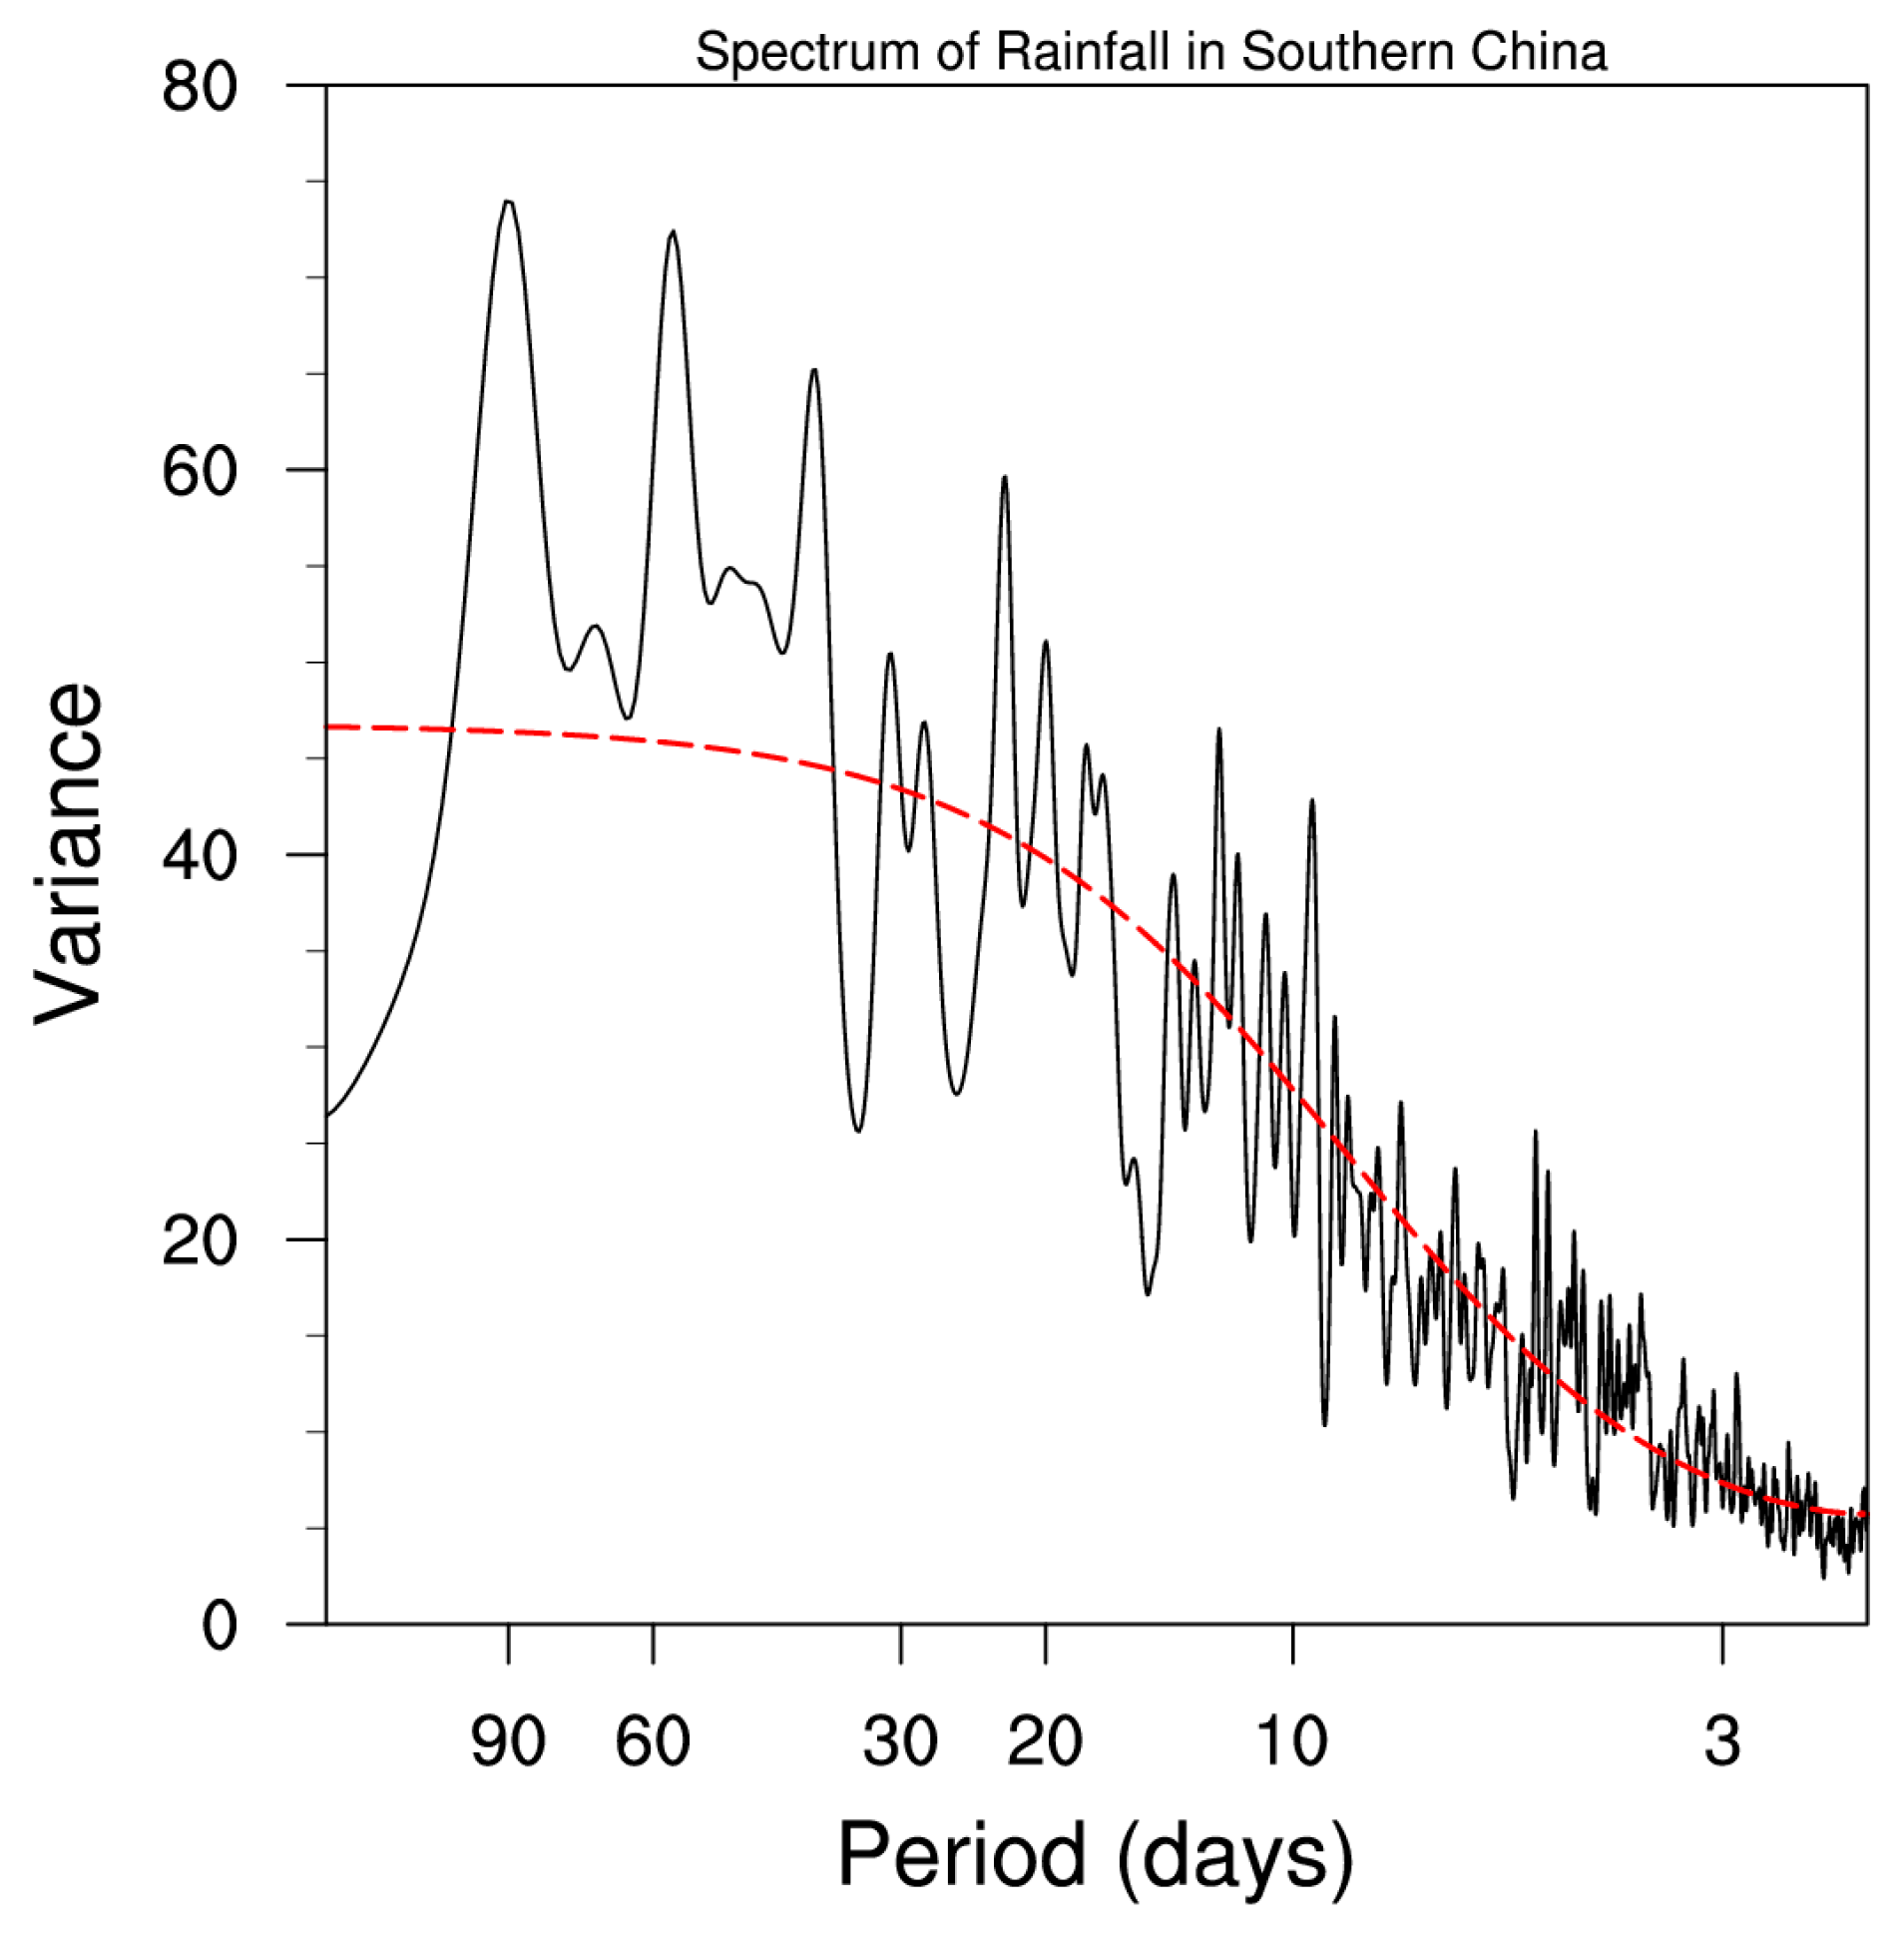
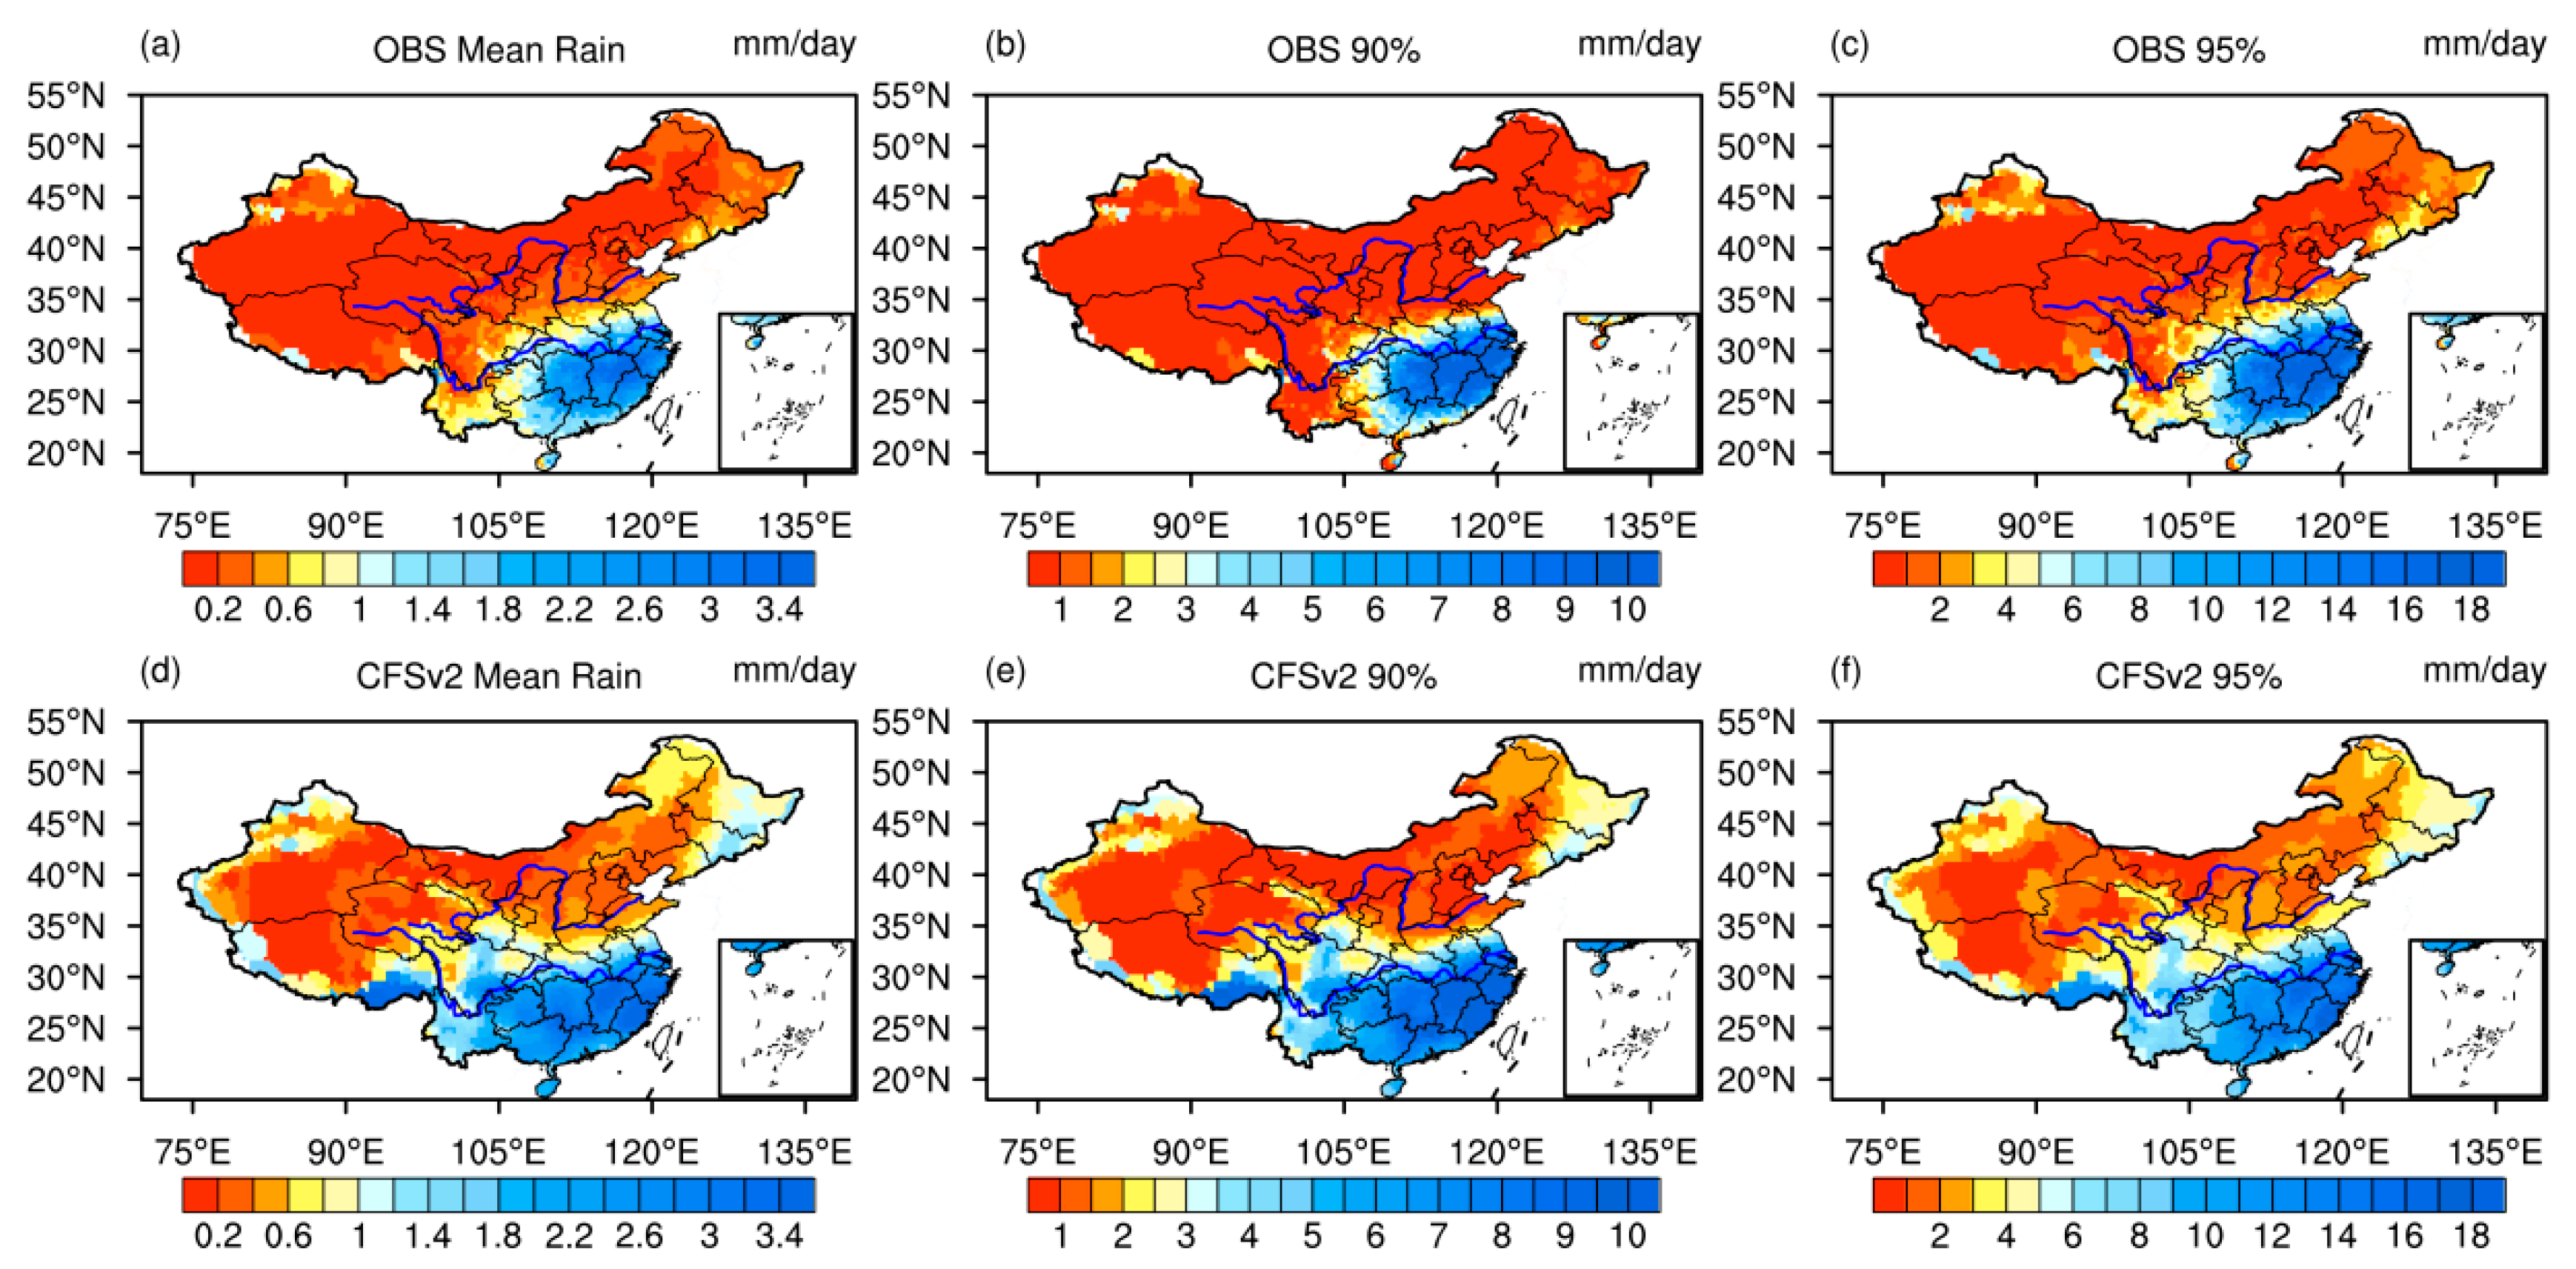
3.1. Rainfall Variability in China during the Winter

November-to-March (hereafter NDJFM) is not only the dominant season for the East Asian winter monsoon, but is also the active season for MJO with a stronger amplitude and more eastward-propagating events compared than other seasons [10,50]. Figure 1 shows the climatological mean and standard deviation of rainfall for the NDJFM season based on 2400 stations. Overall, the distributions of the mean rainfall and standard deviation are consistent, showing a decreasing trend from the southeastern to northwestern China. Daily rainfall is greater than 1 mm/day in southern China (18° N–32.5° N, 105° E–122° E, box in the Figure 1) and less than 1 mm/day over the northern and western China. Similarly, the standard deviation of rainfall is greater than 3 mm/day in southern China but less than 3 mm/day over other regions. This indicates that winter-rainfall variability in southern China is much stronger than that in the northwestern China.
Given that the rainfall variability is comparatively vigorous in southern China, the rainfall variations over this region will be focused on in this paper.
The fast Fourier transformation (FFT) is applied to the time series of rainfall averaged over southern China for spectrum analysis to identify the dominant period. Prior to spectrum analysis, the annual cycle is removed from the data by subtracting the climatological mean, linear trend, and seasonal cycle (the first three harmonics) at each station point, which were calculated during 1981–2013. The results of spectral analysis, as presented in Figure 2, show two substantial peaks at intraseasonal (10–90 days) and synoptic (<10 days) scales, which are substantially larger than the spectral level of red noise, suggesting that the major rainfall in southern China during wintertime is closely associated with not only the synoptic-scale disturbance, but also with the MJO activity.

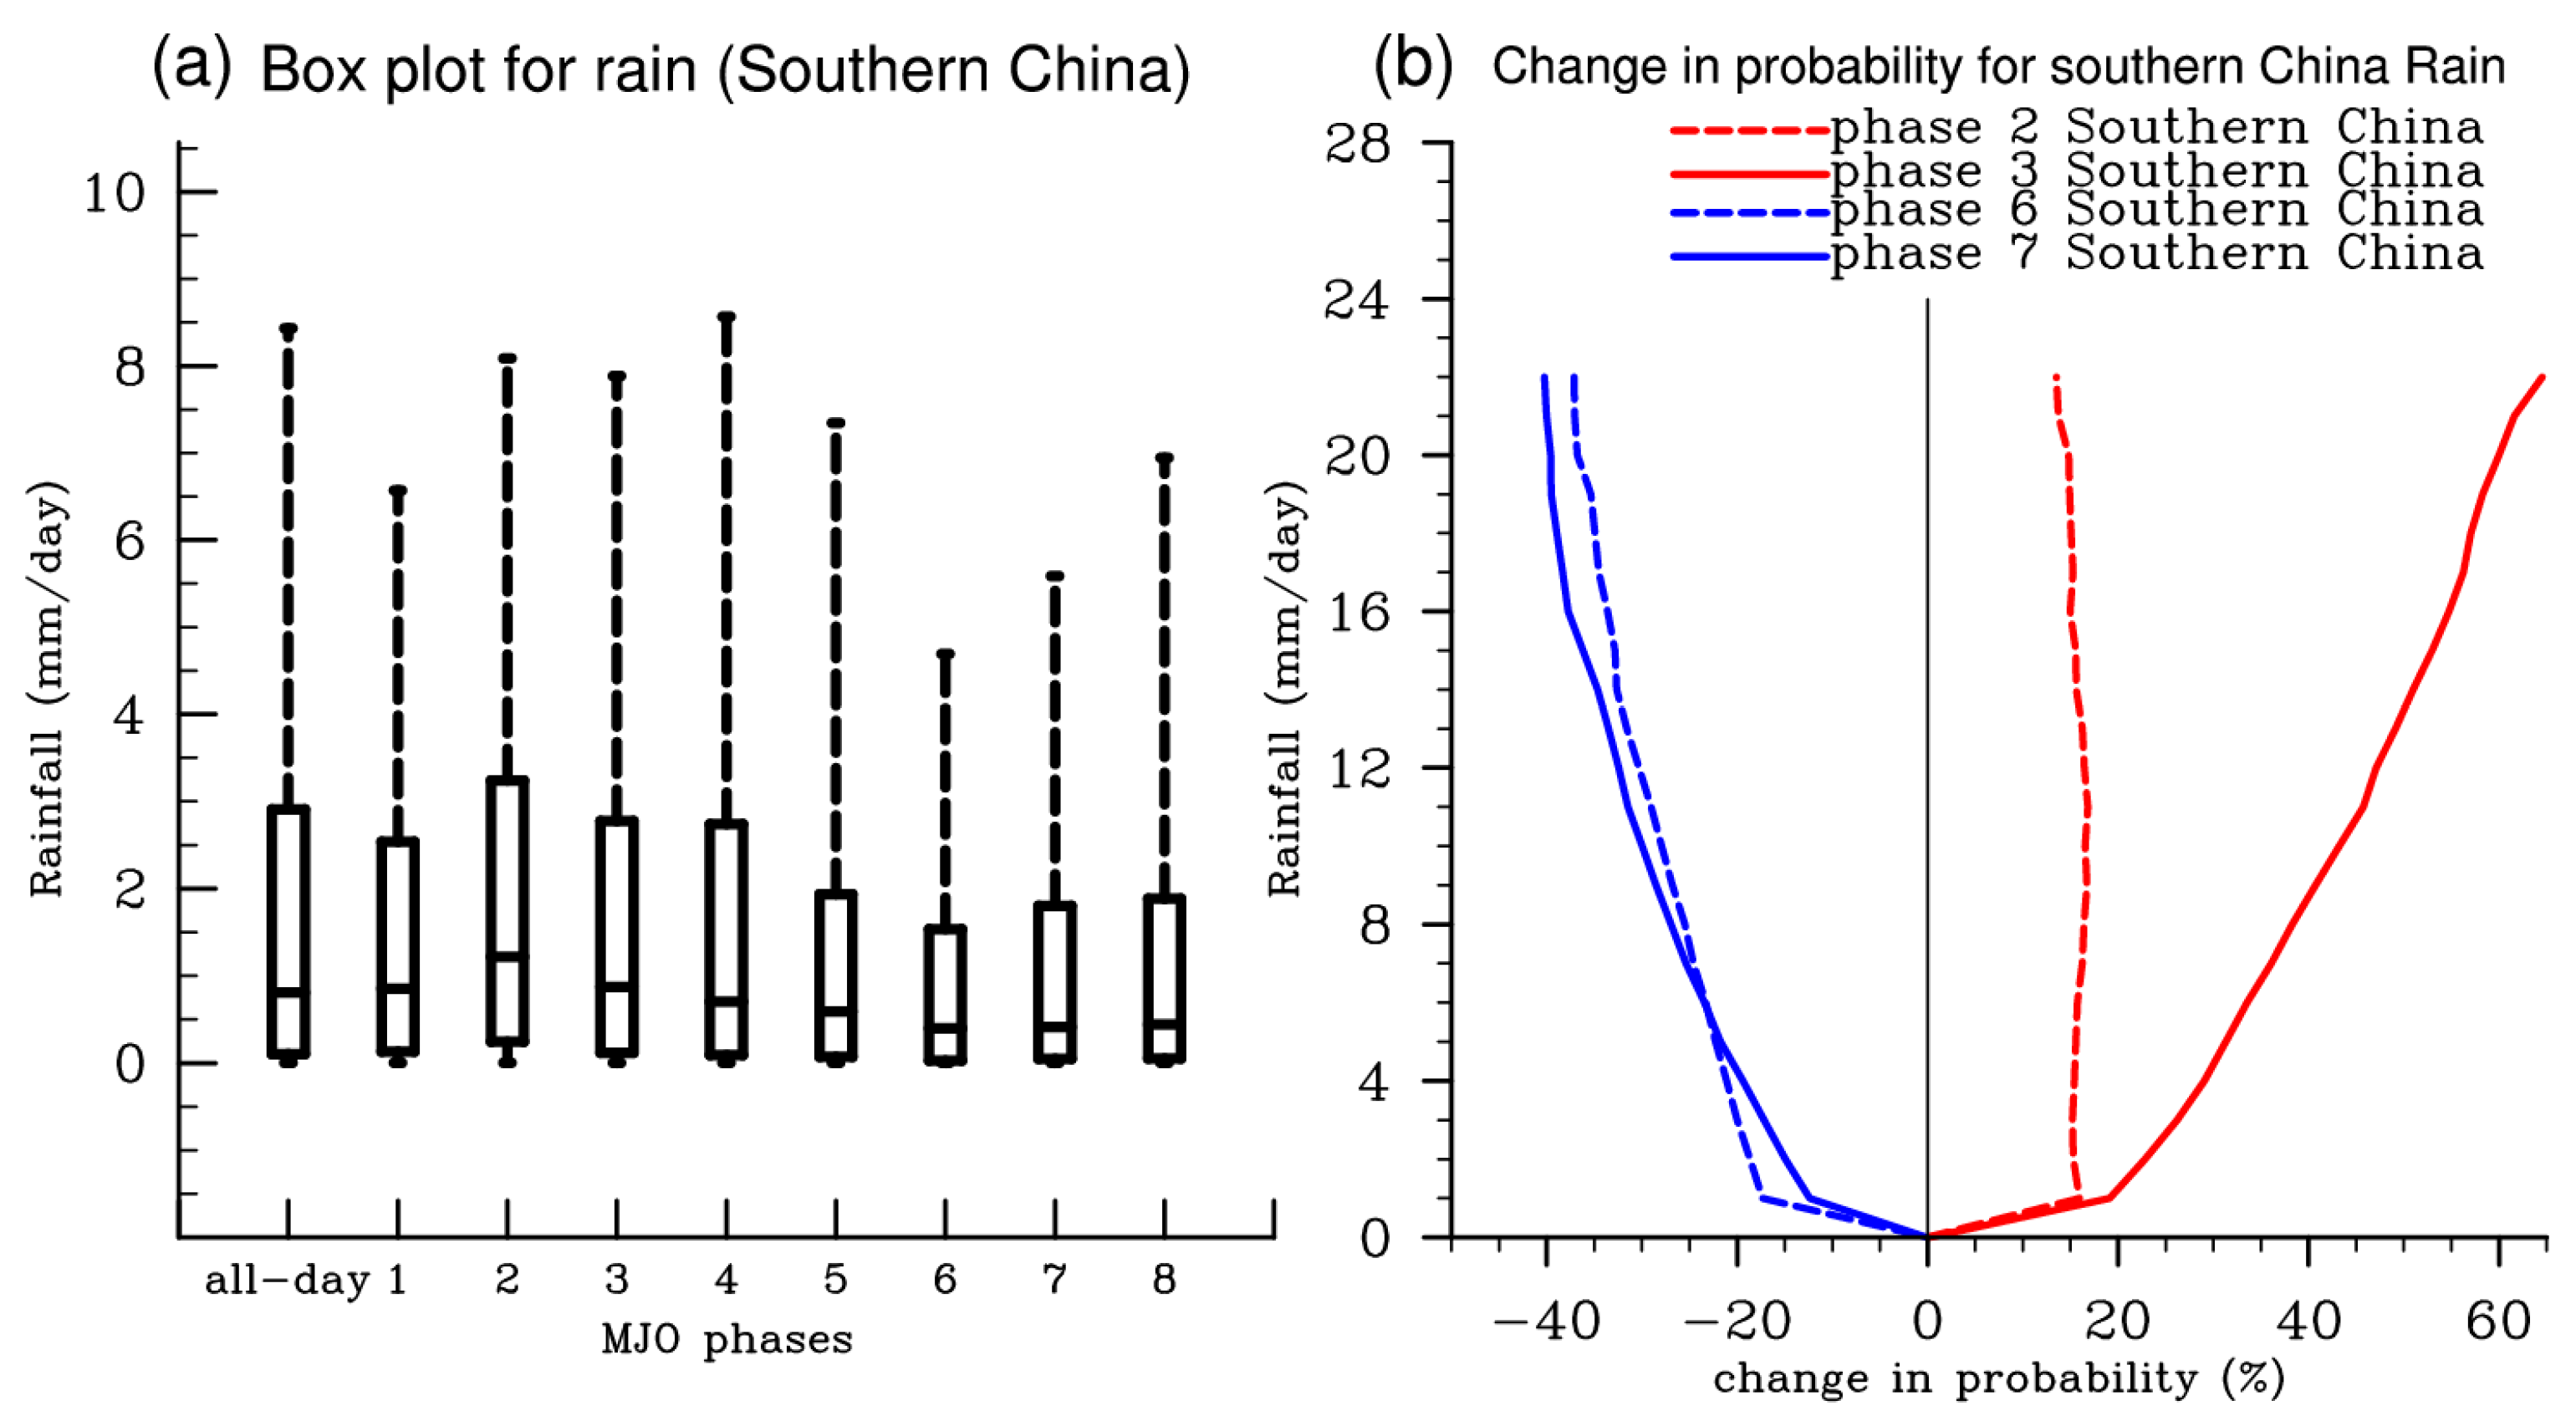
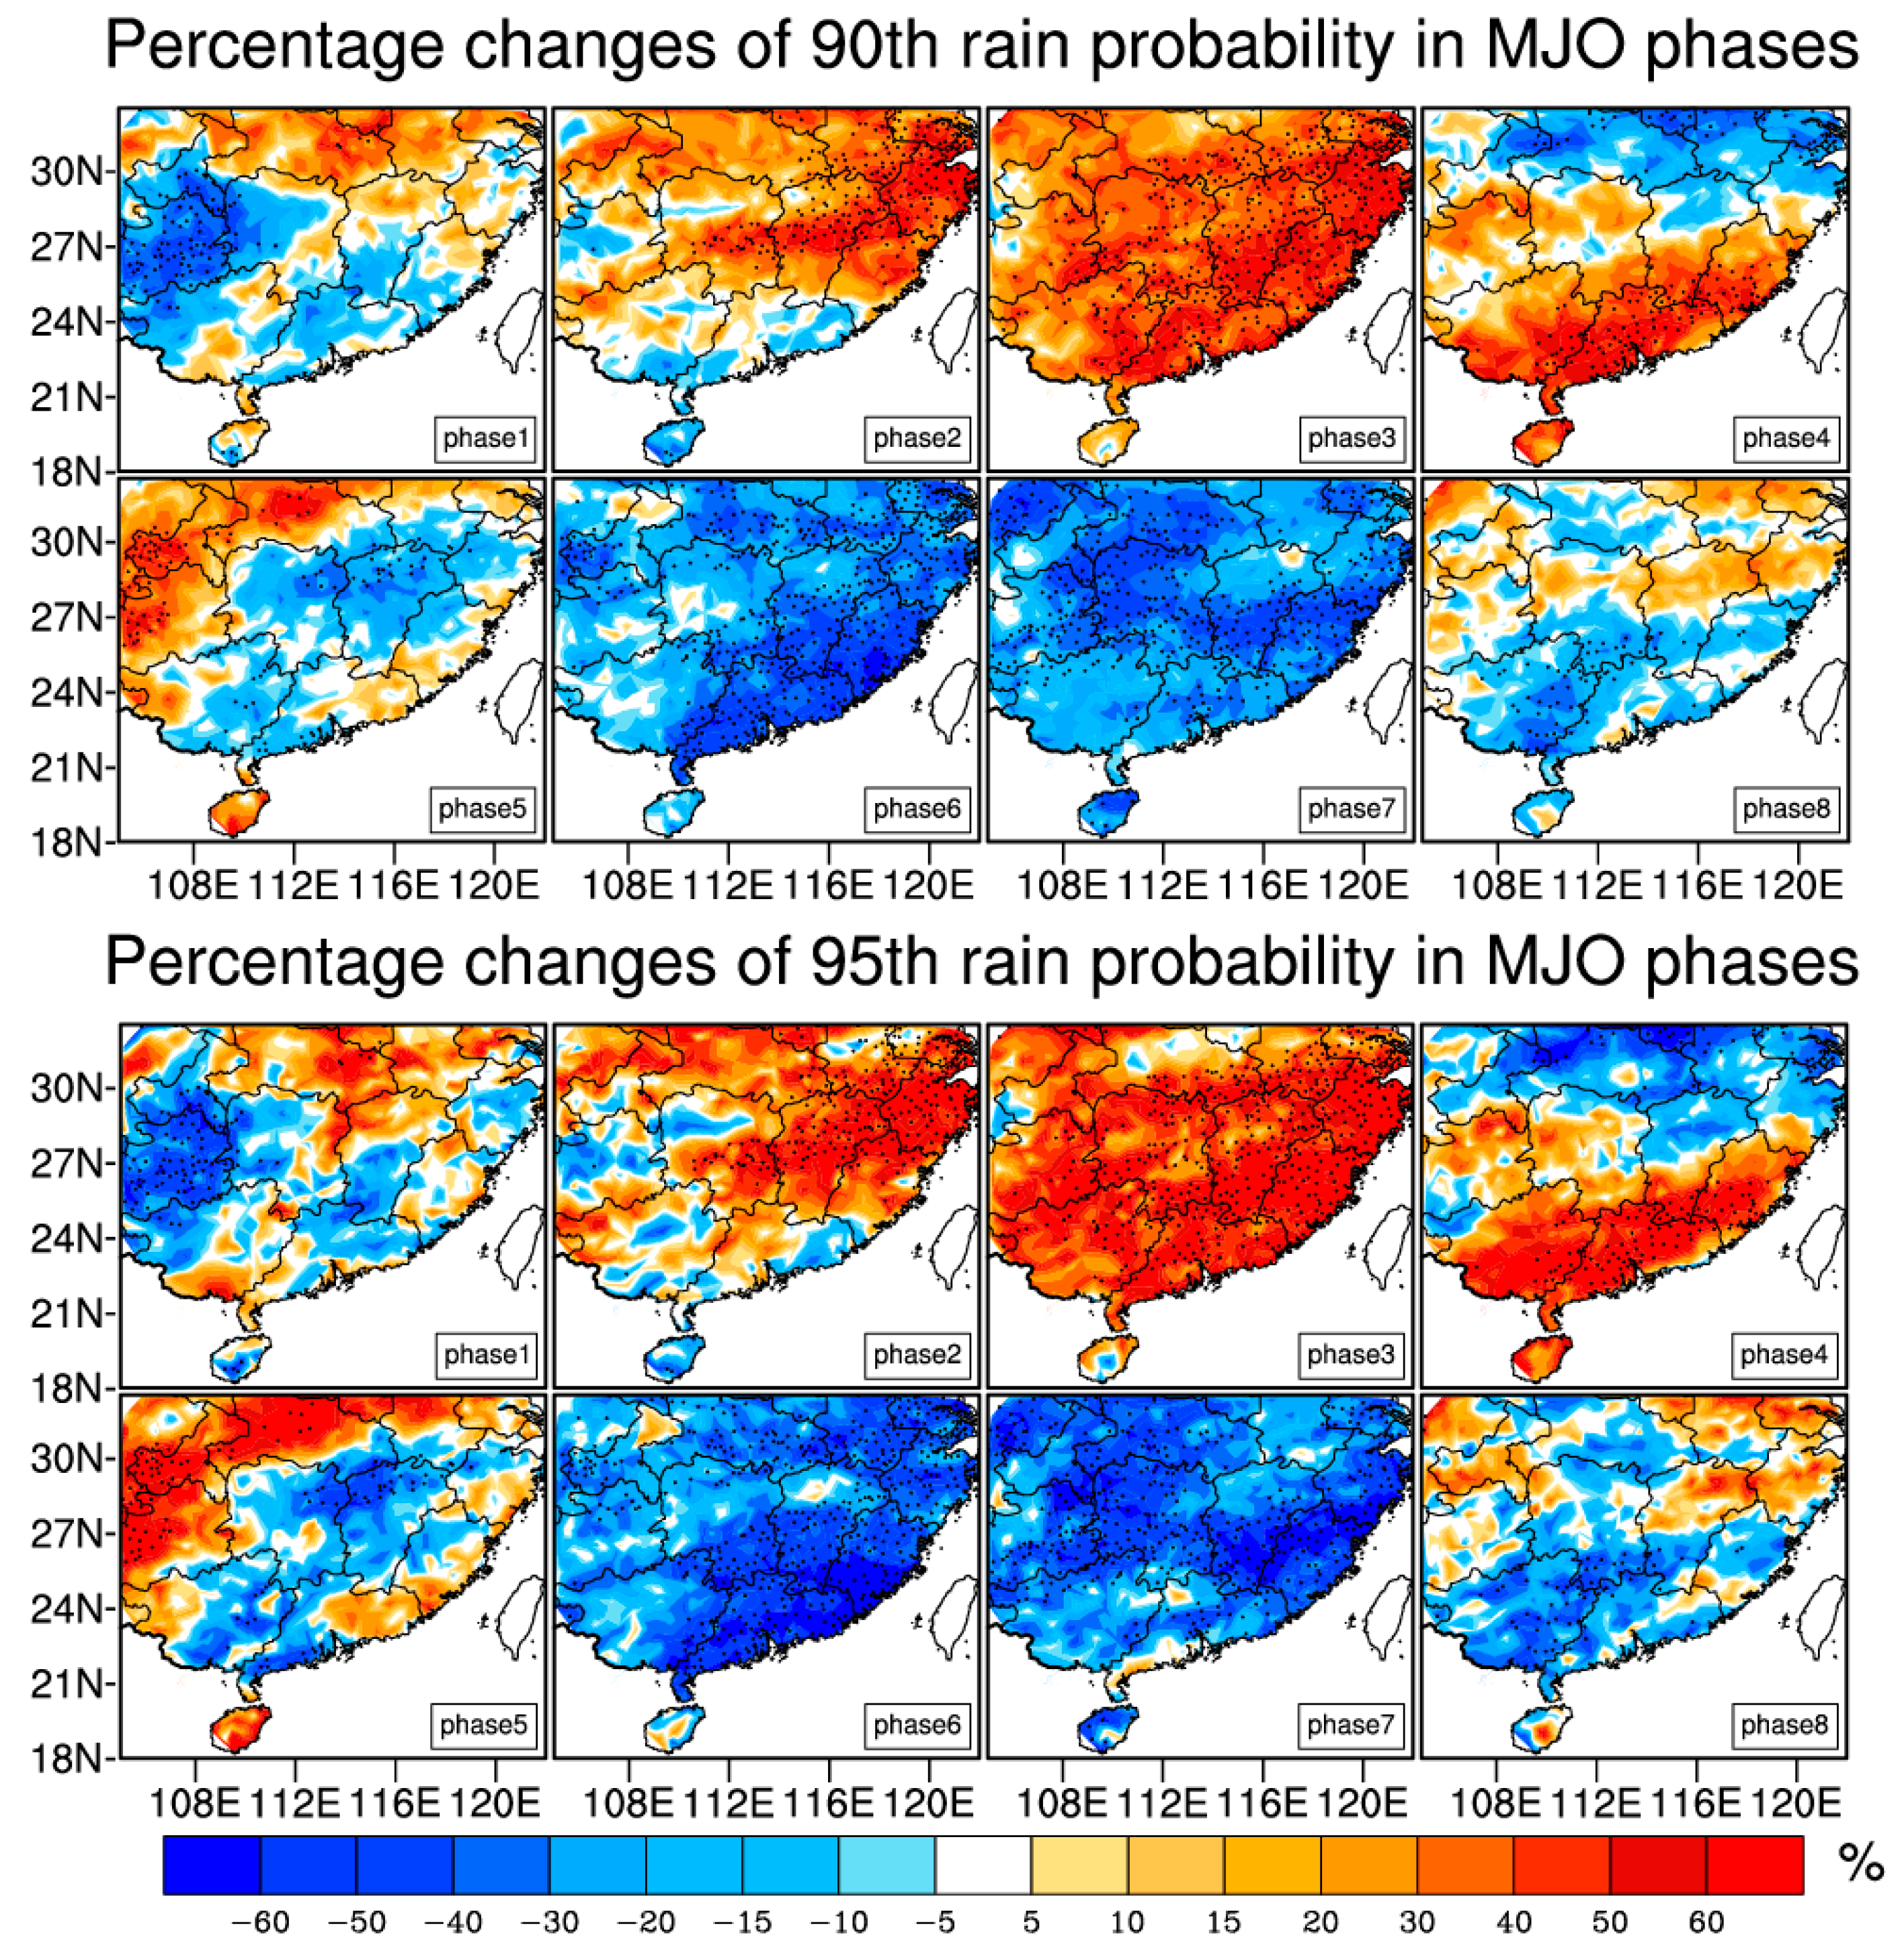
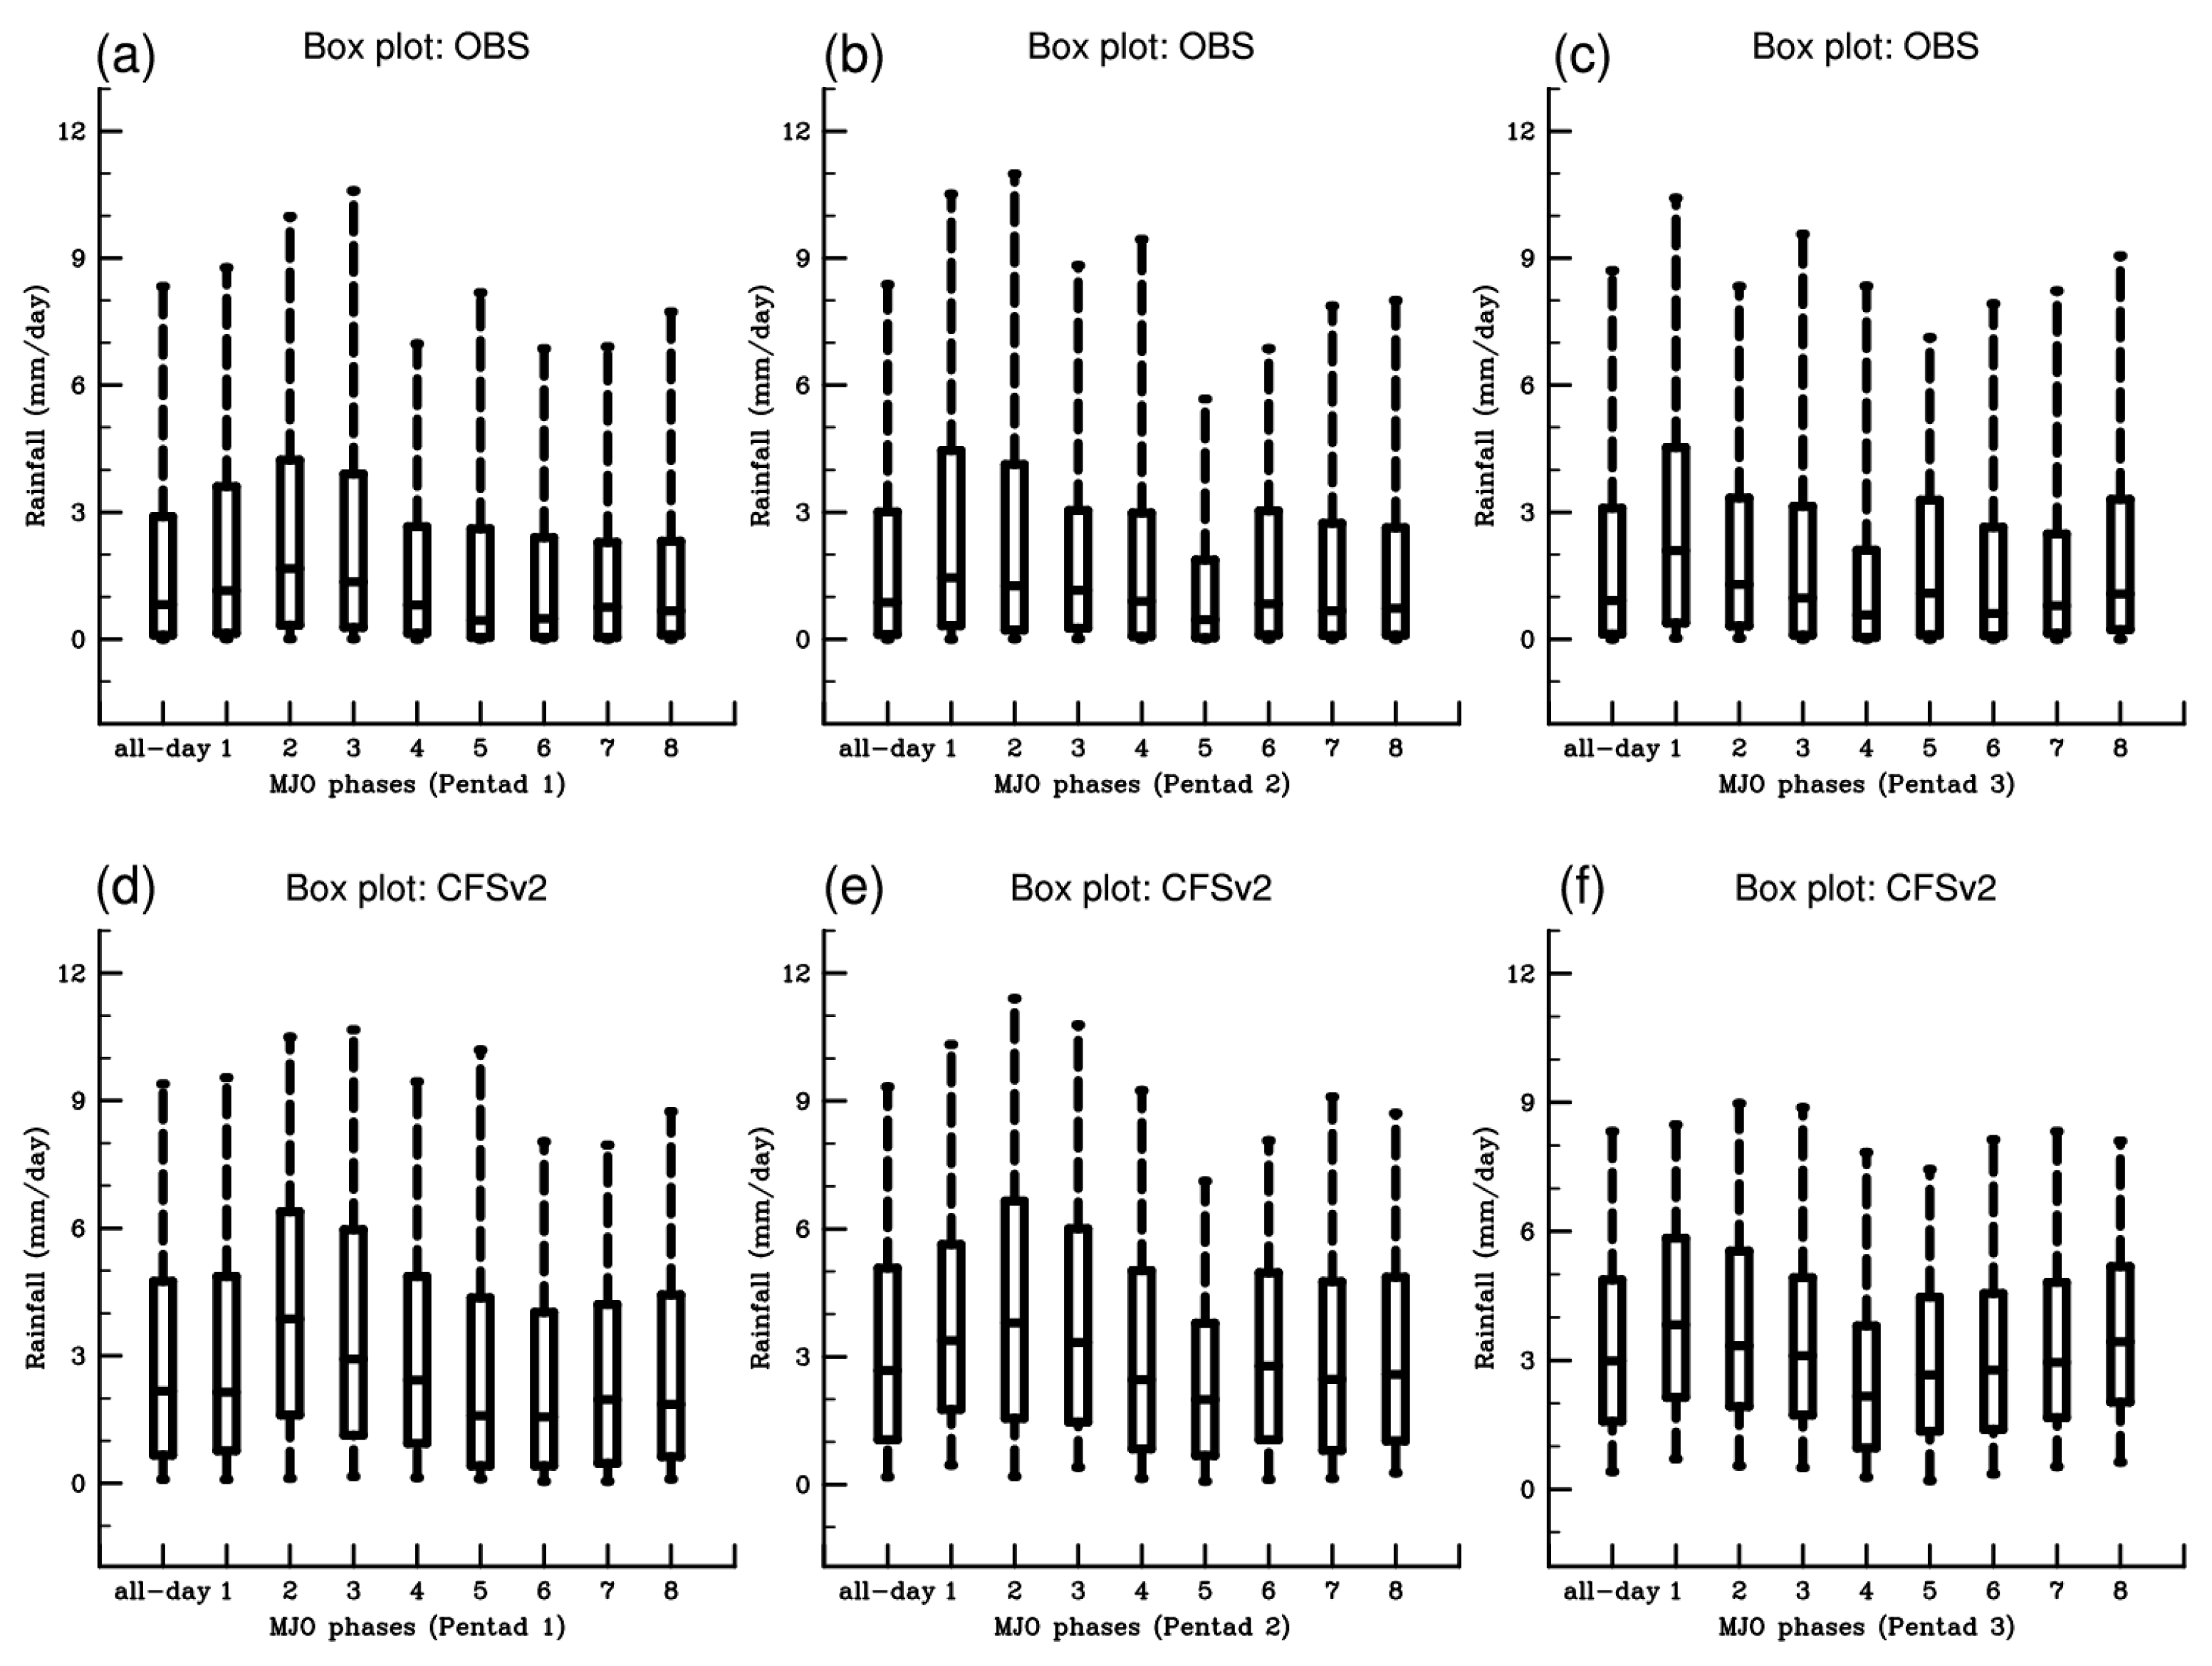
3.2. Modulations of MJO for Extreme Rainfall

Figure 3 shows the changes in the probability-distribution function (PDF) of rainfall during the MJO phases 1–8 with respect to the climatological PDF (as calculated with all days in NDJFM included). PDFs are presented as box plots with values for the 5th (lower bound), 25th (lower quartile), 50th (median), 75th (upper quartile) and 95th (upper bound) percentiles (Figure 3a). It was found that, during phases 2–3 and phases 4–5 of the MJO, the median, 75th, and 95th percentiles of rainfall skewed toward high values compared with all days in NDJFM, and conversely, MJO phases 6–7 and phases 8–1 tended to have a more negatively skewed rainfall distribution. Of the four paired phases of the MJO, phases 2–3 (for which the MJO’s convective center is located over the tropical Indian Ocean) can be selected as the typical wet phases due to the substantial enhancement of rainfall in southern China, while phases 6–7 (for which the MJO’s convective center is over the western Pacific) can be classified as the typical dry phases because of the substantially reduced rainfall probability.
These differences are highlighted in Figure 3b as the percentage changes in rainfall PDFs averaged in southern China. The percentage changes are computed as follows:
Δ P M J O = P M J O ( x x c ) P a l l ( x x c ) P a l l ( x x c ) 100 .
Here, Δ P M J O is the percentage change in the cumulative probability of rainfall ( x ) exceeding a threshold ( x c ) due to the MJO. P M J O is the cumulative probability computed only over days in a given MJO phase, and P a l l is for all days during NDJFM for a given threshold (which we here set as x x c ).
Figure 3b shows the percentage change in the probability of rainfall during MJO’s typical wet phases (phases 2–3) and typical dry phases (phases 6–7) with respect to that of all NDJFM days. It can clearly be seen that rainfall is substantially increased during MJO phases 2–3. In particular, there is a much larger increase in the probability of extreme events in phase 3 of MJO (e.g., about 40% higher for rainfall bins greater than 12 mm/day). In MJO phases 6–7, however, the percentage change of the rainfall probability shows a clear decrease (e.g., the probability of rainfall bins greater than 12 mm/day is about 30% lower than that for all NDJFM days).
To define the occurrence of rainfall extremes, a percentile-based threshold is adopted here since it can describe features in the tails of the distributions of meteorological variables. Indices based on relative threshold can help to explain how extremes changed globally, thereby allowing the results of studies from different parts of the world to fit together seamlessly [51]. Increasing the percentile threshold can identify dramatic extremes, but also leads to smaller samples from which to obtain robust results. Following the methods used by Xavier et al. [28] and Hsu et al. [29], here, an extreme event is defined by a daily rainfall amount greater than its relative threshold value (such as the 90th or 95th percentile values), which is referred to as 90th (95th) extremes. To highlight regional changes for the modulations of MJO in terms of extreme rainfall, Figure 4 illustrates the spatial distribution of percentage changes in the frequency of extreme occurrences. The probability of 90th extremes over most parts of southern China can significantly increase during the typical wet phases of MJO (i.e., MJO phases 2–3). Contrarily, during phases 6–7 of MJO, the frequency of 90th extremes decreased remarkably in most parts of this region. There is a much bigger change in the probability of the 95th extremes, which increases (reduces) by over 40% in the Yangtze River basin during phases 2–3 (phases 6–7) of the MJO. In addition, as the convective center of MJO propagates eastward from the equatorial Indian ocean to the equatorial western Pacific, the increased-probability area of extreme rainfall moves southward from the Yangtze River to the south China, which is consistent with the findings of Liu and Yang [5] and He et al. [52].

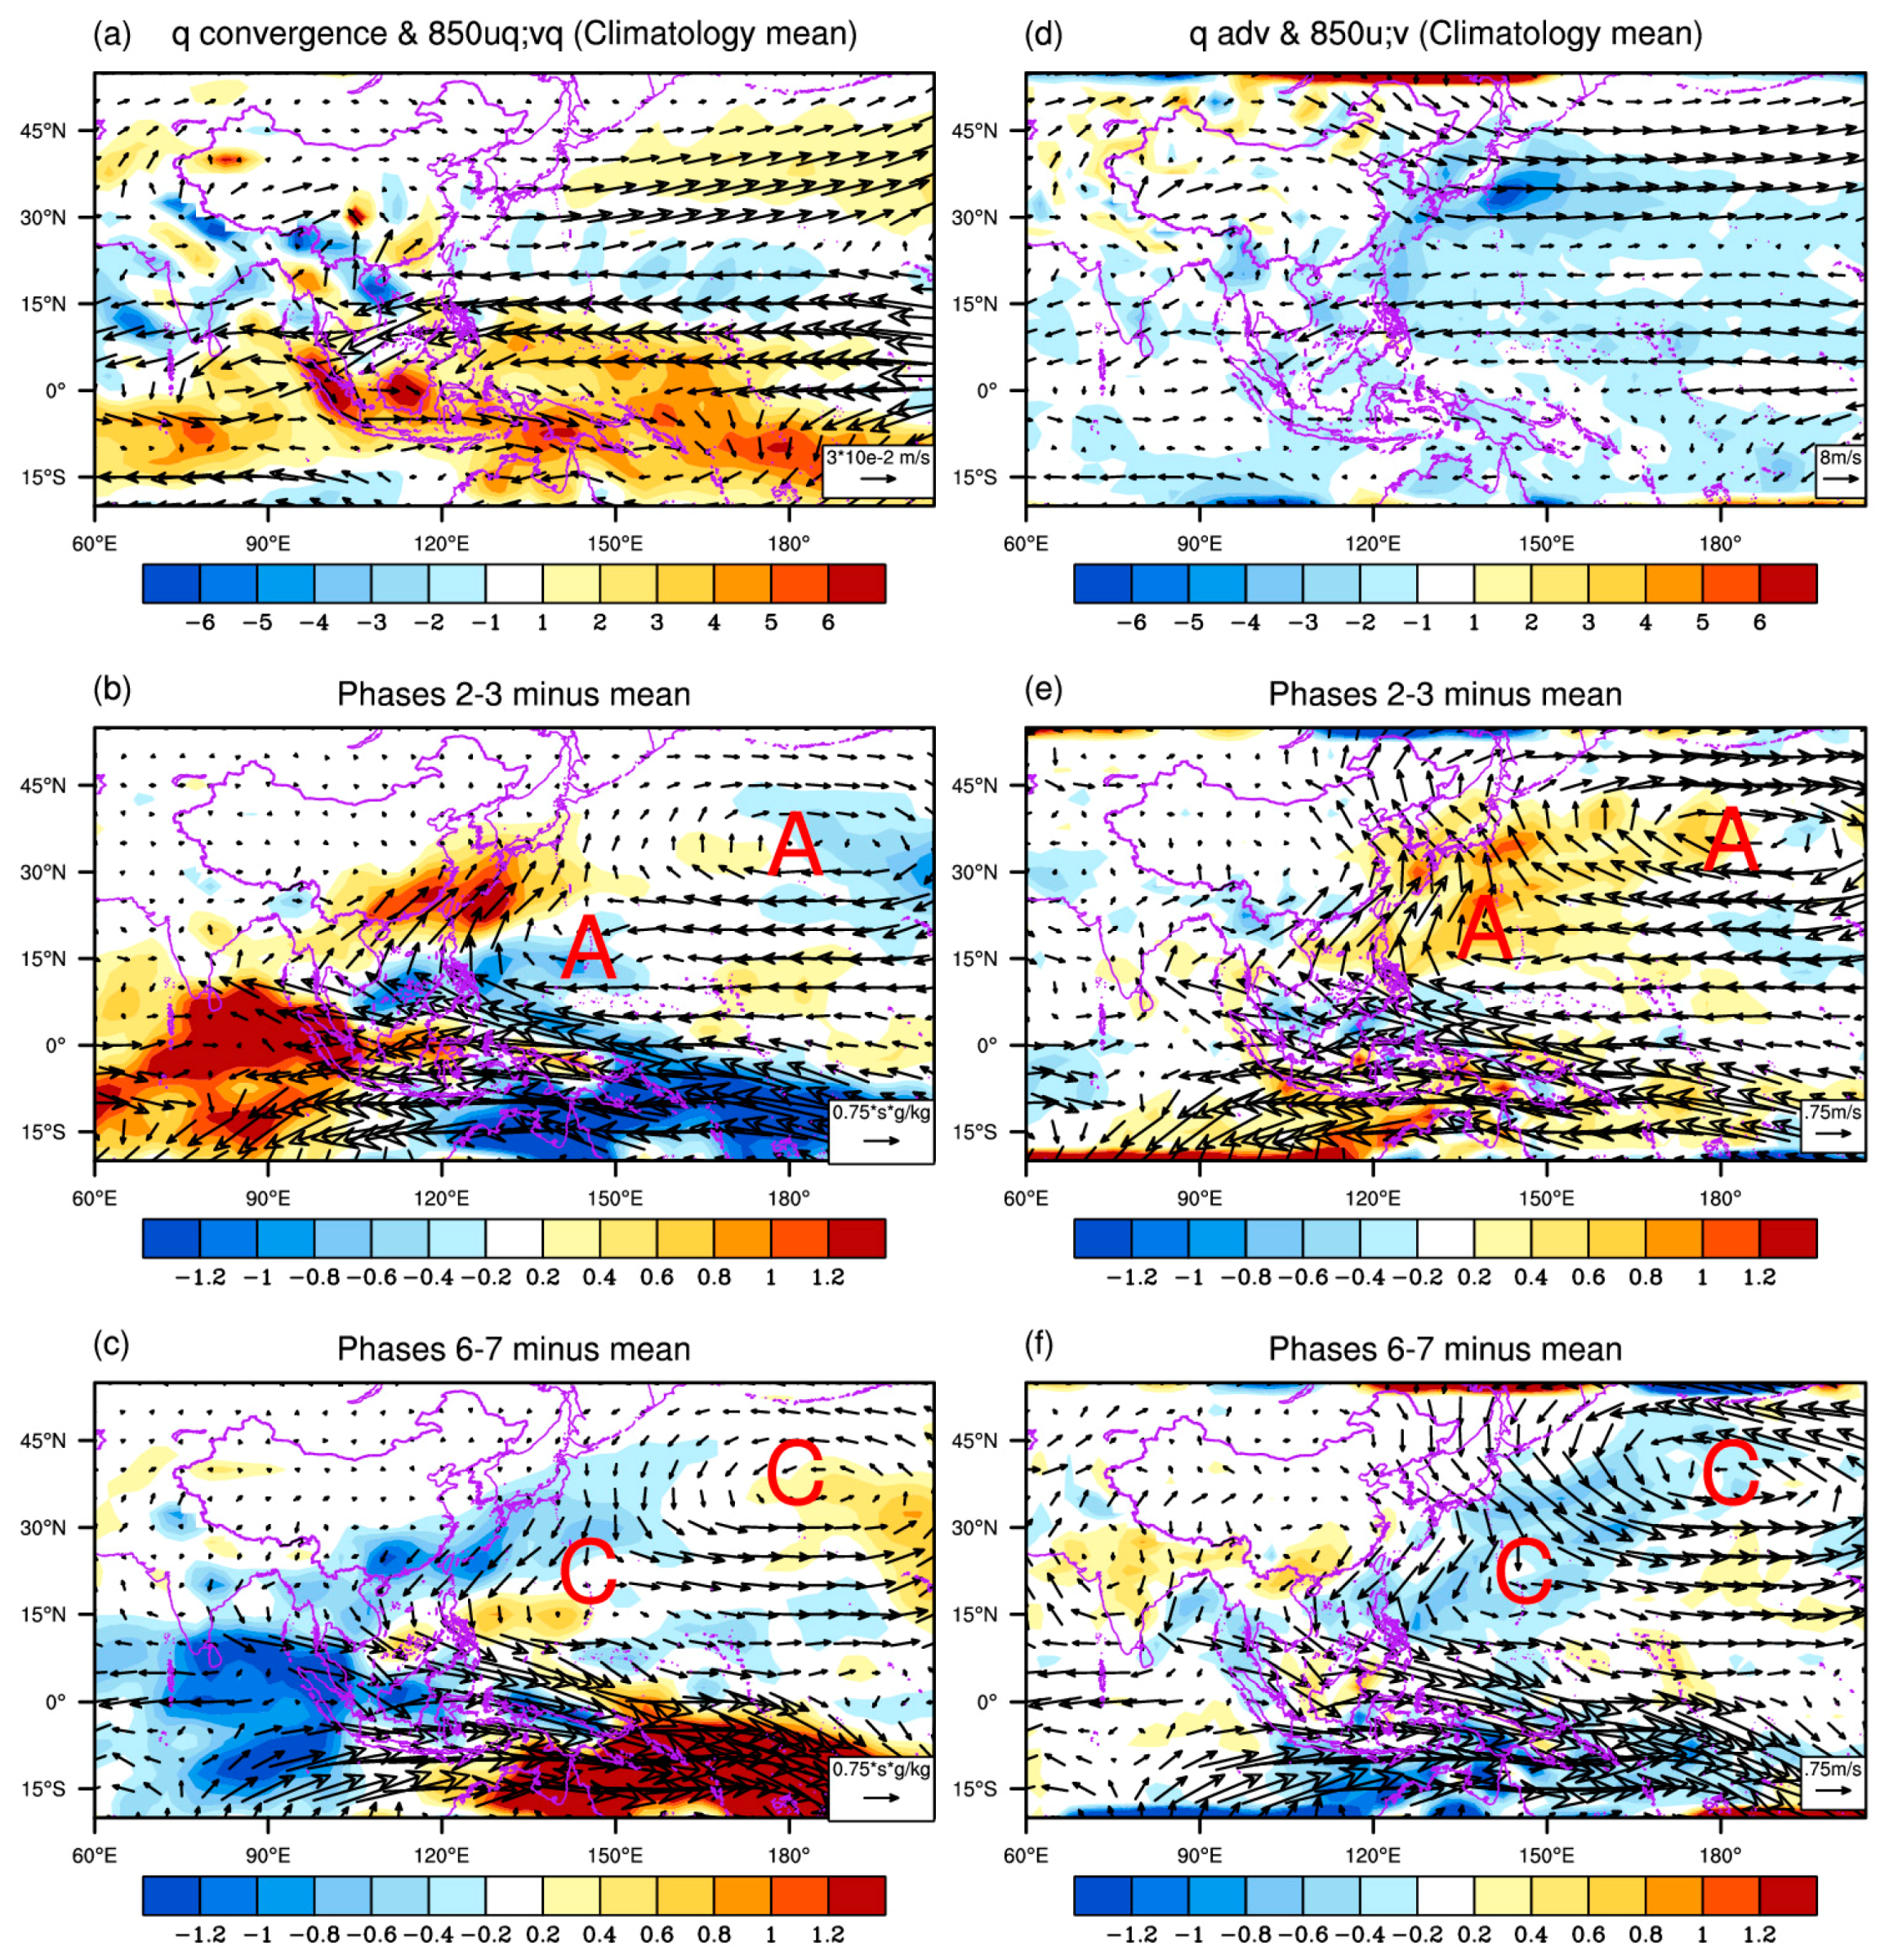
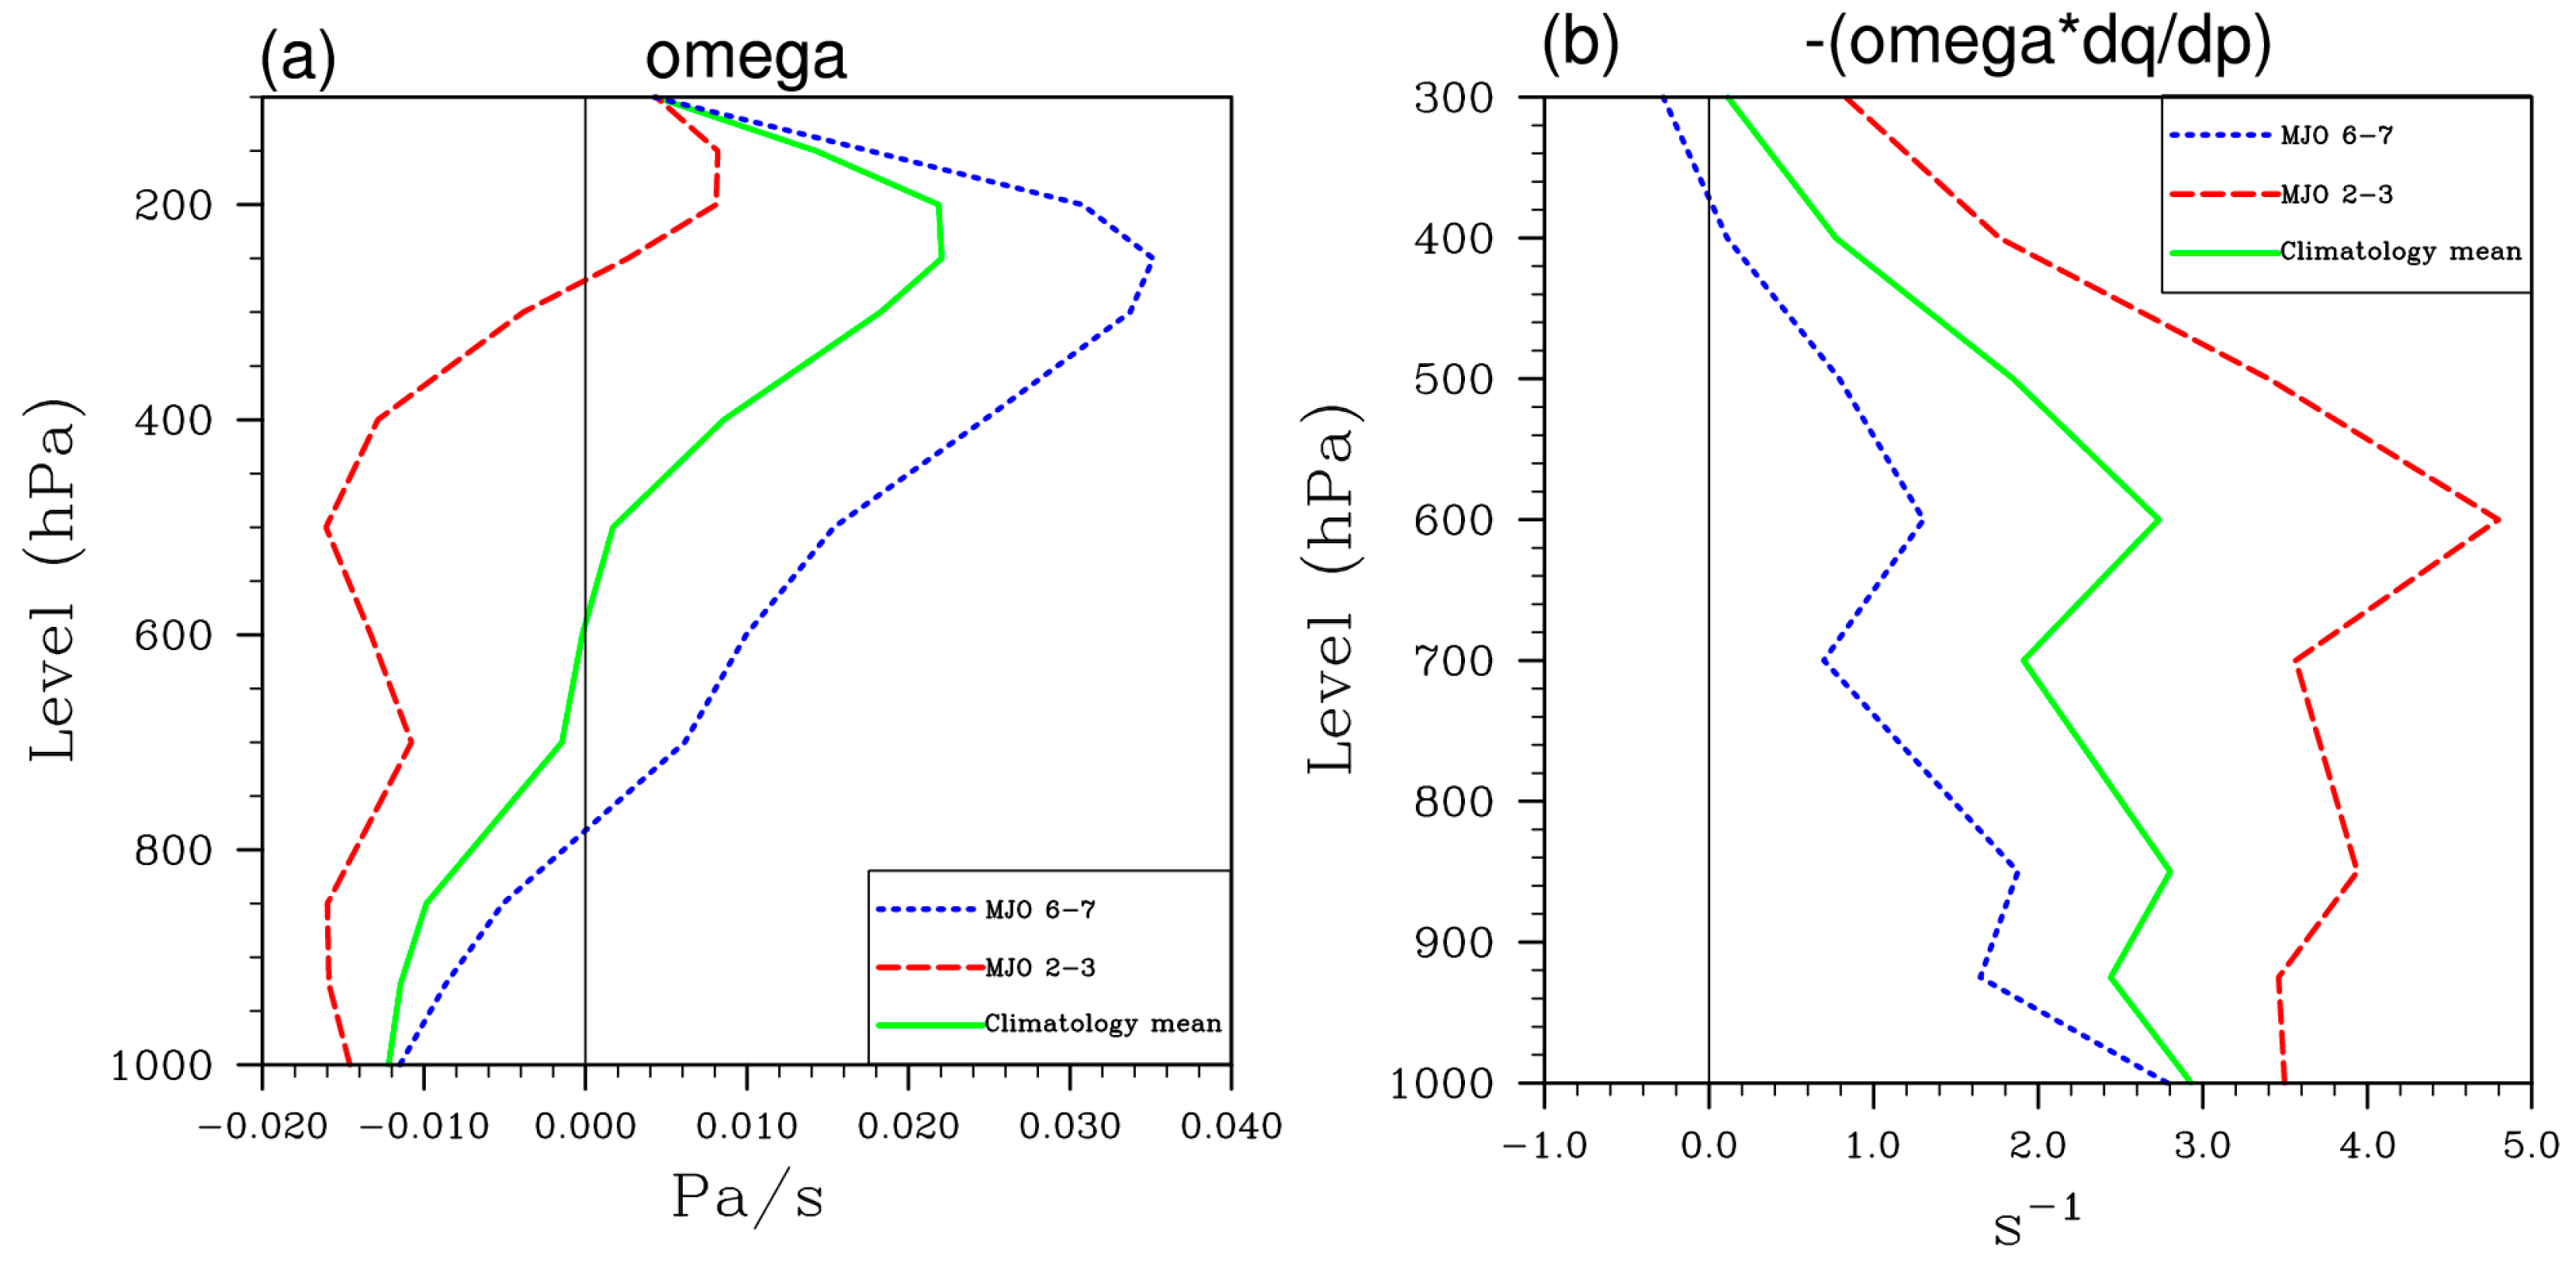
3.3. Physical Basis of Extreme Rainfall Changes

Several studies have suggested that changes in extremes are directly linked to changes in upward motion and moisture, among other factors [28,29,53,54]. To better understand the moisture processes associated with the occurrence of the extreme rainfall, we have examined column-integrated horizontal moisture convergence ( q g V ) and horizontal advection ( 1 g V q ) during the MJO phases. The climatological distributions of moisture convergence and 850-hPa moisture flux are shown in Figure 5a. Their changes during MJO phases 2–3 and phases 6–7 with respect to climatology are shown in Figure 5b,c. Figure 5d–f are the same as Figure 5a–c, but with the shadings representing column-integrated moisture advection and the vectors representing 850-hPa winds. It was found that moisture convergence plays a key role in providing a favorable condition for the occurrence of extreme events during phases 2–3 of the MJO (Figure 5b). During these phases, anomalous anticyclonic circulation over the South China Sea and northwestern Pacific can strengthen the northward moisture transport and induce moisture convergence in southern China. In contrast, anomalous cyclonic circulation over the northwest Pacific can suppress the moisture transport into southern China and may induce the unfavorable conditions for the occurrence of extreme rainfall during phases 6–7 of the MJO (Figure 5c). Unlike moisture convergence, the direct contributions from horizontal moisture advection may be insignificant (Figure 5d–f).
Figure 6 shows the mean profiles of vertical pressure velocity ( ω , as seen in Figure 6a) and vertical moisture advection ( - ω q p , as seen in Figure 6b), which are supposed to be related to the extreme rainfall [54]. Figure 6a shows the vertical velocity profile, which is an indirect measure of the large-scale convergence. As expected, the vertical motion is evidently enhanced (suppressed) during phases 2–3 (6–7) of MJO. Along with the changes in vertical motion, the vertical advection of moisture is enhanced (suppressed) during the phases 2–3 (6–7), as shown in Figure 6b. Atmospheric large-scale profiles consistently show a clear separation between typical wet phases and dry phases, as characterized by the enhanced vertical motion and vertical advection of moisture for the typical wet phases of MJO. Therefore, the enhanced (suppressed) vertical motion and moisture advection may positively contributed to the increased (reduced) probability of the extreme rainfall in southern China during the typical wet (dry) phases of MJO.

4. Predictability of Winter Extreme Rainfall in Southern China

One of the goals of this study is to evaluate CFSv2’s ability to reproduce the MJO’s influence on extreme event probability. CFSv2 can usually predict the MJO out to 20 days, at which time the bivariate anomaly correlation coefficient (ACC) drops to 0.5 and the root-mean-square error (RMSE) increases to the level associated with climatological predictions [41]. It has been indicated that successful MJO forecasts can help to bridge the gap between weather forecasting and climate prediction [30,55]. Evaluation of the CFSv2 system’s ability to represent the MJO’s influence upon extreme rainfall would help to derive the probabilities of extreme events during the different MJO phases. The hindcast data of the CFSv2 during the period 1999–2010, which has been interpolated onto the stations corresponding to the observations, is used for evaluation. To verify the rainfall forecasts, the observational data during the same period has been used for comparison.
Figure 7 shows the spatial distributions of the mean, 90th and 95th percentile values of rainfall, according to observations and the CFSv2. In general, the rainfall-climatography patterns, including their center locations and extreme values at a certain percentile, can be well captured by the model. The decrease trend of rainfall from southeastern to northwestern China has also been well represented with high accuracy (Figure 7a,d). For extreme event (Figure 7b,c,e,f), the regional differences of rainfall between the southeastern and northwestern regions were smaller in the model. CFSv2 tends to underestimate the magnitude of extreme precipitation in the south, but overestimates the magnitude of precipitation in western and northern China.
Figure 8d–f show the PDFs of rainfall as functions of forecast time (pentad) in southern China. The forecasts were initialized from MJO phases 1–8 and from all NDJFM days, respectively. For each 45-day forecast, the forecast-pentad values are constructed from the first three non-overlapping target pentads. Pentad 1 is defined as the average from day 1 to day 5, pentad 2 as the average from day 6 to 10, and so on. Corresponding observations for verification are also shown in Figure 8a–c. The increasing (decreasing) probability of rainfall is clearly illustrated during the typical wet (dry) phases of the MJO and lasts for about three pentads, which is well reproduced and forecasted by the CFSv2 model. The ability of the model to forecast extreme rainfall is further examined in Figure 9, which shows the percentage change in the probability of percentile rainfall when the forecasts are initialized from phases 1–8 of MJO, and verifications by observations are shown in the upper two rows. Similar to the above findings, during phases 2–3 of the MJO, the probability of extreme events is substantially increased during the first two weeks of the forecast, similar to the observed results. The suppression of extreme rainfall during phases 6–7 extends up to nine days and can be sustained for a longer time when the rainfall events are stronger than the 90th percentile. CFSv2 forecasts this suppression well, albeit with a slight bias. This analysis suggests the potential usefulness of CFSv2 for making extended-range predictions for extreme rainfall based on the MJO’s impact.

5. Summary and Discussion

This study presented the statistical relationship between the MJO and the probability and spatial distributions of extreme rainfall in southern China. Then, the atmospheric circulation and moisture processes were analyzed to reveal the physical mechanism of the impacts related to the MJO signals. The CFSv2’s ability to capture the relationship between the MJO and extreme rainfall was evaluated to examine the probabilistic predictability of extreme rainfall events in southern China at medium-extended range.
Our results have shown that the MJO modulates the probability and the spatial distribution of extreme rainfall in southern China. Among the four paired phases of the MJO, phases 2–3 and 6–7 can be selected as the typical wet phases and dry phases, respectively. During the typical wet phases, MJO can increase the probability of extreme rainfall by about 30–50%. By contrast, in typical dry phases, MJO tends to reduce the probability of rainfall extremes by about 20–25% in southern China. This is due to changes in the skewness of the rainfall PDFs during the phases 2–3 (phases 6–7), which have more (less) positively skewed distribution compared with the climatological PDF.
The MJO in winter influences the extreme rainfall in southern China mainly by modulating the atmospheric circulation and moisture accompanying with wind anomalies coming from the Bay of Bengal and the South China Sea, and then induces horizontal moisture convergence over southern China. The convergence of moisture further leads to a strengthening of upward motion, enhances vertical moisture advection, and provides more favorable conditions for the occurrence of extreme rainfall in southern China. Physically based analysis reveals that both horizontal moisture convergence and vertical moisture advection may serve as potential indicators of extreme events.
The CFSv2 model shows reasonable ability to forecast the MJO up to about 20 days in advance. Evaluations of the CFSv2 models’ ability to represent the MJO’s impact upon rainfall extremes further shows that it can reproduces these impacts faithfully. So, CFSv2 has great potential for monitoring and forecasting extreme-rainfall events in southern China based on RMM index.
The current study focused on the effect of MJO upon extreme rainfall in southern China. Recent study also found that the spatial pattern and magnitude of surface air temperature (SAT) anomalies over East Asia change significantly with MJO phases [56]. Whether or not the MJO modes influence the SAT extremes is worth further examination. Moreover, in summertime, the boreal summer intraseasonal oscillation (BSISO) is a dominant factor affecting rainfall in southern China [29]. Further study of the features and predictability of the impact of the BSISO on summer extreme rainfall will be needed.

Acknowledgments

This work was jointly supported by the National Basic Research (973) Program of China under Grant 2015CB453203, the China meteorological special project under Grant GHY201406022, and the China National Science Foundation under Grants 41375062 and 41775066, and the 973 Program of China under Grant 2010CB950404.

Author Contributions

Hong-Li Ren and Pengfei Ren conceived, designed, and performed the analysis; and Hong-Li Ren and Pengfei Ren jointly wrote, drafted and revised the paper.

Conflicts of Interest

The authors declare no conflict of interest.

References

  1. Zhai, P.; Liu, J. Extreme weather/climate events and disaster prevention and mitigation under global warming background. Eng. Sci. 2012, 9, 55–63. (In Chinese) [Google Scholar]
  2. Huang, R.; Xu, Y.; Wang, P.; Zhou, L. The Features of Catastrophic Flood over Changjiang River Basin during the Summer of 1998 and Cause Exploration. Clim. Environ. Res. 1998, 4, 13–26. (In Chinese) [Google Scholar]
  3. Li, C.; Yang, H.; Gu, W. Cause of Severe Weather with Cold Air, Freeezing Rain and Snow over South China in January 2008. Clim. Environ. Res. 2008, 13, 113–122. (In Chinese) [Google Scholar]
  4. Jia, X.; Liang, X. Possible Impacts of the MJO on the Severe Ice-Snow Weather in November of 2009 in China. J. Trop. Meteorol. 2011, 5, 639–648. (In Chinese) [Google Scholar]
  5. Gao, L.; Li, J.-P. Impacts and mechanism of diabatic heating on atmospheric perturbation potential energy. Chin. J. Geophys. Chin. Ed. 2013, 56, 3255–3269. (In Chinese) [Google Scholar]
  6. Ding, Y.; Liang, P. Extended Range Foreeast Basing on MJO. Meteorol. Mon. 2010, 7, 111–122. (In Chinese) [Google Scholar]
  7. Madden, R.A.; Julian, P.R. Detection of a 40–50 Day Oscillation in the Zonal Wind in the Tropical Pacific. J. Atmos. Sci. 1971, 28, 702–708. [Google Scholar] [CrossRef]
  8. Madden, R.A.; Julian, P.R. Description of Global-Scale Circulation Cells in the Tropics with a 40–50 Day Period. J. Atmos. Sci. 1972, 29, 1109–1123. [Google Scholar] [CrossRef]
  9. Wang, B.; Rui, H. Synoptic climatology of transient tropical intraseasonal convection anomalies: 1975–1985. Meteorol. Atmos. Phys. 1990, 44, 43–61. [Google Scholar] [CrossRef]
  10. Madden, R.A.; Julian, P.R. Observations of the 40–50-Day Tropical Oscillation—A Review. Mon. Weather Rev. 1994, 122, 814–837. [Google Scholar] [CrossRef]
  11. Zhang, C. Madden-Julian Oscillation. Rev. Geophys. 2005, 43. [Google Scholar] [CrossRef]
  12. Li, C.; Pan, J.; Song, J. Progress on the MJO Research in Recent Years. Chin. J. Atmos. Sci. 2013, 37, 229–252. (In Chinese) [Google Scholar]
  13. Li, T. Recent Advance in Understanding the Dynamics of the Madden-Julian Oscillation. Acta. Meteorol. Sin. 2014, 28, 1–33. [Google Scholar] [CrossRef]
  14. Maloney, E.D.; Hartmann, D.L. Modulation of eastern North Pacific hurricanes by the Madden-Julian oscillation. J. Clim. 2000, 13, 1451–1460. [Google Scholar] [CrossRef]
  15. Ho, C.-H.; Kim, J.-H.; Jeong, J.-H.; Kim, H.-S.; Chen, D. Variation of tropical cyclone activity in the South Indian Ocean: El Nino-Southern Oscillation and Madden-Julian Oscillation effects. J. Geophys. Res. Atmos. 2006, 111, 5225–5246. [Google Scholar] [CrossRef]
  16. Paegle, J.N.; Byerle, L.A.; Mo, K.C. Intraseasonal modulation of South American summer precipitation. Mon. Weather Rev. 2000, 128, 837–850. [Google Scholar] [CrossRef]
  17. Jones, C. Occurrence of extreme precipitation events in California and relationships with the Madden-Julian oscillation. J. Clim. 2000, 13, 3576–3587. [Google Scholar] [CrossRef]
  18. Bond, N.A.; Vecchi, G.A. The influence of the Madden-Julian oscillation on precipitation in Oregon and Washington. Weather For. 2003, 18, 600–613. [Google Scholar] [CrossRef]
  19. Barlow, M.; Wheeler, M.; Lyon, B.; Cullen, H. Modulation of daily precipitation over southwest Asia by the Madden-Julian oscillation. Mon. Weather Rev. 2005, 133, 3579–3594. [Google Scholar] [CrossRef]
  20. Wheeler, M.C.; Hendon, H.H.; Cleland, S.; Meinke, H.; Donald, A. Impacts of the Madden-Julian Oscillation on Australian Rainfall and Circulation. J. Clim. 2009, 22, 1482–1498. [Google Scholar] [CrossRef]
  21. Zhang, L.; Wang, B.; Zeng, Q. Impact of the Madden–Julian Oscillation on Summer Rainfall in Southeast China. J. Clim. 2009, 22, 201–216. [Google Scholar] [CrossRef]
  22. Zhang, L.; Lin, P.; Xiong, Z.; Wu, H. Impact of the Madden-Julian Oscillation on Pre-flood Season Precipitation in South China. Chin. J. Atmos. Sci. 2011, 3, 560–570. (In Chinese) [Google Scholar]
  23. Wheeler, M.C.; Hendon, H.H. An all-season real-time multivariate MJO index: Development of an index for monitoring and prediction. Mon. Weather Rev. 2004, 132, 1917–1932. [Google Scholar] [CrossRef]
  24. Liu, D.; Yang, X. Mechanism responsible for the impact of Madden-Julian Oscillation on the wintertime rainfall over eastern China. Sci. Meteorol. Sin. 2010, 30, 684–693. (In Chinese) [Google Scholar]
  25. Yuan, W.; Yang, H. On the Modulation of MJO to the Precipitation of Southeast China in Winter Season. Acta Sci. Nat. Univ. Peking 2010, 2, 207–214. (In Chinese) [Google Scholar]
  26. Jia, X.; Chen, L.; Ren, F.; Li, C. Impacts of the MJO on Winter Rainfall and Circulation in China. Adv. Atmos. Sci. 2011, 28, 521–533. [Google Scholar] [CrossRef]
  27. Ren, H.-L.; Shen, Y. A New Look at Impacts of MJO on Weather and Climate in China. Adv. Meteorol. Sci. Technol. 2016, 6, 97–105. (In Chinese) [Google Scholar]
  28. Xavier, P.; Rahmat, R.; Cheong, W.K.; Wallace, E. Influence of Madden-Julian Oscillation on Southeast Asia rainfall extremes: Observations and predictability. Geophys. Res. Lett. 2014, 41, 4406–4412. [Google Scholar] [CrossRef]
  29. Hsu, P.C.; Lee, J.Y.; Ha, K.J. Influence of boreal summer intraseasonal oscillation on rainfall extremes in southern China. Int. J. Climatol. 2016, 36, 1403–1412. [Google Scholar] [CrossRef]
  30. Zhang, C.D. Madden-Julian Oscillation Bridging Weather and Climate. Bull. Am. Meteorol. Soc. 2013, 94, 1849–1870. [Google Scholar] [CrossRef]
  31. Thompson, P.D. Uncertainty of Initial State as a Factor in the Predictability of Large Scale Atmospheric Flow Patterns. Tellus 1957, 9, 275–295. [Google Scholar] [CrossRef]
  32. Lorenz, E.N. A study of the predictability of a 28-variable atmospheric model. Tellus 1965, 17, 321–333. [Google Scholar] [CrossRef]
  33. Lorenz, E.N. Atmospheric predictability experiments with a large numerical model. Tellus 1982, 34, 505–513. [Google Scholar] [CrossRef]
  34. Palmer, T.N. Extended-range atmospheric prediction and the Lorenz model. Bull. Am. Meteorol. Soc. 1993, 74, 49–66. [Google Scholar] [CrossRef]
  35. Van den Dool, H.M. Long-range weather forecasts through numerical and empirical methods. Dyn. Atmos. Ocean. 1994, 20, 247–270. [Google Scholar] [CrossRef]
  36. Palmer, T.N. Predicting uncertainty in forecasts of weather and climate. Rep. Prog. Phys. 2000, 63, 71–116. [Google Scholar] [CrossRef]
  37. Shukla, J.; Anderson, J.; Baumhefner, D.; Brankovic, C.; Chang, Y.; Kalnay, E.; Marx, L.; Palmer, T.; Paolino, D.; Ploshay, J.; et al. Dynamical seasonal prediction. Bull. Am. Meteorol. Soc. 2000, 81, 2593–2606. [Google Scholar] [CrossRef]
  38. Waliser, D.; Weickmann, K.; Dole, R.; Schubert, S.; Alves, O.; Jones, C.; Newman, M.; Pan, H.L.; Roubicek, A.; Saha, S. The experimental MJO prediction project. Bull. Am. Meteorol. Soc. 2006, 87, 425–431. [Google Scholar] [CrossRef]
  39. Seo, K.H.; Wang, W.-Q.; Gottschalck, J.; Zhang, Q.; Schemm, J.-K.E.; Higgins, W.R.; Kumar, A. Evaluation of MJO Forecast Skill from Several Statistical and Dynamical Forecast Models. J. Clim. 2009, 22, 2372–2388. [Google Scholar] [CrossRef]
  40. Fu, X.; Lee, J.Y.; Hsu, P.C.; Taniguchi, H.; Wang, B.; Wang, W.Q.; Weaver, S. Multi-model MJO forecasting during DYNAMO/CINDY period. Clim. Dynam. 2013, 41, 1067–1081. [Google Scholar] [CrossRef]
  41. Wang, W.Q.; Hung, M.P.; Weaver, S.J.; Kumar, A.; Fu, X.H. MJO prediction in the NCEP Climate Forecast System version 2. Clim. Dynam. 2014, 42, 2509–2520. [Google Scholar] [CrossRef]
  42. Ren, H.L.; Wu, J.; Zhao, C.; Liu, Y.; Jia, X.; Zhang, P. Progresses of MJO Prediction Researches and Developments. J. Appl. Meteorol. Sci. 2015, 26, 658–668. (In Chinese) [Google Scholar]
  43. Ren, H.L.; Wu, J.; Zhao, C.B.; Cheng, Y.J.; Liu, X.W. MJO ensemble prediction in BCC-CSM1.1(m) using different initialization schemes. Atmos. Ocean. Sci. Lett. 2016, 9, 60–65. [Google Scholar] [CrossRef]
  44. Ren, H.L.; Wu, J.; Zhao, C.B.; Cheng, Y.J.; Liu, X.W. Prediction of primary climate variability modes at the Beijing Climate Center. Acta. Meteorol. Sin. 2017, 31, 204–223. [Google Scholar] [CrossRef]
  45. Zhao, C.B.; Ren, H.L.; Song, L.C.; Wu, J. Madden-Julian Oscillation simulated in BCC climate models. Dynam. Atmos. Ocean. 2015, 72, 88–101. [Google Scholar] [CrossRef]
  46. Wu, J.; Ren, H.L.; Zuo, J.; Zhao, C.; Chen, L.; Li, Q. MJO prediction skill, predictability, and teleconnection impacts in the Beijing Climate Center Atmospheric General Circulation Model. Dynam. Atmos. Ocean. 2016, 75, 78–90. [Google Scholar] [CrossRef]
  47. Kalnay, E. NCEP/NCAR 40-year reanalysis project. Bull. Am. Meteorol. Soc. 1996, 77, 437–472. [Google Scholar] [CrossRef]
  48. Saha, S.; Moorthi, S.; Wu, X.; Wang, J.; Nadiga, S.; Tripp, P.; Behringer, D.; Hou, Y.; Chuang, H.; Iredell, M.; et al. The NCEP Climate Forecast System Version 2. J. Clim. 2014, 27, 2185–2208. [Google Scholar] [CrossRef]
  49. Saha, S.; Moorthi, S.; Pan, H.; Wu, X.; Wang, J.; Nadiga, S.; Tripp, P.; Kistler, R.; Woollen, J.; Behringer, D.; et al. The Ncep Climate Forecast System Reanalysis. Bull. Am. Meteorol. Soc. 2010, 91, 1015–1057. [Google Scholar] [CrossRef]
  50. Zhang, C.D.; Dong, M. Seasonality in the Madden-Julian oscillation. J. Clim. 2004, 17, 3169–3180. [Google Scholar] [CrossRef]
  51. Zhang, X.B.; Alexander, L.; Hegerl, G.C.; Jones, P.; Tank, A.K.; Peterson, T.C.; Trewin, B.; Zwiers, F.W. Indices for monitoring changes in extremes based on daily temperature and precipitation data. WIREs Clim. Chang. 2011, 2, 851–870. [Google Scholar] [CrossRef]
  52. He, J.; Lin, H.; Wu, Z. Another look at influences of the Madden-Julian Oscillation on the wintertime East Asian weather. J. Geophys. Res. Atmos. 2011, 116, 1284–1309. [Google Scholar] [CrossRef]
  53. O’Gorman, P.A.; Schneider, T. The physical basis for increases in precipitation extremes in simulations of 21st-century climate change. Proc. Natl. Acad. Sci. USA 2009, 106, 14773–14777. [Google Scholar] [CrossRef] [PubMed]
  54. Loriaux, J.; Lenderink, G.; Siebesma, A.P. Peak precipitation intensity in relation to atmospheric conditions and large-scale forcing at midlatitudes. J. Geophys. Res. Atmos. 2016, 121, 5471–5487. [Google Scholar] [CrossRef]
  55. Waliser, D.E.; Lau, K.M.; Stern, W.; Jones, C. Potential predictability of the Madden-Julian oscillation. Bull. Am. Meteorol. Soc. 2003, 84, 33–50. [Google Scholar] [CrossRef]
  56. Jeong, J.H.; Ho, C.H.; Kim, B.M.; Kwon, W.T. Influence of the Madden-Julian Oscillation on wintertime surface air temperature and cold surges in east Asia. J. Geophys. Res. Atmos. 2005, 110. [Google Scholar] [CrossRef]
Figure 1. (a) Mean and (b) standard deviation of wintertime (NDJFM) rainfall in China during 1981–2013 derived from 2400 stations. Units: mm/day.
Atmosphere 08 00192 g001
Figure 2. Power spectra of NDJFM rainfall over southern China. Red line represents the red-noise spectrum. The annual cycle is removed before spectrum analysis. Multiple passes of a 1-2-1 filter are applied to all spectra.
Atmosphere 08 00192 g002
Figure 3. (a) PDFs of rainfall in southern China for the MJO phases 1–8 and all days (NDJFM). (b) Percentage change in the probability of rainfall for typical dry phases (red lines) and typical wet phases (blue lines) of MJO with respect to the PDF of all days.
Atmosphere 08 00192 g003
Figure 4. Percentage change in the probability of extreme events at 90th (upper two rows) and 95th (bottom two rows) percentile for each of eight phases of MJO with respect to climatology PDF. The dots represent stations that exceed the 95% confidence level.
Atmosphere 08 00192 g004
Figure 5. (a) Climatological mean of column-integrated moisture convergence (shading, positive is convergence and negative is divergence, unit: 10−5 kg/s·m2) and 850-hPa moisture flux (vector, unit: 0.75·s·g/kg) for NDJFM. (b) Changes in moisture convergence and 850-hPa moisture flux during MJO phases 2–3 and (c) phases 6–7 with respect to climatology are also shown. (df) same as in (ac) but the shadings represent column-integrated moisture advection and the vector represent 850-hPa winds.
Atmosphere 08 00192 g005
Figure 6. (a) Composites profiles of vertical pressure velocity (units: Pa/s) and (b) vertical moisture advection (units: 10−9/s). Climatological values are shown in green, MJO phases 2–3 in red and phases 6–7 in blue.
Atmosphere 08 00192 g006
Figure 7. The mean rainfall (left), 90th (middle) and 95th (right) percentile values of rainfall (mm/day) in (ac) observations are compared with those from corresponding (df) CFSv2 for forecast day 0.
Atmosphere 08 00192 g007
Figure 8. PDFs of rainfall in southern China when initialized from MJO phases 1–8 and all days (NDJFM) at forecast pentad 1 (left), pentad 2 (middle), and pentad 3 (right), where the upper row (ac) for observations and the bottom row (df) for CFSv2.
Atmosphere 08 00192 g008
Figure 9. Percentage changes in the probability of rainfall as a function of forecast time (day) in southern China when initialized from phases 1–8 of MJO with respect to a climatological PDF, where the upper two rows represent observations and the bottom two rows for CFSv2.
Atmosphere 08 00192 g009

