Review

ELF Electromagnetic Waves from Lightning: The Schumann Resonances

Department of Geosciences, Tel Aviv University, Tel Aviv-Yafo 6997801, Israel
Atmosphere 2016, 7(9), 116; https://doi.org/10.3390/atmos7090116
Submission received: 15 August 2016 / Revised: 1 September 2016 / Accepted: 8 September 2016 / Published: 15 September 2016

Abstract

:
Lightning produces electromagnetic fields and waves in all frequency ranges. In the extremely low frequency (ELF) range below 100 Hz, the global Schumann Resonances (SR) are excited at frequencies of 8 Hz, 14 Hz, 20 Hz, etc. This review is aimed at the reader generally unfamiliar with the Schumann Resonances. First some historical context to SR research is given, followed by some theoretical background and examples of the extensive use of Schumann resonances in a variety of lightning-related studies in recent years, ranging from estimates of the spatial and temporal variations in global lighting activity, connections to global climate change, transient luminous events and extraterrestrial lightning. Both theoretical and experimental results of the global resonance phenomenon are presented. It is our hope that this review will increase the interest in SR among researchers previously unfamiliar with this phenomenon.

1. Introduction

The Schumann Resonances (SR) are global electromagnetic resonances excited within the Earth-ionosphere waveguide, primarily by lightning discharges. These resonances occur in the extremely low frequency (ELF) range, with resonant frequencies around 8 Hz, 14 Hz, 20 Hz, 26 Hz, etc. The history of the Schumann Resonances (SR) is an interesting story [1]. While Schumann [2] gets most of the credit for the first prediction of the existence of the SR, the idea of natural global electromagnetic resonances were first presented by George F. Fitzgerald in 1893, and then again by Nikola Tesla in 1905 [3]. However, while others formulated the idea before Schumann, it was Schumann, together with Köning, who attempted to measure the resonant frequencies for the first time, unsuccessfully [2,4,5,6]. It was not until measurements made by Balser and Wagner [7,8,9,10,11] that adequate analysis techniques were available to extract the resonance information from the background noise. Today we know that we need 5–10 min of data to detect the SR clearly in the spectrum. For further insight into the history of the SR, the reader is pointed to this excellent review [1].
Following Schuman’s landmark paper in 1952, there was an increasing interest in SR in a wide variety of fields. Due to the low attenuation of ELF waves in the SR band (~0.5 dB/Mm) it was discovered that not only lightning can produce SR, but any large explosion in the atmosphere will also induce SR transients [11,12]. Hence, until the ban of atmospheric nuclear explosions in the 1960s, there was great interest in using the SR to monitor the enemy’s nuclear explosions in remote parts of the globe. Another application of ELF waves related to the SR, due to the low attenuations of the ELF waves, was the man-made transmission of these waves for long range communications with submarines [13,14]. However, due to the extremely long wavelengths at ELF, such transmitters need to be huge (>200 km length), with huge power outputs due to very low efficiencies of these transmitters. Nevertheless, since the signals propagate globally, the superpowers were still using these ELF transmitters until recently. The United States transmitter broadcasts at 76 Hz [15], while the Russian transmitter broadcasts at 82 Hz [16].
Besides the military uses of ELF resonances and propagation theory, from the very beginning of SR studies there was an interest to track global lightning activity using the SR [9,17,18,19,20,21]. It has also been suggested that extraterrestrial lightning may be detected and studied using SR [22,23,24]. However, the recent focus on SR research since the 1990s was a result of the connection between lightning activity and the Earth’s climate. It was first suggested in 1990 that global warming may result in significant increases in lightning activity [25]. Since the SR is one way to monitor global lightning activity, it was suggested [26] that the SR may be used to monitor global temperature variations, acting as a global thermometer. This started a new interest in SR research as related to global climate change that continues today.
Finally, with the discovery of transient luminous events (TLEs) such as sprites, elves, jets, etc., it was shown that SR transient pulses are closely linked to the occurrence of transient luminous events—sprites and elves [27,28,29,30,31]. Hence, SR research is now also a major part of this new field of research related to upper atmospheric discharges.

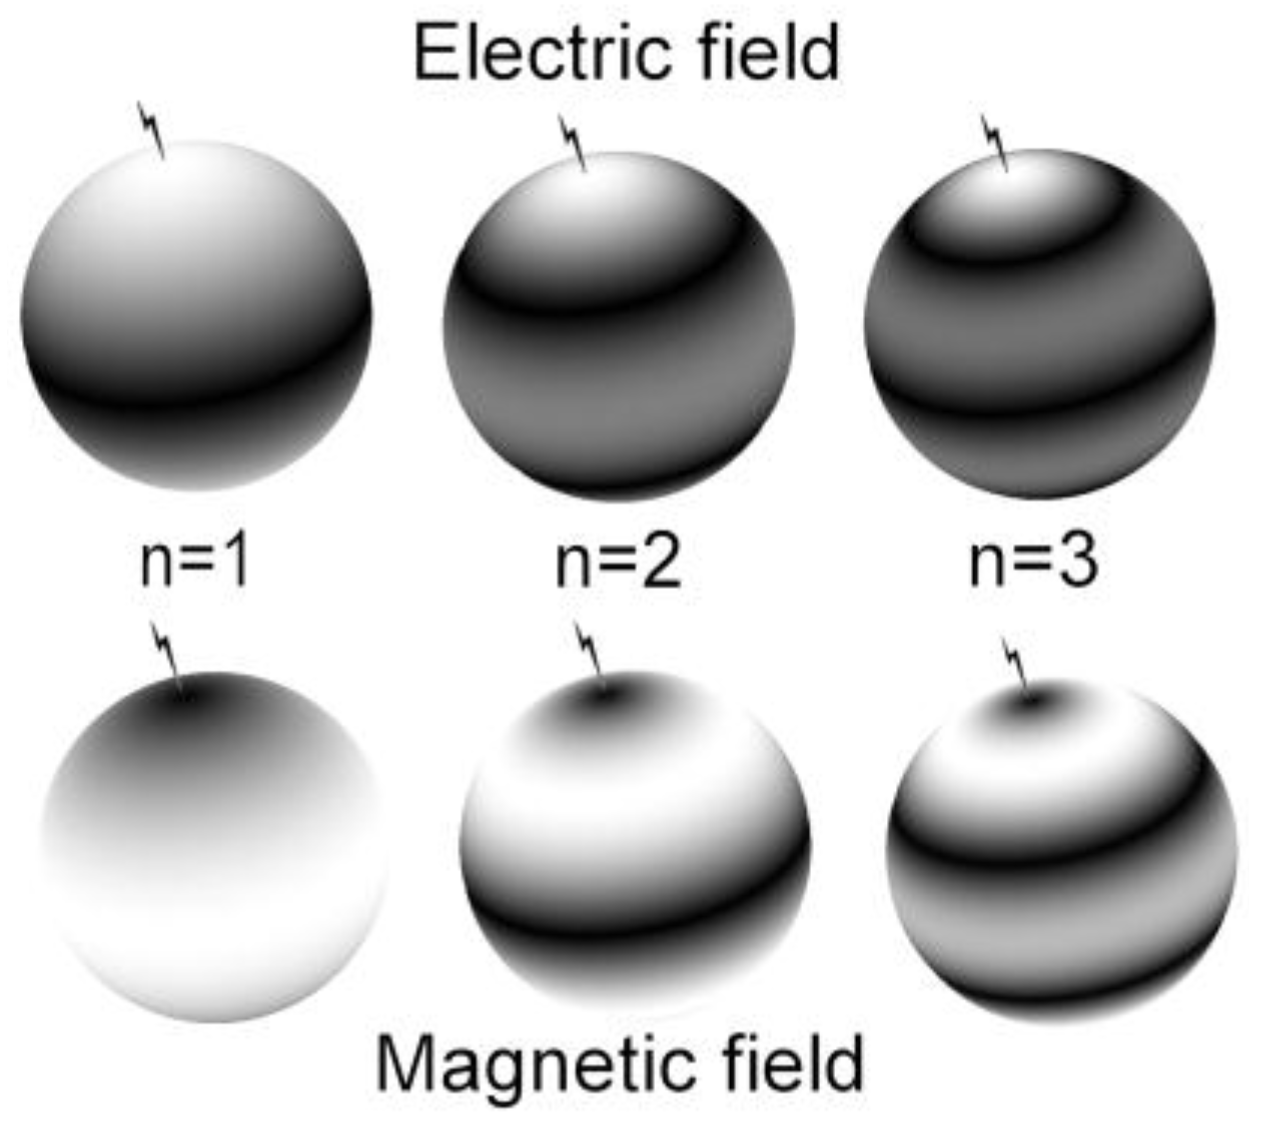
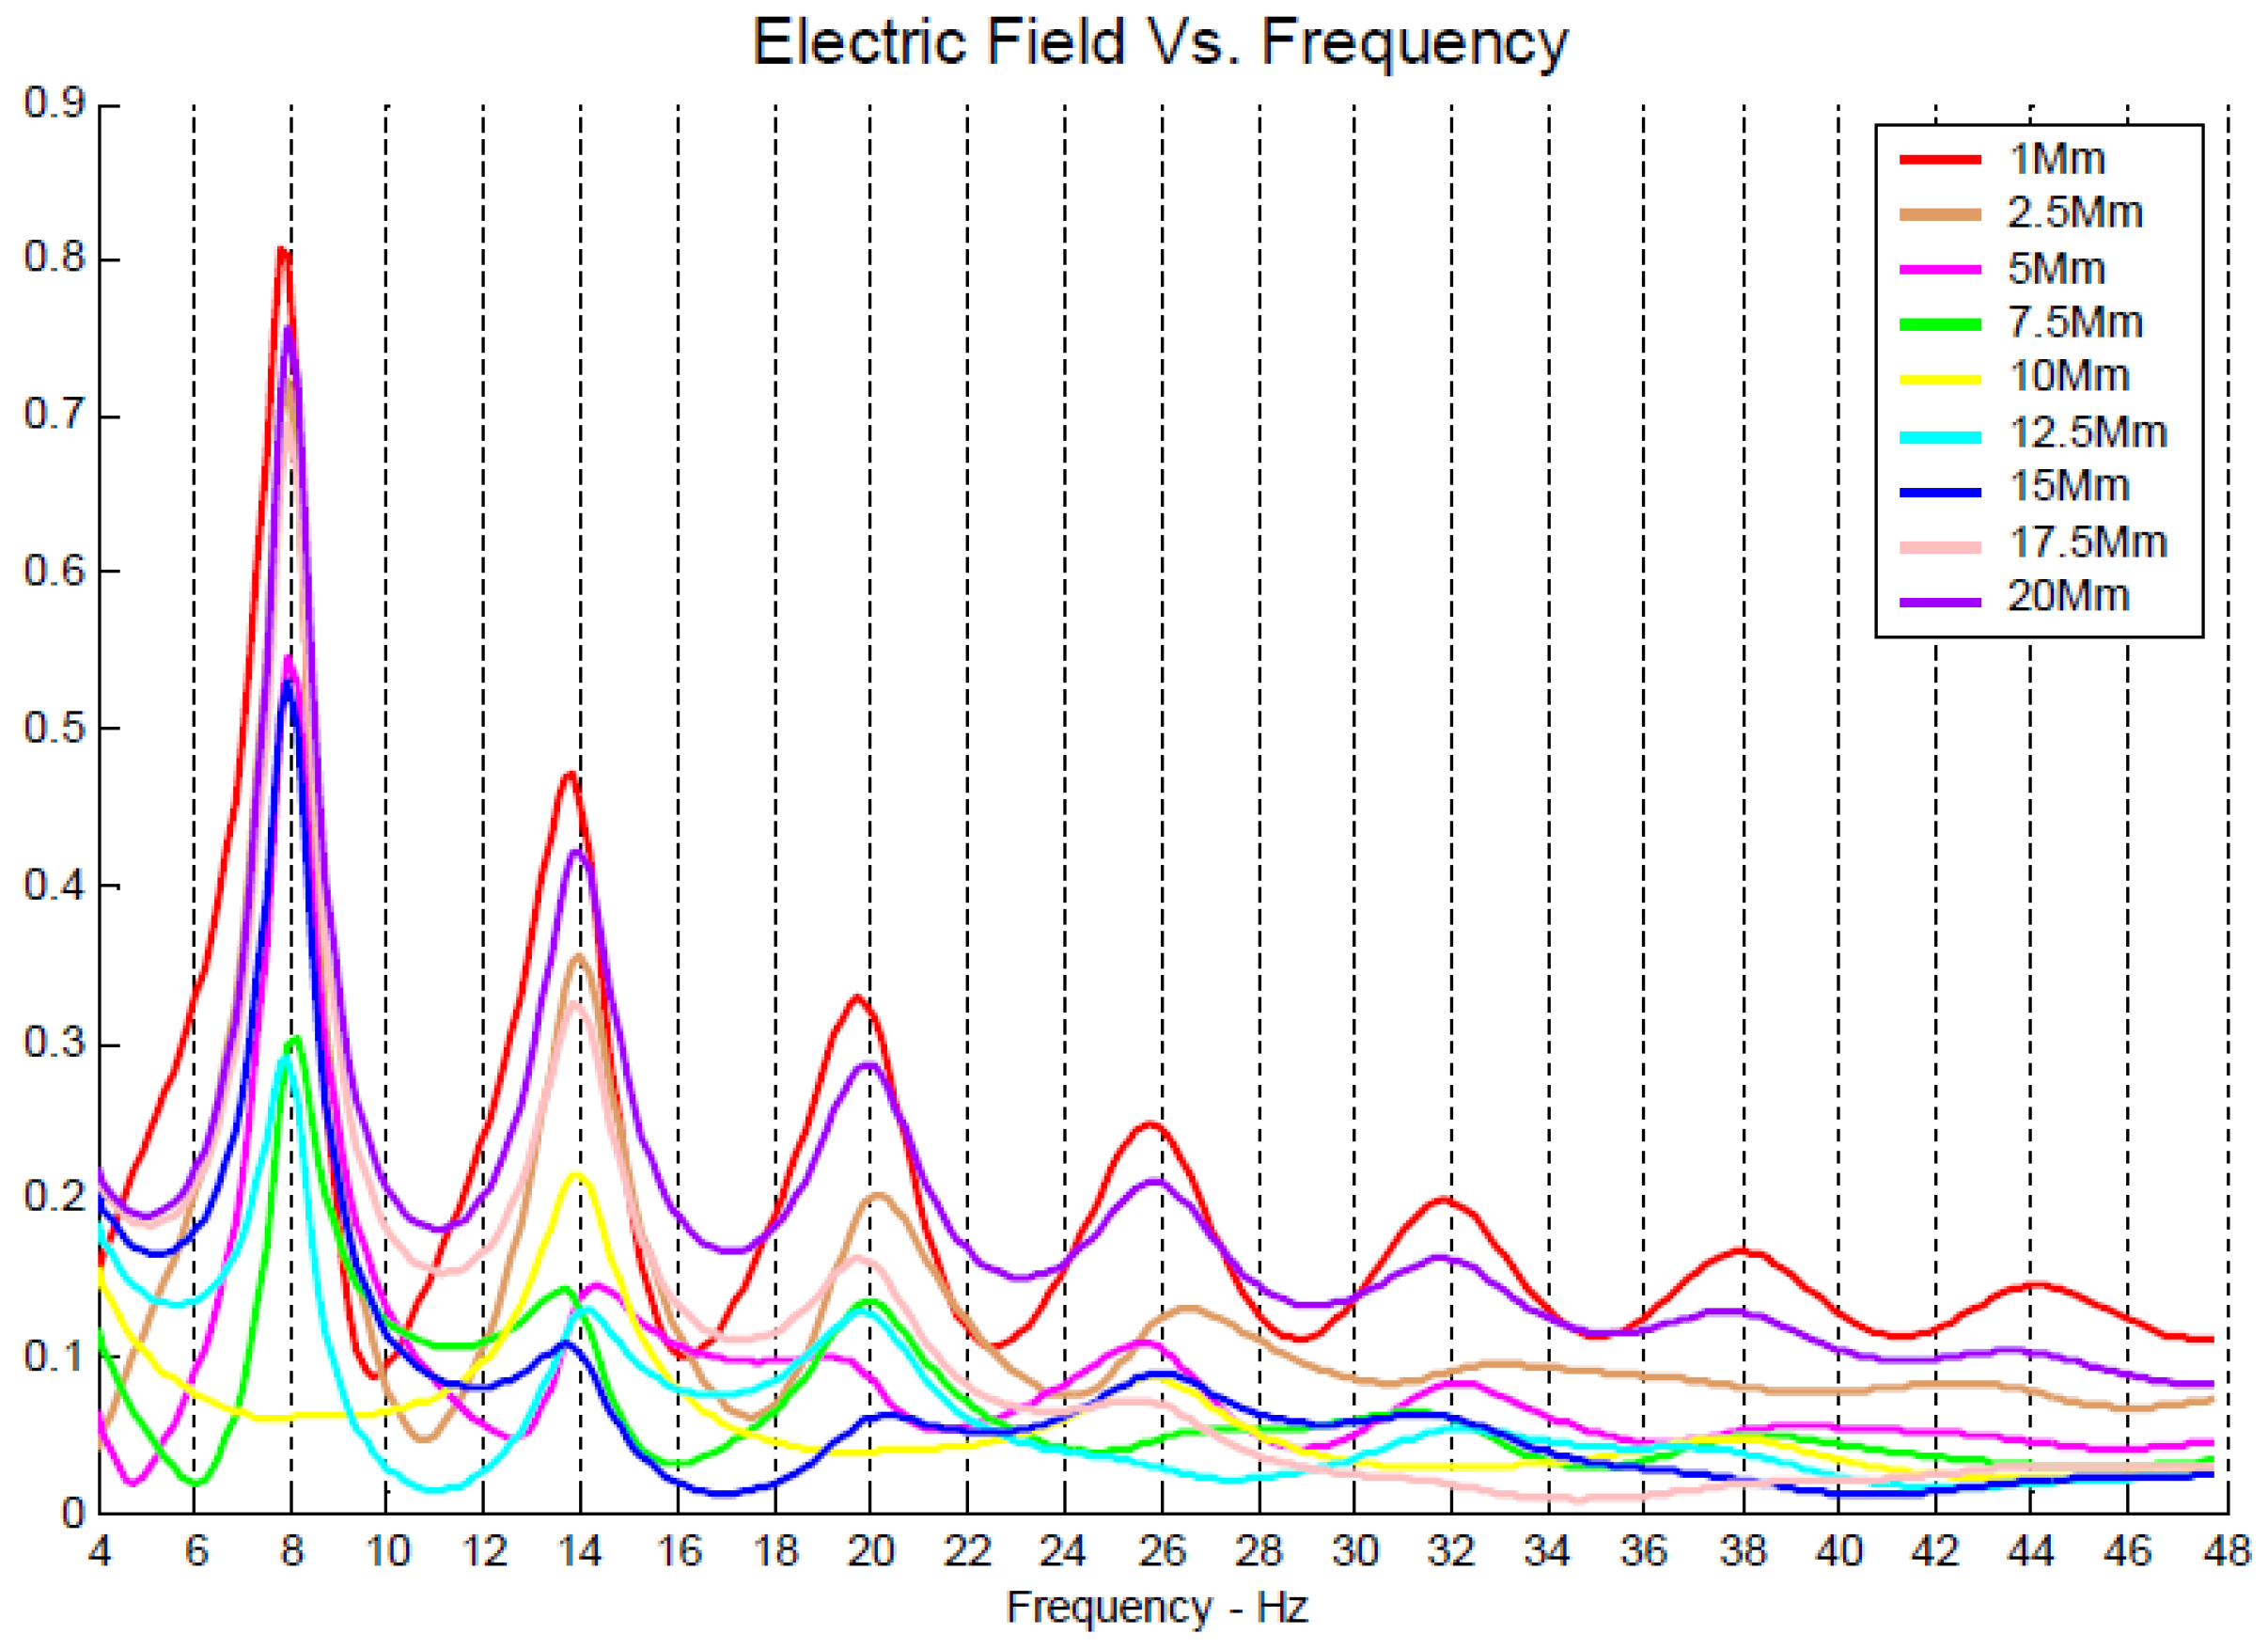
2. Theoretical Background
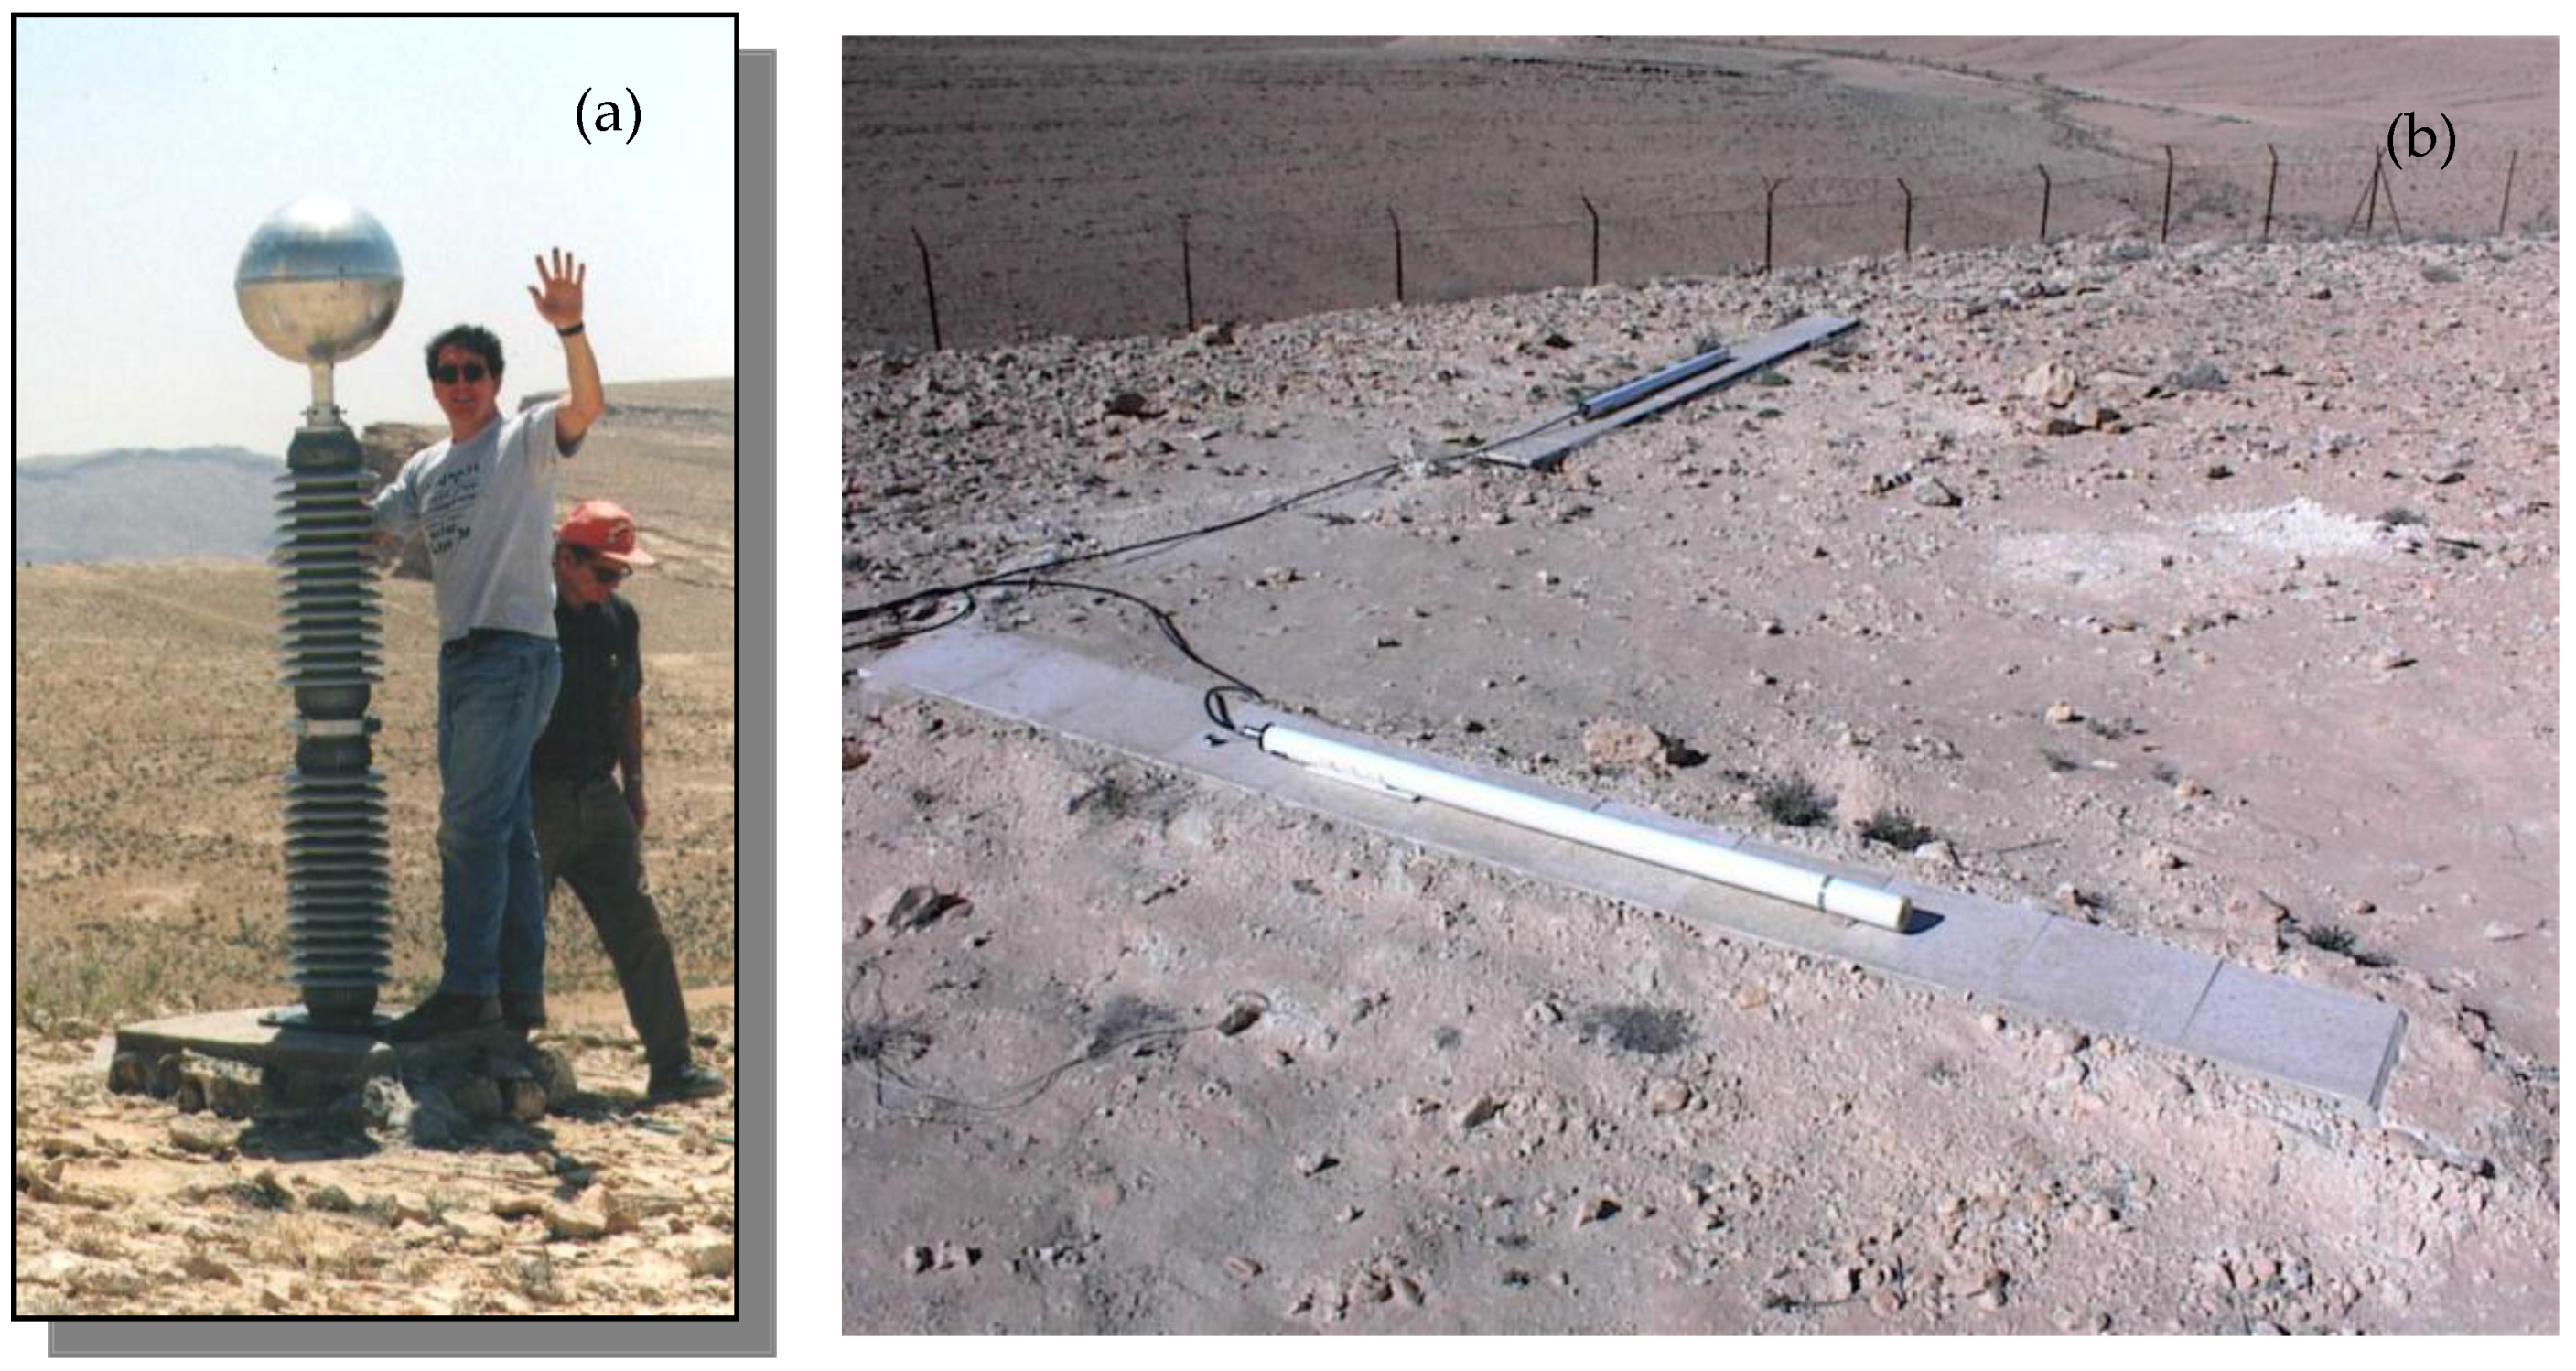
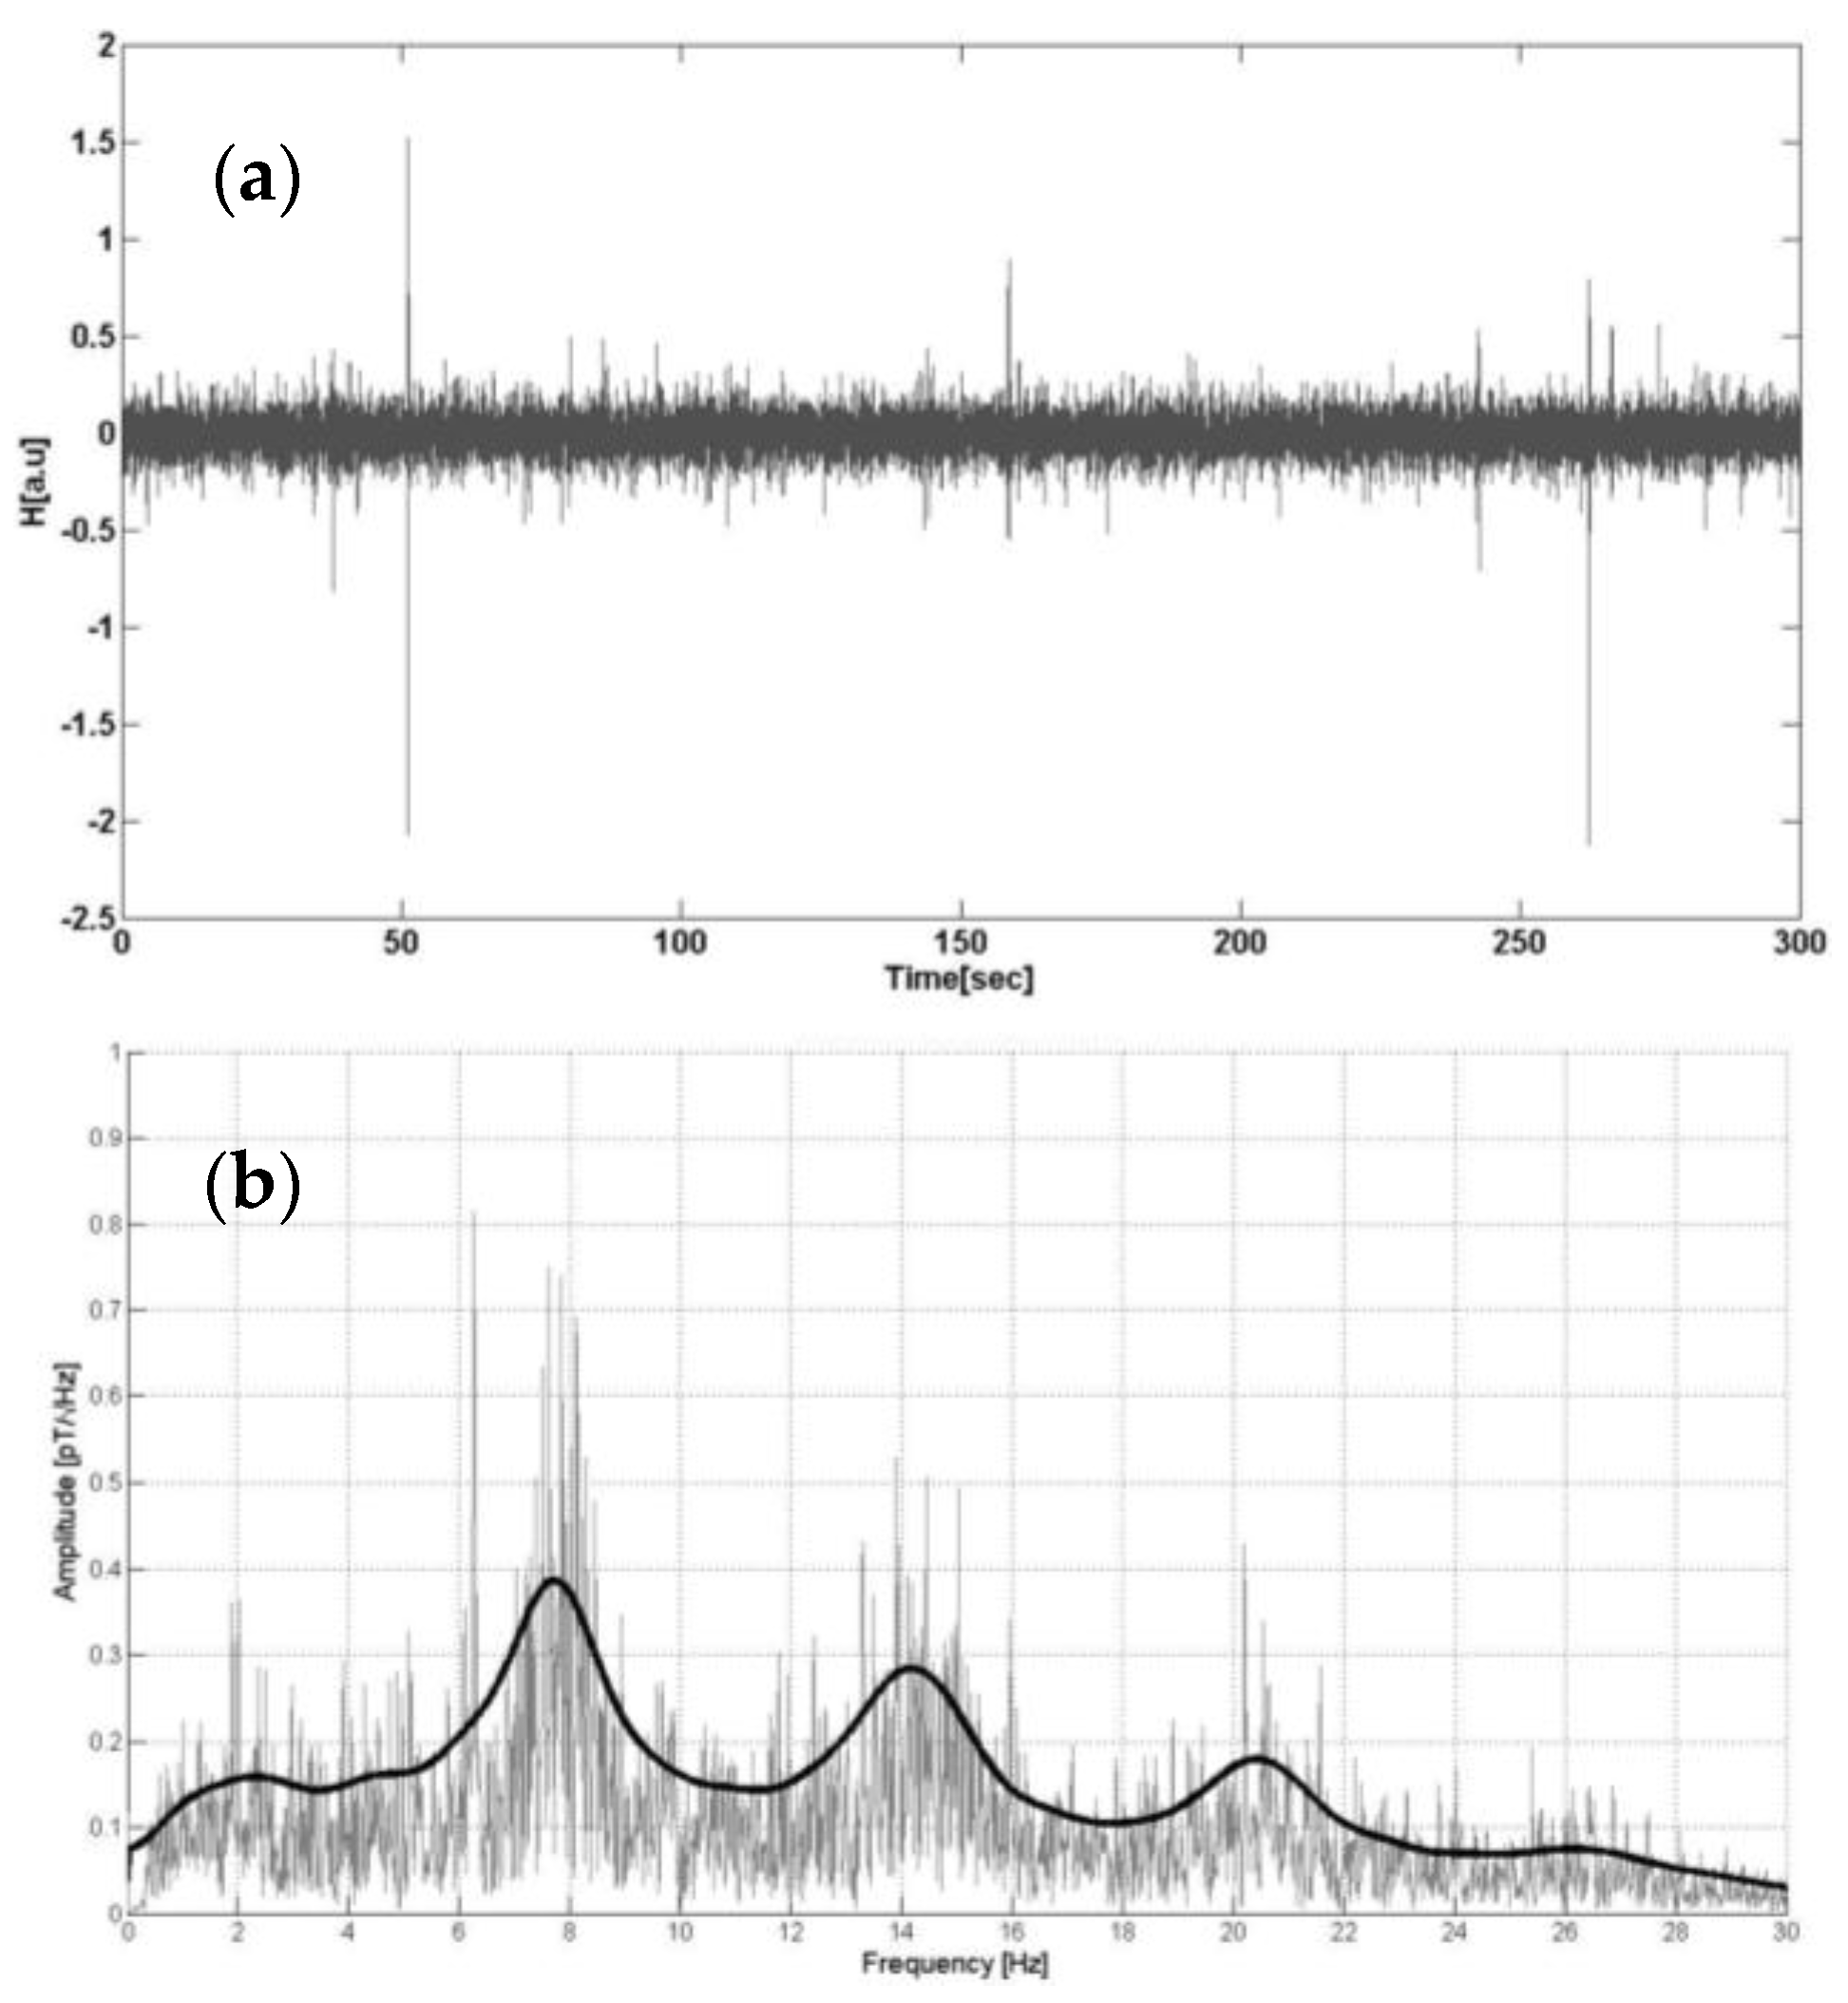
Lightning discharges are considered as the primary natural source of SR. The vertical lightning channels behave like huge antennas that radiate electromagnetic energy at frequencies below 100 kHz [32]. While the maximum radiated energy occurs around 10 kHz, the attenuation at these frequencies is about 10 dB/Mm. Hence these frequencies can only be detected at a range of thousands of kilometers from the lightning discharge. While lightning signals below 100 Hz are very weak, the attenuation is only 0.5 dB/Mm, and hence the electromagnetic waves from an individual discharge can be propagated a number of times around the globe before decaying into the background noise. For this reason, the Earth-ionosphere waveguide behaves like a resonator at ELF frequencies, and amplifies the spectral signals from lightning at the resonance frequencies due to constructive interference of EM waves propagating around the globe in opposite directions [32]. The resonance peaks occur when the wavelength of the ELF waves is comparable with the Earth’s circumference (~40,000 km), with the direct and antipodal waves resulting in constructive interference at the SR frequencies.
For the simplest model, one can consider the terrestrial waveguide was an ideal one, made of two perfectly conducting concentric spheres separated by height h, which is much smaller than the Earth’s radius a. Then the resonant frequencies fn are determined by the Earth’s radius and the speed of light c (Equation (1)) [2]. Even Schumann made these assumptions and arrived at the expected SR first mode of 10 Hz. However, the Earth-ionosphere waveguide is not a perfect electromagnetic cavity. The ELF radio waves are partially reflected over a relatively large interval of altitudes. Heavy ions and ion complexes play a major role in determining the losses due to the finite ionosphere conductivity, resulting in the system resonating at lower frequencies than would be expected in an ideal case (7.8 Hz), with observed peaks wider than expected. In addition, there are a number of horizontal asymmetries: day–night transition, latitudinal changes in the Earth magnetic field, ground conductivity, polar cap absorption, etc. that complicate the SR power spectra.
f n = ( c / 2 π a ) n ( n + 1 )   n = 1 , 2 , 3 ,
The problem of wave propagation in the Earth-ionosphere cavity is most naturally formulated in spherical coordinates (r, θ, φ). The excitation source is represented by a vertical dipole with a current moment (Ids) located between two concentric spherical shells at θ = 0. The radius of the inner shell, the Earth, is denoted by r = a and the radius of the outer shell, the ionosphere, by r = a + h, assuming a sharp and frequency independent upper boundary. Both the observer and the source are assumed to be located on the Earth’s surface. Maxwell’s equations are then solved assuming time dependence of eiωt and requiring continuity on the boundaries (ground-cavity transition at r = a, and cavity-ionosphere transition at r = a + h). Below the waveguide cutoff frequency (~1.5 kHz) only a single zero-order mode propagates in the cavity, often referred to as the TEM mode. On a perfectly conducting ground, only two field components exist: the vertical electric field and the horizontal magnetic field. The electric and magnetic components of the waves can be represented as zonal harmonic series [33]:
E r = i I d s 8 π a 2 ε 0 f ν ( ν + 1 ) h P ν 0 ( cos θ ) sin ν π ; H φ = I d s 4 a 1 h P ν 1 ( cos θ ) sin ν π
In Equation (2), ε0 is the free space permittivity and Pν are the associated Legendre functions. The source–observer distance (SOD) is measured in radians and represented by θ. The complex parameter ν is the propagation constant calculated in terms of the complex sine of the wave incidence angle S via [34]:
S 2 = ν ( ν + 1 ) / ( k 0 a ) 2
where k0 is the free space wave number. The dimensionless quality factor Q of the resonant cavity may be determined as a ratio between the stored energy and the energy loss per cycle. Considering only the electrically stored energy [34]:
Q = Re S 2 Im S
On Earth, the resonance is characterized by a quality factor Q ranging from 4 to 6 [35].
The resulting fields are shown in Figure 1 for the first three SR modes. For a single lightning discharge, the E-field always has a maximum at the location of the flash and the antipode, while the magnetic field (orthogonal to electric) has a minimum at the same locations, regardless of the mode. This feature follows from the conservation law of the total electromagnetic power which is equally distributed in the cavity, so that a maximum in one field occurs at the minimum of the other field.
For other locations on the sphere, the relative intensity of the electric and magnetic fields depends uniquely on the source–observer distance (SOD). In Figure 2, the theoretical spectra for the vertical electric field, as a function of different SODs, are shown. These spectra are based on the solution of Equation (2) above, using an isotropic uniform cavity with standard conductivity profile and current source. At a distance of 10 Mm from the source lightning (yellow curve), the electric field shows a minimum intensity at 8 and 20 Hz (n = 1, 3) while a maximum occurs at 14 and 26 Hz (n = 2, 4). Every distance has a specific spectral pattern in both the electric and magnetic fields, a characteristic often used in SR geolocation of intense lightning flashes using a single station [28,29,36,37,38,39,40].
More realistic models are far more complex. Methods of introducing more complicated ionosphere structure include two-layer [41] and multi-layer models [42,43,44,45], and the more realistic two-exponential [46], “knee” [47], and “multi-knee” [24] profiles. In recent years, more complicated 3-D transmission line modeling of the SR has been attempted [48] as well as 3-D finite difference time domain (FDTD) models [49], while alternative conductivity profiles of the cavity have been proposed for use in models [50,51].

3. SR Measurements

The electromagnetic sensors used to measure Schumann resonances normally consist of two horizontal induction coils for detecting the horizontal magnetic field in the north—south (HNS) and the east—west (HEW) direction, and one vertical antenna for observing the vertical electric field, EZ (Figure 3). This is due to the assumption that in the far field, the horizontal electric-field (and vertical magnetic field) tends to zero. Recently, it was shown that this assumption may not be completely justified, with new observations showing significant amplitudes in the vertical magnetic fields of the SR [52]. It is assumed that anisotropic conductivity of the Earth’s crust can result in part of the SR amplitudes being hidden in the horizontal electric (and vertical magnetic) field. The vertical electric component is commonly measured with a ball antenna [53], connected to a high-impedance amplifier. The magnetic induction coils consist of tens of thousands of turns around material with very high magnetic permeability. The measured ELF AC fields are very small (mV/m for the electric field, and pT for the magnetic fields) compared with the DC static electric and magnetic fields in the atmosphere which ranges from 100 V/m in fair weather to a few 1000 V/m on a stormy day, and the Earth’s magnetic field of 50,000 nT.
Man-made noise produces various interferences in the ELF band, from high voltage power supply lines to traffic and pedestrians [35], forcing us to locate SR measuring stations in isolated rural areas, away from industrial activity. When choosing a site, the electromagnetic field sensors should be located as far away from power supply lines as possible. Complete battery power supply is preferable, but is expensive and limits long-term monitoring. Open spaces with uniform underlying geology and high soil conductivity should also be considered [35]. Since the sensors are exposed to external static electric and magnetic fields, even the slightest vibration of an antenna will result in huge signals induced at the input of the receiver. Hence the horizontal magnetic antennas should be buried in the ground to avoid the signals induced by ground vibrations or wind. Ideally, electric and magnetic channels should be identical, being calibrated periodically, sampled using a 16 bit A/D (analog-to-digital) converter, equipped by a GPS clock for time stamping the data, and if necessary, a notch filter for reducing the anthropogenic 50 Hz (or 60 Hz) interference. The sampling frequency can vary from several tens of Hz to a few hundreds of Hz in order to cover the SR band without aliasing. It is advisable to save all raw data for later post-processing, although some groups use real-time analysis and save only the spectral parameters of the SR (peak frequency, peak amplitude, and Q-factor) [54], together with short time segments of ELF transients.
In the time domain, the electric and magnetic signals produce a constant background signal, which is a superposition of individual pulses arriving from about 50 random lightning flashes per second occurring all over the world [55]. These intense transient pulses from individual powerful lightning discharges have amplitudes often ten times higher than that of the background noise (Figure 4a) [56]. After processing the time series by using the Fast Fourier Transform (FFT) algorithm, SR modes can usually be observed in the frequency domain at 8 Hz, 14 Hz, 20 Hz, 26 Hz, etc. (Figure 4b). For studies of global lightning activity, the SR spectra are normally fitted to a set of Lorentzian curves [54,57,58] where the curve for each mode is described by three parameters: peak amplitude, peak frequency and the quality factor.
As mentioned above, the duration of data collection of up to 10 min is needed to obtain stable estimates of the SR spectrum. Nickolaenko and Hayakawa [35] suggested that this may explain the unsuccessful early experiments [6] to detect the global resonances: the natural signal is actually random “noise”, and the resonance peaks become visible only after relatively long integration time. A 10 min interval was used in the first successful experiment [7,8]. While SR observations have been ongoing for many years in Hungary [59], USA [26], Japan [60], and Israel [54], recently new observatories have been opened in Poland [61], India [62], China [63,64], Greece [65] and Spain [66].

4. Applications of SR Research

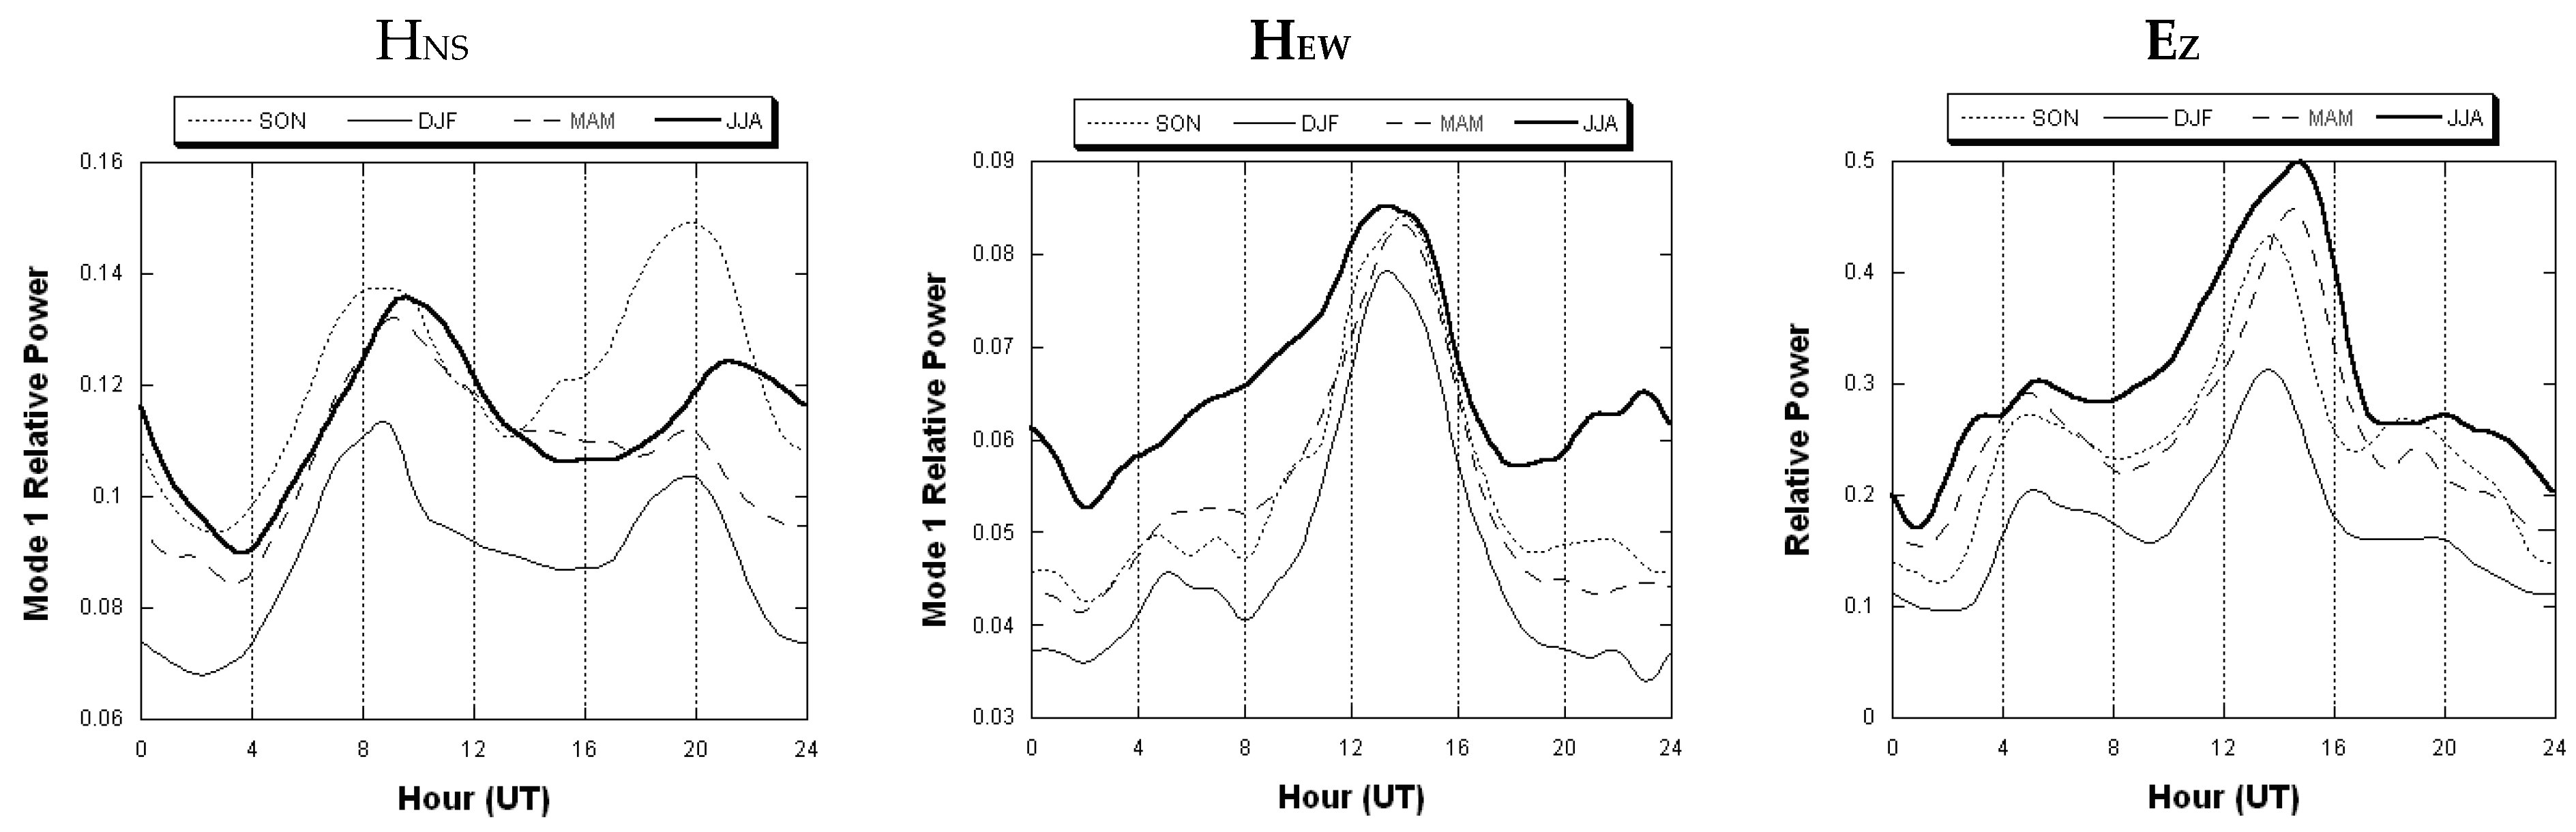
4.1. SR Background Observations of Global Lightning Activity

At any given time there are about 2000 thunderstorms around the globe [18,20,26,53,67,68,69]. Producing ~50 lightning flashes per second [55], these thunderstorms create the background SR signal.
Determining the spatial lightning distribution from the background SR records is a complex problem: in order to properly estimate the lightning intensity from SR records it is necessary to account for the distance to sources. The common approach to this problem is based on the preliminary assumption of the spatial lightning distribution. The most widely used approaches are the models of the three thunderstorm centers—Southeast Asia, Africa and South America [20,70,71,72,73,74], and a single thunderstorm center traveling around the globe [35,75,76]. An alternative approach is placing the receiver at the North or South Pole, which remain approximately equidistant from the main thunderstorm centers during the day [38]. A new distinct method, not requiring preliminary assumptions on the lightning distribution is based on the decomposition of the average background SR spectra, utilizing ratios between the average electric and magnetic spectra and between their linear combinations [77,78].
Some of the earliest studies were made during the 1950s and 1960s showing that SR field power variations were related to global thunderstorm activity [9,17,79,80,81]. Thus SR measurements became a convenient tool for studying global lightning activity [26,54,70,82,83,84,85,86]. However, owing to its low frequency, the SR are sensitive mainly to lightning discharges with substantial continuing current. Figure 5 shows the daily mean values of the first SR mode (8 Hz) measured simultaneously in Israel and California, over a 25-day period [87]. The agreement is quite remarkable given that the instruments, data acquisition, and software algorithms were entirely independent of each other. This agreement is further evidence of the global nature of the SR, and its value of studying global lightning variability and trends.
The best-documented features of the Schumann resonance phenomenon are the diurnal variations of the background SR power spectrum. Figure 6 shows the four-year (1999–2002) mean diurnal and seasonal power variations of the first SR mode from the Mitzpe-Ramon (MR), Israel ELF station, after fitting the data with Lorentzian curves. The geographical location of the MR site (32°N, 34°E) results in the clear spatial and temporal separation of the three main thunderstorm source regions. Two maxima in the HNS component are easily identified around 9:00 and 20:00 UT and are associated with increased thunderstorm activity from Southeast Asia and South America in the late afternoon, local time. In the HEW component there is a strong maximum around 14:00 UT associated with the peak in afternoon African lightning activity. The three dominant maxima are clearly seen during all seasons, associated with the three “hot spots” of planetary lightning activity. The time and amplitude of the peaks vary throughout the year, reflecting the seasonal changes in lightning activity. The electric field (EZ) sensor is sensitive to lightning activity from all directions, and hence shows a combination of all three peaks in the diurnal variations.

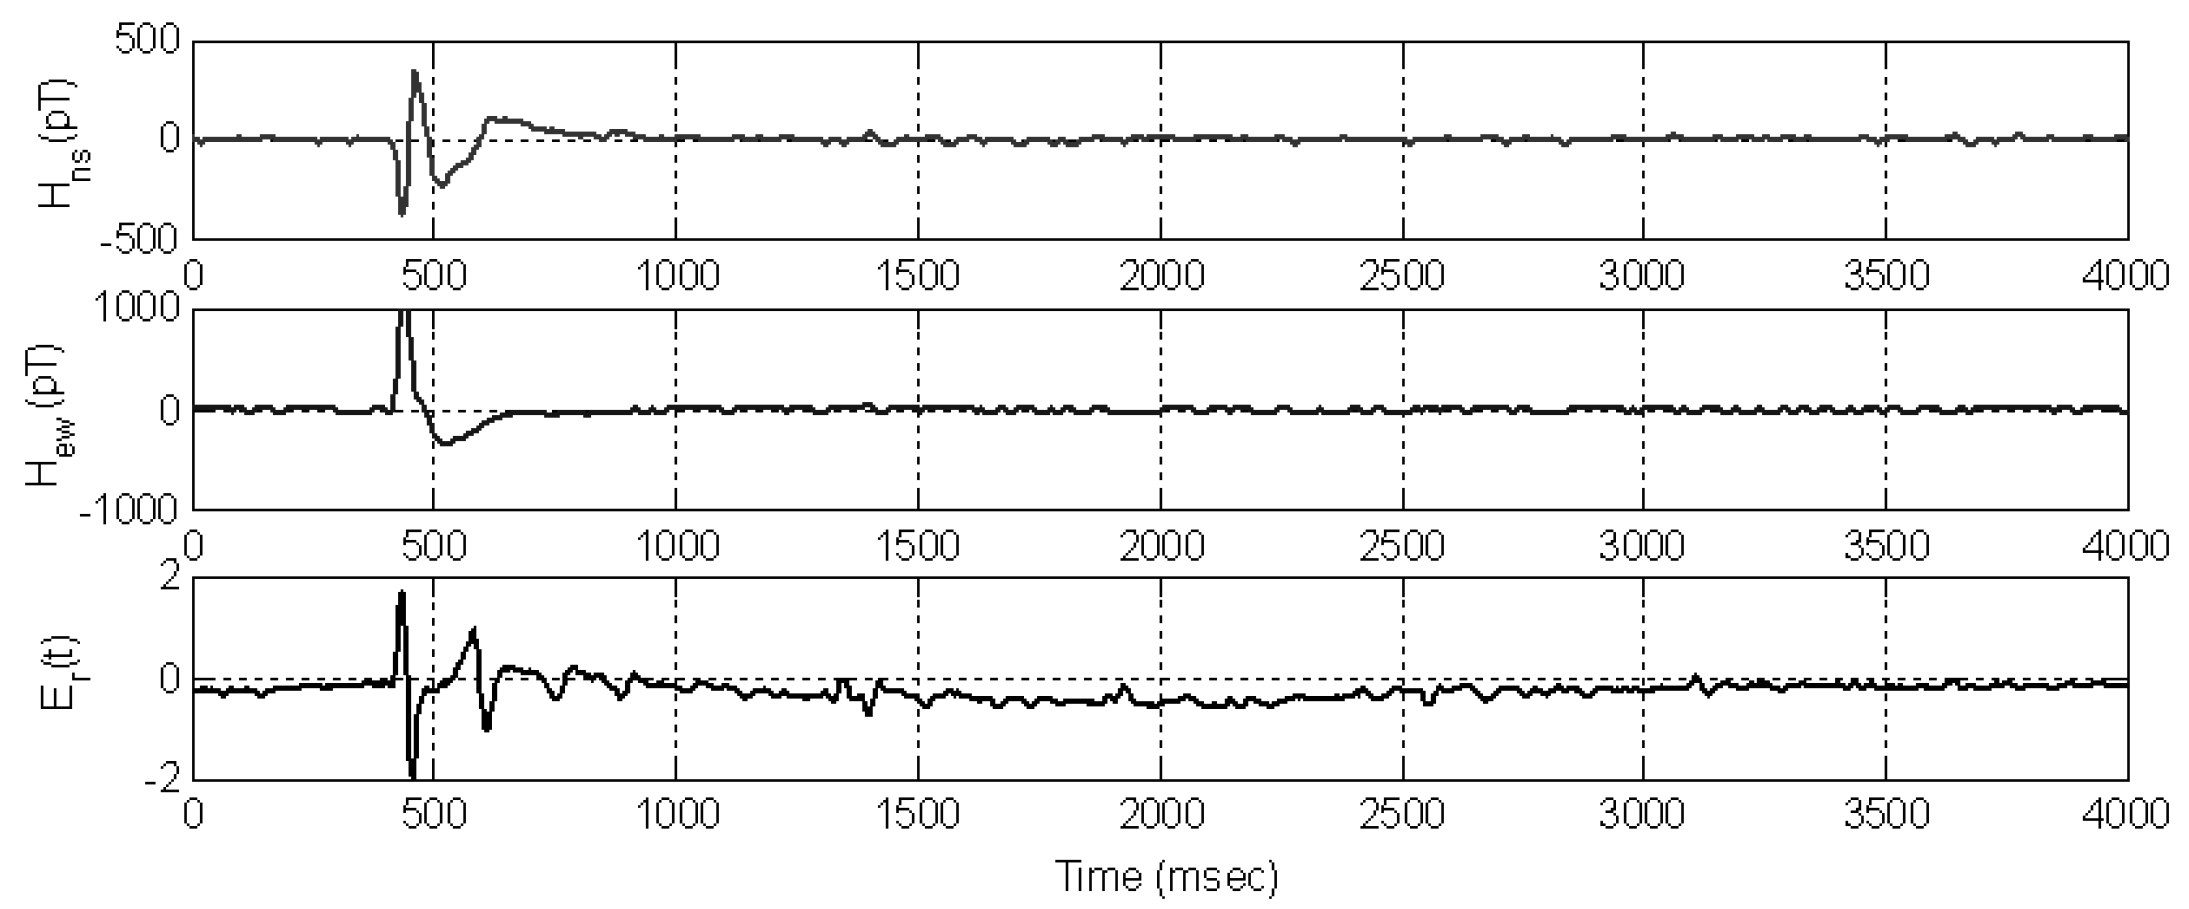
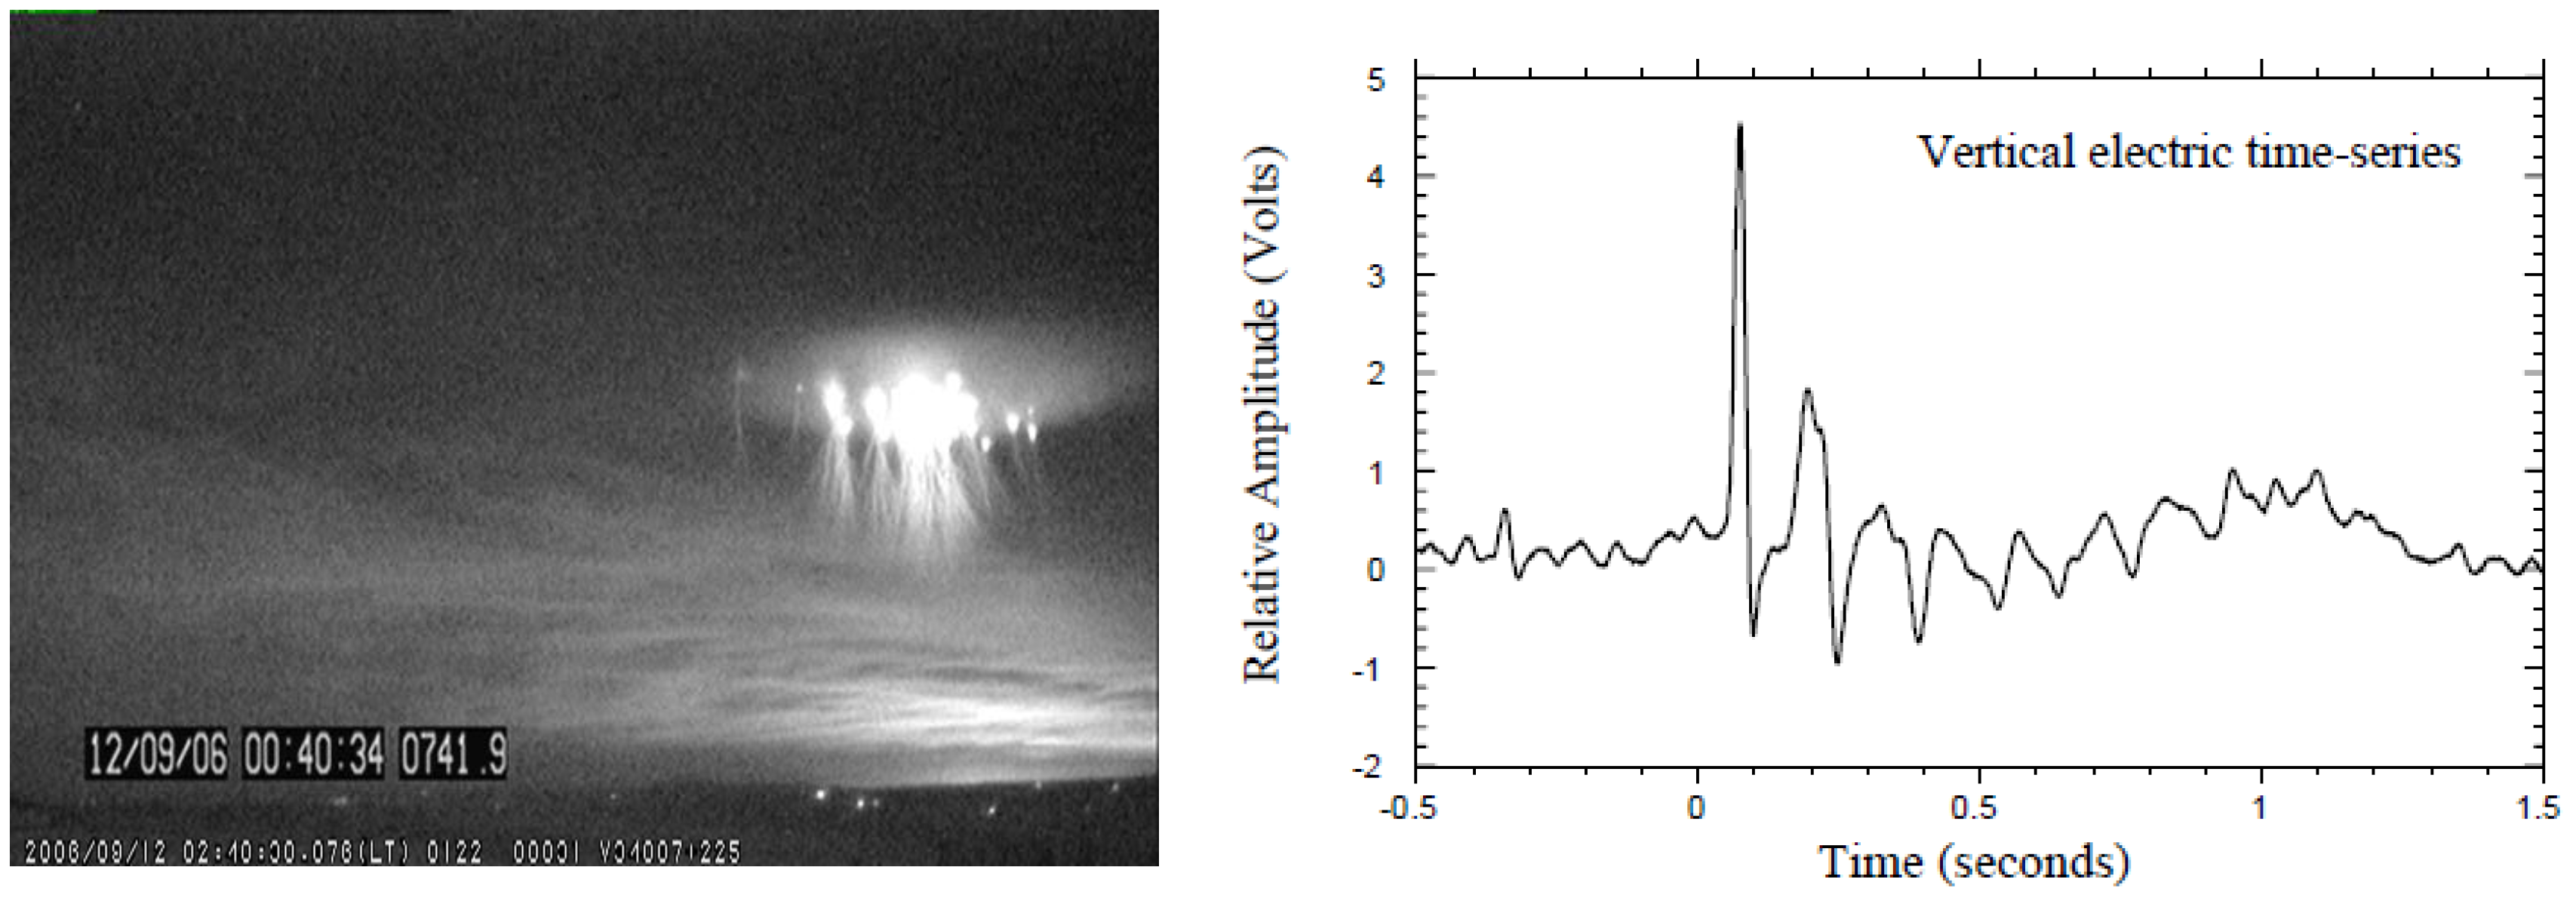
4.2. SR Transient Measurements of Global Lightning Activity

One of the most interesting problems in SR studies is determining the lightning source characteristics (the “inverse problem”). Temporally resolving each individual flash in the background SR signal is impossible due to the overlapping of many different lightning waveforms at ELF frequencies. However there are intense ELF transient events, also named “Q bursts”, that appear as prominent excursions above the SR background signal (Figure 7). Q-bursts are triggered by intense lightning strikes, associated with a large charge transfer and often high peak current [28,53,88]. Amplitudes of Q-bursts can exceed the SR background level by a factor of 10 and they appear with intervals from approximately 10 s to a few minutes [77]. This separation in time allows us to consider the Q-bursts as isolated events and to determine their source lightning locations and charge moments [36,37,38,40,75,89,90,91,92,93].
The lightning location problem can be solved with either multi-station or single-station techniques. The multi-station techniques are the more accurate, but require more complicated and expensive facilities, involving a network of direction finders or time-of-arrival sensors. Single-station systems usually combine a direction finder technique with a source–observer distance (SOD) estimation technique (Figure 2). The transients can be geolocated with SOD and/or source-bearing techniques, based on the relationship between the electric and the magnetic field components [28,29,36,39,40,94]. Source location techniques can be calibrated using the general location of flashes above continental regions [36,37], the proximity of cold cloud tops in visible and infra-red (IR) satellite images [95], global lightning measurements from space by the Optical Transient Detector (OTD) and the Lightning Imaging Sensor (LIS) [39], and local measurements of lightning with ground networks, such as US National Lightning Detection Network in North America [29]. Geolocation of the source lightning using the single station SR methodology can be identified with an accuracy of ~1 Mm anywhere on the globe.

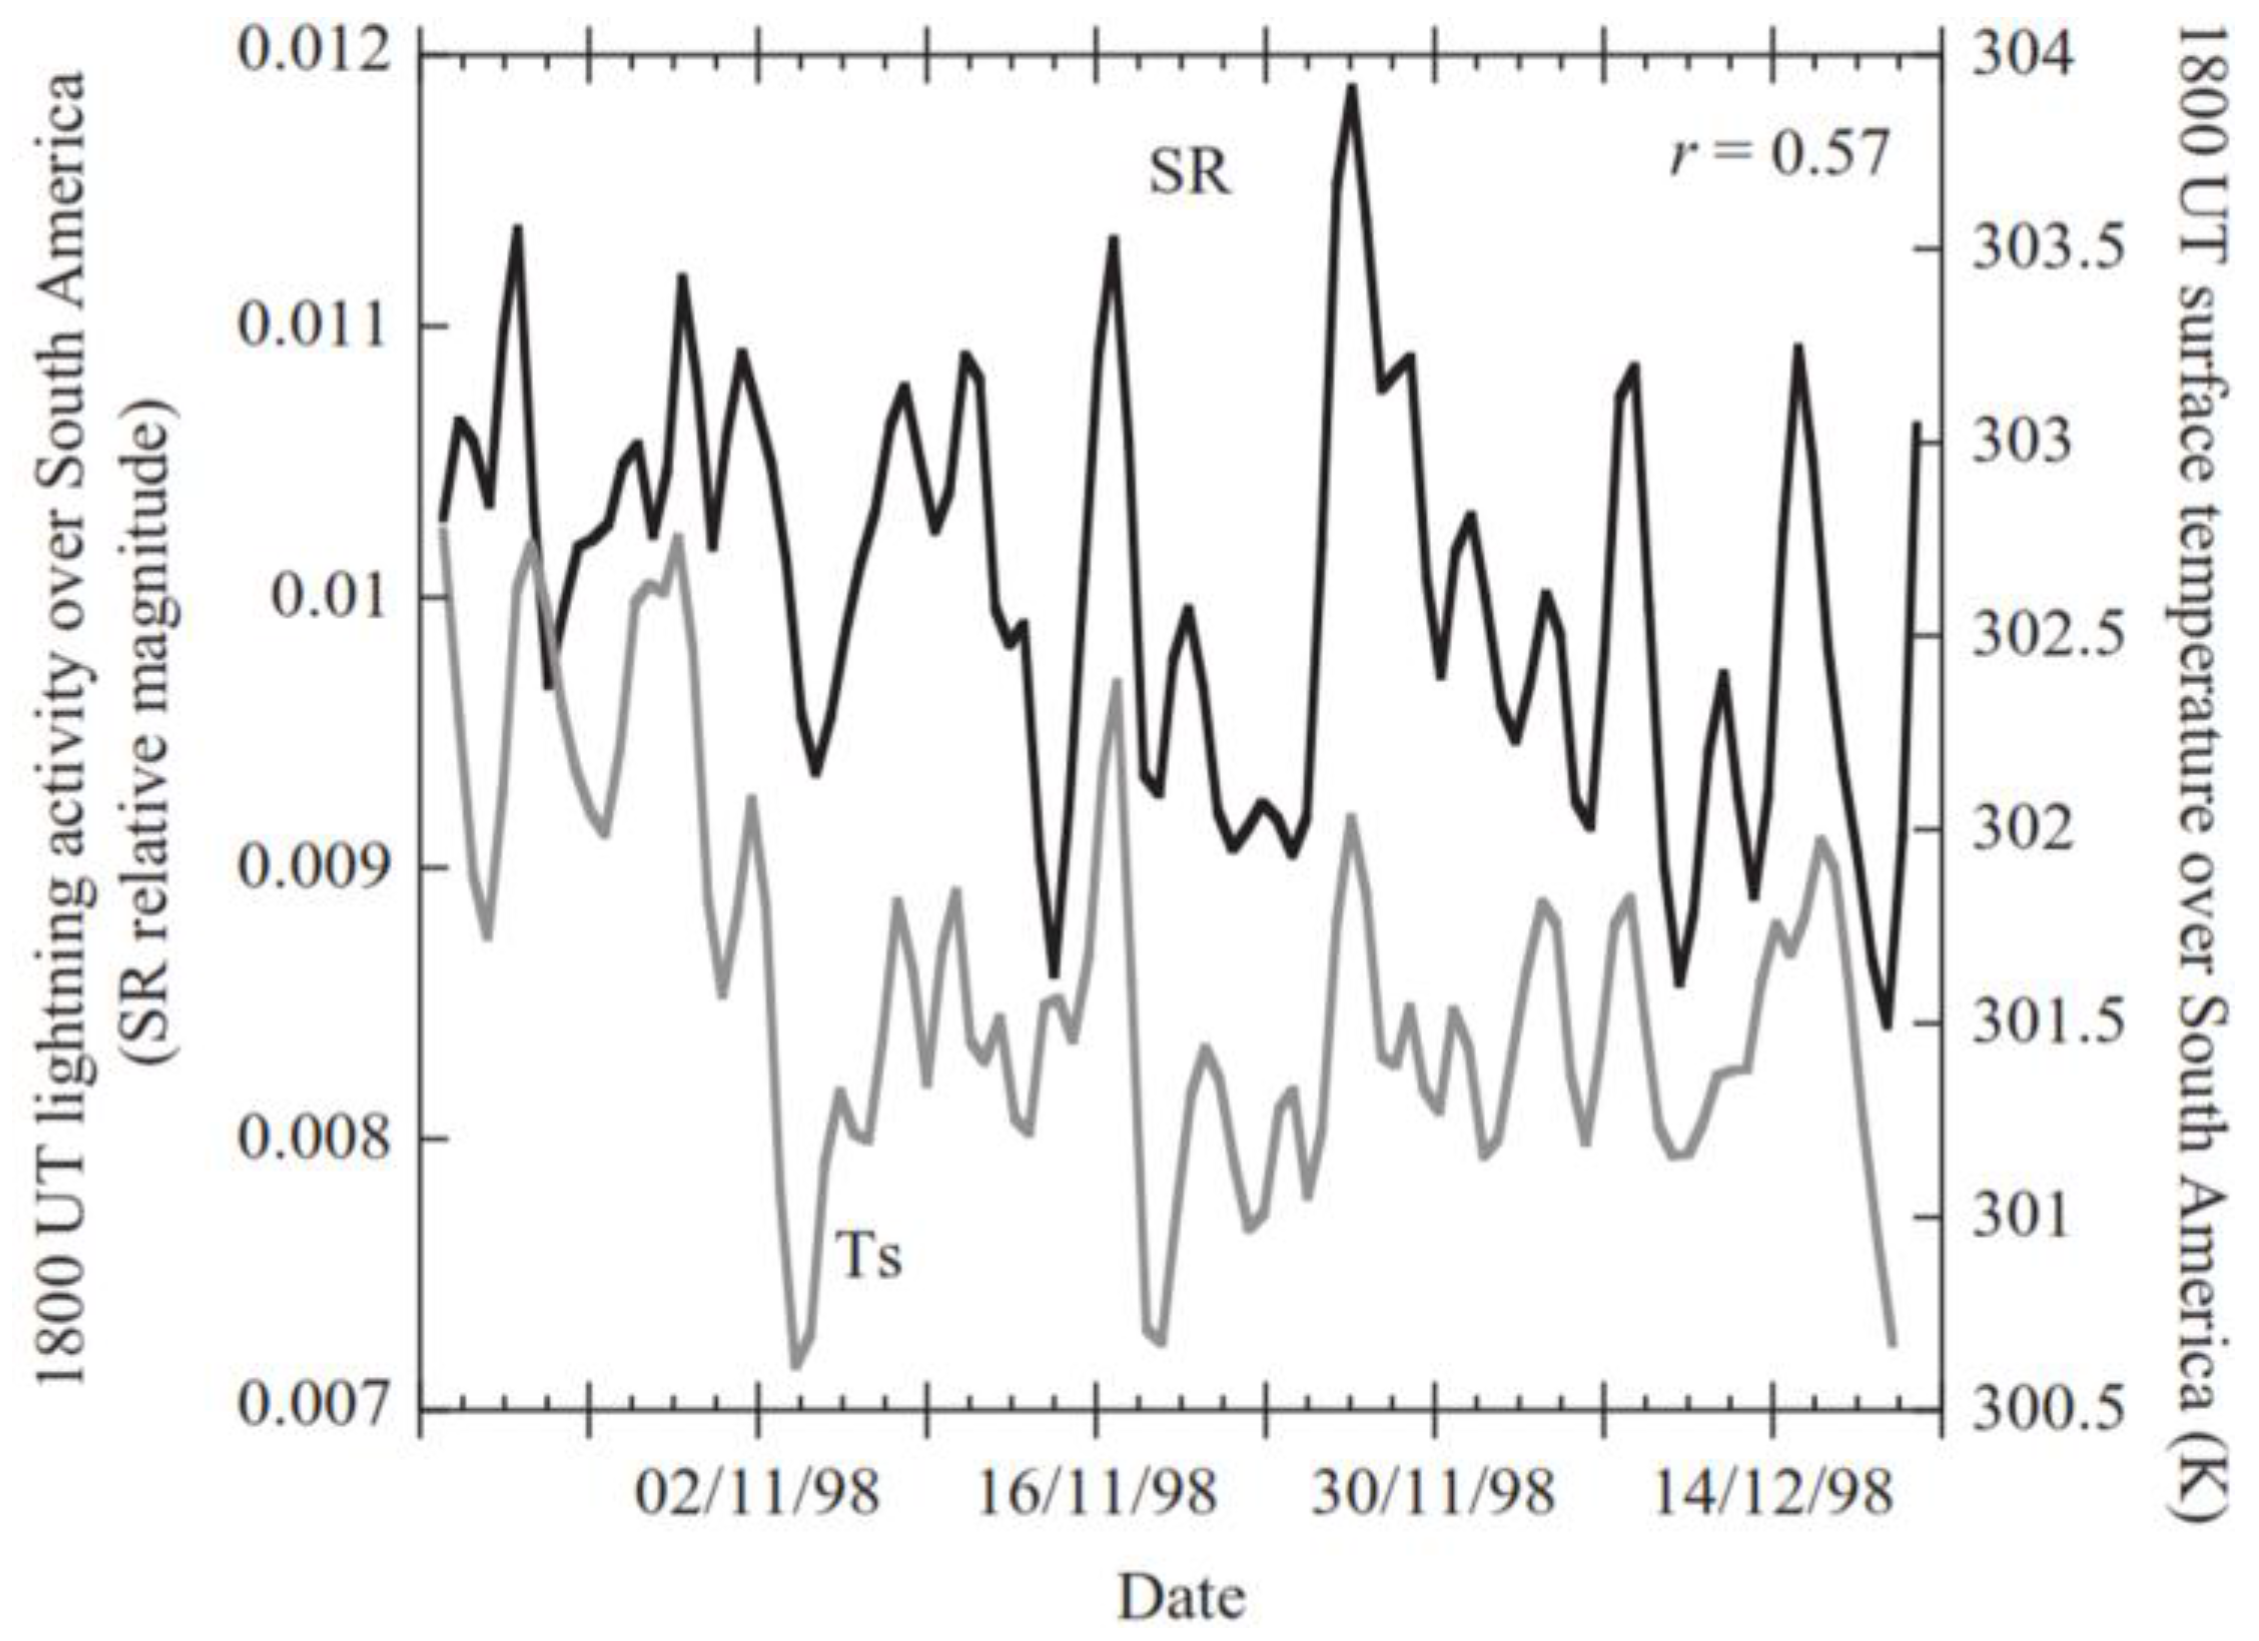
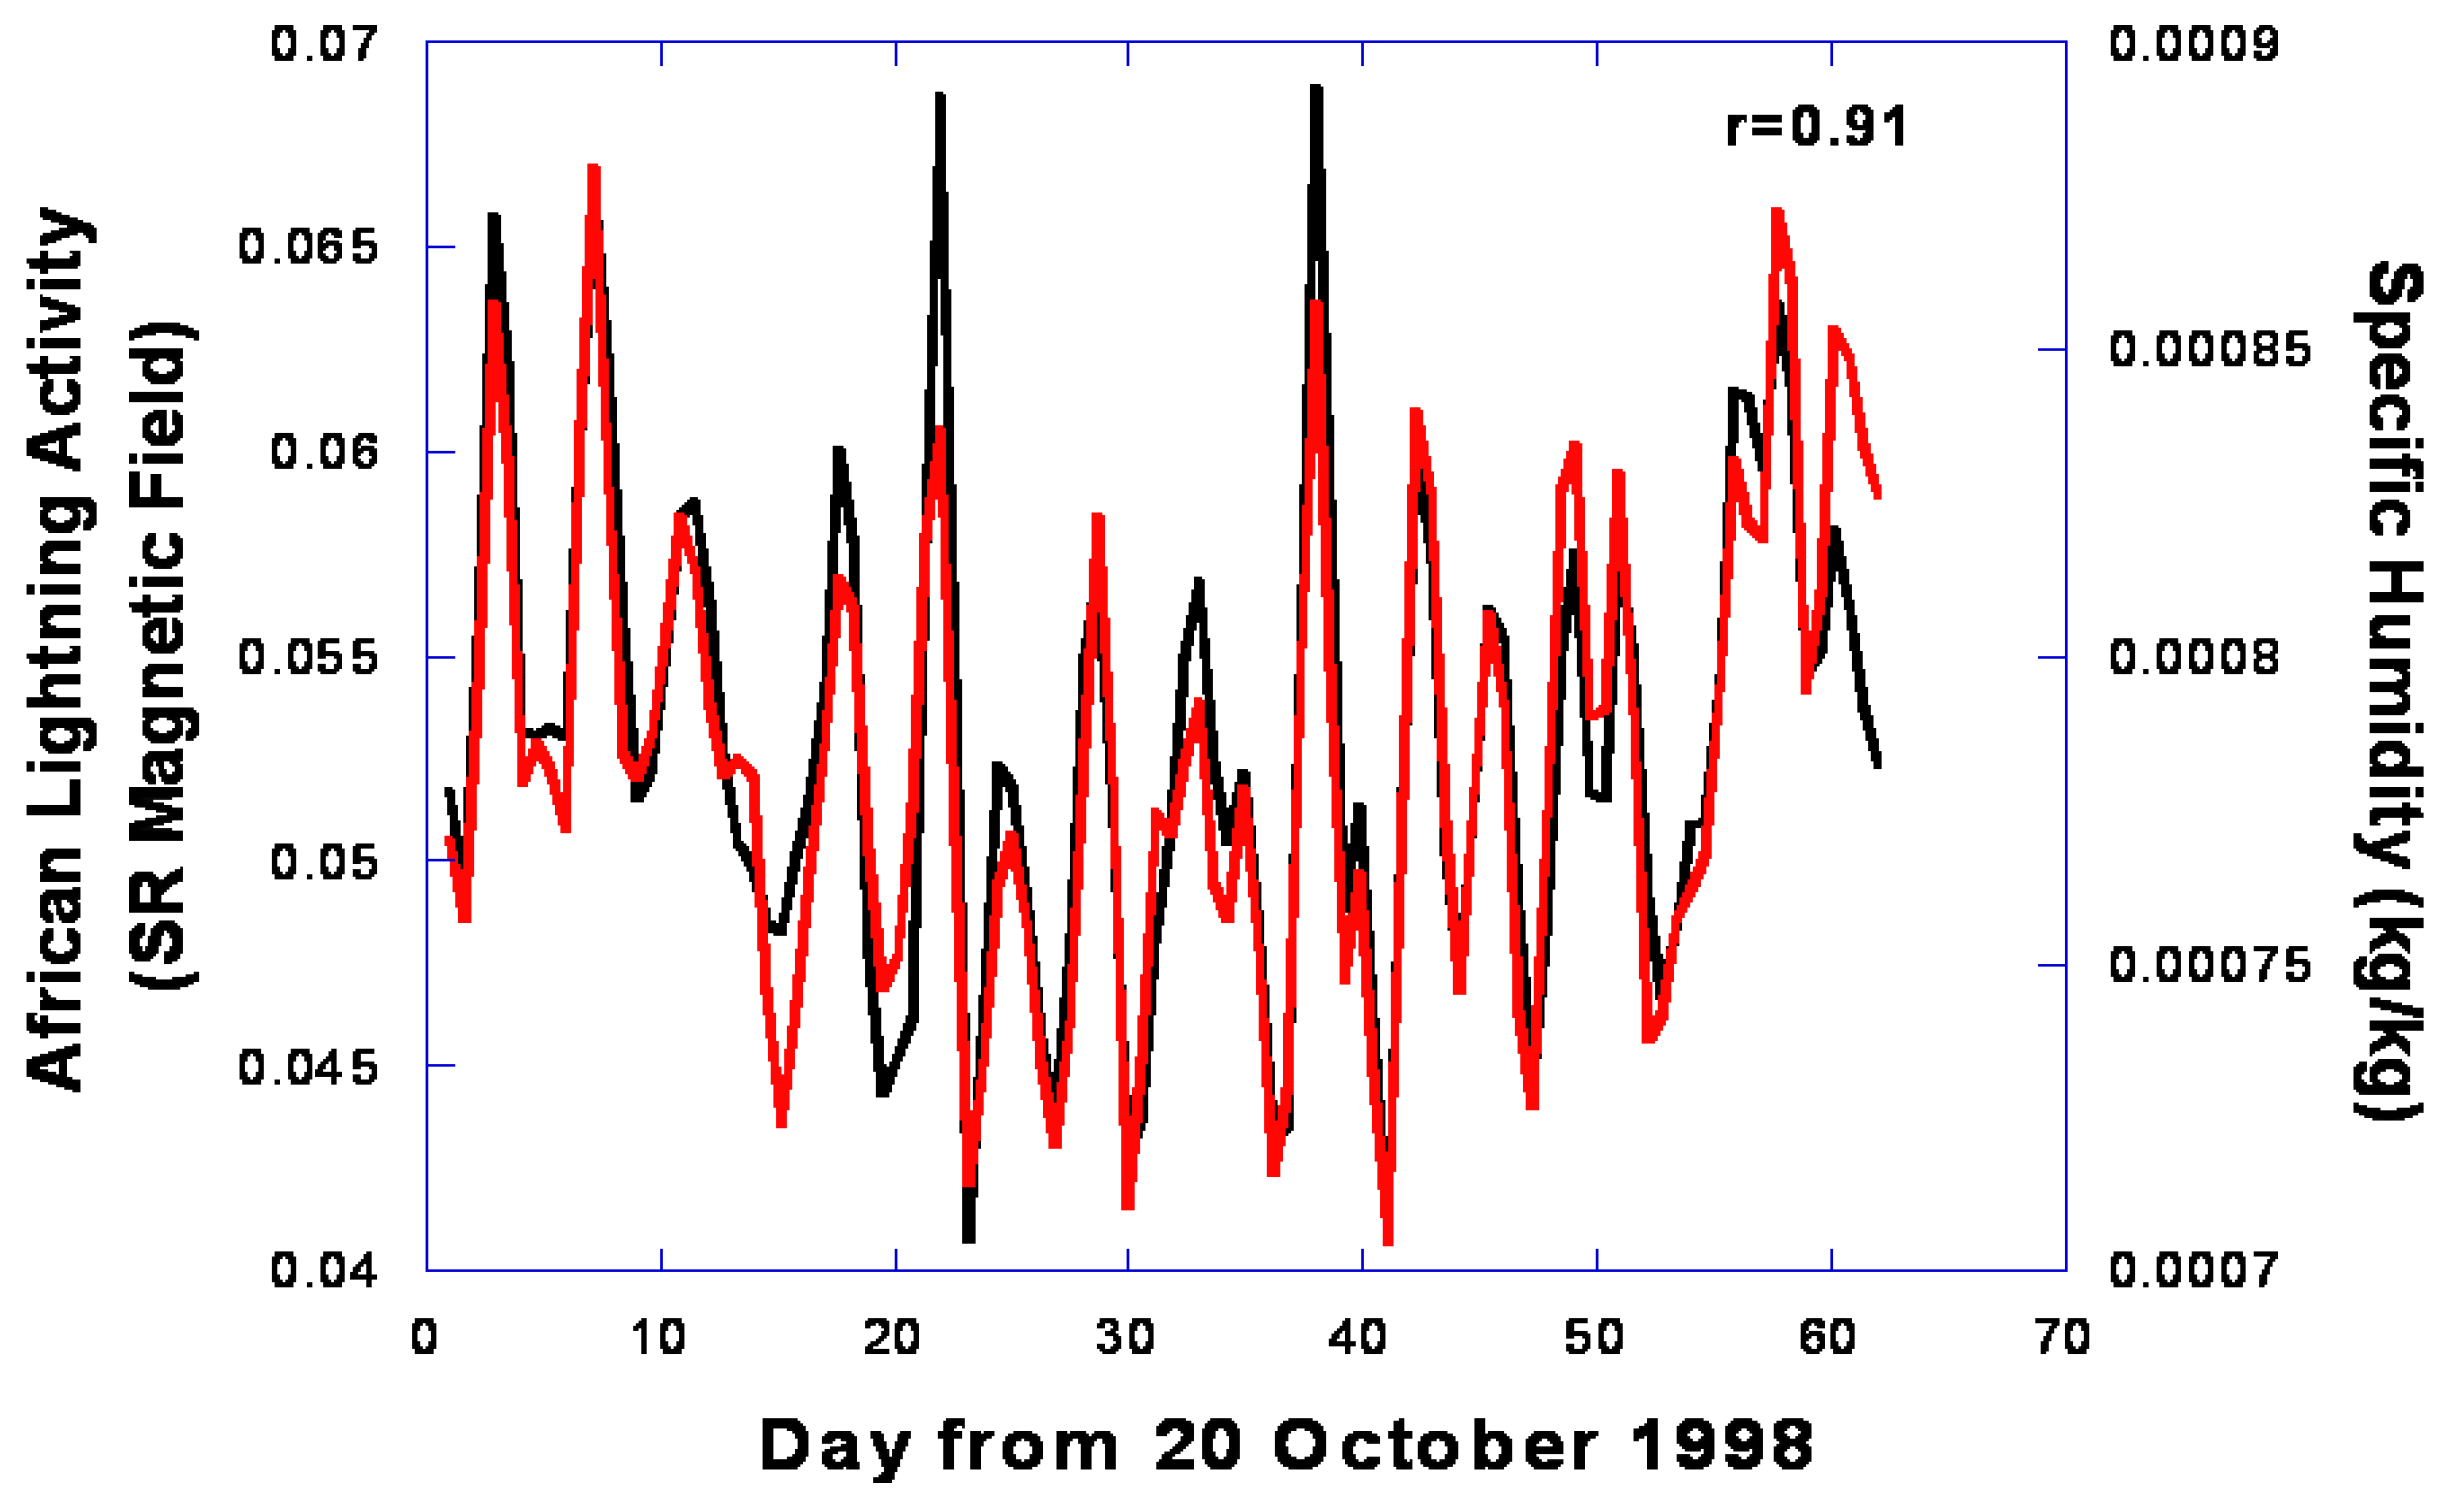
4.3. Using SR as A Climate Research Tool

The global warming of the Earth has been the subject of intense debate and concern for many scientists in recent decades. One of the important aspects in understanding global climate change is the development of tools and techniques that would allow continuous and long-term monitoring of processes affecting, and being affected by, the global climate. Schumann Resonances are one of the very few tools that can provide such global information continuously, reliably and cheaply.
Williams [26] suggested that global temperatures may be monitored via the SR. The link between Schumann resonance and temperature is lightning flash rate, which increases nonlinearly with temperature [25,26,96,97,98]. The nonlinearity of the lightning-to-temperature relation provides a natural amplifier of the subtle (several tenths of 1 °C [99]) temperature changes and makes Schumann resonance a sensitive “thermometer”. SR data sets also show strong positive correlations between surface temperatures and SR power on seasonal and daily timescales [100]. Figure 8 presents an example of daily South American lightning activity derived from observations of the 8 Hz magnetic field recorded in Israel, and surface temperatures integrated over South America. The surface temperatures were obtained from the National Center for Environmental Prediction (NCEP) reanalysis data set [101] integrated over the South American continent. Although the correlation coefficient is only 0.57, it is clear that on warmer days there is more lightning activity than on cooler days.
Monitoring and predicting global climate change requires the understanding and modeling of factors that determine atmospheric concentrations of important greenhouse gases and feedbacks that determine the sensitivity of the climate system. Continental deep-convective thunderstorms produce most of the lightning discharges on Earth. In addition, they transport large amount of water vapor into the upper troposphere, dominating the variability of global upper tropospheric water vapor (UTWV). UTWV is a key element of the Earth’s climate, which has direct effects as a greenhouse gas, as well as indirect effect through interaction with clouds, aerosols and tropospheric chemistry. UTWV has a much greater impact on global warming than water vapor in the lower atmosphere [102], but whether this impact is a positive, or a negative feedback has been debated over the past decades [103,104,105,106,107]. The main challenge in addressing this question is the difficulty in monitoring UTWV globally over long timescales. It has been shown that changes in the UTWV can be monitored from records of the SR [87,100]. Figure 9 shows an example of the connection between daily SR amplitudes and upper tropospheric water vapor over Africa, the largest source of lightning and thunderstorms on the planet. It should be noted that the UTWV curve has been shifted one day to show the agreement between the curves. The lightning activity peaks one day before the peak in the UTWV. The UTWV data are obtained from the same NCEP data base as the temperature data shown in Figure 8.
In addition to climate change, the SR has also been shown to be linked to the natural climate oscillation El Nino/Southern Oscillation (ENSO) that changes the Earth’s climate every few year [108,109]. During ENSO years the convection, and hence the lightning activity, shifts position relative to the fixed SR observing stations. Therefore, changes in SR parameters can be used to monitor the natural ENSO cycle, and the shifts in convection that occur during these events.
The above results show that two of the most important parameters of global climate change—surface temperature and UTWV—can be monitored via observations of the SR, utilizing its relation to worldwide thunderstorm activity. In addition, the Schumann resonances may also help us to understand important feedback effects in the climate system, such as the water vapor feedback in the upper troposphere. One of the great advantages of this method is the availability of long-term calibrated data sets which can provide past and future records of global lightning variations on Earth.

4.4. SR in Transient Luminous Events Research

It is now believed that many of the SR transients (Q-bursts) are related to transient luminous events (TLEs), spectacular optical flashes in the upper atmosphere above active thunderstorms. The existence of TLEs was theoretically predicted by Wilson [110], but the official discovery came with the first image captured above a thundercloud in 1989 [111]. In the last 25 years, there has been an extensive hunt for TLEs using photography from ground stations, aircrafts, satellites and space shuttles, leading to TLE documentation in different geographical locations all over the world [112,113,114,115,116,117,118,119,120,121,122,123,124].
TLEs can be classified into two main classes: sprites and elves [125], although there are also blue jets, gigantic jets, halos and trolls. Both elves and sprites are short-lived luminous events associated with active thunderstorms. Elves are dim donut-shaped glows of red light with a radius of a few hundred kilometers, lasting typically ~1 ms, and occurring at altitudes of ~90–100 km, located above the parent lightning discharge. Elves are produced by the electromagnetic pulse (EMP) of the lightning, with the intensity of elves related to the lightning peak current [126]. Sprites are also red in color (due to the excitation of atmospheric nitrogen molecules [127]), while being a lot brighter than elves. Sprites have a much longer lifetime of tens of milliseconds, and occur at lower altitudes in the atmosphere (40–90 km). Unlike the uniform featureless elves, sprites can be very varied in shapes, structure and size, with widths ranging to 50–100 km horizontally. Sprites are produced by the quasi-static electric field induced above thunderstorms immediately after large cloud-to-ground lightning [128]. In the case of sprites, the brightness appears to be related to the charge removed by the lightning, and not the peak current [129]. Since the SR transients are dominated by large charge moments, irrelevant to peak currents, the SR are better suited for studying sprites than elves [130].
The physical mechanisms responsible for sprites and elves initiation are independent of the polarity of the lightning flash [127,128,131,132,133,134]; however the vast majority of sprites are initiated by positive cloud-to-ground (CG) flashes [27,29,135,136]. These powerful positive flashes emit strong electromagnetic energy in the ELF range, indicative of continuing currents lasting over time scales of at least a few milliseconds [135], and thus can be detected in the SR band. Recent observations [27,28,29,30,91,137] reveal that occurrences of sprites and transient SR are highly correlated (Figure 10).
SR records can be used to estimate the magnitude of the charge removed from cloud-to-ground lightning [139,140,141], which appears to be one of the crucial parameters in determining which lightning discharge can produce sprites [142]. A method of charge moment estimation of sprite-inducing CG discharges from SR data [30] showed that the charge moments of sprite inducing CG discharges range from 200 to 2000 Ckm. Hu et al. [143] suggested a sprite initiation probability as a function of charge moments of positive CG discharges, and hence the charge moment estimation derived from SR data can possibly enable us to estimate the global occurrence rate of sprites. However, it should be noted that not all sprites produce strong ELF transients [144,145]. Furthermore, recent studies show that due to anisotropic conductivity of the Earth’s crust, the determination of the source direction using SR methods can have significant errors [144,146].
Since sprites are rather rare, occurring at rate of only a few per minute (while regular lightning occurs at a rate of 50–100 flashes per second around the globe) SR techniques appear to be one of the most convenient and low-cost tools for continuous TLE monitoring.

4.5. SR in Extraterrestrial Lightning Research

Existence of Schumann resonances depends generally on two factors—presence of a substantial ionosphere with electric conductivity increasing with height from low values near the surface (or a high-conductivity layer, in case of gaseous planets) to form an ELF waveguide, and a source of excitation of electromagnetic waves in the ELF range. In the Solar System, there are a number of candidates for SR detection: Venus, Mars, Jupiter, Saturn and its moon Titan [147].
The speculations that lightning occurs on Venus first arose about 40 years ago. The strongest evidence for lightning on Venus comes from the impulsive electromagnetic waves seen by the Venera 11 and 12 landers [148,149] and the Pioneer Venus Orbiter [150,151]. On Mars, lightning activity has not been detected, but charge separation and lightning strokes are considered possible in the Martian dust storms [152,153,154,155]. Jupiter and Saturn are the only planets where lightning activity is well established. Existence of lightning on Jupiter was predicted in the 1970s [156] and it was supported by data from Galileo, Voyagers 1 and 2, and Pioneers 10 and 11 [157,158]. Recently, lightning on Saturn has also been confirmed by measurements from the Cassini spacecraft [159]. Although no lightning was observed during Voyager flybys of Titan in 1980 and 1981, it was long suggested that lightning dischargers do take place on this moon of Saturn [160,161]. However, recent data from Cassini/Huygens seems to indicate that there is no lightning activity on Titan [162].
Modeling of SR parameters on the planets and moons of the Solar System is complicated by the lack of knowledge of the waveguide parameters. SR frequencies depend on the structure of the lower part of the ionosphere, which is not sufficiently known. On Jupiter and Saturn the situation is yet more complicated. Little is known about the electrical parameters of the interior of Jupiter and Saturn. Even the question of what should serve as the lower waveguide boundary is a non-trivial one in the case of these gaseous planets. To our best knowledge, there are no works dedicated to SR on Saturn. There was only one attempt to model Schumann resonances on Jupiter—in the work by Sentman [163]. Sentman’s calculations yielded resonant frequencies of approximately 0.76, 1.35 and 1.93 Hz with quality factors of roughly 7, predicting sharp, pronounced peaks.
The situation with other planets is a little better. SR on Venus have been studied by numerous groups [22,24,164,165]. All studies, based on different conductivity profiles and with different models yielded very close resonant frequencies: around 9, 16 and 23 Hz. The quality factors, though, differ substantially: Nickolaenko and Rabinowicz [22] obtained Q-factors of ~5 while the study by Pechony et al. [24] acquired a value of Q ~10. Such a difference, by a factor of two, was predicted by [24] for more sophisticated ionosphere representations.
Martian global resonances have also been modeled [24,164,166,167]. The results of the studies are somewhat different. Sukhorukov [166] obtained the resonant frequencies at about 13, 25 and 37 Hz with Q-factors around 3.5. The frequencies calculated by [24] are lower: 8.6, 16.3 and 24.4 Hz, with Q-factors of ~2.4. The disparity can probably be explained by the different models of the Martian lower ionosphere used in the two studies. Nevertheless the low quality factors obtained in both studies show that pronounced sharp peaks at resonance frequencies should not be expected for the Martian ELF waveguide. Significantly different results were obtained by [167], where several ionosphere models were used. The first resonance occurred at 11–12 Hz (depending on the ionosphere model), the second and third resonances interfered to form a single peak at 21–25 Hz and the fourth, fifth and sixth modes produced a very smooth-shaped peak at around 60 Hz.
The ionosphere of Titan is perhaps the most thoroughly modeled today. The recent interest in the largest satellite of Saturn was associated with the Cassini/Huygens Mission and expectations of finding evidence of lightning activity on Titan. Consequently, SR on Titan received more attention than resonances on other celestial bodies. The resonant frequencies obtained for various ionospheric conductivity profiles tested range (for realistic models) from 11.0 to 15.0 Hz for the first mode, 21.2–27.8 Hz for the second and 35.6–41.6 Hz for the third [168,169,170]. Unfortunately, the quality factors were not calculated in these studies. Comparable results were obtained by other authors: resonant frequencies of 19.9, 35.8 and 51.8 Hz with Q-factors of 1–3 were obtained by [171], and 11.8, 22.5 and 34.1 Hz with Q-factors of ~2 obtained by [24]. The low Q-factors acquired in these two studies show that the expected peaks, should lighting activity be found on Titan, are rather wide.
Today there is no possibility to validate SR parameters calculated for other planets and moons. The values of the resonance frequencies and quality-factors are very dependent on the ionospheric profile models. The accuracy of the latter is limited, and a deeper knowledge of planetary ionospheres would allow more precise predictions of Schumann resonance parameters. On the other hand, experimental evaluation of SR parameters can aid in the elaboration of the effective model of the ionospheric conductivity profile, and contribute substantially to the knowledge of lower ionospheres on planets of the Solar system.

5. Summary and Conclusions

Being a global phenomenon, Schumann resonances have numerous applications in lightning research. Background SR records can serve as a convenient and a low-cost tool for global lightning activity monitoring. The SR can provide a global geo-electric index for monitoring climate changes. It provides one of the few tools that, through variations in global lightning activity, can provide continuous and long-term monitoring of such important global climate change parameters such as tropical land surface temperature, and tropical upper tropospheric water vapor.
SR transients (Q-bursts) can be used to geo-locate intense lightning strikes anywhere on the planet. These large-amplitude pulses are apparently related to the occurrence of sprites and elves above thunderstorms, and therefore TLEs can be studied using SR observations. An additional application of SR is extraterrestrial lightning research. Schumann resonances may be used to detect and, if necessary, monitor lightning activity on the planets and moons of the solar system.
There are still many open questions in SR research: importance of the day–night variation in the ionosphere conductivity profile [172,173,174]; influence of the latitudinal changes in the Earth magnetic field; polar cap absorption; accuracy of source geolocation; the determination of the spatial lightning distribution from the background records; anomalous SR signals related to earthquakes [175,176]; and impacts of extra-terrestrial disturbances on the Earth-ionosphere cavity. The last topic has received considerable interest over the past few years. Effects primarily on SR frequencies have been detected during cosmic gamma-ray bursts [177,178], solar flares and solar proton events [62,178,179,180], as well as over the 11-year solar cycle [181,182,183]. Despite these remaining open problems, SR is one of the most promising tools in a variety of fields related to lightning electromagnetics.

Acknowledgments

I would like to thank all of my graduate students, researchers and technicians that have been involved in our SR studies over the years, and who have contributed in some way to the results presented in this paper: Mustafa Asfur, Olga Pechony, Eran Greenberg, Michael Finkelstein, Alex Melnikov, Eli Galanti, Israel Silber, Hofit Shahaf and David Shtibelman. In addition, discussions with Yoav Yair, Earle Williams, Gabriella Satori, and Sasha Nickolaenko were much appreciated.

Conflicts of Interest

The authors declare no conflict of interest.

References

  1. Besser, B.P. Synopsis of the historical development of Schumann resonances. Radio Sci. 2007. [Google Scholar] [CrossRef]
  2. Schumann, W.O. Über die strahlungslosen Eigenschwingungen einer leitenden Kugel, die von einer Luftschicht und einer Ionosphärenhülle umgeben ist. Z. und Naturf. 1952, 7, 149–154. [Google Scholar] [CrossRef]
  3. Tesla, N. The Transmission of electrical energy without wires as a means of furthering world peace. Electr. World Eng. 1905, 7, 21–24. [Google Scholar]
  4. Schumann, W.O. Über die Dämpfung der elektromagnetischen Eigenschwingnugen des Systems Erde—Luft—Ionosphäre. Z. und Naturf. 1952, 7, 250–252. [Google Scholar]
  5. Schumann, W.O. Über die Ausbreitung sehr Langer elektriseher Wellen um die Signale des Blitzes. Nuovo Cimento 1952, 9, 1116–1138. [Google Scholar] [CrossRef]
  6. Schumann, W.O.; König, H. Über die Beobactung von Atmospherics bei geringsten Frequenzen. Naturwiss 1954, 41, 183–184. [Google Scholar] [CrossRef]
  7. Balser, M.; Wagner, C. Measurement of the spectrum of radio noise from 50 to 100 c/s. J. Res. NBS 1960, 64, 415–418. [Google Scholar]
  8. Balser, M.; Wagner, C. Observations of earth-ionosphere cavity resonances. Nature 1960, 188, 638–641. [Google Scholar] [CrossRef]
  9. Balser, M.; Wagner, C. Diurnal power variations of the earth-ionosphere cavity modes and their relationship to worldwide thunderstorm activity. J. Geophys. Res. 1962, 67, 619–625. [Google Scholar] [CrossRef]
  10. Balser, M.; Wagner, C. On frequency variations of the earth-ionosphere cavity modes. J. Geophys. Res. 1962, 67, 4081–4083. [Google Scholar] [CrossRef]
  11. Balser, M.; Wagner, C. Effect of a high-altitude nuclear detonation on the earth-ionosphere cavity. J. Geophys. Res. 1963, 68, 4115–4118. [Google Scholar] [CrossRef]
  12. Gendrin, R.; Stefant, R. Effet de l’explosion thermonucleaire a tres haute altitude du 9 juillet 1962 sur la resonance de la cavite Terre-ionosphere: Resultats experimentaux. C.R. Acad. Sci. Paris 1962, 255, 2273–2275. [Google Scholar]
  13. Wait, J.R. Historical background and introduction to the special issue on extremely low frequency (ELF) communication. IEEE Trans. Commun. 1974, 22, 353–354. [Google Scholar] [CrossRef]
  14. Wait, J.R. Propagation of ELF electromagnetic waves and project Sanguine/Seafarer. IEEE J. Oceanic Eng. 1977, 2, 161–172. [Google Scholar] [CrossRef]
  15. Fraser-Smith, A.C.; Bannister, P.R. Reception of ELF signals at antipodal distance. Radio Sci. 1998, 33, 83–88. [Google Scholar] [CrossRef]
  16. Yano, M.; Ida, Y.; Hobara, Y.; Hayakawa, M.; Nickolaenko, A.P. Reception of ELF transmitter signals at Moshiri, Japan, and their propagation characteristics. Radio Sci. 2010, 45. [Google Scholar] [CrossRef]
  17. Holzer, R.E. World thunderstorm activity and extremely low frequency sferics. In Recent Advances in Atmospheric Electricity; Smith, L.G., Ed.; Pergamon Press: Oxford, UK, 1958; pp. 599–602. [Google Scholar]
  18. Nickolaenko, A.P.; Rabinowicz, L.M. Study of the annual changes of global lightning distribution and frequency variations of the first Schumann resonance mode. J. Atoms. Terr. Phys. 1995, 57, 1345–1348. [Google Scholar] [CrossRef]
  19. Nickolaenko, A.P.; Rabinowicz, L.M.; Hayakawa, M. Analyses of the ULF/ELF records performed in a seismo-active region. J. Atmos. Electr. 1998, 18, 1–10. [Google Scholar]
  20. Heckman, S.J.; Williams, E.; Boldi, B. Total global lightning inferred from Schumann resonance measurements. J. Geophys. Res. 1998, 103, 31775–31779. [Google Scholar] [CrossRef]
  21. Yang, H.; Pasko, V.P.; Sa´tori, G. Seasonal variations of global lightning activity extracted from Schumann resonances using a genetic algorithm method. J. Geophys. Res. 2009, 114. [Google Scholar] [CrossRef]
  22. Nickolaenko, A.P.; Rabinowicz, L.M. On the possibility of existence of global electromagnetic resonances on the planets of Solar system. Space Res. 1982, 20, 82–89. [Google Scholar]
  23. Nickolaenko, A.P.; Rabinowicz, L.M. On the applicability of extremely low frequency global resonances in the studies of lightning activity at Venus. Space Res. 1987, 25, 301–308. [Google Scholar]
  24. Pechony, O.; Price, C. Schumann resonance parameters calculated with a partially uniform knee model on Earth, Venus, Mars, and Titan. Radio Sci. 2004, 39. [Google Scholar] [CrossRef]
  25. Price, C.; Rind, D. The effect of global warming on lightning frequencies. In Proceedings of the AMS 16th Conference on Severe Storms; American Meteorological Society: Alberta, AB, Canada, 1990. [Google Scholar]
  26. Williams, E.R. The Schumann resonance: A global tropical thermometer. Science 1992, 256, 1184–1186. [Google Scholar] [CrossRef] [PubMed]
  27. Boccippio, D.J.; Williams, E.R.; Heckman, S.J.; Lyons, W.A.; Baker, I.T.; Boldi, R. Sprites, ELF transients, and positive ground strokes. Science 1995, 269, 1088–1091. [Google Scholar] [CrossRef] [PubMed]
  28. Haung, H.G.; Williams, E.; Boldi, R.; Heckman, S.; Lyons, W.; Taylor, M.; Nelson, T.; Wong, C. Criteria for sprites and elves based on Schumann resonance observations. J. Geophys. Res. 1999, 104, 16943–16964. [Google Scholar] [CrossRef]
  29. Price, C.; Asfur, M.; Lyons, W.; Nelson, T. An improved ELF/VLF method for globally geolocating sprite-produced lightning. Geophys. Res. Lett. 2002, 29. [Google Scholar] [CrossRef]
  30. Sato, M.; Fukunishi, H.; Kikuchi, M.; Yamagishi, H.; Lyons, W.A. Validation of sprite-inducing cloud-to-ground lightning based on ELF observations at Syowa station in Antarctica. J. Atoms. Terr. Phys. 2003, 65, 607–614. [Google Scholar] [CrossRef]
  31. Sato, M.; Fukunishi, H. Global sprite occurrence locations and rates derived from triangulation of transient Schumann resonance events. Geophys. Res. Lett. 2003, 30. [Google Scholar] [CrossRef]
  32. Volland, H. Atmospheric Electrodynamics; Springer Science & Business Media: Berlin, Germany, 1984. [Google Scholar]
  33. Wait, J.R. Electromagnetic Waves in Stratified Media; Pergamon Press: Oxford, UK, 1962. [Google Scholar]
  34. Galejs, J. Terrestrial Propagation of Long Electromagnetic Waves; Pergamon Press: Oxford, UK, 1972. [Google Scholar]
  35. Nickolaenko, A.P.; Hayakawa, M. Resonances in the Earth-Ionosphere Cavity; Kluwer Academic Publishers: Dordrecht, Boston, London, 2002. [Google Scholar]
  36. Kemp, D.T.; Jones, D.L. A new technique for the analysis of transient ELF electromagnetic disturbances within the Earth–ionosphere cavity. J. Atmos. Terr. Phys. 1971, 33, 567–572. [Google Scholar] [CrossRef]
  37. Burke, C.P.; Jones, D.L. Global radiolocation in the lower ELF frequency band. J. Geophys. Res. 1995, 100, 26263–26272. [Google Scholar] [CrossRef]
  38. Nickolaenko, A.P. Modern aspects of Schumann resonance studies. J. Atoms. Terr. Phys. 1997, 59, 806–816. [Google Scholar] [CrossRef]
  39. Boccippio, D.J.; Wong, C.; Williams, E.; Boldi, R.; Christian, H.J.; Goodman, S.J. Global validation of single-station Schumann resonance lightning location. J. Atmos. Terr. Phys. 1998, 60, 701–712. [Google Scholar] [CrossRef]
  40. Greenberg, E.; Price, C. A global lightning location algorithm based on the electromagnetic signature in the Schumann resonance band. J. Geophys. Res. 2004, 109. [Google Scholar] [CrossRef]
  41. Jones, D.L. The calculations of the Q-factors and frequencies of Earth-ionosphere cavity resonances for a two-layer ionosphere model. J. Geophys. Res. 1974, 69, 4037–4046. [Google Scholar] [CrossRef]
  42. Jones, D.L. Schumann resonances and ELF propagation for inhomogeneous, isotropic ionosphere profiles. J. Atmos. Terr. Phys. 1967, 29, 1037–1044. [Google Scholar] [CrossRef]
  43. Yamashita, M. Propagation of ELF radio waves to great distances below the unisotropic ionosphere. J. Atmos. Terr. Phys. 1967, 29, 937–948. [Google Scholar] [CrossRef]
  44. Yamashita, M. The propagation characteristics of ELF radio waves to great distances below the horizontally stratified ionosphere. J. Atmos. Terr. Phys. 1968, 30, 1943–1953. [Google Scholar] [CrossRef]
  45. Hynninen, E.M.; Galyuck, Y.P. The field of a vertical electric dipole over the spherical Earth’s surface below the vertically inhomogeneous ionosphere. Probl. Diffr. Wave Propag. 1972, 11, 109–115. (In Russian) [Google Scholar]
  46. Greifinger, C.; Greifinger, P. Approximate method for determining ELF eigenvalues in the Earth-ionosphere waveguide. Radio Sci. 1978, 13, 831–837. [Google Scholar] [CrossRef]
  47. Mushtak, V.C.; Williams, E.R. ELF propagation parameters for uniform models of the Earth-ionosphere waveguide. J. Atoms. Terr. Phys. 2002, 64, 1989–2001. [Google Scholar] [CrossRef]
  48. Toledo-Redondo, S.; Salinas, A.; Fornieles, J.; Portí, J.; Lichtenegger, H.I.M. Full 3-D TLM simulations of the Earth-ionosphere cavity: Effect of conductivity on the Schumann resonances. J. Geophys. Res. Space Phys. 2016, 121, 5579–5593. [Google Scholar] [CrossRef]
  49. Yang, H.; Pasko, V. Three-dimensional finite difference time domain modeling of the Earth-ionosphere cavity resonances. Geophys. Res. Lett. 2005, 32. [Google Scholar] [CrossRef]
  50. Nickolaenko, A.P.; Galuk, Y.P.; Hayakawa, M. Vertical profile of atmospheric conductivity that matches Schumann resonance observations. SpringerPlus 2016. [Google Scholar] [CrossRef] [PubMed]
  51. Galuk, Y.P.; Nickolaenko, A.P.; Hayakawa, M. Knee model: Comparison between heuristic and rigorous solutions for the Schumann resonance problem. J. Atoms. Terr. Phys. 2016, 135, 85–91. [Google Scholar] [CrossRef]
  52. Silber, I.; Price, C.; Galanti, E.; Shuval, A. Anomalously strong vertical magnetic fields from distant lightning. J. Geophys. Res. Space Phys. 2015, 120, 6036–6044. [Google Scholar] [CrossRef]
  53. Ogawa, T.; Tanka, Y.; Miura, T.; Yasuhara, M. Observations of natural ELF electromagnetic noises by using the ball antennas. J. Geomagn. Geoelectr. 1966, 18, 443–454. [Google Scholar] [CrossRef]
  54. Price, C.; Melnikov, M. Diurnal, seasonal and inter-annual variations of the Schumann resonance parameters. J. Atoms. Terr. Phys. 2004, 66, 1179–1185. [Google Scholar] [CrossRef]
  55. Christian, H.J.; Blakeslee, R.J.; Boccippio, D.J.; Boeck, W.L.; Buechler, D.E.; Driscoll, K.T.; Goodman, S.J.; Hall, J.M.; Koshak, W.J.; Mach, D.M.; et al. Global frequency and distribution of lightning as observed from space by the Optical Transient Detector. J. Geophys. Res. 2003. [Google Scholar] [CrossRef]
  56. Greenberg, E.; Price, C. Diurnal variations of ELF transients and background noise in the Schumann resonance band. Radio Sci. 2007, 42. [Google Scholar] [CrossRef]
  57. Sentman, D.D. Magnetic elliptical polarization of Schumann resonances. Radio Sci. 1987, 22, 595–606. [Google Scholar] [CrossRef]
  58. Mushtak, V.C.; Williams, E.R. An improved Lorentzian technique for evaluating resonance characteristics of the Earth-ionosphere cavity. Atmos. Res. 2009, 91, 188–193. [Google Scholar] [CrossRef]
  59. Satori, G.; Rycroft, M.; Bencze, P.; Marcz, F.; Bor, J.; Barta, V.; Nagy, T.; Kovacs, K. An overview of thunderstorm-related research on the atmospheric electric field, Schumann resonances, sprites, and the ionosphere at Sopron, Hungary. Surv. Geophys. 2013, 34, 255–292. [Google Scholar] [CrossRef]
  60. Yamashita, K.; Takahashi, Y.; Sato, M.; Kase, H. Improvement in lightning geolocation by time-of-arrival method using global ELF network data. J. Geophys. Res. 2011, 116. [Google Scholar] [CrossRef]
  61. Kułak, A.; Młynarczyk, J.; Zięba, S.; Micek, S.; Nieckarz, Z. Studies of ELF propagation in the spherical shell cavity using a field decomposition method based on asymmetry of Schumann resonance curves. J. Geophys. Res. 2006, 111. [Google Scholar] [CrossRef]
  62. De, S.S.; De, B.K.; Bandyopadhyay, B.; Paul, S.; Haldar, D.K.; Barui, S. Studies on the shift in the frequency of the first Schumann resonance mode during a solar proton event. J. Atmos. Sol-Terr. Phys. 2010, 72, 829–836. [Google Scholar] [CrossRef]
  63. Zhou, H.; Yu, H.; Cao, B.; Qiao, X. Diurnal and seasonal variations in the Schumann resonance parameters observed at Chinese observatories. J. Atmos. Sol-Terr. Phys. 2013, 98, 86–96. [Google Scholar] [CrossRef]
  64. Ouyang, X.Y.; Xiao, Z.; Hao, Y.Q.; Zhang, D.H. Variability of Schumann resonance parameters observed at low latitude stations in China. Adv. Space Res. 2015, 56, 1389–1399. [Google Scholar] [CrossRef]
  65. Tatsis, G.; Votis, C.; Christofilakis, V.; Kostarakis, P.; Tritakis, V.; Repapis, C. A prototype data acquisition and processing system for Schumann resonance measurements. J. Atmos. Sol-Terr. Phys. 2015, 135, 152–160. [Google Scholar] [CrossRef]
  66. Fornieles-Callejón, J.; Salinas, A.; Toledo-Redondo, S.; Portí, J.; Méndez, A.; Navarro, E.A.; Morente-Molinera, J.A.; Soto-Aranaz, C.; Ortega-Cayuela, J.S. Extremely low frequency band station for natural electromagnetic noise measurement. Radio Sci. 2015, 50, 191–201. [Google Scholar] [CrossRef]
  67. Clayton, M.; Polk, C. Diurnal validation and absolute intensity of worldwide lightning activity. In Electrical Processes in Atmospheres; Dolezalek, H., Reiter, R., Eds.; Springs: Darmstadt, Germany, 1977; pp. 440–449. [Google Scholar]
  68. Sentman, D.D.; Fraser, B.J. Simultaneous observation of Schumann resonances in California and Australia: Evidence for intensity modulation by local height of the D region. J. Geophys. Res. 1991, 96, 15973–15984. [Google Scholar] [CrossRef]
  69. Mezuman, K.; Price, C.; Galanti, E. On the spatial and temporal distribution of thunderstorm cells. Environ. Res. Lett. 2014, 9. [Google Scholar] [CrossRef]
  70. Nickolaenko, A.P.; Hayakawa, M.; Hobara, Y. Temporal variations of the global lightning activity deduced from the Schumann resonance data. J. Atmos. Terr. Phys. 1996, 58, 1699–1709. [Google Scholar] [CrossRef]
  71. Nickolaenko, A.P.; Satori, G.; Zieger, B.; Rabinowicz, L.M.; Kudintseva, L.G. Parameters of global thunderstorm activity deduced from the long-term Schumann resonance records. J. Atoms. Terr. Phys. 1998, 60, 387–399. [Google Scholar] [CrossRef]
  72. Satori, G.; Szendroi, J.; Vero, J. Monitoring Schumann resonances—I. Methodology. J. Atmos. Terr. Phys. 1996, 58, 1475–1481. [Google Scholar] [CrossRef]
  73. Belyaev, G.G.; Schekotov, A.Y.; Shvets, A.V.; Nickolaenko, A.P. Schumann resonances observed using Poynting vector spectra. J. Atoms. Terr. Phys. 1999, 61, 751–763. [Google Scholar] [CrossRef]
  74. Shvets, A.V. Distance estimation to the world thunderstorm centers by measurement of the Schumann resonance background. In Proceedings of the XXVI General Assembly, Union Radio Science International, Union of Radio Science, Lille, France, 1999.
  75. Bliokh, P.V.; Nickolaenko, A.P.; Filippov, Y.F. Schumann Resonances in the Earth-Ionosphere Cavity; Peter Peregrinus: Oxford, UK, 1980. [Google Scholar]
  76. Yatsevich, E.I.; Shvets, A.V.; Rabinowicz, L.M.; Nickolaenko, A.P.; Belyaev, G.G.; Schekotov, A.Y. Results of comparing Schumann resonance observations with a model of the single world thunderstorm center. Izv. Vuzov Radiophys. 2005, 48, 283–298. [Google Scholar]
  77. Shvets, A.V. A technique for reconstruction of global lightning distance profile from background Schumann resonance signal. J. Atoms. Terr. Phys. 2001, 63, 1061–1074. [Google Scholar] [CrossRef]
  78. Shvets, A.V.; Hayakawa, M.; Sekiguchi, M.; Ando, Y. Reconstruction of the global lightning distribution from ELF electromagnetic background signals. J. Atmos. Solar Terr. Phys. 2009, 71, 1405–1412. [Google Scholar] [CrossRef]
  79. Raemer, H.R. On the extremely low frequency spectrum of the earth-ionosphere cavity response to electrical storms. J. Geophys. Res. 1961, 66, 1580–1583. [Google Scholar] [CrossRef]
  80. Polk, C.; Fitchen, F. Schumann resonances of the earth-ionosphere cavity—extremely low frequency reception at Kingston, R.I. J. Res. NBS 1962, 66, 313–318. [Google Scholar] [CrossRef]
  81. Rycroft, M.J. Low Frequency Disturbances of Natural Origin of The Electric and Magnetic Fields of the Earth. Ph.D. Thesis, University of Cambridge, Cambridge, UK, 1963. [Google Scholar]
  82. Madden, T.; Thompson, W. Low-frequency electromagnetic oscillations of the Earth-ionosphere cavity. Rev. Geophys. 1965, 3, 211–254. [Google Scholar] [CrossRef]
  83. Polk, C. Relation of ELF noise and Schumann resonances to thunderstorm activity. In Planetary Electrodynamics; Volland, H., Ed.; CRC Press: Boca Ration, FL, USA, 1968; pp. 55–83. [Google Scholar]
  84. Jones, D.L. ELF-VLF Radio Wave Propagation; D. Reidel Publishing Company: Dordrecht, The Netherlands, 1974. [Google Scholar]
  85. Fullekrug, M.; Fraser-Smith, A.C. Global lightning and climate variability inferred from ELF magnetic field variations. Geophys. Res. Lett. 1997, 24, 2411–2414. [Google Scholar] [CrossRef]
  86. Sátori, G.; Zieger, B. El Niño-related meridional oscillation of global lightning activity. Geophys. Res. Lett. 1999, 26, 1365–1368. [Google Scholar] [CrossRef]
  87. Price, C. Evidence for a link between global lightning activity and upper tropospheric water vapor. Nature 2000, 406, 290–293. [Google Scholar] [CrossRef] [PubMed]
  88. Nickolaenko, A.P.; Hayakawa, M.; Hobara, Y. Q-bursts: Natural ELF radio transients. Surv. Geophys. 2010, 31, 409–425. [Google Scholar] [CrossRef]
  89. Ishaq, M.; Jones, D.L. Method of obtaining radiowave propagation parameters for the Earth–ionosphere duct at ELF. Electr. Lett. 1977, 13, 254–255. [Google Scholar] [CrossRef]
  90. Jones, D.L.; Burke, C.P. An experimental investigation of ELF attenuation rates in the Earth–ionosphere cavity. J. Atmos. Terr. Phys. 1992, 54, 243–250. [Google Scholar]
  91. Price, C.; Greenberg, E.; Yair, Y.; Sátori, G.; Bór, J.; Fukunishi, H.; Sato, M.; Israelevich, P.; Moalem, M.; Devir, A.; et al. Ground-based detection of TLE-producing intense lightning during the MEIDEX mission on board the Space Shuttle Columbia. Geophys. Res. Lett. 2004, 31. [Google Scholar] [CrossRef]
  92. Nakamura, T.; Sekiguchi, M.; Hobara, Y.; Hayakawa, M. A comparison of different source location methods for ELF transients by using the parent lightning discharges with known positions. J. Geophys. Res. 2010, 115. [Google Scholar] [CrossRef]
  93. Rafalsky, V.A.; Shvets, A.V.; Hayakawa, M. One-site distance-finding technique for locating lightning discharges. J. Atoms. Terr. Phys. 1995, 57, 1255–1261. [Google Scholar] [CrossRef]
  94. Burke, C.P.; Jones, D.L. An experimental investigation of ELF attenuation rates in the Earth-ionosphere duct. J. Atmos. Terr. Phys. 1992, 54, 243–254. [Google Scholar] [CrossRef]
  95. Schmidt, C.T. Detection of Distant Lightning Strikes from One Location Using Schumann Resonances. Ph.D. Thesis, Michigan Technological University, Houghton, MI, USA, 1993. [Google Scholar]
  96. Williams, E.R. Lightning and climate: A review. Atmos. Res. 2005, 76, 272–287. [Google Scholar] [CrossRef]
  97. Price, C. Global surface temperatures and the atmospheric global circuit. Geophys. Res. Lett. 1993, 20, 1363–1366. [Google Scholar] [CrossRef]
  98. Price, C.; Rind, D. Possible implications of global climate change on global lightning distributions and frequencies. J. Geophys. Res. 1994, 99, 10823–10831. [Google Scholar] [CrossRef]
  99. Jones, P.D.; Wigley, T.M.L.; Wright, P.B. Global Temperature-Variations between 1861 and 1984. Nature 1986, 322, 430–434. [Google Scholar] [CrossRef]
  100. Price, C.; Asfur, M. Can lightning observations be used as an indicator of upper-tropospheric water-vapor variability. Bull. Amer. Met. Soc. 2006, 34. [Google Scholar] [CrossRef]
  101. Physical Sciences Division. NCEP/NCAR Reanalysis 1: Summary. Available online: http://www.esrl.noaa.gov/psd/data/gridded/data.ncep.reanalysis.html (accessed on 13 September 2016).
  102. Hansen, J.; Lacis, A.; Rind, D.; Russel, G.; Stone, P.; Fung, I.; Ruedy, R.; Lerner, J. Climate sensitivity: Analysis of feedback mechanisms. In Climate Processes and Climate Sensitivity; Hansen, J.E., Takahashi, T., Eds.; American Geophysical Union: Washington, DC, USA, 1984; pp. 130–163. [Google Scholar]
  103. Lindzen, R.S. Some coolness concerning global warming. Bull. Am. Meteorol. Soc. 1990, 71, 288–299. [Google Scholar] [CrossRef]
  104. Rind, D.; Chiou, E.W.; Chu, W.; Larsen, J.; Oltmans, S.; Lerner, J.; McCormick, M.P.; McMaster, L. Positive water vapor feedback in climate models confirmed by satellite data. Nature 1991, 349, 500–502. [Google Scholar] [CrossRef]
  105. Del Genio, A.D.; Kovari, W.J.; Yao, N.S. Climatic implications of the seasonal variations of upper troposphere water vapour. Geophys. Res. Lett. 1994, 21, 2701–2704. [Google Scholar] [CrossRef]
  106. Sun, D.Z.; Held, I.M. A Comparison of modeled and observed relationships between interannual variations of water vapor and temperature. J. Clim. 1996, 9, 665–675. [Google Scholar] [CrossRef]
  107. Rind, D. Just add water vapor. Science 1998, 28, 1152–1153. [Google Scholar] [CrossRef]
  108. Satori, G.; Ziegler, B. El nino related meridional oscillation of global lightning activity. Geophys. Res. Let. 1999, 26, 1365–1368. [Google Scholar] [CrossRef]
  109. Satori, G.; Williams, E.R.; Lemperger, I. Variability of global lightning activity on the ENSO time scale. Atmos. Res. 2009, 91, 500–507. [Google Scholar] [CrossRef]
  110. Wilson, C.T.R. The electric field of a thundercloud and some of its effects. Proc. Phys. Soc. London 1924, 37. [Google Scholar] [CrossRef]
  111. Franz, R.C.; Nemzek, R.J.; Winckler, J.R. Television image of a large upward electrical discharge above a thunderstorm system. Science 1990, 249, 48–51. [Google Scholar] [CrossRef] [PubMed]
  112. Boeck, W.L.; Vaughan, O.H., Jr. Lightning observations from the STS-32 space shuttle mission. EOS Trans. AGU 1990, 71, 1241. [Google Scholar]
  113. Sentman, D.D.; Wescott, E.M. Observations of upper atmosphere optical flashes recorded from an aircraft. Geophys. Res. Lett. 1993, 20, 2857–2860. [Google Scholar] [CrossRef]
  114. Lyons, W.A. Characteristics of luminous structures in the stratosphere above thunderstorms as imaged by low-light video. Geophys. Res. Lett. 1994, 21, 875–878. [Google Scholar] [CrossRef]
  115. Boeck, W.L.; Vaughan, O.H., Jr.; Blakeslee, R.J.; Vonnegut, B.; Brook, M.; McKune, J. Observations of lightning in the stratosphere. J. Geophys. Res. 1995, 100, 1465–1475. [Google Scholar] [CrossRef]
  116. Heavner, M.J.; Hampton, D.L.; Sentman, D.D.; Wescott, E.M. Sprites over Central and South America (abstract). Eos Trans. AGU 1995, 76, 115. [Google Scholar]
  117. Sentman, D.D. Observations of red sprites and blue jets. In Proceedings of 25th General Assembly, Union Radio Science International, Union of Radio Science, Lille, France, 1996.
  118. Dowden, R.L.; Rodger, C.J. Decay of a vertical plasma column: A model to explain VLF sprites. Geophys. Res. Lett. 1997, 24, 2765–2768. [Google Scholar] [CrossRef]
  119. Fukunishi, H.; Takahashi, Y.; Uchida, A.; Sera, M.; Adachi, K.; Miyasato, R. Occurrences of sprites and elves above the Sea of Japan near Hokuriku in winter. Eos Trans. AGU 1999, 80, 217. [Google Scholar]
  120. Hardman, S.F.; Dowden, R.L.; Brundell, J.B.; Blahr, J.L.; Kawasaki, Z.I.; Rodger, C.J. Sprites observation in the northern territory of Australia. J. Geophys. Res. 2000, 105, 4689–4697. [Google Scholar] [CrossRef]
  121. Su, H.T.; Hsu, R.; Chen, A.B.C.; Lee, Y.J.; Lee, L.C. Observation of sprites over the Asian continent and over oceans around Taiwan. Geophys. Res. Lett. 2002, 29. [Google Scholar] [CrossRef]
  122. Yair, Y.; Price, C.; Levin, Z.; Joseph, J.; Israelevitch, P.; Devir, A.; Moalem, M.; Ziv, B.; Asfur, M. Sprite observations from the space shuttle during the Mediterranean Israeli Dust Experiment (MEIDEX). J. Atoms. Terr. Phys. 2003, 65, 635–642. [Google Scholar] [CrossRef]
  123. Neubert, T.; Allin, T.; Blanc, E.; Farges, T.; Haldoupis, C.; Mika, A.; Soula, S.; Knutsson, L.; van der Velde, O.; Marshall, R.; et al. Co-ordinated observations of transient luminous events during the EuroSprite 2003 campaign. J. Atoms. Terr. Phys. 2005, 67, 807–820. [Google Scholar] [CrossRef]
  124. Chen, A.B.; Kuo, C.L.; Lee, Y.J.; Su, H.T.; Hsu, R.R.; Chern, J.L.; Frey, H.U.; Mende, S.B.; Takahashi, Y.; Fukunishi, H.; et al. Global distributions and occurrence rates of transient luminous events. J. Geophys. Res. 2008, 113. [Google Scholar] [CrossRef]
  125. Williams, E.R. Sprites, elves, and glow discharge tubes. Phys. Today 2001, 41, 41–47. [Google Scholar] [CrossRef]
  126. Barrington-Leigh, C.P.; Inan, U.S. Elves triggered by positive and negative lightning discharges. Geophys. Res. Lett. 1999, 26, 683–686. [Google Scholar] [CrossRef]
  127. Pasko, V.P.; Inan, U.S.; Taranenko, Y.N.; Bell, T.F. Heating, ionization and upward discharges in the mesosphere due to intense quasi-electrostatic thundercloud fields. Geophys. Res. Lett. 1995, 22, 365–368. [Google Scholar] [CrossRef]
  128. Pasko, V.P.; Inan, U.S.; Bell, T.F.; Taranenko, Y.N. Sprites produced by quasi-electrostatic heating and ionization in the lower ionosphere. J. Geophys. Res. 1997, 102, 4529–4561. [Google Scholar] [CrossRef]
  129. Takahashi, Y.; Yoshida, A.; Sato, M.; Adachi, T.; Kondo, S.; Hsu, R.R.; Su, H.T.; Chen, A.B.; Mende, S.B.; Frey, H.U.; et al. Absolute optical energy of sprites and its relationship to charge moment of parent lightning discharge based on measurement by ISUAL/AP. J. Geophys. Res. 2010, 115. [Google Scholar] [CrossRef]
  130. Williams, E.R.; Mushtak, V.C.; Boldi, R.; Dowden, R.L.; Kawasaki, Z. Sprite lightning heard round the world by Schumann resonance methods. Radio Sci. 2007, 42. [Google Scholar] [CrossRef]
  131. Bell, T.F.; Pasko, V.P.; Inan, U.S. Runaway electrons as a source of red sprites in the mesosphere. Geophys. Res. Lett. 1995, 22, 2127–2130. [Google Scholar] [CrossRef]
  132. Milikh, G.M.; Papadopoulos, K.; Chang, C.L. On the physics of high altitude lightning. Geophys. Res. Lett. 1995, 22, 85–88. [Google Scholar] [CrossRef]
  133. Roussel-Dupré, R.; Gurevich, A.V. On runaway breakdown and upward propagating lightning. J. Geophys. Res. 1996, 101, 2297–2311. [Google Scholar] [CrossRef]
  134. Valdivia, J.A.; Milikh, G.; Papadopoulos, K. Red sprites: Lightning as a fractal antenna. Geophys. Res. Lett. 1997, 24, 3169–3172. [Google Scholar] [CrossRef]
  135. Reising, S.C.; Inan, U.S.; Bell, T.F.; Lyons, W.A. Evidence for continuing current in sprite-producing cloud-to-ground lightning. Geophys. Res. Lett. 1996, 23, 3639–3642. [Google Scholar] [CrossRef]
  136. Williams, E.; Downes, E.; Boldi, R.; Lyons, W.; Heckman, S. Polarity asymmetry of sprite-producing lightning: A paradox? Radio Sci. 2007, 42. [Google Scholar] [CrossRef]
  137. Hobara, Y.; Iwasaki, N.; Hayashida, T.; Hayakawa, M.; Ohta, K.; Fukunishi, H. Interrelation between ELF transients and ionospheric disturbances in association with sprites and elves. Geophys. Res. Lett. 2001, 28, 935–938. [Google Scholar] [CrossRef]
  138. Ganot, M.; Yair, Y.; Price, C.; Ziv, B.; Sherez, Y.; Greenberg, E.; Devir, A.; Yaniv, R. First detection of transient luminous events associated with winter thunderstorms in the eastern Mediterranean. Geophys. Res. Lett. 2007, 34. [Google Scholar] [CrossRef]
  139. Cummer, S.A.; Inan, U.S. Measurement of charge transfer in sprite-producing lightning using ELF radio atmospherics. Geophys. Res. Lett. 1997, 24, 1731–1734. [Google Scholar] [CrossRef]
  140. Bell, T.F.; Reising, S.C.; Inan, U.S. Continuing currents determined from broadband ELF/VLF magnetic fields radiated by positive cloud-to-ground discharges associated with red sprites. EOS Suppl. 1996, 77, 61. [Google Scholar]
  141. Nieckarz, Z.; Baranski, P.; Mlynarczyk, J.; Kulak, A.; Wiszniowski, J. Comparison of the charge moment change calculated from electrostatic analysis and from ELF radio observations. J. Geophys. Res. Atmos. 2015, 120, 63–72. [Google Scholar] [CrossRef]
  142. Yaniv, R.; Yair, Y.; Price, C.; Bór, J.; Sato, M.; Hobara, Y.; Cummer, S.; Li, J.; Devir, A. Ground-based observations of the relations between lightning charge-moment-change and the physical and optical properties of column sprites. J. Atmos. Sol-Terr. Phys. 2014, 107, 60–67. [Google Scholar] [CrossRef] [Green Version]
  143. Hu, W.; Cummer, S.A.; Lyons, W.A.; Nelson, T.E. Lightning charge moment changes for the initiation of sprites. Geophys. Res. Lett. 2002, 29. [Google Scholar] [CrossRef]
  144. Greenberg, E.; Price, C.; Yair, Y.; Ganot, M.; Bór, J.; Sátori, G. ELF transients associated with sprites and elves in eastern Mediterranean winter thunderstorms. J. Atmos. Solar-Terr. Phys. 2007, 69, 1569–1586. [Google Scholar] [CrossRef]
  145. Greenberg, E.; Price, C.; Yair, Y.; Haldoupis, C.; Chanrion, O.; Neubert, T. On the ELF charge moment change, VLF bursts and subionospheric perturbations associated with sprites. J. Atmos. Terr.-Solar Phys. 2009. [Google Scholar] [CrossRef]
  146. Bór, J.; Ludván, B.; Attila, N.; Steinbach, P. Systematic deviations in source direction estimates of Q-bursts recorded at Nagycenk, Hungary. J. Geophys. Res. Atmos. 2016, 121, 5601–5619. [Google Scholar] [CrossRef]
  147. Yair, Y.; Fischer, G.; Simoes, F.; Renno, N.; Zarka, P. Updated review of planetary atmospheric electricity. Space Sci. Rev. 2008, 137, 29–49. [Google Scholar] [CrossRef]
  148. Ksanfomaliti, L.V. Lightning in the cloud layer of Venus. Kosm. Issled. 1979, 17, 747–762. (In Russian) [Google Scholar]
  149. Ksanfomaliti, L.V. Planet Venus; Nauka: Moscow, Russia, 1985. (In Russian) [Google Scholar]
  150. Taylor, W.; Scarf, F.L.; Russell, C.T.; Brace, L.H. Evidence for lightning on Venus. Nature 1979, 279, 614–616. [Google Scholar] [CrossRef]
  151. Scarf, F.L.; Russell, C.T. Lightning measurements from the Pioneer Venus Orbiter. Geophys. Res. Lett. 1983, 10, 1192–1195. [Google Scholar] [CrossRef]
  152. Eden, H.F.; Vonnegut, B. Electrical breakdown caused by dust motion in low-pressure atmospheres: Consideration for Mars. Science 1973, 180, 962–963. [Google Scholar] [CrossRef] [PubMed]
  153. Melnik, O.; Parrot, M. Electrostatic discharge in Martian dust storms. J. Geophys. Res. 1998, 103, 29107–29117. [Google Scholar] [CrossRef]
  154. Farrell, W.F.; Kaiser, M.L.; Desch, M.D.; Houser, J.G.; Cummer, S.A.; Wilt, D.M.; Landis, G.A. Detecting electrical activity from Martian dust storms. J. Geophys. Res. 1999, 104, 3795–3801. [Google Scholar] [CrossRef]
  155. Renno, N.O.; Wong, A.; Atreya, S.K.; de Pater, I.; Roos-Serote, M. Electrical discharges and broadband radio emission by Matian dust devils and dust storms. Geophys. Res. Lett. 2003, 30, 2140. [Google Scholar] [CrossRef]
  156. Bar-Nun, A. Thunderstorms on Jupiter. Icarus 1975, 24, 86–94. [Google Scholar] [CrossRef]
  157. Little, B.; Anger, C.D.; Ingersoll, A.P.; Vasavada, A.R.; Senske, D.A.; Breneman, H.H.; Borucki, W.J. Galileo Images of lightning on Jupiter. Icarus 1999, 142, 306–323. [Google Scholar] [CrossRef]
  158. Desch, S.J.; Borucki, W.J.; Russell, C.T.; Bar-Nun, A. Progress in planetary lightning. Rep. Prog. Phys. 2002, 65, 955–997. [Google Scholar] [CrossRef]
  159. Fischer, G.; Kurth, W.S.; Dyudina, U.A.; Kaiser, M.L.; Zarka, P.; Lecacheux, A.; Ingersoll, A.P.; Gurnett, D.A. Analysis of a giant lightning storm on Saturn. Icarus 2007, 190, 528–544. [Google Scholar] [CrossRef]
  160. Tokano, T.; Molina-Cuberos, G.J.; Lammer, H.; Stumptner, W. Modeling of thunderclouds and lightning on Titan. Planer. Space Sci. 2001, 49, 539–560. [Google Scholar] [CrossRef]
  161. Lammer, H.; Tokano, T.; Fischer, G.; Stumptner, W.; Molina-Cuberos, G.J.; Schwingenschuh, K.; Rucher, H.O. Lightning activity of Titan: Can Cassiny/Huygens detect it? Planet. Space Sci. 2001, 49, 561–574. [Google Scholar] [CrossRef]
  162. Fischer, G.; Gurnett, D.A.; Kurth, W.S.; Farrell, W.M.; Kaiser, M.L.; Zarka, P. Nondetection of Titan lightning radio emissions with Cassini/RPWS after 35 close Titan flybys. Geophys. Res. Lett. 2007, 34. [Google Scholar] [CrossRef]
  163. Sentman, D.D. Electrical conductivity of Jupiter’s Shallow interior and the formation of a resonant planetary-ionosphere cavity. ICARUS 1990, 88, 73–86. [Google Scholar] [CrossRef]
  164. Yang, H.; Pasko, V.P.; Yair, Y. Three-dimensional finite difference time domain modeling of the Schumann resonance parameters on Titan, Venus, and Mars. Radio Sci. 2006, 41. [Google Scholar] [CrossRef]
  165. Simoes, F.; Hamelin, M.; Grard, R.; Aplin, K.L.; Béghin, C.; Berthelier, J.J.; Besser, B.P.; Lebreton, J.P.; López-Moreno, J.J.; Molina-Cuberos, G.J.; et al. Electromagnetic wave propagation in the surface-ionosphere cavity of Venus. J. Geophys. Res. 2008, 113. [Google Scholar] [CrossRef] [Green Version]
  166. Sukhorukov, A.I. On the Schumann resonances on Mars. Planet. Space Sci. 1991, 39, 1673–1676. [Google Scholar] [CrossRef]
  167. Molina-Cuberos, G.J.; Morente, J.A.; Besser, B.P.; Porti, J.; Lichtenegger, H.; Schwingenschuh, K.; Salinas, A.; Margineda, J. Schumann resonances as a tool to study the lower ionosphere of Mars. Radio Sci. 2006, 41. [Google Scholar] [CrossRef]
  168. Morente, J.A.; Molina-Cuberos, G.J.; Porti, J.A.; Schwingenschuh, K.; Besser, B.P. A study of the propagation of electromagnetic waves in Titan’s atmosphere with the TLM numerical method. Icarus 2003, 162, 374–384. [Google Scholar] [CrossRef]
  169. Molina-Cuberos, G.J.; Porti, J.; Besser, B.P.; Morente, J.A.; Margineda, J.; Lichtenegger, H.I.M.; Salinas, A.; Schwingenschuh, K.; Eichelberger, H.U. Schumann resonances and electromagnetic transparence in the atmosphere of Titan. Adv. Space Res. 2004, 33, 2309–2313. [Google Scholar] [CrossRef]
  170. Navarro, E.A.; Soriano, A.; Morente, J.A.; Portí, J.A. A finite difference time domain model for the Titan ionosphere Schumann resonances. Radio Sci. 2007, 42. [Google Scholar] [CrossRef]
  171. Nickolaenko, A.P.; Besser, B.P.; Schwingenschuh, K. Model computations of Schumann resonance on Titan. Planet. Space Sci. 2003, 51, 853–862. [Google Scholar] [CrossRef]
  172. Pechony, O.; Price, C. Schumann resonances: Interpretation of local diurnal intensity modulation. Radio Sci. 2006, 41. [Google Scholar] [CrossRef]
  173. Pechony, O.; Price, C.; Nickolaenko, A.P. Relative importance of the day–night asymmetry in Schumann resonance amplitude records. Radio Sci. 2007, 42. [Google Scholar] [CrossRef]
  174. Satori, G.; Mushtak, V.; Williams, E. Schumann resonance signatures of global lightning. In Lightning: Principles, Instruments and Applications; Springer: Berlin, Germany, 2009; pp. 347–386. [Google Scholar]
  175. Nickolaenko, A.; Hayakawa, M. Localize ionospheric disturbance over the earthquake epicenter and modifications of Schumann resonance electromagnetic fields. Geomat. Nat. Haz. Risk 2014. [Google Scholar] [CrossRef]
  176. Zhou, H.; Zhou, Z.; Qiao, X.; Yu, H. Anomalous phenomena in Schumann resonance band observed in China before the 2011 magnitude 9.0 Tohoku-Oki earthquake in Japan. J. Geophys. Res. Atmos. 2013, 118, 13338–13345. [Google Scholar] [CrossRef]
  177. Price, C.; Mushtak, V. The impact of the August 27, 1998, Gamma-ray burst on the Schumann resonances. J. Atoms. Terr. Phys. 2001, 63, 1043–1047. [Google Scholar] [CrossRef]
  178. Nickolaenko, A.P.; Kudintseva, I.G.; Pechony, O.; Hayakawa, M.; Hobara, Y.; Tan, Y.T. The effect of a gamma ray flare on Schumann resonances. Ann. Geophys. 2012, 30, 1321–1329. [Google Scholar] [CrossRef]
  179. Singh, B.; Tyagi, R.; Hobara, Y.; Hayakawa, M. X-rays and solar proton event induced changes in the first mode Schumann resonance frequency observed at a low latitude station Agra, India. J. Atmos. Sol-Terr. Phys. 2014, 113, 1–9. [Google Scholar] [CrossRef]
  180. Dyrda, M.; Kulak, A.; Mlynarczyk, A.; Ostrowski, M. Novel analysis of a sudden ionospheric disturbance using Schumann resonance measurements. J. Geophys. Res. Space Phys. 2015, 120, 2255–2262. [Google Scholar] [CrossRef]
  181. Satori, G.; Williams, E.; Price, C.; Boldi, R.; Koloskov, A.; Yampolski, Y.; Guha, A.; Barta, V. Effects of energetic solar emissions on the Earth-ionosphere cavity of Schuman Resonances. Surv. Geophys. 2016. [CrossRef]
  182. Nickolaenko, A.P.; Koloskov, A.V.; Hayakawa, M.; Yampolski, Y.M.; Budanov, O.V.; Korepanov, V.E. 11-year solar cycle in Schumann resonance data as observed in Antarctica. Sun Geosph. 2015, 10, 39–49. [Google Scholar]
  183. Ondraskova, A.; Sevicik, S.; Kostecky, P. Decrease of Schumann resonance frequencies and changes in the effective lightning areas toward the solar cycle minimum of 2008–2009. J. Atmos. Sol-Terr. Phys. 2011, 73, 534–543. [Google Scholar] [CrossRef]
Figure 1. Electric and magnetic fields of the first three SR modes. White shading implies field maximum, while black shading implies field minimun.
Atmosphere 07 00116 g001
Figure 2. Electric field spectra as a function of SOD [40].
Atmosphere 07 00116 g002
Figure 3. (a) Vertical electric field ball antenna with author; and (b) two horizontal induction coils at the Mitzpe Ramon, Israel SR site.
Atmosphere 07 00116 g003
Figure 4. (a) Time series of five minutes of raw magnetic field data showing the background ELF field, together with transient ELF pulses; and (b) the spectrum of the time series showing the first four modes of the SR. The sum of Lorentzian fits to the data (black line) are also shown.
Atmosphere 07 00116 g004
Figure 5. Comparison of the SR amplitude of the first mode (8 Hz) measured simultaneously in Israel and California [87].
Atmosphere 07 00116 g005
Figure 6. The four-year mean diurnal and seasonal variations of the SR power for the first mode—individual electromagnetic components of the SR field [56]. SON = September, October, and November; DJF = December, January, and February; MAM = March, April, and May; JJA = June, July, and August.
Atmosphere 07 00116 g006
Figure 7. Example of ELF transient recorded at Mitzpe Ramon (32°N, 34°E) station, Israel.
Atmosphere 07 00116 g007
Figure 8. Relative amplitude of the 8 Hz SR signal at 1800 UT every day, arriving from South America, but detected in Israel (black), compared with the spatially averaged 1800 UT tropical land surface NCEP temperatures over South America (gray).
Atmosphere 07 00116 g008
Figure 9. Daily SR 8 Hz magnetic field (at 14 UT Hew) records (black) and upper tropospheric water vapor (red) over tropical Africa [100].
Atmosphere 07 00116 g009
Figure 10. A sprite observed by the ILAN team [138] together with a typical ELF transient, showing clearly the eight peaks per second (8 Hz) in the vertical electric field [29].
Atmosphere 07 00116 g010

