Review

Insights from a Chronology of the Development of Atmospheric Composition Monitoring Networks Since the 1800s

by
Christopher S. Malley
1,2,*,
Mathew R. Heal
2 and
Christine F. Braban
1
1
Natural Environment Research Council, Centre for Ecology & Hydrology, Bush Estate, Penicuik EH26 0QB, UK
2
School of Chemistry, University of Edinburgh, David Brewster Road, Edinburgh EH9 3JF, UK
*
Author to whom correspondence should be addressed.
Atmosphere 2016, 7(12), 160; https://doi.org/10.3390/atmos7120160
Submission received: 9 November 2016 / Revised: 1 December 2016 / Accepted: 5 December 2016 / Published: 8 December 2016

Abstract

:
Ground-based monitoring networks for evaluating atmospheric composition relevant to impacts on human health and the environment now exist worldwide (according to the United Nations Environment Programme, 48% of countries have an air quality monitoring system). Of course, this has not always been the case. Here, we analyse for the first time the key developments in network coordination and standardisation over the last 150 years that underpin the current implementations of city-scale to global monitoring networks for atmospheric composition. Examples include improvements in respect of site type and site representativeness, measurement methods, quality assurance, and data archiving. From the 1950s, these developments have progressed through two distinct types of network: those designed for the protection of human health, and those designed to increase scientific understanding of atmospheric composition and its interaction with the terrestrial environment. The step changes in network coordination and standardisation have increased confidence in the comparability of measurements made at different sites. Acknowledged limitations in the current state of monitoring networks include a sole focus on compliance monitoring. In the context of the unprecedented volumes of atmospheric composition data now being collected, we suggest the next developments in network standardisation should include more integrated analyses of monitor and other relevant data within “chemical climatology” frameworks that seek to more directly link the impacts, state and drivers of atmospheric composition. These approaches would also enhance the role of monitoring networks in the development and evaluation of air pollution mitigation strategies.

1. Introduction

For centuries, but particularly since the industrial revolution of the 18th and 19th centuries, human activities have been affecting the composition of the atmosphere and its consequent impacts on human health and the natural environment [1]. The negative impacts resulting from this air pollution are now experienced on all scales from local (e.g., health impacts in megacities [2]), to regional (e.g., acid deposition [3] and ozone vegetation damage across Europe [4]), to global (e.g., climate change [5]).
The 19th century also saw a growing interest in the investigation of atmospheric composition by direct measurement. For example, in 1872 British chemist Robert Angus Smith wrote, “My object is to show that there are impurities in our atmosphere which may be discovered by chemical analyses and that the sense and general impression are not at fault when they speak of peculiarities of a town atmosphere” [6]. Subsequent developments in ambient measurements means that these, along with laboratory studies and modelling, are fundamental to efforts to understand the chemical and physical processes of the atmosphere, and the changes in atmospheric impacts from changes in anthropogenic influence. While the three approaches are mutually beneficial [7], it is measurements that provide direct information about the atmosphere and which are therefore essential for developing and validating model and laboratory representations of the atmosphere.
The utility of monitoring for understanding atmospheric composition has been enhanced in a variety of ways. Most obviously, improvements in measurement instrumentation have permitted quantification of an increasing number of atmospheric constituents, and at greater time resolution, accuracy and precision [8,9,10,11,12]. However, enhancement has also derived from increased coordination and standardisation of monitoring networks across city, national or international scales. Coordination is the establishment of common goals for monitoring efforts across a spatial domain, for example across a network of sites established to assess compliance with air quality legislation, or to assess transboundary transport of pollutants, whilst standardisation is the establishment of common methods to achieve the goals of the monitoring network. The latter includes protocols covering measurement techniques, site representativeness, quality assurance/quality control procedures and data archiving, all with the aim of increasing confidence in the quality and comparability of measurement data. Both coordination and standardisation are required to maximise information extracted from monitoring networks.
A large number of atmospheric composition monitoring networks now exist worldwide, spanning city, national and international scales. The United Nations Environment Programme (UNEP) Air Quality Policy Catalogue indicates that “air quality monitoring systems” are established in 91 countries (48% of all countries), within which 77% of the global population reside [13]. Modern monitoring networks have a high level of coordination and standardisation, as exemplified by the detailed pan-European protocols for site location, measurement methods, quality assurance and data reporting specified in the European Monitoring and Evaluation Programme (EMEP) Manual for Sampling and Analysis [14].
The aim of this work is to present an analysis of the step-changes in coordination and standardisation over the last 150 years that underpin the current suite of monitoring networks across the globe. The focus is on ground-based “in situ” monitoring networks measuring ambient pollutant concentrations. Economic, political and scientific drivers have all influenced the development of monitoring networks (as well as developments in measurement instrumentation), but this chronology focuses specifically on improvements derived from advances in network coordination and standardisation. Table 1 provides a summary of the key historical advances identified in our review. Entries in the table identify the monitoring networks that provided the first example of standardisation of a specific element of the monitoring network framework (e.g., measurement methods or site representativeness), together with those networks that applied the coordination and standardisations evident in previous networks to an unprecedented spatial scale (e.g., from city to national scale, or national to international scale). The specific monitoring efforts that first produced each advancement are discussed in detail in subsequent sections. Our focus is on those networks which promoted step changes in coordination and standardisation. We do not summarise all monitoring networks that have ever existed, nor consider retrospective analyses of historic data to yield information on past air pollution levels (e.g., analysis of airport visibility data or atmospheric electricity [15,16,17,18,19,20,21,22]).
Atmospheric composition and its impacts continue to change. For example, many countries have policies aimed at reducing emissions of air pollutants associated with poor air quality [23,24], whereas increasing urbanisation, especially in developing nations, could increase air pollution [25]. Climate change will also change atmospheric composition [26,27]. The historical review presented here provides context for our discussion of future developments in monitoring network coordination and standardisation that could enhance the utility of monitoring networks in detecting and understanding these changes.

2. Historical Measurements 1850s–1940s

Measurement of atmospheric composition can be traced back to the determination in 1749 of nitrate and chloride in rain water by German chemist Andreas Marggraf [28,29,30]; however, the first compositional measurements on a large spatial scale were carried out in the 1850s to understand the impacts of ground-level ozone (O3) (Table 1) [31]. A method for measurement of O3 using colour changes in test papers impregnated with starch-iodine was developed by Christian Schoenbein. It was used at over 300 sites worldwide, including locations in Europe [32,33,34,35,36,37], North America [38], and Central and South America and Asia [39,40], yielding approximately one million measurements by the end of the 19th century [41,42]. However, deficiencies with the methodology prevented standardisation between these monitoring sites, making comparison difficult. For example, test papers deployed at different sites varied in response to O3, and used different measurement scales [38]. Even when care was taken to construct test papers under the same conditions, results were not comparable because of sensitivity to humidity, wind speed and chemical interferents, and variation in test paper quality [43]. The development of more advanced measurement methods at the end of the 19th century provided the basis for more coordinated and standardised O3 monitoring (see example below of O3 monitoring at Montsouris Observatory, Paris, France).
The first national-scale air pollution monitoring network was instigated in 1869 in the UK by British chemist Robert Angus Smith [6] (Table 1). As a member of the Health of Towns Commission, Angus Smith was familiar with the human health impact of air pollution [44]; and when chief inspector of the Alkali Act 1863 he decreased environmental damage from Alkali works through reduction of hydrochloric acid emissions [45]. However, Angus Smith introduced wider insight, writing that “we are exposed to many changes of climate arising from the conditions of our civilisation; and although we cannot effect complete alterations, it is possible to do something. To learn the method we must by careful observation ascertain how we are affected” [6]. Angus Smith’s network was therefore coordinated to identify how impacts arising from human changes to atmospheric composition could be mitigated.
In making “careful observations”, Angus Smith achieved a high level of standardisation compared to previous atmospheric precipitation monitoring [29,30]. He set up 59 monitoring sites across the UK, Ireland and Germany by sending bottles to acquaintances who were instructed to obtain half a bottle of rainwater, to take steps to avoid contamination, and to provide a description of the location of the bottle. Angus Smith performed the chemical analyses on the samples once returned. The monitoring sites were classified into categories such as towns or rural locations and “inland country places” or “seaside country places” [6]. The depth of the data analysis Angus Smith was able to conduct highlights the advantage of the coordination of the 59 monitoring sites and a standardised chemical analysis and site classification [46]. For example, spatial patterns in chloride, sulphate, ammonium and nitrate precipitation concentrations across the UK were compared with the German and Irish sites. Figure 1 shows the location of sites in Angus Smith’s network, as well as sulphate and ammonium concentrations in precipitation from the samples collected in 1869–1870. Temporal trends in these constituents were monitored at one site (Manchester, UK) across the year through monthly sampling, and the concurrent measurement of multiple constituents permitted covariance analysis and source apportionment [6]. The utility of the coordinated and standardised network pioneered by Angus Smith is underlined by the multiple comparisons that have been made between the data collected at his sites and data collected decades and centuries later. For example, Coste [47] compared changes in precipitation composition between Angus Smith’s 1869–1870 results and measurements made between 1936 and 1938; and in a chronology of nitrogen deposition in the United Kingdom, measurements from Angus Smith’s network were used as the earliest quantitative estimates of nitrate and ammonium in precipitation [48].
Angus Smith considered his monitoring studies to be a first step in the establishment of a continuous, comprehensive programme for the characterisation of atmospheric composition and its impacts [6,46]. He was aware that his network suffered from deficiencies such as the characterisation of precipitation concentrations from a single sample from each site collected at different times of the year. However, despite Angus Smith’s aspirations, there was limited advancement in atmospheric monitoring networks during the rest of the 19th century. Continuous monthly measurements of precipitation composition were made at Rothamsted, south-east England, between 1888 and 1916 using a standardised method [28,49], and long-term daily measurements of O3 were recorded at the Montsouris Observatory, Paris, between 1876 and 1910 [50]. The extension of standardised monitoring to periods of several years increased the utility of measurements for discerning inter-annual variability and trends in atmospheric composition arising from increases in emissions or interventions aimed at curbing impacts. A further enhancement introduced at the Montsouris Observatory was that of concurrent measurements made using two different methods, the Schoenbein test paper and an arsenic-based technique [50]. This method inter-comparison has allowed retrospective estimation of revised O3 concentrations in various locations in the late 19th century that were originally derived from the more unreliable test paper data [32,35]. Similar subsequent inter-comparisons have also been conducted with the aim to compare pollutant concentrations measured using different methods, and across different time periods (e.g., comparisons of measurement methods for quantifying “black smoke”, “black carbon”, and “elemental carbon” concentrations [51,52,53,54,55,56,57]).
Aside from the measurements of O3 described above, early atmospheric composition attention mainly focused on smoke and sulphur pollution [58,59]. However, assessment of the problems of smoke, attribution to sources and the proposal of solutions were undertaken largely without the development of quantitative atmospheric measurements, even into the early 20th century [60,61]. Early efforts to measure smoke classified the “blackness” of a plume emitted from a source according to the shades of grey on a Ringelmann chart. These measurements were subjective and could only gauge the blackness of direct emissions, rather than exposure across larger areas [62]. From 1910, more systematic measurement of ambient smoke and sulphate enabled comparison between locations within cities and across countries, producing a more accurate picture of the impact of air pollution [1,61]. In that year, The Lancet installed “deposit gauges” to measure monthly-averaged “sootfall”, as well as sulphate and other components, at three locations in London and a rural site in nearby Surrey [63]. This was extended from March 1914 to a coordinated network of deposit gauges in 22 UK towns and cities [64]. Despite limited standardisation, this network increased understanding of smoke and sulphur pollution [65], and measurements continued at some sites until the 1970s [66]. However, the information obtained on smoke and sulphur pollution was limited by the imprecision of the method (at best ±20%), and the measurements often reflected deposited material from highly localised sources [1]. The location of some sites in the most polluted areas of towns also made spatial comparisons difficult [67]. Similar limitations applied to the early smoke, total suspended particulates (TSP) and dustfall monitoring in US cities (e.g., in Pittsburgh [68]).
In summary, prior to the 1940s, advances in coordination and standardisation of atmospheric composition monitoring were few, and the need for substantial improvements to methodology had been highlighted [61,69,70].

3. Human Health Oriented Monitoring Networks from the 1950s

Increased coordination and standardisation of air pollution monitoring in the latter part of the 20th century, was driven by two factors. Firstly, a series of fatal air pollution “smogs” in the Meuse Valley (Belgium, 1930), Donora (US, 1948) and London (UK, 1952) increased interest in air pollution research [61,71,72]. Secondly, beginning in 1943, a different type of air pollution started to cause human health impacts in Los Angeles [73]. This LA “smog”—eventually shown to be composed of photochemical pollutants, including O3, formed from reactions of volatile organic compounds (VOCs) with nitrogen oxides [74]—caused sore throats, watery eyes and headaches. In 1954, officials initiated the LA County Air Pollution Disaster Prevention Program [75] (Table 1). This program established a coordinated set of 14 monitoring sites designed to assess compliance with newly defined air-quality standards for carbon monoxide, nitrogen oxides, sulphur oxides and O3 [76]. “Alert stages” specified concentrations above which control officers were required to take specific actions to protect human health. To evaluate exceedance of alert stages, the monitoring sites were located so that measurements across the network “would be most representative of general conditions throughout the basin” [75]. Site locations were chosen based on wind-flow patterns using meteorological measurements from 76 LA meteorological stations. Standardised instrumentation was used for each component and was inter-calibrated prior to installation. Measurements of VOCs, particulate matter and other pollutants supplemented the “alert stage” monitoring to improve research on fundamental atmospheric chemistry. This was the first modern monitoring network using continuous methods [77]. The coordination of monitoring sites to investigate exposure relevant to human health, achieved through standardisation of site representativeness and instrumentation, has since been replicated globally at city, national and international scale.
The first nationally-coordinated monitoring response to the fatal air pollution disasters was the United States National Air Sampling Network (NASN) established in 1955 (Table 1). This was a central component of the program of research outlined in the 1955 US Air Pollution Control Act, which also included toxicological, clinical and epidemiological studies to advance understanding of the effects of air pollution on human health [78]. However, only a single daily measurement of “suspended particulate matter” was collected once every two weeks at 260 sites [78,79,80]. The low temporal resolution limited the information gained from the NASN [81,82], and the establishment of more advanced networks permitted more detailed investigation of the nature of air pollution in the US (see below).
The UK’s monitoring response to the air pollution disasters was the National Survey of air pollution established in 1961. This was more ambitious than the NASN in terms of the number of sites that were coordinated and standardised to achieve the goals of the network [83] (Table 1). The National Survey comprised 1200 sites, in 150 UK towns and cities, measuring smoke and sulphur dioxide (SO2) daily with the same method [84], to assess the impact of provisions within the Clean Air Act 1956. (This Act included the prohibition of dark smoke emissions from chimneys, the establishment of smoke control areas and the increased use of smokeless furnaces.) To select representative sites, all towns were graded “low”, “medium” or “high” for domestic coal consumption per unit area, industrial coal consumption per unit area and natural ventilation. Within the resulting groups, towns were split by population and geographic region before a representative sample was selected [83]. A maximum of five sites per urban area were then chosen to provide characteristic concentrations for different districts, namely, high-density terraced housing, moderate- to low-density housing (suburban), the commercial centre, industrial development and smoke controlled areas. The carefully constructed criteria for site locations ensured representativeness across the UK and corrected a previous bias in measurements towards heavily industrialised areas [67]. The coordination and standardisation of the National Survey increased the information gained from UK smoke and SO2 monitoring, including associations between human health and air pollution [85,86], and between trends in pollutant concentrations and emission reductions [87]. New methods to mitigate air pollution impacts, such as changes to town planning, also directly resulted from this monitoring network [87].
The USA established a national monitoring network, the Continuous Air Monitoring Program (CAMP), in 1963 [88]. However, in contrast to the large number of sites established for the UK National Survey, CAMP comprised six sites located in six cities. These sites were coordinated specifically to investigate the role of vehicle exhaust emissions on air pollution. Although comprising only six sites, a feature of the CAMP network was the concurrent, continuous measurement of seven atmospheric constituents [89], many at sub-hourly time resolution [88], compared with the low temporal resolution measurements of the NASN [81,82].
A new feature in standardisation introduced in both the National Survey and CAMP was in the reporting of data. Computer programs were used to process the UK National Survey measurements which were then reported in a monthly Bulletin [83]. Measurements across the CAMP sites were reported as four key statistics, derived from the use of automatic, computerised methods for recording, storing and disseminating measurements [90]. Furthermore, the higher time resolution of the CAMP measurements (sub-hourly), afforded more options in the statistics reported compared to the National Survey (daily). A punch-tape recording system automatically stored data, and a computer program calculated the daily average concentration, the monthly-averaged 24 hourly concentrations, the daily maximum hourly concentration and the daily maximum 5-min concentration of each pollutant [88]. The standardised reporting of CAMP measurements using these statistics was instigated to facilitate investigation of “inter-relationships between pollutants, concentration data, averaging period, dosage data etc.”, and to identify specific pollutants that were indicators of air pollution severity. Lynn and McMullen [89] evaluated concentrations, seasonal and diurnal variation of five pollutants across CAMP, demonstrating the utility of the standardised reporting procedure. The depth of this study contrasts with those using NASN measurements, which were limited to discussion of frequency distributions between different classifications of sites [81]. These days, the use of the Internet for the storage of monitoring network data has extended the standardised reporting implemented by CAMP, and greatly increased the accessibility of monitoring data. Networks now commonly have consistent protocols for data archiving, often in publically accessible databases.
The coordination and standardisation approaches first implemented in the LA county network, the National Survey and CAMP have now extended to a large number of national human health-coordinated monitoring networks, measuring a wider range of pollutants than the earlier networks (e.g., [90]). Examples of the widespread implementation of the principles established in these early networks are evident in national networks established in Europe [91], North America [11,92,93,94], Asia [95,96,97,98,99], Australasia [100], South America [101,102] and Africa [103,104].
The EU has extended coordination and standardisation of human health-relevant monitoring across national boundaries. The 1996 European Council (EC) Air Quality Directive [105], and the four subsequent “daughter directives”, mandate pollutant concentration standards against which each EU member state is required to assess compliance [106]. A key aim is to “assess air quality in Member States on the basis of common methods and criteria” [107]. This includes adhering to a common site classification [108] and to specified reference monitoring methods [106]. Quality control procedures are standardised through a forum, known as AQUILA, within which national air quality reference laboratories provide judgement on issues relating to measurements, and coordinate regular inter-comparisons of Member State monitoring procedures [109]. This helps to produce comparable, quality-assured measurements which are publically available in a standardised format through the AirBase data repository [110,111,112]. There is also some standardised interpretation of measurement data, as Member States must report a set of statistics for each pollutant, which provides a common comparison of air quality across the majority of Europe [113].

4. Environmental Monitoring Networks from the 1950s

A second type of network developed since the 1950s were “not established as a result of concern about a gradual rise in atmospheric pollution but instead were created to gain a better scientific understanding of atmospheric chemistry and its implications for climate, soils and agriculture” [114]. The first was the European Air Chemistry Network (EACN, Table 1), established in 1954, after meteorologist C. G. Rossby had highlighted the need for atmospheric composition measurements in addition to conventional meteorological measurements to understand the atmospheric circulation of chemical substances [115,116]. Monthly measurements of precipitation constituents were made at sites across Scandinavia and the UK, including the modification of an existing network in Sweden [117,118,119]. This yielded information on the linkage between increasing acidity of precipitation in northern Europe and long-range transport of air pollution [120,121,122]. However, information gained from EACN was limited by a lack of standardisation, as well as a flawed sampling method [123]. There was no systematic compilation of site conditions across the network, there were unquantifiable sources of error in the measurements and, after 25 years, there was no active coordination between sites in different countries [124,125].
In 1972, the Organisation for Economic Co-operation and Development (OECD) established its co-operative technical programme to measure long-range transport of air pollutants (LRTAP), which was coordinated to “determine the relative importance of local and distant sources of sulphur compounds in terms of their contribution to the air pollution over a region” [126]. This coordination led to the standardised measurement of SO2, and of sulphate in aerosol and precipitation, between 1972 and 1975 at 76 sites across Europe chosen to minimise local influences on measurements [127]. The advancement in coordination specific to LRTAP was the combination of measurement with other methods to achieve the goal of the programme, specifically the calculation of gridded emissions inventories and computer modelling (Table 1). One goal of the monitoring network was the collection of composition data to validate a Lagrangian atmospheric dispersion model [128]. Standardised interpretation of the measurement data using sector analysis showed that sulphur compounds could be transported hundreds of kilometres [127]. Importantly, the standardised LRTAP methods resulted in the identification of areas for improvement [126]. These included the need to monitor over many years because of considerable inter-annual variability in meteorological conditions, and to monitor a wider array of constituents (e.g., nitrate) in order to fully evaluate the impact of atmospheric composition (in this case, acidity in precipitation) on the environment.
Since 1977, the European Monitoring and Evaluation Programme (EMEP) has extended the work of the OECD LRTAP. The activities of EMEP were enshrined in Articles 9 and 10 of the United Nations Economic Commission for Europe (UNECE) Convention on Long Range Transboundary Air Pollution (CLRTAP) which was the first legally-binding international framework for the protection of the environment [129]. The convention outlined the need for comparable and standardised monitoring (initially of SO2 and related compounds) and data quality procedures, which was implemented by the chemical coordinating centre (CCC) based in Norway. The close coordination between monitoring network, emissions inventories and atmospheric chemistry transport modelling was also continued. In the first EMEP measurement phase (1978–1980), 60 sites from 16 countries contributed [130]. Standardisation was achieved through regular laboratory inter-comparisons and meetings between experts to decide best practice [131,132]. In 1981, comprehensive descriptions of site locations were collated by EMEP and the influence of local sources was calculated to ensure EMEP sites were representative of a large spatial domain [133]. The focus on coordination and standardisation of efforts across national boundaries has facilitated incorporation of additional pollutants and additional Member States into the monitoring programme. For example, there have been workshops on heavy metals [134], VOCs [135], and nitrogen-containing compounds [136] to synthesise best sampling and analysis techniques from world experts for implementation across the network.
Similar monitoring networks were established elsewhere over this period. For example, the USA National Atmospheric Deposition Program (NADP) was established in 1977. This network initially comprised 22 sites at which precipitation samples were collected weekly and the concentrations of ten constituents determined centrally to ensure standardisation of the analytical methods [137]. The number of sites has since expanded to 280, with integration of additional networks to measure the wet deposition of more constituents (mercury), and at greater (daily) time resolution. The coordination and standardisation of the NADP facilitated characterisation of temporal and spatial trends in atmospheric wet deposition across a large and varied geographic domain [138]. However, the standardisation implemented through EMEP goes further in that it covers monitoring sites located in multiple countries, a larger number of atmospheric constituents, as well as integration with emissions inventories and atmospheric modelling.
To ensure comparability of EMEP data across a large and expanding number of sites, a procedure for quality assurance and data submission was developed. Presently, all data are submitted to the CCC in a standardised format, and then made publically available through a common data repository [139]. The current standardised procedures for measurements and data handling required by EMEP are outlined in the EMEP Manual for Sampling and Analysis [14]. The manual contains the EMEP procedure for siting criteria (sites are classified into one of three “levels” based on the extent of monitoring, and each level has specific requirements in terms of site density), sampling methods, chemical analysis, quality assurance, and data handling and data reporting. The implementation of the standardised EMEP methods has increased confidence in the scientific information produced, and provided substantial insight on the spatial and temporal trends in atmospheric composition across Europe [140]. The standardised methods have also identified potential improvements. For example, the background document to the 2004–2009 EMEP monitoring strategy identified shortcomings to EMEP monitoring such as contamination of ammonium and calcium samples, low sensitivity of SO2 and NOx measurement techniques used in some countries, unsatisfactory laboratory performance, lack of sites in eastern Europe, and an insufficient number of background sites in Italy [141].
The coordination and standardisation of EMEP has since been extended to other regional monitoring networks around the world, such as the network established in 1998 within the Male Declaration on Control and Prevention of Air Pollution and its Likely Transboundary Effects for South Asia [142]. This network comprises 15 sites in eight South Asia countries using standardised techniques and quality control procedures. The Acid Deposition Monitoring in East Asia (EANET) programme has guidelines directly influenced by EMEP protocols to ensure standardised measurements are taken at representative sites [143]. EANET has two types of sites, deposition monitoring and ecological survey, which coordinate the investigation of atmospheric composition and its effects. Regional networks have also coordinated together. For example, to avoid duplication of monitoring, the 2010–2019 EMEP monitoring strategy recommends coordination between EMEP and other monitoring efforts such as Global Earth Observation System of Systems (GEOSS), Global Monitoring for Environment and Security (GMES), Male Declaration and EANET. The closer integration of regional monitoring efforts is also advocated by the Global Atmospheric Pollution Forum [144].
Global monitoring networks began in 1957 with the Global Ozone Observing System (GO3OS, Table 1), motivated by the work of the International Ozone Commission [145]. Initially comprising 32 sites, the network used Dobson spectrophotometers to measure total column O3 which were calibrated against a single spectrophotometer [146,147]. However, the location of sites within the network were biased towards the northern hemisphere [147]. In 1974, a second global monitoring network was established, the Background Air Pollution Monitoring Network (BAPMoN), measuring eight constituents of precipitation and atmospheric turbidity at (by 1980) 109 sites [114]. There were three levels of site classification, “regional”, “continental” and “baseline (global)” according to the representativeness of measurements. Laboratory inter-comparisons ensured standardised chemical analyses and data was submitted to a centralised body for annual reporting. An advancement of BAPMoN was the explicit coordination with other networks monitoring climate, health, terrestrial renewable resource and ocean through the UNEP Global Environment Monitoring System (GEMS) [148]. BAPMoN therefore contributed to an “internationally coordinated effort to systematically collect, analyse and evaluate data variables that determine the state of the environment and the changes they undergo in space and time” [114].
In 1989 BAPMoN and GO3OS were merged at the 41st session of the World Meteorological Organization (WMO) executive council to create the Global Atmosphere Watch (GAW) programme [149]. The aim of GAW was to produce quality assured and controlled long-term observations of atmospheric composition to reduce environmental risks to society, strengthen capabilities to predict climate, weather and air quality and to contribute to scientific assessments in support of air quality [150]. This has resulted in a coordinated network of 436 GAW sites across all continents which are classified as regional or global, and meet criteria which demonstrate minimal local influence on measurements. GAW also produces a measurement guide to ensure standardisation and comparability of results [151]. The standardisation of archiving and accessibility to results is achieved through the publication of quality-controlled data through GAW’s world data centres.

5. Current State of Monitoring Networks

The advancements in coordination and standardisation in atmospheric composition monitoring networks since their establishment in the mid-1800s underpin the operation of the large number of city, national, regional and global-scale networks measuring a multitude of pollutants currently established around the world. The UNEP Air Quality Policy Catalogue has compiled information on national air quality policy, including whether there is an air quality monitoring system in operation [13]. Globally, 91 countries, covering 77% of the global population, are listed as having an active air quality monitoring network (48% of all countries). This includes countries on all continents. However, there are regional differences in the proportion of countries with an air quality monitoring system. In North America, both USA and Canada have dense monitoring networks, 83% of countries in Europe have a monitoring network, as well as 60% and 53% of Asian, and Latin American and Caribbean countries, respectively. By contrast only 13% of African countries have a monitoring network. The step changes in standardisations, for example with regard to monitoring methods, site representativeness, data quality and data archiving, over the past 150 years have increased the ability of this current suite of monitoring networks to investigate the severity of health and environmental impacts, and advance knowledge on the atmospheric processes which produce these impacts [140,149,152,153,154]. This includes the ability to investigate and characterize changes in atmospheric composition over time, e.g., in response to emissions reduction strategies [48,140,155,156,157,158,159,160].
In addition to network coordination and standardisation, economic conditions, legislation, and policy and scientific focus have also influenced the historical developments that have led to the current state of monitoring networks through the establishment of new monitoring networks, and through expansion and contraction of existing networks. For example, monitoring networks are substantially more numerous in developed than in developing countries [161], a number of networks are primarily driven by requirements of legislation (e.g., [154]), and there are differences between networks designed to investigate different scientific questions, e.g., relating to human health-relevant air quality or environmental impacts. However, the chronology of network development presented here shows that for monitoring networks established under a range of different conditions, advances in coordination and standardisation resulted in increased utility.
The current atmospheric composition monitoring networks that have resulted from this historical development have some identified limitations. Chow and Watson [162] noted that, for those networks designed to evaluate against air quality standards, “unfortunately the sole focus on compliance hinders the utility of data for a wider range of applications”. AQEG [154] also determined that use of the entirety of the UK compliance network for non-compliance studies was not widespread, and instead a subset of “supersites” were more commonly utilised. Among the additional applications Chow and Watson [162] list are source apportionment, quantification of background levels and quantification of adverse effects. Brook et al. [163] concluded that current air quality management plans lack the mechanism by which improvements in health and environmental impacts can be documented and assessed. Hsu et al. [161] noted the disparity in the extent of ground-based monitoring networks between developed and developing countries, which has also been emphasised for specific pollutants by Engel-Cox et al. [164] (particulate matter), Bowman [165] (O3), Hung et al. [166] (persistent organic pollutants) and Pirrone et al. [167] (mercury). Standardisation of data quality between different monitoring networks to ensure the comparability of the full suite of atmospheric composition measurements collected globally has been highlighted [161]. Limited effective feedback mechanisms between the communities collecting monitoring data and communities using the data, and inefficient processes for data distribution and analysis have been emphasised from an evaluation of North American networks [94]. Additionally, the need for more effective use of monitoring network data to improve validation of emissions inventories [168] and comparison with model output [154] has also been outlined. In general, the substantial volume of data currently collected by coordinated and standardised monitoring networks requires effective interpretation in order to investigate the interactions between the atmosphere, humans and the rest of the natural environment. The advent of low cost sensors is likely to increase the data volume substantially [169,170].
Hence, future advancements which address some of these limitations would further extend the development of monitoring networks. Methods previously outlined to increase the utility of monitoring networks include reporting data at higher time resolution and to the limit of precision, calibrating instruments to lower concentrations, and more frequent co-location of atmospheric composition and meteorological measurements [154,162]. Brook et al. [163] proposed results-oriented, multi-pollutant air quality management strategies which aim to “characterise the linkages in the accountability chain from emissions to [at least] exposure”. This requires improved knowledge of which pollutants cause effects, the effects of individual pollutants, and the effects of multi-pollutant exposure, as well as establishing objective metrics for prioritizing health vs ecosystem effects. Kuhlbusch et al. [171] describe an “information network” as part of the future of urban air quality monitoring in Europe which integrates atmospheric composition data from a diverse range of sources (e.g., fixed monitoring sites, remote sensing, mobile monitoring, and urban scale modelling). To achieve closer integration of air quality and climate change mitigation, Schmale et al. [172] suggest an “information framework” where air quality and climate impacts are simultaneously evaluated by calculating a suite of metrics in order to identify co-beneficial strategies as well as identifying where trade-offs are needed.
As outlined in this work, network standardisation is now explicitly embedded within widespread monitoring efforts with regard to site classification, measurement method, data quality and assurance, and data archiving [14,98,143]. Hence, specifically in the context of the advances in network standardisation described here, future steps in monitoring network development could include methods which extend monitoring network standardisation to the analysis of atmospheric composition data. For example, spatial variation in pollutant concentrations and impacts can be investigated when common methods and statistics are applied to interpret data from multiple sites across a network. For example, the measurement of air quality across the EU in relation to the EC Air Quality Directive requires Member States to submit a standardised set of statistics which allows comparison of air quality across Europe [113,173]. Similarly, there are standardised interpretations of data across national (e.g., the UK Automatic Urban and Rural Network (AURN) [174]) and international (e.g., EMEP [140]) monitoring networks. However, standardised interpretation of atmospheric composition data is currently not commonly ingrained within a monitoring network’s protocols in the same way as site representativeness, measurement methods, etc. A disadvantage of current efforts to apply a standardised interpretation of data is that data from monitoring networks set up to achieve similar goals are often interpreted in different ways, making comparison between networks difficult. For example, differences in air quality standards between two monitoring networks make interpretation of the relative air quality situation in each country difficult [24,175]. Additionally, standard analyses of data across multiple monitoring sites generally either focus on the quantification of a particular impact or comparison with air quality targets [113,152,173], or on spatial and temporal variation in atmospheric constituents generally [160,176], rather than a holistic characterisation of both an impact of atmospheric composition, and the conditions producing it.
Hence while the information gained from monitoring networks has been substantial [177], further advancement in the standardisation of monitoring network data interpretation could help to maximise the information derived from networks. To realise this requires assessment of appropriate statistics to apply to data collected across networks. The derivation of standard sets of statistics which quantify both an impact of atmospheric composition, as well as the conditions which produce it, is one method to achieve this. These statistics could then be consistently applied across all sites within a network, or across different monitoring networks in different regions which are nevertheless coordinated to achieve the same goal. This would provide the common basis for the consistent assessment of atmospheric composition impacts across large, international spatial domains, in addition to, rather than in place of, other more specific analyses of atmospheric composition data at particular monitoring sites. A “chemical climatology” framework has been outlined and applied, based on the philosophy of Robert Angus Smith, which provides a method by which these standard sets of statistics could be derived [178,179,180]. This approach derives statistics which quantify a particular “impact”, the “state” of atmospheric composition variation producing that impact, and the “drivers” producing that state.
Using this chemical climatology framework therefore targets analysis of atmospheric composition data towards identifying those conditions producing a specific impact of atmospheric composition. To derive a chemical climate, an impact of atmospheric composition must first be selected, e.g., the impact on human health from long-term PM2.5 exposure. The metric used to quantify this impact is then selected; for this particular example it is the annual average PM2.5 concentration [181]. Following calculation of the impact metric, the state and drivers statistics are then constructed such that they inform on the conditions producing annual average PM2.5. These state statistics could include the contribution from across the year, and the diurnal cycle to annual average PM2.5 (to identify the time periods with disproportionate contributions), the contribution from across the PM2.5 concentration distribution (to identify the relative contribution of short-term peak PM2.5 episodes compared to frequent, more moderate concentrations), and the contribution of different PM2.5 components. Drivers could then include the derivation of statistics to identify emission source sectors, or geographic regions with large contributions to annual average PM2.5 at the location of interest, for example in combination with additional data like air mass back trajectories or emission inventories. Note that for each particular impact of atmospheric composition (e.g., on human health, vegetation, ecosystems, etc.), a separate chemical climate can be derived, focusing the derivation of state and driver statistics on most effectively identifying how the particular impact is produced (see previous applications of this framework for more details [179,180,182]). The standardised interpretation of the large volume of data collected by networks is also aided by the development of tools specifically designed for the analysis of atmospheric composition data, for example the Openair software package [183].
Advantages to this approach include that the standardised interpretation applied to monitoring network data is targeted towards answering the most important scientific and policy-relevant questions by not only quantifying a specific impact, but linking this impact to the conditions producing it. The application of the derived statistics across a network spanning the spatial domain of a policy-region could therefore assist in improving the interface between air quality science and policy determination, the importance of which has been highlighted previously [184,185,186,187]. Additionally, the widespread application of these statistics would allow for the integration of a large number of sites to assess spatial differences in impacts and the conditions producing them. This is especially important for those regions with a lower spatial density of sites, as the measurements made in these regions can be compared with a much larger database of measurements from sites in other regions. The linkage between an impact and causal drivers highlights the most effective methods for impact mitigation [178], and therefore the consistent application of these statistics across a network facilitates assessment of the spatial applicability of different mitigation strategies. Hence for those regions with a low spatial density of sites or short time series, the ability to compare with regions with a high density of sites and long time series the magnitude of a particular impact, and the similarity/differences in the conditions producing it, provides valuable information on which impact mitigation strategies from one area might be most appropriate for that region.

6. Conclusions

A series of advancements in atmospheric composition monitoring network coordination and standardisation since the mid-1800s has been shown to underpin the operation of the substantial number of such networks currently in existence worldwide. These include advances in respect of standardisation of measurement methods, site representativeness, data quality and data archiving procedures. Since the 1950s, these developments have progressed through two types of networks, those coordinated to investigate human health impacts, and those coordinated to investigate interactions between atmospheric composition and the terrestrial environment. However, identified limitations in the current state of monitoring networks demonstrate the scope for increased network coordination and standardisation. These limitations include a sole focus on compliance monitoring and the need for an improved mechanism to evaluate the effects of mitigation strategies on atmospheric composition impacts.
Given the unprecedented volume of data that is now collected across the world’s atmospheric monitoring networks, the next steps in the chronology of development in network standardisation are suggested to be in more integrated analyses of monitor and other relevant data within “information” or “chemical climatology” frameworks that seek to more directly link the impacts, state and drivers of atmospheric composition. This application of common methods to interpret atmospheric composition data within such a framework would increase the ability of networks to compare impact severity spatially, and to identify regions with common drivers for the impact. This advancement would increase the utility of monitoring networks for determining the spatial applicability of impact mitigation strategies, and ensure they continue to play a central role in detecting and evaluating changes in atmospheric composition, and in informing the most effective response.

Acknowledgments

Christopher S. Malley acknowledges the University of Edinburgh School of Chemistry, the Natural Environment Research Council Centre for Ecology & Hydrology (NERC-CEH studentship funding project no. NEC04544) and the UK Department for Environment, Food and Rural Affairs (Defra grant No.AQ0647) for funding.

Author Contributions

All authors collaborated in designing the structure and scope of this review, and to the drafting, editing and production of the article.

Conflicts of Interest

The authors declare no conflict of interest.

References

  1. Brimblecombe, P. The Big Smoke: A History of Air Pollution in London Since Medieval Times; Methuen: London, UK, 1987. [Google Scholar]
  2. Gurjar, B.R.; Jain, A.; Sharma, A.; Agarwal, A.; Gupta, P.; Nagpure, A.S.; Lelieveld, J. Human health risks in megacities due to air pollution. Atmos. Environ. 2010, 44, 4606–4613. [Google Scholar] [CrossRef]
  3. Galloway, J.N.; Dentener, F.J.; Marmer, E.; Cai, Z.C.; Abrol, Y.R.; Dadhwal, V.K.; Murugan, A.V. The Environmental Reach of Asia. Ann. Rev. Environ. Resour. 2008, 33, 461–481. [Google Scholar] [CrossRef]
  4. Mills, G.; Hayes, F.; Simpson, D.; Emberson, L.; Norris, D.; Harmens, H.; Bueker, P. Evidence of widespread effects of ozone on crops and (semi-)natural vegetation in Europe (1990–2006) in relation to AOT40-and flux-based risk maps. Glob. Chang. Biol. 2011, 17, 592–613. [Google Scholar] [CrossRef] [Green Version]
  5. IPCC Climate Change 2014: Impacts, Adaptation, and Vulnerability. IPCC Working Group II Contribution to Fifth Assessment Report (WGII AR5). Intergovernmental Panel on Climate Change. Available online: http://www.ipcc.ch/report/ar5/wg2/ (accessed on 6 December 2016).
  6. Angus Smith, R. Air and Rain: The Beginnings of a Chemical Climatology; Longmans, Green and Co.: London, UK, 1872. [Google Scholar]
  7. Abbatt, J.; George, C.; Melamed, M.; Monks, P.; Pandis, S.; Rudich, Y. New directions: Fundamentals of atmospheric chemistry: Keeping a three-legged stool balanced. Atmos. Environ. 2014, 84, 390–391. [Google Scholar] [CrossRef]
  8. Tanner, R.L. Measurements in support of air quality improvement—Some historical insights. Atmos. Environ. 2003, 37, 1271–1276. [Google Scholar] [CrossRef]
  9. Clemitshaw, K.C. A review of instrumentation and measurement techniques for ground-based and airborne field studies of gas-phase tropospheric chemistry. Crit. Rev. Env. Sci. Tech. 2004, 34, 1–108. [Google Scholar] [CrossRef]
  10. Chow, J.C. Measurement methods to determine compliance with ambient air quality standards for suspended particles. J. Air Waste Manag. Assoc. 2012, 45, 320–382. [Google Scholar] [CrossRef]
  11. United State Environmental Protection Agency (US EPA). List of Designated Reference and Equivalent Methods. Available online: http://www.epa.gov/ttn/amtic/files/ambient/criteria/reference-equivalent-methods-list.pdf (accessed on 6 December 2016).
  12. Quincey, P.; Butterfield, D.; Green, D.; Coyle, M.; Cape, J.N. An evaluation of measurement methods for organic, elemental and black carbon in ambient air monitoring sites. Atmos. Environ. 2009, 43, 5085–5091. [Google Scholar] [CrossRef] [Green Version]
  13. United Nations Environment Programme (UNEP). Air Quality Policy Catalogue. Available online: http://www.unep.org/Transport/Airquality/ (accessed on 6 December 2016).
  14. EMEP Manual for Sampling and Analysis. EMEP/CCC Report 1/2014, Co-Operative Programme for Monitoring and Evaluation of the Transmission of Air Pollutants in Europe. 2014. Available online: http://www.nilu.no/projects/ccc/manual/index.html (accessed on 6 December 2016).
  15. Harrison, R.G.; Aplin, K.L. Mid-nineteenth century smoke concentrations near London. Atmos. Environ. 2002, 36, 4037–4043. [Google Scholar] [CrossRef]
  16. Harrison, R.G. Urban smoke concentrations at Kew, London, 1898–2004. Atmos. Environ. 2006, 40, 3327–3332. [Google Scholar] [CrossRef]
  17. Flagan, R.C. History of electrical aerosol measurements. Aerosol Sci. Technol. 1998, 28, 301–380. [Google Scholar] [CrossRef]
  18. Tsai, Y.I. Atmospheric visibility trends in an urban area in Taiwan 1961–2003. Atmos. Environ. 2005, 39, 5555–5567. [Google Scholar] [CrossRef]
  19. Sabetghadam, S.; Ahmadi-Givi, F.; Golestani, Y. Visibility trends in Tehran during 1958–2008. Atmos. Environ. 2012, 62, 512–520. [Google Scholar] [CrossRef]
  20. Husain, L.; Khan, A.J.; Ahmed, T.; Swami, K.; Bari, A.; Webber, J.S.; Li, J. Trends in atmospheric elemental carbon concentrations from 1835 to 2005. J. Geophys. Res. Atmos. 2008, 113. [Google Scholar] [CrossRef]
  21. Gao, L.; Jia, G.; Zhang, R.; Che, H.; Fu, C.; Wang, T.; Zhang, M.; Jiang, H.; Yan, P. Visual range trends in the Yangtze River Delta Region of China, 1981–2005. J. Air Waste Manag. Assoc. 2011, 61, 843–849. [Google Scholar] [CrossRef] [PubMed]
  22. Aplin, K.L. Smoke emissions from industrial western Scotland in 1859 inferred from Lord Kelvin’s atmospheric electricity measurements. Atmos. Environ. 2012, 50, 373–376. [Google Scholar] [CrossRef]
  23. Kelly, A.; Lumbreras, J.; Maas, R.; Pignatelli, T.; Ferreira, F.; Engleryd, A. Setting national emission ceilings for air pollutants: Policy lessons from an ex-post evaluation of the Gothenburg Protocol. Environ. Sci. Policy 2010, 13, 28–41. [Google Scholar] [CrossRef]
  24. Vahlsing, C.; Smith, K.R. Global review of national ambient air quality standards for PM10 and SO2 (24 h). Air Qual. Atmos. Health 2012, 5, 393–399. [Google Scholar] [CrossRef] [PubMed]
  25. Seto, K.C.; Gueneralp, B.; Hutyra, L.R. Global forecasts of urban expansion to 2030 and direct impacts on biodiversity and carbon pools. Proc. Natl. Acad. Sci. USA 2012, 109, 16083–16088. [Google Scholar] [CrossRef] [PubMed]
  26. Fiore, A.M.; Naik, V.; Leibensperger, E.M. Air quality and climate connections. J. Air Waste Manag. Assoc. 2015, 65, 645–685. [Google Scholar] [CrossRef] [PubMed]
  27. Von Schneidemesser, E.; Monks, P.S.; Allan, J.D.; Bruhwiler, L.; Forster, P.; Fowler, D.; Lauer, A.; Morgan, W.T.; Paasonen, P.; Righi, M.; et al. Chemistry and the linkages between air quality and climate change. Chem. Rev. 2015, 115, 3856–3897. [Google Scholar] [CrossRef] [PubMed]
  28. Miller, N.H.J. The amounts of nitrogen as ammonia and as nitric acid and of chlorine in the rain water collected at Rothamsted. J. Agric. Sci. 1905, 1, 280–303. [Google Scholar] [CrossRef]
  29. Eriksson, E. Composition of atmospheric precipitation: 1. Nitrogen compounds. Tellus 1952, 3, 215–232. [Google Scholar]
  30. Eriksson, E. Composition of atmospheric precipitation: 2. sulphur, chlorine, iodine compounds. Tellus 1952, 4, 280–303. [Google Scholar]
  31. Farrell, A.E. Learning to see the invisible: Discovery and measurement of ozone. Environ. Monit. Assess. 2005, 106, 59–80. [Google Scholar] [CrossRef] [PubMed]
  32. Anfossi, D.; Sandroni, S.; Viarengo, S. Tropospheric ozone in the 19th Century—The Moncalieri series. J. Geophys. Res. Atmos. 1991, 96, 17349–17352. [Google Scholar] [CrossRef]
  33. Lisac, I.; Grubisic, V. An analysis of surface ozone data measured at the end of the 19th Century in Zagreb, Yugoslavia. Atmos. Environ. 1991, 25, 481–486. [Google Scholar] [CrossRef]
  34. Bozo, L.; Weidinger, T. Tropospheric ozone measurements over Hungary in the 19th Century. Ambio 1995, 24, 129–130. [Google Scholar]
  35. Anfossi, D.; Sandroni, S. Ozone levels in Paris one century ago. Atmos. Environ. 1997, 31, 3481–3482. [Google Scholar] [CrossRef]
  36. Nolle, M.; Ellul, R.; Ventura, F.; Gusten, H. A study of historical surface ozone measurements (1884–1900) on the island of Gozo in the central Mediterranean. Atmos. Environ. 2005, 39, 5608–5618. [Google Scholar] [CrossRef]
  37. Lisac, I.; Vujnovic, V.; Marki, A. Ozone measurements in Zagreb, Croatia, at the end of 19(th) century compared to the present data. Meteorol. Z. 2010, 19, 169–178. [Google Scholar] [CrossRef]
  38. Bojkov, R.D. Surface ozone during the 2nd half of the 19th Century. J. Clim. Appl. Meteorol. 1986, 25, 343–352. [Google Scholar] [CrossRef]
  39. Sandroni, S.; Anfossi, D.; Viarengo, S. Surface ozone levels at the end of the 19th Century in South America. J. Geophys. Res. Atmos. 1992, 97, 2535–2539. [Google Scholar] [CrossRef]
  40. Sandroni, S.; Anfossi, D. Historical data of surface ozone at tropical latitudes. Sci. Total Environ. 1994, 148, 23–29. [Google Scholar] [CrossRef]
  41. Paneth, F.A.; Edgar, J.L. Concentration and measurement of atmospheric ozone. Nature 1938, 142, 112–113. [Google Scholar] [CrossRef]
  42. Colbeck, I.; Mackenzie, A. Air Pollution by Photochemical Oxidants; Elsevier: New York, NY, USA, 1994. [Google Scholar]
  43. Fox, C.B. Sanitary Examinations of Water, Air and Food; J & A Churchill: London, UK, 1886. [Google Scholar]
  44. Gibson, A.; Farrar, W.V. Robert Angus Smith, F.R.S., and “Sanitary Science”. Notes Rec. R. Soc. Lond. 1974, 28, 241–262. [Google Scholar] [CrossRef]
  45. Reed, P. The Alkali Inspectorate 1874–1906: Pressure for wider and tighter pollution regulation. Ambix 2012, 59, 131–151. [Google Scholar] [CrossRef] [PubMed]
  46. Gorham, E. Robert Angus Smith, FRS and “Chemical Climatology”. Notes Rec. R. Soc. Lond. 1982, 36, 267–272. [Google Scholar] [CrossRef] [PubMed]
  47. Coste, J.H. Atmospheric pollution in the nineteenth century and in recent years: An attempt at comparison. Analyst 1942, 67, 361–363. [Google Scholar]
  48. Fowler, D.; O’Donoghue, M.; Muller, J.B.A.; Smith, R.I.; Dragosits, U.; Skiba, U.; Sutton, M.; Brimblecombe, P. A Chronology of nitrogen deposition in the UK Between 1900 and 2000. Water Air Soil Poll. 2004, 4, 9–23. [Google Scholar] [CrossRef]
  49. Russel, E.J.; Richards, E.H. The amounts and composition of rain and snow falling at Rothamsted. J. Agric. Sci. 1919, 9, 309–337. [Google Scholar] [CrossRef]
  50. Volz, A.; Kley, D. Evaluation of the Montsouris series of ozone measurements made in the 19th Century. Nature 1988, 332, 240–242. [Google Scholar] [CrossRef]
  51. Ball, D.J.; Hume, R. The relative importance of vehicular and domestic emissions of dark smoke in greater London in the mid-1970’s, the significance of smoke shade measurements, and an explanation of the relationship of smoke shade to gravimetric measurements of particulate. Atmos. Environ. 1977, 11, 1065–1073. [Google Scholar] [CrossRef]
  52. Chen, L.W.A.; Chow, J.C.; Watson, J.G.; Schichtel, B.A. Consistency of long-term elemental carbon trends from thermal and optical measurements in the IMPROVE network. Atmos. Meas. Tech. 2012, 5, 2329–2338. [Google Scholar] [CrossRef] [Green Version]
  53. Edwards, J.D.; Ogren, J.A.; Weiss, R.E.; Charlson, R.J. Particulate air pollutants: A comparison of British “smoke” with optical absorption coefficient and elemental carbon concentration. Atmos. Environ. 1983, 17, 2337–2341. [Google Scholar] [CrossRef]
  54. Heal, M.R.; Quincey, P. The relationship between black carbon concentration and black smoke: A more general approach. Atmos. Environ. 2012, 54, 538–544. [Google Scholar] [CrossRef]
  55. Hoek, G.; Welinder, H.; Vaskovi, E.; Ciacchini, G.; Manalis, N.; Røyset, O.; Reponen, A.; Cyrys, J.; Brunekreef, B. Interlaboratory comparison of PM10 and black smoke measurements in the PEACE study. Atmos. Environ. 1997, 31, 3341–3349. [Google Scholar] [CrossRef]
  56. Lee, R.E.; Caldwell, J.S.; Morgan, G.B. The evaluation of methods for measuring suspended particulates in air. Atmos. Environ. 1972, 6, 593–622. [Google Scholar] [CrossRef]
  57. Pashel, G.E.; Egner, D.R. A comparison of ambient suspended particulate matter concentrations as measured by the British smoke sampler and the high volume sampler at 16 sites in the United States. Atmos. Environ. 1981, 15, 919–927. [Google Scholar] [CrossRef]
  58. Grainger, R.D. Unhealthiness of Towns, Its Causes and Remedies; Charles Knight & Co.: London, UK, 1845. [Google Scholar]
  59. Playfair, L. Report on the State of Large Towns in Lancashire; W. Clowes and Sons: London, UK, 1845. [Google Scholar]
  60. Smith, W.B. Should we longer tolerate the pollution of the air? Br. Med. J. 1922, 2, 361–362. [Google Scholar]
  61. Halliday, E.C. A historical review of atmospheric pollution. In Air Pollution, World Health Organisation Monograph Series No. 46; World Health Organization: Geneva, Switzerland, 1961; pp. 9–37. [Google Scholar]
  62. Uekoetter, F. The strange career of the Ringelmann smoke chart. Environ. Monit. Assess. 2005, 106, 11–26. [Google Scholar] [CrossRef] [PubMed]
  63. Des Voeuz, H.A.; Owens, J.S. The sootfall of London: Its amount, quality and effects. Lancet 1912, 179, 47–50. [Google Scholar]
  64. Atmospheric Pollution. Nature 1914, 94, 433–434.
  65. Shaw, N.; Owens, J.S. The Smoke Problem of Great Cities; Constable and Company Ltd.: London, UK, 1925. [Google Scholar]
  66. Brimblecombe, P. Trends in the deposition of sulphate and total solids in London. Sci. Total Environ. 1982, 22, 97–103. [Google Scholar] [CrossRef]
  67. Mosley, S. “A network of trust”: Measuring and monitoring air pollution in British cities, 1912–1960. Environ. Hist. Camb. 2009, 15, 273–302. [Google Scholar] [CrossRef]
  68. Davidson, C.I. Air pollution in Pittsburgh: A historical perspective. J. Air Pollut. Control Assoc. 1979, 29, 1035–1041. [Google Scholar] [CrossRef]
  69. Cambi, F. Sampling, analysis and instrumentation in the field of air pollution. In Air Pollution, World Health Organisation Monograph Series No. 46; World Health Organization: Geneva, Switzerland, 1961; pp. 63–96. [Google Scholar]
  70. McCabe, L.C. The identification of an air pollution problem. In Air Pollution, World Health Organization Monograph Series No. 46; World Health Organization: Geneva, Switzerland, 1961; pp. 39–47. [Google Scholar]
  71. Heimann, H. Effects of air pollution on human health. In Air Pollution, World Health Organisation Monograph Series No. 46; World Health Organization: Geneva, Switzerland, 1961; pp. 159–220. [Google Scholar]
  72. Bell, M.L.; Davis, D.L.; Fletcher, T. A retrospective assessment of mortality from the London smog episode of 1952: The role of influenza and pollution. Environ. Health Perspect. 2004, 112, 6–8. [Google Scholar] [CrossRef] [PubMed]
  73. Senn, C.L. General air pollution: Los Angeles “smog”. Am. J. Public Nations Health 1948, 38, 962–965. [Google Scholar] [CrossRef]
  74. Haagen-Smit, A.J. Photochemistry and smog. J. Air Pollut. Control Assoc. 1963, 13, 444–454. [Google Scholar] [CrossRef] [PubMed]
  75. Chass, R.L.; Pratch, M.; Atkinsson, A.A. The air pollution disaster-prevention program of Los Angeles County. J. Air Pollut. Control Assoc. 1958, 8, 72–86. [Google Scholar] [CrossRef]
  76. Maga, J.A.; Goldsmith, J.R. Standards for air quality in California. J. Air Pollut. Control Assoc. 1960, 10, 453–467. [Google Scholar] [CrossRef] [PubMed]
  77. Roger, L.H. Nitric oxide and nitrogen dioxide in the Los Angeles atmosphere. J. Air Pollut. Control Assoc. 1958, 8, 124–128. [Google Scholar] [CrossRef]
  78. MacKenzie, V.G. Progress report on air pollution. Public Health Rep. 1958, 73, 39–41. [Google Scholar] [CrossRef]
  79. New Cities in PHS Air Sampling Network. Public Heal. Rep. 1964, 79, 336. Available online: http://labs.jstor.org/sustainability/stable/10.2307/4592123 (accessed on 6 December 2016).
  80. McMullen, T.B.; Smith, R. The Trend of Suspended Particulates in Urban Air: 1957–1964. Environmental Health Series: Air Pollution Public Health Service Publication No. 999-AP-19, U.S. Department of Health, Education and Welfare: Public Health Service, 1965. Available online: http://nepis.ep (accessed on 6 December 2016).
  81. Zimmer, C.E.; Tabor, E.C.; Stern, A.C. Particulate pollutants in the air of the United States. J. Air Pollut. Control Assoc. 1959, 9, 136–143. [Google Scholar] [CrossRef]
  82. Ludwig, J.H. Some ramifications of air contamination. Public Health Rep. 1960, 75, 413–419. [Google Scholar] [CrossRef] [PubMed]
  83. Clifton, M. The national survey of air pollution. Proc. R. Soc. Med. 1964, 57, 1013–1015. [Google Scholar]
  84. Clifton, M. How air pollution is detected. Proc. R. Soc. Med. 1964, 57, 615–618. [Google Scholar] [PubMed]
  85. Chinn, S.; Florey, C.D.; Baldwin, I.G.; Gorgol, M. The relation of mortality in England and Wales 1969–73 to measurements of air pollution. J. Epidemiol. Commun. Health 1981, 35, 174–179. [Google Scholar] [CrossRef]
  86. Walters, S.; Griffiths, R.K.; Ayres, J.G. Temporal associations between hospital admissions for asthma in Birmingham and ambient levels of sulfur dioxide and smoke. Thorax 1994, 49, 133–140. [Google Scholar] [CrossRef] [PubMed]
  87. Craxford, S.R.; Weatherley, M.P.M. Air pollution in Towns in the United Kingdom. Philos. Trans. R. Soc. A 1971, 269, 503–513. [Google Scholar] [CrossRef]
  88. Jutze, G.A.; Tabor, E.C. The continuous air monitoring program. JAPCA J. Air Waste M. 1963, 13, 278–280. [Google Scholar]
  89. Lynn, D.A.; McMullen, T.B. Air pollution in six major U.S. cities as measured by the continuous air monitoring program. JAPCA J. Air Waste M. 1966, 16, 186–190. [Google Scholar]
  90. Zimmer, C.E.; Nehls, G.J. The Impact of computers upon air pollution research. J. Air Pollut. Control Assoc. 1968, 18, 383–386. [Google Scholar] [CrossRef] [PubMed]
  91. Dabek-Zlotorzynska, E.; Dann, T.F.; Kalyani Martinelango, P.; Celo, V.; Brook, J.R.; Mathieu, D.; Ding, L.; Austin, C.C. Canadian National Air Pollution Surveillance (NAPS) PM2.5 speciation program: Methodology and PM2.5 chemical composition for the years 2003–2008. Atmos. Environ. 2011, 45, 673–686. [Google Scholar]
  92. International Comparison of Air Quality Monitoring Systems. ATMO France, 2011. Available online: http://www.airparif.asso.fr/_pdf/publications/comparaison-internationale-atmofrance-en.pdf (accessed on 6 December 2016).
  93. Bachmann, J. Will the circle be unbroken: A history of the US national ambient air quality standards. J. Air Waste Manag. Assoc. 2007, 57, 652–697. [Google Scholar] [PubMed]
  94. Demerjian, K.L. A review of national monitoring networks in North America. Atmos. Environ. 2000, 34, 1861–1884. [Google Scholar] [CrossRef]
  95. Kamyotra, S.; Basu, D.; Agrawal, S.; Darbari, T.; Roychoudhury, S.; Hagar, J.; Sultan, R. National Ambient Air Quality Status and Trends in India—2010. Central Pollution Control Board Report Number NAAQMS/35/2011-2012; Ministry of Environment & Forests, 2012. Available online: http://www.cpcb.nic.in/upload/NewItems/NewItem_192_NAAQSTI.pdf (accessed on 6 December 2016). [Google Scholar]
  96. Chow, C.F. Air Quality in Hong Kong 2013. Environmental Protection Department Report Number EPD/TR 1/14; Air Science Group, Hong Kong Environmental Protection Department, 2014. Available online: http://www.aqhi.gov.hk/api_history/english/report/files/AQR2013e_final.pdf (accessed on 6 December 2016). [Google Scholar]
  97. Wang, S.; Li, G.G.; Gong, Z.Y.; Du, L.; Zhou, Q.T.; Meng, X.Y.; Xie, S.Y.; Zhou, L. Spatial distribution, seasonal variation and regionalization of PM2.5 concentrations in China. Sci. China Chem. 2015, 58, 1435–1443. [Google Scholar] [CrossRef]
  98. Kim Oanh, N.T.; Pongkiatkul, P.; Upadhyay, N.; Hopke, P.P. Designing ambient particulate matter monitoring program for source apportionment study by receptor modeling. Atmos. Environ. 2009, 43, 3334–3344. [Google Scholar] [CrossRef]
  99. Zhang, Y.-L.; Cao, F. Fine particulate matter (PM2.5) in China at a city level. Sci. Rep. 2015, 5, 14884. [Google Scholar] [CrossRef] [PubMed]
  100. Victoria Air Monitoring Report 2013—Compliance with the National Environment Protection (Ambient Air Quality) Measure. EPA Victoria Publication Number 1569; Environmental Protection Agency Victoria, 2014. Available online: http://www.epa.vic.gov.au/~/media/Publications/15 (accessed on 6 December 2016).
  101. Gramsch, E.; Cereceda-Balic, F.; Oyola, P.; von Baer, D. Examination of pollution trends in Santiago de Chile with cluster analysis of PM10 and Ozone data. Atmos. Environ. 2006, 40, 5464–5475. [Google Scholar] [CrossRef]
  102. Venegas, L.E.; Mazzeo, N.A. An ambient air quality monitoring network for Buenos Aires city. Int. J. Environ. Pollut. 2010, 40, 184–194. [Google Scholar] [CrossRef]
  103. South Africa Atmospheric Quality Information Directorate Baseline Survey on Government-Owned Air Quality Monitoring Networks (AQMN). Department of Environmental Affairs, Republic of South Africa, 2011. Available online: http://www.saaqis.org.za/Downloads.aspx?type=AQ (accessed on 6 December 2016).
  104. Vertue, B.; Feig, G. South African Weather Service—Background Station Monitoring Report—February 2015. South African Weather Service Document Reference AQI-BCKG-MER-2015-FEB-001.1. 2015. Available online: http://www.saaqis.org.za/Downloads.aspx?type=AQ (accessed on 6 December 2016).
  105. European Commission. European Council Directive 96/62/EC on Ambient Air Quality Assessment and Management; No L 296/55; European Commission: Brussels, Belgium, 27 September 1996. [Google Scholar]
  106. European Commission. European Council Directive 2008/50/EC on Ambient Air Quality and Cleaner Air for Europe; No L 152/1; European Commission: Brussels, Belgium, 21 May 2008. [Google Scholar]
  107. Van Aalst, R.; Edwards, L.; Pulles, T.; de Saeger, E.; Tombrou, M.; Tonnesen, D. Guidance Report on Preliminary Assessment under EC Air Quality Directives. EEA Technical Report No 11. European Environment Agency, 1998. Available online: http://www.eea.europa.eu/publications/TEC11a (accessed on 6 December 2016).
  108. Spangl, W.; Schneider, J.; Moosmann, L.; Nagi, C. Representativeness and Classification of Air Quality Monitoring Stations, Umweltbundesamt Report, 2007. Available online: http://www.umweltbundesamt.at/fileadmin/site/publikationen/REP0121.pdf (accessed on 6 December 2016).
  109. AQUILA National Air Quality Reference Laboratories and the European Network. Roles and Requirements for Measurement Traceability, Accreditation, Quality Assurance/Quality Control, and Measurement Comparisons, at National and European Levels; European Commission: Brussels, Belgium, 2009. [Google Scholar]
  110. EIONET European Topic Centre on Air Pollution and Climate Change Mitigation AirBase database. Available online: http://acm.eionet.europa.eu/databases/ airbase/ (accessed on 6 December 2016).
  111. European Commission. European Commission Implementing Decision 2011/850/EU Laying down Rules for Directives 2004/107/EC and 2008/50/EC of the European Parliament and of the Council as Regards the Reciprocal Exchange of Information and Reporting on Ambient air Quality; L 335/86; European Commission: Brussels, Belgium, 12 December 2011. [Google Scholar]
  112. European Commission. European Commission Guidance on the Commission Implementing Decision Laying down Rules for Directives 2004/107/Ec and 2008/50/Ec of the European Parliament and of the Council as Regards the Reciprocal Exchange of Information and Reporting on Ambient Air; European Commission: Brussels, Belgium, 2013. [Google Scholar]
  113. Air Quality in Europe—2014 Report. EEA Report No 5/2014. European Environment Agency, 2014. Available online: http://www.eea.europa.eu/publications/air-quality-in-europe-2014 (accessed on 6 December 2016).
  114. Wallen, C.C. Monitoring potential agents of climatic change. Ambio 1980, 9, 222–228. [Google Scholar]
  115. Eriksson, E. Report in an informal conference in atmospheric chemistry held at the Meteorological Institute, University of Stockholm, May 24–26 1954. Tellus 1954, 6, 302–307. [Google Scholar] [CrossRef]
  116. Egner, H.; Eriksson, E. Current data on the chemical composition of air and precipitation. Tellus 1955, 7, 134–139. [Google Scholar] [CrossRef]
  117. Rossby, C.G.; Egner, H. On the chemical climate and its variation with the atmospheric circulation pattern. Tellus 1955, 7, 119–133. [Google Scholar] [CrossRef]
  118. Eriksson, E. The yearly circulation of chloride and sulfur in nature: Meteorological, geochemical and pedological implications. Part I. Tellus 1959, 11, 375–403. [Google Scholar] [CrossRef]
  119. Eriksson, E. The yearly circulation of chloride and sulfur in nature: Meteorological, geochemical and pedological implications. Part II. Tellus 1960, 12, 63–109. [Google Scholar]
  120. Granat, L. On the relation between pH and the chemical composition in atmospheric precipitation. Tellus 1972, 14, 550–560. [Google Scholar] [CrossRef]
  121. Granat, L. Sulfate in precipitation as observed by the European Atmospheric Chemistry Network. Atmos. Environ. 1978, 413–424. [Google Scholar] [CrossRef]
  122. Kallend, A.S.; Marsh, A.R.W.; Pickles, J.H.; Proctor, M.V. Acidity of rain in Europe. Atmos. Environ. 1983, 17, 127–137. [Google Scholar] [CrossRef]
  123. Fowler, D.; Cape, J.N. The contamination of rain samples by dry deposition on rain collectors. Atmos. Environ. 1984, 18, 183–189. [Google Scholar] [CrossRef]
  124. Paterson, M.P.; Scorer, R.S. Data quality and the European Air Chemistry Network. Atmos. Environ. 1973, 7, 1163–1171. [Google Scholar] [CrossRef]
  125. Rodhe, H.; Granat, L. An evaluation of sulfate in European precipitation 1955–1982. Atmos. Environ. 1984, 18, 2627–2639. [Google Scholar] [CrossRef]
  126. The OECD Programme on Long Range Transport of Air Pollutants: Measurements and Findings. Organisation for Economic Co-Operation and Development (OECD) Report. 1977. Available online: http://www.nilu.no/projects/ccc/reports/paris_1977.pdf (accessed on 6 December 2016).
  127. Ottar, B. An assessment of the OECD study on long range transport of air pollutants (LRTAP). Atmos. Environ. 1978, 12, 445–454. [Google Scholar] [CrossRef]
  128. Ottar, B. Monitoring long-range transport of air pollutants: The OECD study. Ambio 1976, 5, 203–206. [Google Scholar]
  129. United Nations Economic Commission for Europe. UNECE Convention on Long-Range Transboundary Air Pollution; United Nations Economic Commission for Europe: Geneva, Switzerland, 13 November 1979. [Google Scholar]
  130. Co-Operative Programme for Monitoring and Evaluation of the Transmission of Air Pollutants in Europe, 1980. Summary Report of the Chemical Coordinating Centre for the First Phase of EMEP. EMEP/CCC Report 4/80. Available online: http://www.nilu.no/projects/ccc/repor (accessed on 6 December 2016).
  131. Thrane, K.E. Co-Operative Programme for Monitoring and Evaluation of the Long Range Transmission fo Air Pollutants in Europe, 1978. Report on the First Intercomparison of Analytical Methods within the EMEP, EMEP/CCC report 2/78. Available online: http://www.nilu.no/projects/ccc (accessed on 6 December 2016).
  132. ECE Co-Operative Programme for Monitoring and Evaluation of the Long Range Transmission of Air Pollutants in Europe, 1979. EMEP Expert Meeting on Chemical Matters Oslo, 3–5 December 1979. EMEP/CCC Report 4/79. Available online: http://www.nilu.no/projects/ccc/reports/cc (accessed on 6 December 2016).
  133. Co-Operative Programme for Monitoring and Evaluation of the Long Range Transmission of Air Pollutants in Europe, 1981. EMEP Sampling Stations: Site Descriptions. EMEP/CCC Report 1/81. Available online: http://www.nilu.no/projects/ccc/reports/cccr1-81.pdf (accessed on 6 December 2016).
  134. EMEP Workshop on Heavy Metals. EMEP/CCC Report 4/84, ECE Co-Operative Programme for Monitoring and Evaluation of the Long Range Transmission of Air Pollutants in Europe, 1984. Available online: http://www.nilu.no/projects/ccc/reports/cccr4-84.pdf (accessed on 6 December 2016).
  135. Co-Operative Programme for Monitoring and Evaluation of the Long Range Transmission of Air Pollutants in Europe, 1990. EMEP Workshop on Measurement of Hydrocarbons/VOC. Available online: http://www.nilu.no/projects/ccc/reports/cccr3-90.pdf (accessed on 6 December 2016).
  136. Co-Operative Programme for Monitoring and Evaluation of the Long Range Transmission of Air Pollutants in Europe, 1993. EMEP Workshop on Measurements of Nitrogen-Containing Compounds. EMEP/CCC Report 1/93. Available online: http://www.nilu.no/projects/ccc/reports/cc (accessed on 6 December 2016).
  137. Lamb, D.; Bowersox, V. The national atmospheric deposition program: An overview. Atmos. Environ. 2000, 34, 1661–1663. [Google Scholar] [CrossRef]
  138. Lehmann, C.M.B.; Bowersox, V.C.; Larson, S.M. Spatial and temporal trends of precipitation chemistry in the United States, 1985–2002. Environ. Pollut. 2005, 135, 347–361. [Google Scholar] [CrossRef] [PubMed]
  139. NILU Norway Institute for Air Research EBAS database. Available online: http://ebas.nilu.no/ (accessed on 6 December 2016).
  140. Torseth, K.; Aas, W.; Breivik, K.; Fjaeraa, A.M.; Fiebig, M.; Hjellbrekke, A.G.; Myhre, C.L.; Solberg, S.; Yttri, K.E. Introduction to the European Monitoring and Evaluation Programme (EMEP) and observed atmospheric composition change during 1972–2009. Atmos. Chem. Phys. 2012, 12, 5447–5481. [Google Scholar] [CrossRef] [Green Version]
  141. Torseth, K.; Hov, O. The EMEP Monitoring Strategy 2004–2009: Background Document with Justification and Specification of the EMEP Monitoring Programme 2004–2009. EMEP/CCC Report 9/2003, Co-Operative Programme for Monitoring and Evaluation of the Long-Range Transmission of Air; Norwegian Institute for Air Research: Kjeller, Norway, 2003. [Google Scholar]
  142. Nordberg, L.; Hicks, K. Male Declaration 1998–2013: A Synthesis: Progress and Opportunities. Male Declaration Report. 2013. Available online: http://www.rrcap.ait.asia/male/uploadedfiles/file/Synthesis%20Report.pdf (accessed on 6 December 2016).
  143. EANET Guidelines for Acid Deposition Monitoring in East Asia. Acid Deposition monitoring in East Asia (EANET) Report. 2000. Available online: http://www.eanet.asia/product/guideline/monitorguide.pdf (accessed on 6 December 2016).
  144. GAP Forum Atmospheric Pollution: Developing a Global Approach. Global Atmospheric Pollution Forum Discussion Paper 2. 2010. Available online: http://www.sei-international.org/gapforum/reports/discussionpaper1.pdf (accessed on 6 December 2016).
  145. Bojkov, R.D. The International Ozone Commission (IO3C): Its History and Activities Related to Atmospheric Ozone. Academy of Athens Research Centre for Atmospheric Physics and Climatology Publication No. 18. 2010. Available online: http://ioc.atmos.illinois.edu/about/History%20of (accessed on 6 December 2016).
  146. Komhyr, W.D.; Grass, R.D. Dobson spectrophotometer 83: A standard for total ozone measurements 1962–1987. J. Geophys. Res. 1989, 94, 9847–9861. [Google Scholar] [CrossRef]
  147. Stolarski, R.; Bojkov, R.; Bishop, L.; Zerefos, C.; Staehelin, J.; Zawodny, J. Measured trends in stratospheric ozone. Science 1992, 256, 342–349. [Google Scholar] [CrossRef] [PubMed]
  148. Gwynne, M.D. The Global Environment Monitoring System (GEMS) of UNEP. Environ. Conserv. 1982, 9, 35–41. [Google Scholar] [CrossRef]
  149. Schultz, M.G.; Akimoto, H.; Bottenheim, J.; Buchmann, B.; Galbally, I.E.; Gilge, S.; Helmig, D.; Koide, H.; Lewis, A.C.; Novelli, P.C.; et al. The Global Atmosphere Watch reactive gases measurement network. Elementa Sci. Anthr. 2015, 3, 000067. [Google Scholar] [CrossRef]
  150. Muller, G.; Artz, R.; Baltensperger, U.; Carmichael, G.; Dlugokencky, E.; Penkett, S.; Stahelin, J.; Webb, A.; Hov, O.; Klausen, J.; et al. WMO Global Atmospheric Watch (GAW) Strategic Plan: 2008–2015. GAW Report 172. 2007. Available online: ftp://ftp.wmo.int/Documents/PublicWeb/arep/gaw/gaw172-26sept07.pdf (accessed on 6 December 2016).
  151. GAW Global Atmospheric Watch Measurements Guide. GAW Report No. 143. 2001. Available online: ftp://ftp.wmo.int/Documents/PublicWeb/arep/gaw/gaw143.pdf (accessed on 6 December 2016).
  152. Cooper, O.R.; Parrish, D.D.; Ziemke, J.; Balashov, N.V.; Cupeiro, M.; Galbally, I.E.; Gilge, S.; Horowitz, L.; Jensen, N.R.; Lamarque, J.-F.; et al. Global distribution and trends of tropospheric ozone: An observation-based review. Elementa Sci. Anthr. 2014, 2, 29. [Google Scholar] [CrossRef]
  153. Vet, R.; Artz, R.S.; Carou, S.; Shaw, M.; Ro, C.-U.; Aas, W.; Baker, A.; Bowersox, V.C.; Dentener, F.; Galy-Lacaux, C.; et al. A global assessment of precipitation chemistry and deposition of sulfur, nitrogen, sea salt, base cations, organic acids, acidity and pH, and phosphorus. Atmos. Environ. 2014, 93, 3–100. [Google Scholar] [CrossRef] [Green Version]
  154. AQEG Evidential Value of Defra Air Quality Compliance Monitoring. Air Quality Expert Group, Defra Publications. Available online: http://uk-air.defra.gov.uk/assets/documents/reports/cat11/1509290925_DEF-PB14312_Evidential_value_of_Defra_air_quality_compliance_moni (accessed on 6 December 2016).
  155. EEA Air Quality in Europe—2016 report. European Environment Agency Report No. 28/2016. 2016. Available online: http://www.eea.europa.eu/publications/air-quality-in-europe-2016 (accessed on 6 December 2016).
  156. Simon, H.; Reff, A.; Wells, B.; Xing, J.; Frank, N. Ozone trends across the United States over a period of decreasing NOx and VOC emissions. Environ. Sci. Technol. 2015, 49, 186–195. [Google Scholar] [CrossRef] [PubMed]
  157. Akimoto, H.; Mori, Y.; Sasaki, K.; Nakanishi, H.; Ohizumi, T.; Itano, Y. Analysis of monitoring data of ground-level ozone in Japan for long-term trend during 1990–2010: Causes of temporal and spatial variation. Atmos. Environ. 2015, 102, 302–310. [Google Scholar] [CrossRef]
  158. Monks, P.S.; Archibald, A.T.; Colette, A.; Cooper, O.; Coyle, M.; Derwent, R.; Fowler, D.; Granier, C.; Law, K.S.; Mills, G.E.; et al. Tropospheric ozone and its precursors from the urban to the global scale from air quality to short-lived climate forcer. Atmos. Chem. Phys. 2015, 15, 8889–8973. [Google Scholar] [CrossRef] [Green Version]
  159. Fuzzi, S.; Baltensperger, U.; Carslaw, K.; Decesari, S.; Denier van der Gon, H.; Facchini, M.C.; Fowler, D.; Koren, I.; Langford, B.; Lohmann, U.; et al. Particulate matter, air quality and climate: Lessons learned and future needs. Atmos. Chem. Phys. 2015, 15, 8217–8299. [Google Scholar] [CrossRef]
  160. Putaud, J.P.; van Dingenen, R.; Alastuey, A.; Bauer, H.; Birmili, W.; Cyrys, J.; Flentje, H.; Fuzzi, S.; Gehrig, R.; Hansson, H.C.; et al. A European aerosol phenomenology-3: Physical and chemical characteristics of particulate matter from 60 rural, urban, and kerbside sites across Europe. Atmos. Environ. 2010, 44, 1308–1320. [Google Scholar] [CrossRef]
  161. Hsu, A.; Reuben, A.; Shindell, D.; de Sherbinin, A.; Levy, M. Toward the next generation of air quality monitoring indicators. Atmos. Environ. 2013, 80, 561–570. [Google Scholar] [CrossRef]
  162. Chow, J.C.; Watson, J.G. New directions: Beyond compliance air quality measurements. Atmos. Environ. 2008, 42, 5166–5168. [Google Scholar] [CrossRef]
  163. Brook, J.R.; Demerjian, K.L.; Hidy, G.; Molina, L.T.; Pennell, W.I.; Scheffe, R. New Directions: Results-oriented multi-pollutant air quality management. Atmos. Environ. 2009, 43, 2091–2093. [Google Scholar] [CrossRef]
  164. Engel-Cox, J.; Oanh, N.T.K.; van Donkelaar, A.; Martin, R.V.; Zell, E. Toward the next generation of air quality monitoring: Particulate Matter. Atmos. Environ. 2013, 80, 584–590. [Google Scholar] [CrossRef]
  165. Bowman, K.W. Toward the next generation of air quality monitoring: Ozone. Atmos. Environ. 2013, 80, 571–583. [Google Scholar] [CrossRef]
  166. Hung, H.; MacLeod, M.; Guardans, R.; Scheringer, M.; Barra, R.; Hamer, T.; Zhang, G. Toward the next generation of air quality monitoring: Persistent organic pollutants. Atmos. Environ. 2013, 80, 591–598. [Google Scholar] [CrossRef]
  167. Pirrone, N.; Aas, W.; Cinnirella, S.; Ebinghaus, R.; Hedgecock, I.M.; Pacyna, J.; Sprovieri, F.; Sunderland, E.M. Toward the next generation of air quality monitoring: Mercury. Atmos. Environ. 2013, 80, 599–611. [Google Scholar] [CrossRef]
  168. AQEG Linking Emissions Inventories and Ambient Measurements, Air Quality Expert Group, Defra Publications, 2013. Available online: http://uk-air.defra.gov.uk/assets/documents/reports/cat11/1508060906_DEF-PB14106_Linking_Emissions_Inventories_And_Ambient_Measurements_Fin (accessed on 6 December 2016).
  169. Kumar, P.; Morawska, L.; Martani, C.; Biskos, G.; Neophytou, M.; di Sabatino, S.; Bell, M.; Norford, L.; Britter, R. The rise of low-cost sensing for managing air pollution in cities. Environ. Int. 2015, 75, 199–205. [Google Scholar] [CrossRef] [PubMed]
  170. Reis, S.; Seto, E.; Northcross, A.; Quinn, N.W.T.; Convertino, M.; Jones, R.L.; Maier, H.R.; Schlink, U.; Steinle, S.; Vieno, M.; et al. Integrating modelling and smart sensors for environmental and human health. Environ. Model. Softw. 2015, 74, 238–246. [Google Scholar] [CrossRef] [PubMed]
  171. Kuhlbusch, T.A.J.; Quincey, P.; Fuller, G.W.; Kelly, F.; Mudway, I.; Viana, M.; Querol, X.; Alastuey, A.; Katsouyanni, K.; Weijers, E.; et al. New Directions: The future of European urban air quality monitoring. Atmos. Environ. 2014, 87, 258–260. [Google Scholar] [CrossRef]
  172. Schmale, J.; van Aardenne, J.; von Schneidemesser, E. New Directions: Support for integrated decision-making in air and climate policies—Development of a metrics-based information portal. Atmos. Environ. 2014, 90, 146–148. [Google Scholar] [CrossRef]
  173. Guerreiro, C.B.B.; Foltescu, V.; de Leeuw, F. Air quality status and trends in Europe. Atmos. Environ. 2014, 98, 376–384. [Google Scholar] [CrossRef] [Green Version]
  174. Harrison, R.M.; Laxen, D.; Moorcroft, S.; Laxen, K. Processes affecting concentrations of fine particulate matter (PM2.5) in the UK atmosphere. Atmos. Environ. 2012, 46, 115–124. [Google Scholar] [CrossRef]
  175. de Leeuw, F.; Ruyssenaars, P. Evaluation of Current Limit and Target Values as Set in the EU Air Quality Directive. ETC/ACM Technical Paper 2011/3. 2011. Available online: http://acm.eionet.europa.eu/docs/ETCACM_TP_2011_3_evaluation_AQ_LT_TV.pdf (accessed on 6 December 2016).
  176. Oltmans, S.J.; Lefohn, A.S.; Shadwick, D.; Harris, J.M.; Scheel, H.E.; Galbally, I.; Tarasick, D.W.; Johnson, B.J.; Brunke, E.-G.; Claude, H.; et al. Recent tropospheric ozone changes—A pattern dominated by slow or no growth. Atmos. Environ. 2013, 67, 331–351. [Google Scholar] [CrossRef]
  177. Monks, P.S.; Granier, C.; Fuzzi, S.; Stohl, A.; Williams, M.L.; Akimoto, H.; Amann, M.; Baklanov, A.; Baltensperger, U.; Bey, I.; et al. Atmospheric composition change—Global and regional air quality. Atmos. Environ. 2009, 43, 5268–5350. [Google Scholar] [CrossRef]
  178. Malley, C.S.; Braban, C.F.; Heal, M.R. New Directions: Chemical climatology and assessment of atmospheric composition impacts. Atmos. Environ. 2014, 87, 261–264. [Google Scholar] [CrossRef] [Green Version]
  179. Malley, C.S.; Heal, M.R.; Mills, G.; Braban, C.F. Trends and drivers of ozone human health and vegetation impact metrics from UK EMEP supersite measurements (1990–2013). Atmos. Chem. Phys. 2015, 15, 4025–4042. [Google Scholar] [CrossRef]
  180. Malley, C.S.; Heal, M.R.; Braban, C.F.; Kentisbeer, J.; Leeson, S.R.; Lingard, J.J.N.; Ritchie, S.; Maggs, R.; Beccaceci, S.; Quincey, P.; et al. The contributions to long-term health-relevant particulate matter at the UK EMEP supersites between 2010 and 2013: Quantifying the mitigation challenge. Environ. Int. 2016, 95, 98–111. [Google Scholar] [CrossRef] [PubMed]
  181. REVIHAAP Review of Evidence on Health Aspects of Air Pollution—REVIHAAP Project Technical Report. World Health Organization (WHO) Regional Office for Europe. Bonn., 2013. Available online: http://www.euro.who.int/__data/assets/pdf_file/0004/193108/REVIHAAP-Final-technical-rep (accessed on 6 December 2016).
  182. Malley, C.S.; Braban, C.F.; Dumitrean, P.; Cape, J.N.; Heal, M.R. The impact of speciated VOCs on regional ozone increment derived from measurements at the UK EMEP supersites between 1999 and 2012. Atmos. Chem. Phys. 2015, 15, 8361–8380. [Google Scholar] [CrossRef]
  183. Carslaw, D.C.; Ropkins, K. Openair—An R package for air quality data analysis. Environ. Model. Softw. 2012, 27–28, 52–61. [Google Scholar] [CrossRef]
  184. Sanderson, E.G.; Fudge, N.; Totlandsdal, A.I.; Brunekreef, B.; van Bree, L. Stakeholder needs for air pollution and health information. J. Toxicol. Environ. Health 2006, 69, 1819–1825. [Google Scholar] [CrossRef] [PubMed]
  185. Totlandsdal, A.I.; Fudge, N.; Sanderson, E.G.; van Bree, L.; Brunekreef, B. Strengthening the science-policy interface: Experiences from a European Thematic Network on Air Pollution and Health (AIRNET). Environ. Sci. Polily 2007, 10, 260–266. [Google Scholar] [CrossRef]
  186. Van Bree, L.; Fudge, N.; Tuomisto, J.T.; Brunekreef, B. Closing the gap between science and policy on air pollution and health. J. Toxicol. Environ. Health 2007, 70, 377–381. [Google Scholar] [CrossRef] [PubMed]
  187. Bartonova, A. How can scientists bring research to use: The HENVINET experience. Environ. Health 2012, 11. [Google Scholar] [CrossRef] [PubMed]
Figure 1. Spatial distribution of the monitoring network established by Robert Angus Smith, and the concentration of (a) sulphate and (b) chloride measured in single samples of precipitation collected at each site between 1869 and 1870.
Atmosphere 07 00160 g001
Table 1. Summary of developments in coordination and standardisation implemented in seminal city, national, regional and global ground-level atmospheric composition monitoring networks.
NetworkLocationStart YearMeasurementsKey Coordination of NetworkKey Standardisation of Network
O3 monitoring300 sites globally1850s300 sites, 1 million measurements using Schoenbein test papersMotivation to understand chemical composition and impacts of O3Common test paper method used but measurements were not comparable
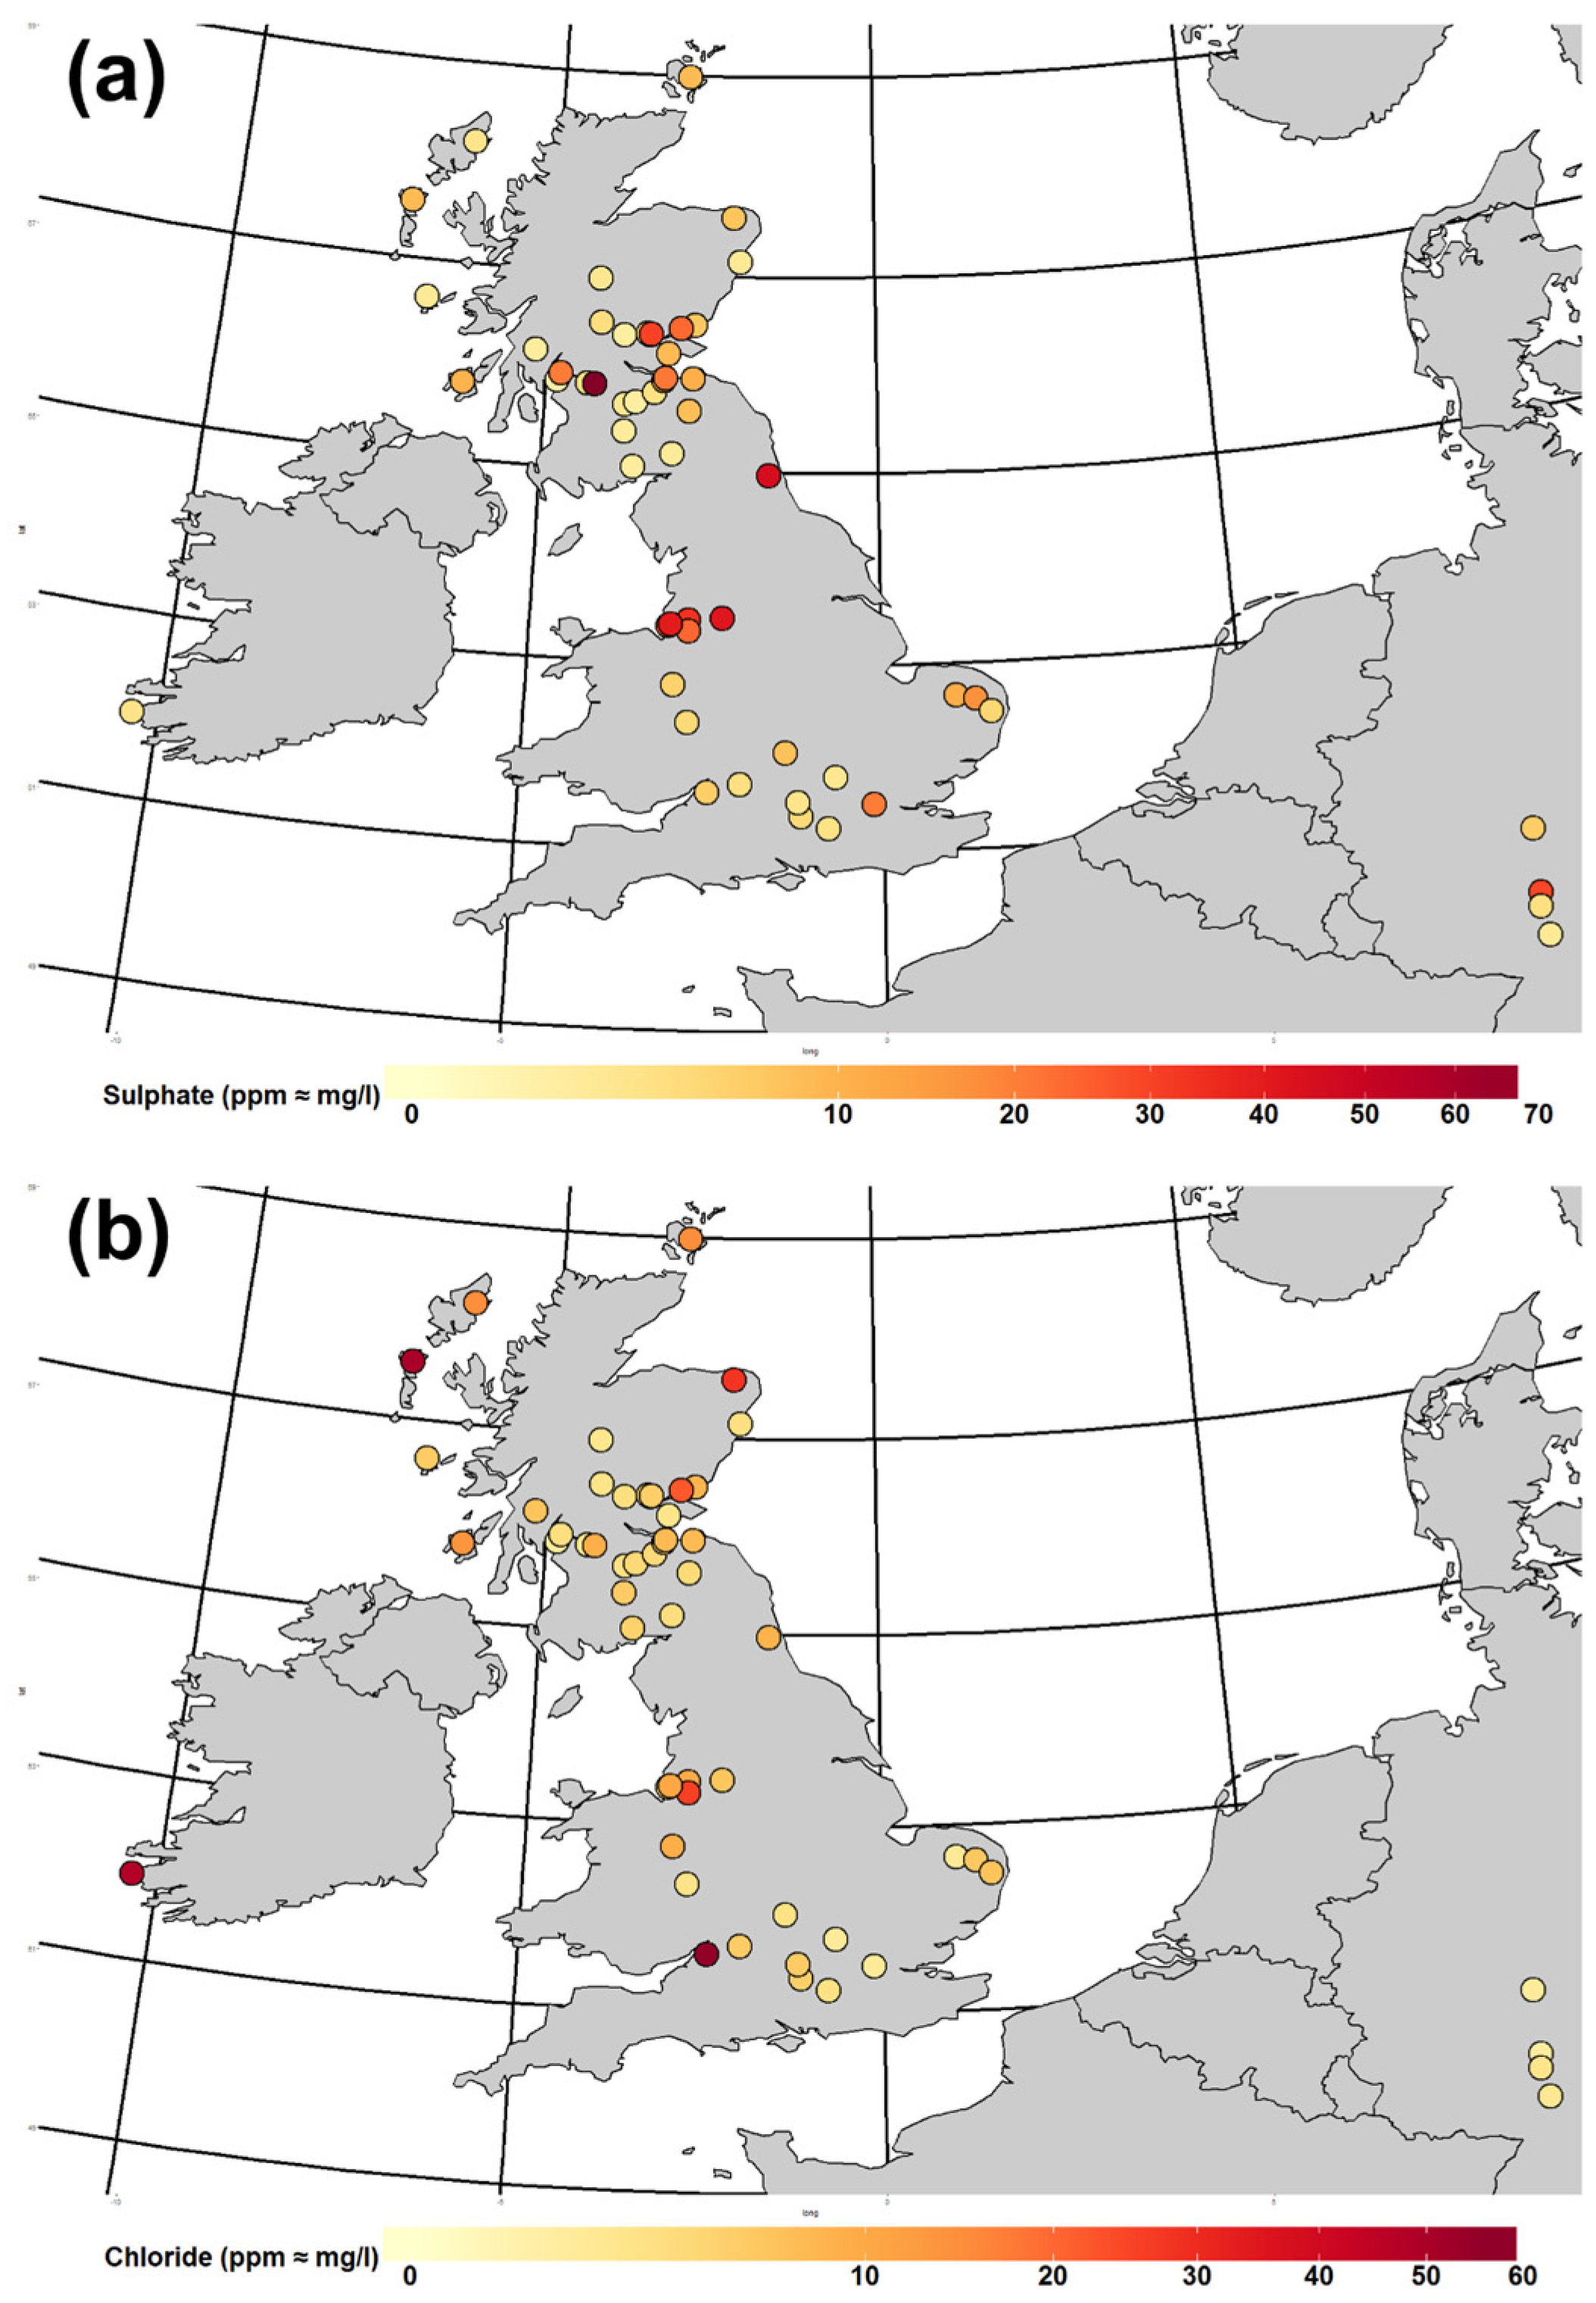
Robert Angus Smith Precipitation NetworkUK, Ireland, Germany18694 components of precipitation at 59 sitesCoordinated by Robert Angus Smith to obtain “careful observations” to investigate impacts of air pollutionSites were classified and chemical analysis of samples performed using common methods
Paris O3 networkParis, France187616 sites measuring O3 with Schoenbein test papers, 1 site with additional methodPrefecture du Departement de la Seine wanted to map air quality across ParisInter-comparison of two methods for measuring ozone concentration
Deposit Gauge NetworkUK1910Deposit gauges measuring sootfall and sulphate depositionCoordinated to quantitatively determine influence of soot deposit in 22 UK townsCommon method used but sites biased towards pollution hotspots
Air Pollution Disaster Prevention ProgramLos Angeles County195414 sites measuring O3, CO2, NOx, SOx and othersSites designed to assess exposure to pollutants across LA in relation to legislated “alert stage” standardsSites chosen representatively, same instrumentation used at each site
European Air Chemistry Network (EACN)North-west Europe1954Constituents in precipitation measured at a maximum of 120 sites in 1959Coordinated by meteorologists to understand atmospheric circulation of chemical substancesCommon measurement technique, but lack of standardisation in quality assurance so limited information gained
Global Ozone Observing System (GO3OS)Global1957Measurement of total column ozoneCoordinated sites to measure total column ozone following work of International Ozone CommissionStandardised instrumentation, calibrated yearly against one instrument
National SurveyUK1961300 UK towns and cities, 1200 sites measuring SO2 and black smokeCoordinated to systematically determine spatial pattern of smoke and SO2 concentrations across UKRepresentative towns, sites within towns, same instruments used across network
Continuous Air Monitoring Program (CAMP)USA19636 cities in USA measuring 7 atmospheric constituentsCoordinated to investigate role of vehicle exhaust emissions on air pollutionCommon data reporting as 4 key statistics across network
OECD programme on long-range transport of air pollutantsEurope1972Two-phase measurement period to determine local and transboundary contribution to acidity in precipitationGoal of programme achieved through coordination of measurements, emissions inventories and modellingCommon site selection measurement techniques, and data interpretation criteria applied across network
Background air pollution monitoring network (BAPMoN)Global1974Measurement of background gaseous and precipitation constituentsCoordinated with other networks monitoring climate, health, terrestrial renewable resource and oceans through UNEP Global Environmental Monitoring SystemStandardised instrumentation, site classification criteria (regional, continental, baseline)
European Monitoring and Evaluation Programme (EMEP)Europe1978Measurement of atmospheric composition at sites with minimal local influence as part of UNECE Convention on Long-Range Transboundary Air PollutionMonitoring network specifically coordinated with emissions inventory calculations and modellingEMEP manual outlines measurement methods, site locations, data quality and handling Regular method inter-comparisons
Global Atmospheric Watch (GAW)Global1989Established from merging BAPMoN and GO3OSCoordinated to establish global standards for monitoring of atmospheric composition2 site classifications (regional and global), standardised methods and quality assurance procedures

