Article

pH Control in Fog and Rain in East Asia: Temporal Advection of Clean Air Masses to Mt. Bamboo, Taiwan

by
Otto Klemm
1,*,
Wei-Ti Tseng
2,†,
Chia-Ching Lin
2,†,
Kerstin I. Klemm
3,† and
Neng-Huei (George) Lin
2,*,†
1
Climatology Research Group, University of Münster, Heisenbergstr. 2, Münster 48149, Germany
2
Department of Atmospheric Sciences, National Central University, Jhongli 320, No. 300 Jhongda Road, Taiwan
3
Institut für Planetologie, University of Münster, Wilhelm-Klemm-Str. 10, Münster 48149, Germany
*
Authors to whom correspondence should be addressed.
These authors contributed equally to this work.
Atmosphere 2015, 6(11), 1785-1800; https://doi.org/10.3390/atmos6111785
Submission received: 20 October 2015 / Accepted: 13 November 2015 / Published: 20 November 2015

Abstract

:
Fog and rain was collected during an 18-day period in January 2011 at Mt. Bamboo, northern Taiwan. Almost 300 hourly fog samples and 16 daily rain samples were taken. One single fog sample (pH 3.17) was influenced by local volcanic activity, otherwise the pH ranged from 3.23 to 6.41 in fog and from 3.59 to 6.31 in rain. All the respective air masses arrived from the northeast, but exhibited two distinct groups: Group_1 had high concentrations of all ions (median interquartile range of total ion concentrations 3200–6200 µeq.·L−1) and low pHs (median 3.52), the respective air masses had travelled over densely populated and industrialized regions of mainland China. Group_2 was from air masses with long travel times over the ocean and relatively low total ion concentrations (80–570 µeq.·L−1) and higher pHs (median 4.80). The cleanest samples are among the cleanest reported in the literature of worldwide fog and rain. In both groups, the pH was governed by the balance of sulfate, nitrate, ammonium, and, in some cases, calcium. The variability of these ions was higher than the variability of 10−pH, which shows that the pH is a rather robust parameter in contrast to its drivers such as non-sea-salt sulfate.

Graphical Abstract

1. Introduction

Acid precipitation has dominated atmospheric chemistry research over many years during the 1980s and 1990s but has lost some attention since. It is not only the gaining importance of other topics such as greenhouse gas concentrations and chemistry, or the rapid development of instrumentation and remote sensing techniques to study more substances and to develop better spatial coverage of atmospheric conditions, but also the increase of the pH of precipitation water that lead to the presumption that acid precipitation loses relevance. The observed increase of the pH is partly due to the decreasing emissions of acidity precursors, namely sulfur dioxide (SO2), which is oxidized to H2SO4 in the atmosphere, and nitrogen oxides (NOx), which are oxidized to HNO3, and partly due to the increasing importance of ammonia (NH3) acting as a neutralizer in the atmospheric water phase (clouds, fog, rain) through the formation of the ammonium ion (NH4+) [1,2,3]. Therefore, the pH itself, which is an intensity measure, is nowadays less a key indicator for the pollution level the atmospheric water phase than it was earlier: High emissions of acidity precursors (SO2, NOx) may be, partially or fully, balanced out by high emissions of the neutralizer NH3.
East Asia as a region is characterized by high economic growth rates, which recently started to lose momentum. High emissions of air pollutants including precursors of atmospheric acidity lead to low pHs of rain, clouds, and fog (e.g., [4,5,6,7,8]) and to highly acidic aerosol particles (e.g., [9,10]). However, there are also reports of high pHs (above 5.0) in precipitation, cloud, and fog water (e.g., [1,11]). While the neutralizing action of ammonia, and, in some cases, from calcium, plays an important role also in this part of the world, some of the reports indicate that rather clean, un-polluted cases of rain and fog were found [6,8,12]. Is it feasible to assume that conditions of very clean cloud and rainwater can occur in this region? How will the pH be controlled under such conditions?
We collected fog during an 18-day period at the northern-most tip of Taiwan on a mountain and during conditions of northerly flow in order to study the variability of the inorganic composition of the advected clouds. Depending on the calculated backward trajectories, we expected the respective air masses to be influenced by emissions from mainland China or Korea or Japan, or be of rather pristine maritime origin from the North Pacific Ocean. Lin and Peng [13] reported pHs between 3.55 and 4.31 in six fog samples as collected between 1996 and 1998 at that site.
In addition to the fog itself, we analyze the rainwater chemistry at a site very nearby, but located at a level about 200 m lower, in order to study if below-cloud scavenging alters the rainwater chemistry and the resulting pHs to a significant degree.

2. Material and Methods

We collected fog water between 14 and 31 January 2011 at 25.1864°N, 121.5354°E, 1050 m a.s.l. (above sea level) at an exposed site North of Taipei, Taiwan. The site is within the Yangmingshan National Park, in which the Datun Volcano is located as well. The volcano is mostly dormant with a few fumaroles being active at 25.1473°N, 121.5272°E, which is at a distance of 4.3 km to the South (191°) of our collection site, and at 25.1764°N, 121.5469°E, 1.6 km to the Southeast (134°), respectively.
The fog collector was operated on the roof of a building at 4 m above ground. A meteorological mast for the measurement of air temperature, humidity, wind direction and wind speed was located at a distance of 35 m to the NNW. The passive fog collector (240 mm diameter, 440 mm height [13]) had two concentric rows of Teflon strings (total number 440, 1.5 mm diameter) with an average spacing to each other (center-to-center) along the circular path of 6.9 mm. The collector was covered with a polyethylene (PE) bag during non-foggy conditions. Upon the start of a fog event, the cover was removed, the collector was washed with deionized water, and fog samples collected on an hourly basis. Only in cases when the collection volume seemed not sufficient for chemical analysis, two or more hours of collection time were allowed.
Immediately after completion of a sample, the collected water volume was measured gravimetrically and pH and conductivity were measured. An aliquot of the sample water was refrigerated at 4 °C until analysis in the laboratory. Major ions (NH4+, Na+, K+, Ca2+, Mg2+, SO42−, NO3, Cl) were analyzed by ion chromatography [13]. Further ions, such as acetate or formate, were not analyzed. All ion concentrations in the liquid phase are given in unit microequivalent per liter (µeq.·L−1). The concentration of non-sea-salt sulfate (nss-SO42−) was computed from the measured sulfate concentration minus the presumed contribution of sea salt, assuming that all sodium originates from sea salt and the average sodium/sulfate ratio in sea water: nss-SO42− = SO42− − 0.121 Na+ (in units µeq.·L−1) [14].
The collection efficiency of the passive collector was estimated on the basis of Stoke’s Law of impaction, the design of the collector, the measured wind speed, and an average droplet size spectrum from a Taiwan mountain site [15]. The overall collection efficiency with respect to the Liquid Water Content (LWC, mass of liquid water dispersed per volume of air, in units g·m−3) was 90% for wind speeds above 2 m·s−1. As wind speeds lower than 2 m·s−1 occurred only rarely and the minimum computed collection efficiency was 84%, we assumed the collection efficiency to be 90% in all cases. The LWC was then calculated from the volume of the collected fog water, the collection time (typically one hour), the wind speed, the dimension of the collector, and the collection efficiency. Finally, the loads of the ions per volume of air (neq.·m−3) were calculated from the measured concentration of ions in fog water and the LWC.
Rainwater was collected with a wet-only sampler at a nearby site called Anbu, located at 25.1825°N, 121.5294°E, 825 m a.s.l., by the Taiwan Environmental Protection Administration (TEPA), on a daily basis with sample collection times at 09:00 a.m.. Sixteen samples could be collected during the 17-day experimental period. The major ion concentrations were measured like those in fog samples as described above. In addition, a quasi-continuous measurement of rainwater pH was conducted with an automatic acid rain analyzer (Ogasawara US-760). When rain was detected, the sampler started to collect rainwater and automatically analyzed its pH and conductivity. The respective data is reported in hourly intervals.
Air pollution data are routinely measured by the TEPA at the Anbu site. Hourly concentrations of Carbon Monoxide (CO), Nitric Oxide (NO), Nitrogen Dioxide (NO2), Ozone (O3), sulfur Dioxide (SO2), PM10 and PM2.5 are available for download from [16].
For the analysis of the origin of the air masses arriving at the sample collection site, we analyzed backward trajectories using the Hybrid Single-Particle Lagrangian Integrated Trajectory model [17], as provided by the Air Resources Laboratory of NOAA at [18]. For the computation, the Global Data Assimilation System (GDAS) of the National Centers for Environmental Prediction (NCEP) was chosen. One trajectory was computed for each full hour during the experimental phase. Ensemble trajectories were computed by building the quartiles of several trajectories by pooling their positions (longitude, latitude, height a.s.l.) in hourly steps before the respective arrival times at the site. We also utilized single trajectory data to estimate and confirm the direction from which the air masses arrived at the experimental site. The positions one hour before arrival were used for this purpose, assuming that the air flow during that hour was constant.

3. Results

3.1. Weather and General Flow Conditions

Each year in January and February, there is a well developed high surface pressure system over the cold East Asian continent, the Siberia High with its center at about 50°N and 100°E and a ridge extending towards southeast into China. The flow around this system causes a northerly to northeasterly monsoon to Taiwan. Cool and humid air causes widespread rain. The pressure gradient, and thus the flow, may weaken at times such as on 23 January 2011, when there was a short pause of the otherwise persistent northeasterly winds. With the exception of January 23, the wind directions both measured and computed from the backward trajectories, were from northerly to northeasterly directions, strictly between NW (315°) and ESE (112.5°) (Figure 1, top panel). On 23 January, the wind direction turned from ESE over S to NNW between 02:00 a.m. and 06:00 a.m. There was rain and fog every day from 14 to 31 January 2011 (Figure 1). All times are given in local time, which is 8 h ahead of UTC.

3.2. Fog Chemistry

A total of 293 fog samples was collected between 14 January 2011 08:00 p.m. and 31 January 2011 08:00 a.m. Most of the samples (83%) covered a collection time of 1 h, 14% were collected over 2 h, while only 10 samples extended over longer collection time periods of up to 5 h (1 sample). 
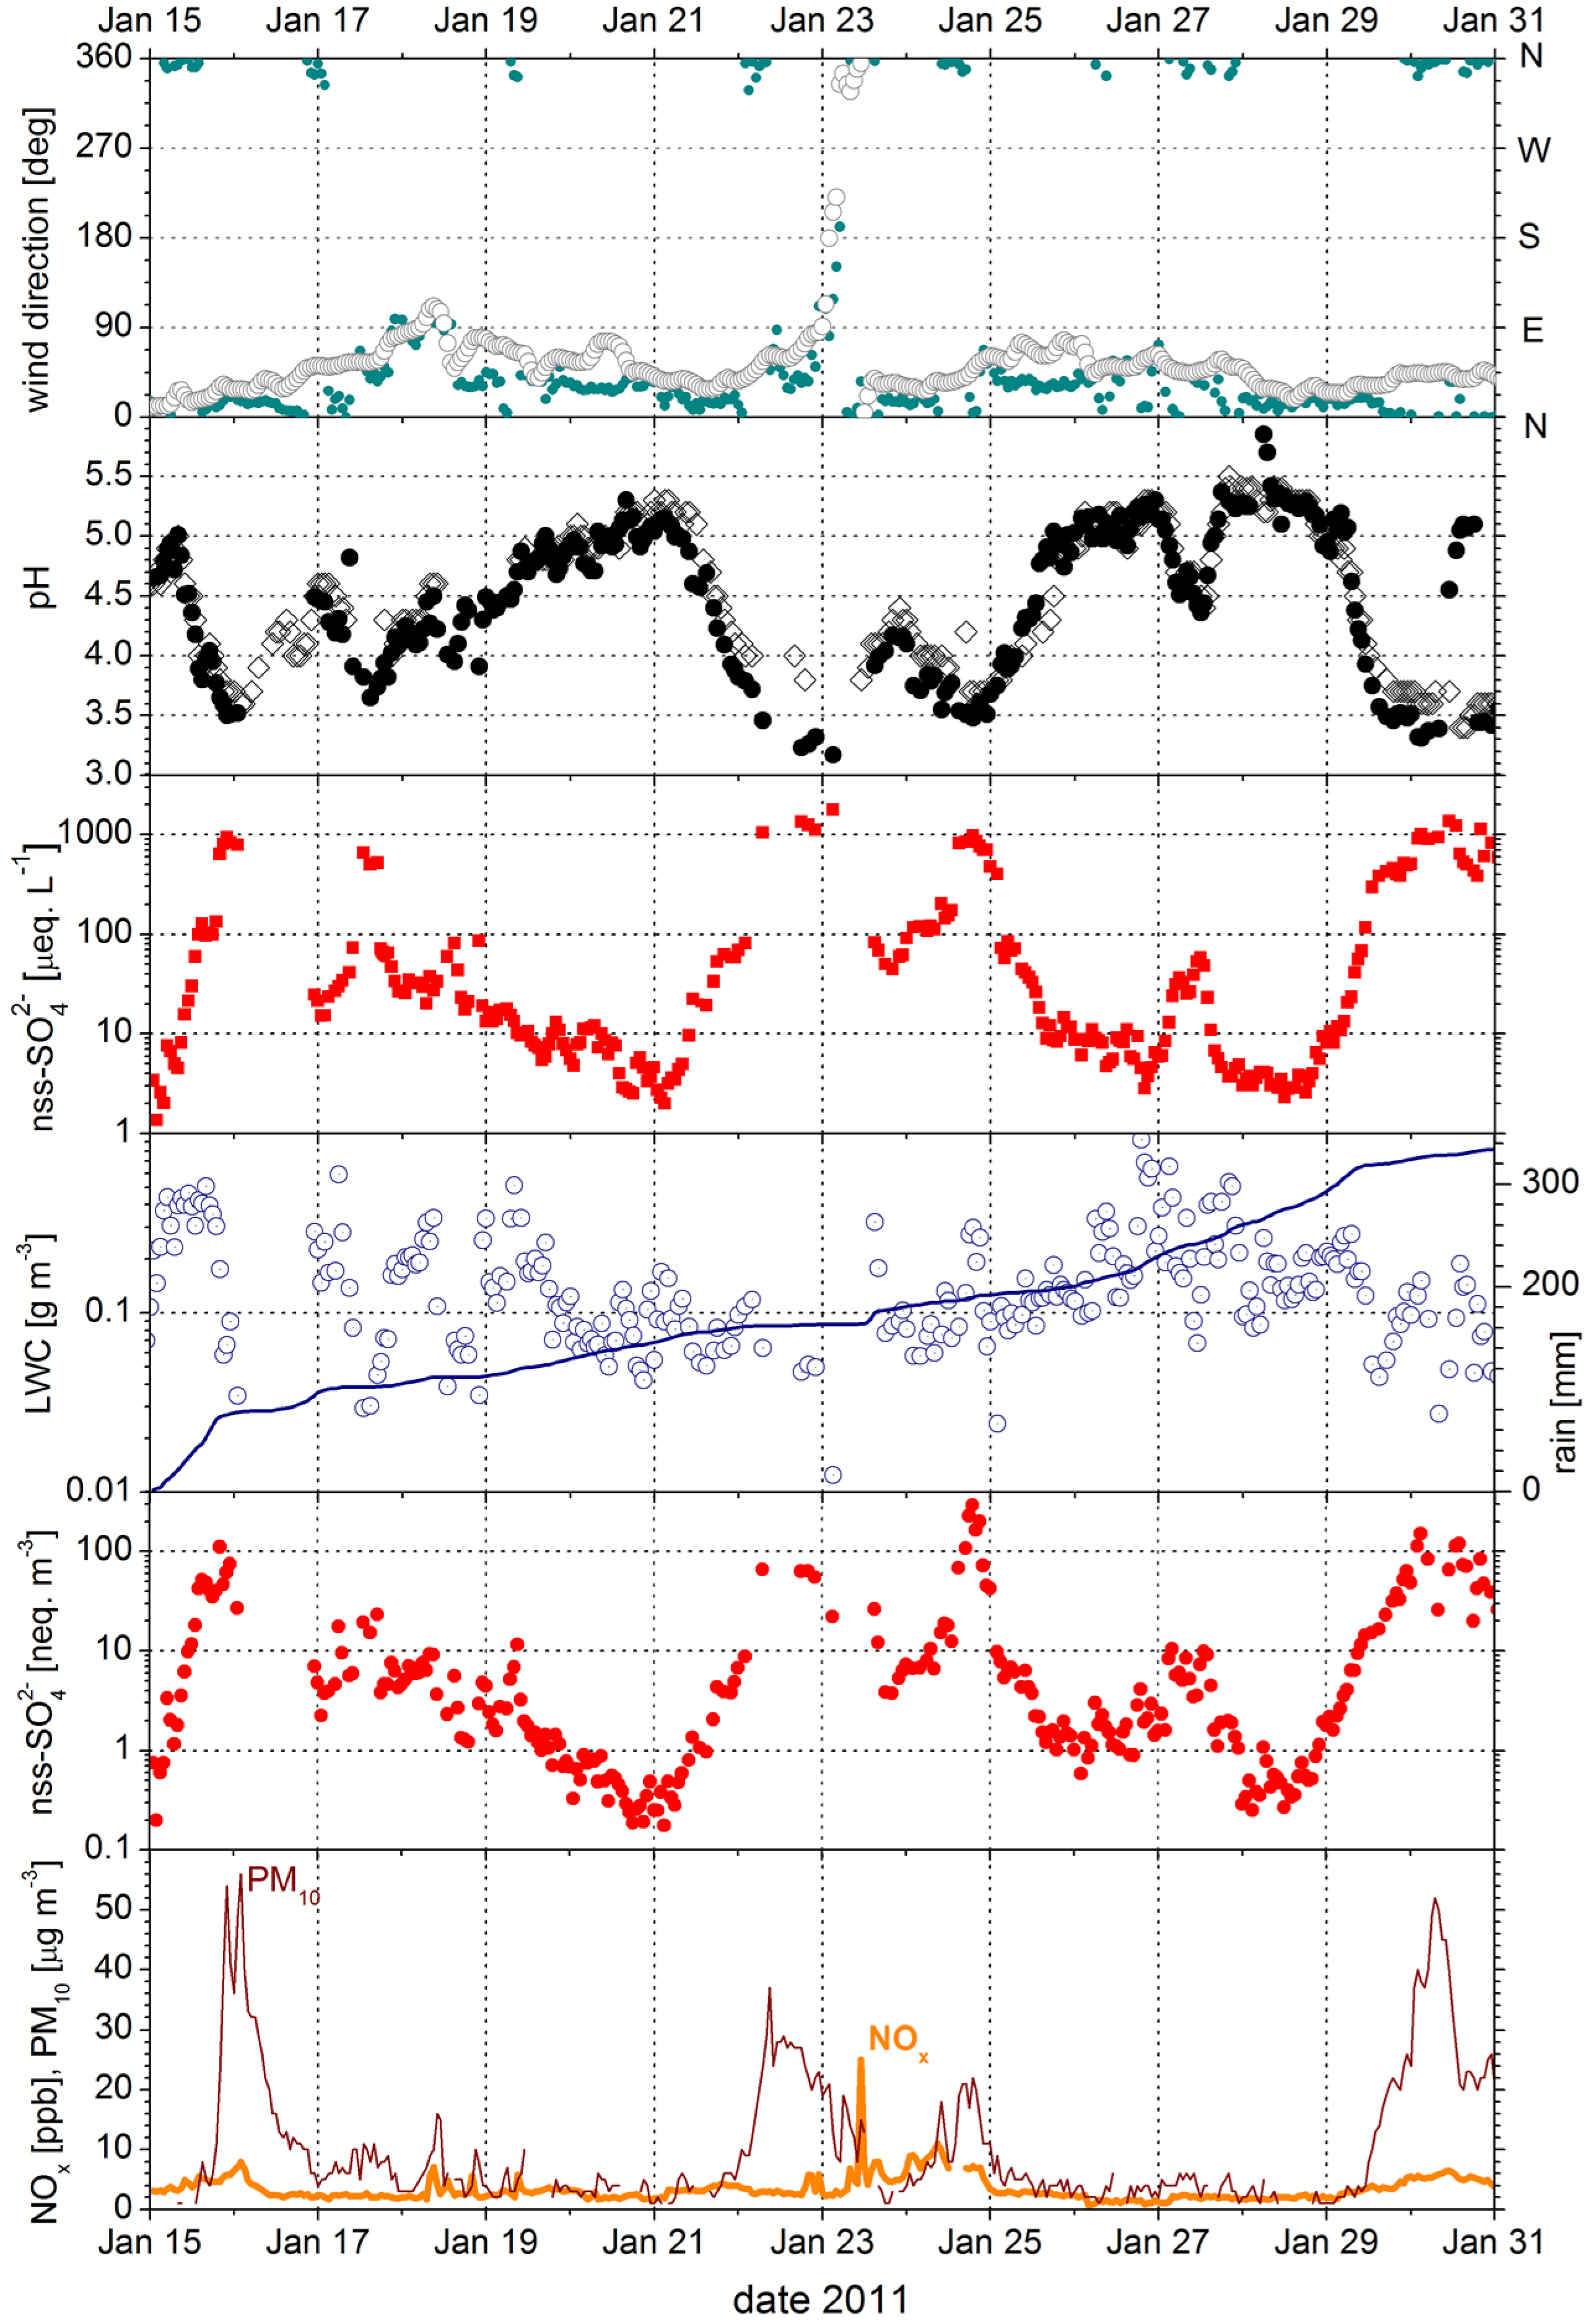
Figure 1 (second panel) shows that there is a very large variability of the pH during the 18-days experimental period, although there is no apparent or large change in wind direction. Only during the time period of the shift of the wind direction on 23 January, one fog sample was collected between 02:00 a.m. and 03:00 a.m. during winds from the south. This sample is exceptional in the sense that it exhibits the lowest of all pHs (3.17) and high concentrations of ions, specifically sodium, chloride, and sulfate (440 µeq.·L−1 NH4+; 1000 µeq.·L−1 Na+; 22 µeq.·L−1 K+; 60 µeq.·L−1 Ca2+; 150 µeq.·L−1 Mg2+; 1900 µeq.·L−1 SO42−; 310 µeq.·L−1 NO3; 1200 µeq.·L−1 Cl). This sample is apparently influenced by the local volcanic activity of the Yangmingshan National Park.
Panel 3 in Figure 1 shows the nss-SO42− concentrations in fog water. Note that the scale is logarithmic and that it exhibits strikingly similar features as the pH scale of fog in the panel above. The LWC (panel 4) exhibits a much lower variability than the concentration. The ion load (panel 5), which is the computed product of the concentration and the LWC, varies as largely as the concentration. It is therefore the concentration in fog water that drives the ion load much more than it is the LWC. The situation is similar to that of all ions (not shown). Based on these results, we will, in the remainder of this paper, analyze the concentrations of ions in fog water bearing in mind that they are the main drivers for the ion load as well.
Figure 1. Time series of meteorological and air and rain chemistry data at Mt. Bamboo, northern Taiwan from 15 to 30 January 2011. Top panel: Wind direction as measured at the collection site (filled circles) and as derived from the backward trajectories (open circles); 2nd panel: pHs in fog (full circles) and in rain (open squares) at Mt. Bamboo; 3rd panel: nss-SO42− concentration in fog water; 4th panel: LWC in air (left axis) and cumulative rain (right axis); 5th panel: nss-SO42− load in air; bottom panel: NOx mixing ratio and PM10 concentrations at the TEPA site.
Atmosphere 06 01785 g001
For further analysis, the World Meteorological Organization (WMO) quality criteria for precipitation water [19] were applied to examine the quality of the chemical analysis of the fog samples. Of the 293 samples, 233 complied with the ion balance (ratio of total analyzed anions’ load versus total analyzed cations’ load) data quality objective (DQO), 258 samples complied with the conductivity DQO (calculated versus measured conductivity), and 203 samples complied with both DQOs. The majority (72%) of the ion balances of the samples that did not comply with the DQOs were positive, which indicates that organic acids such as acetic or formic acids played a role but were not measured in our routine. For the other samples, there is no indication of why the DQOs were not met. In order to avoid the rejection of any sample that may yield useful information, but also to comply with the quality assurance and quality control (QAQC) guidelines of the WMO, we will analyze the data in two subsets, one subset with samples that met all DQOs (QA = 1), and the other (QA = 2) with samples that did not meet one DQO or both.
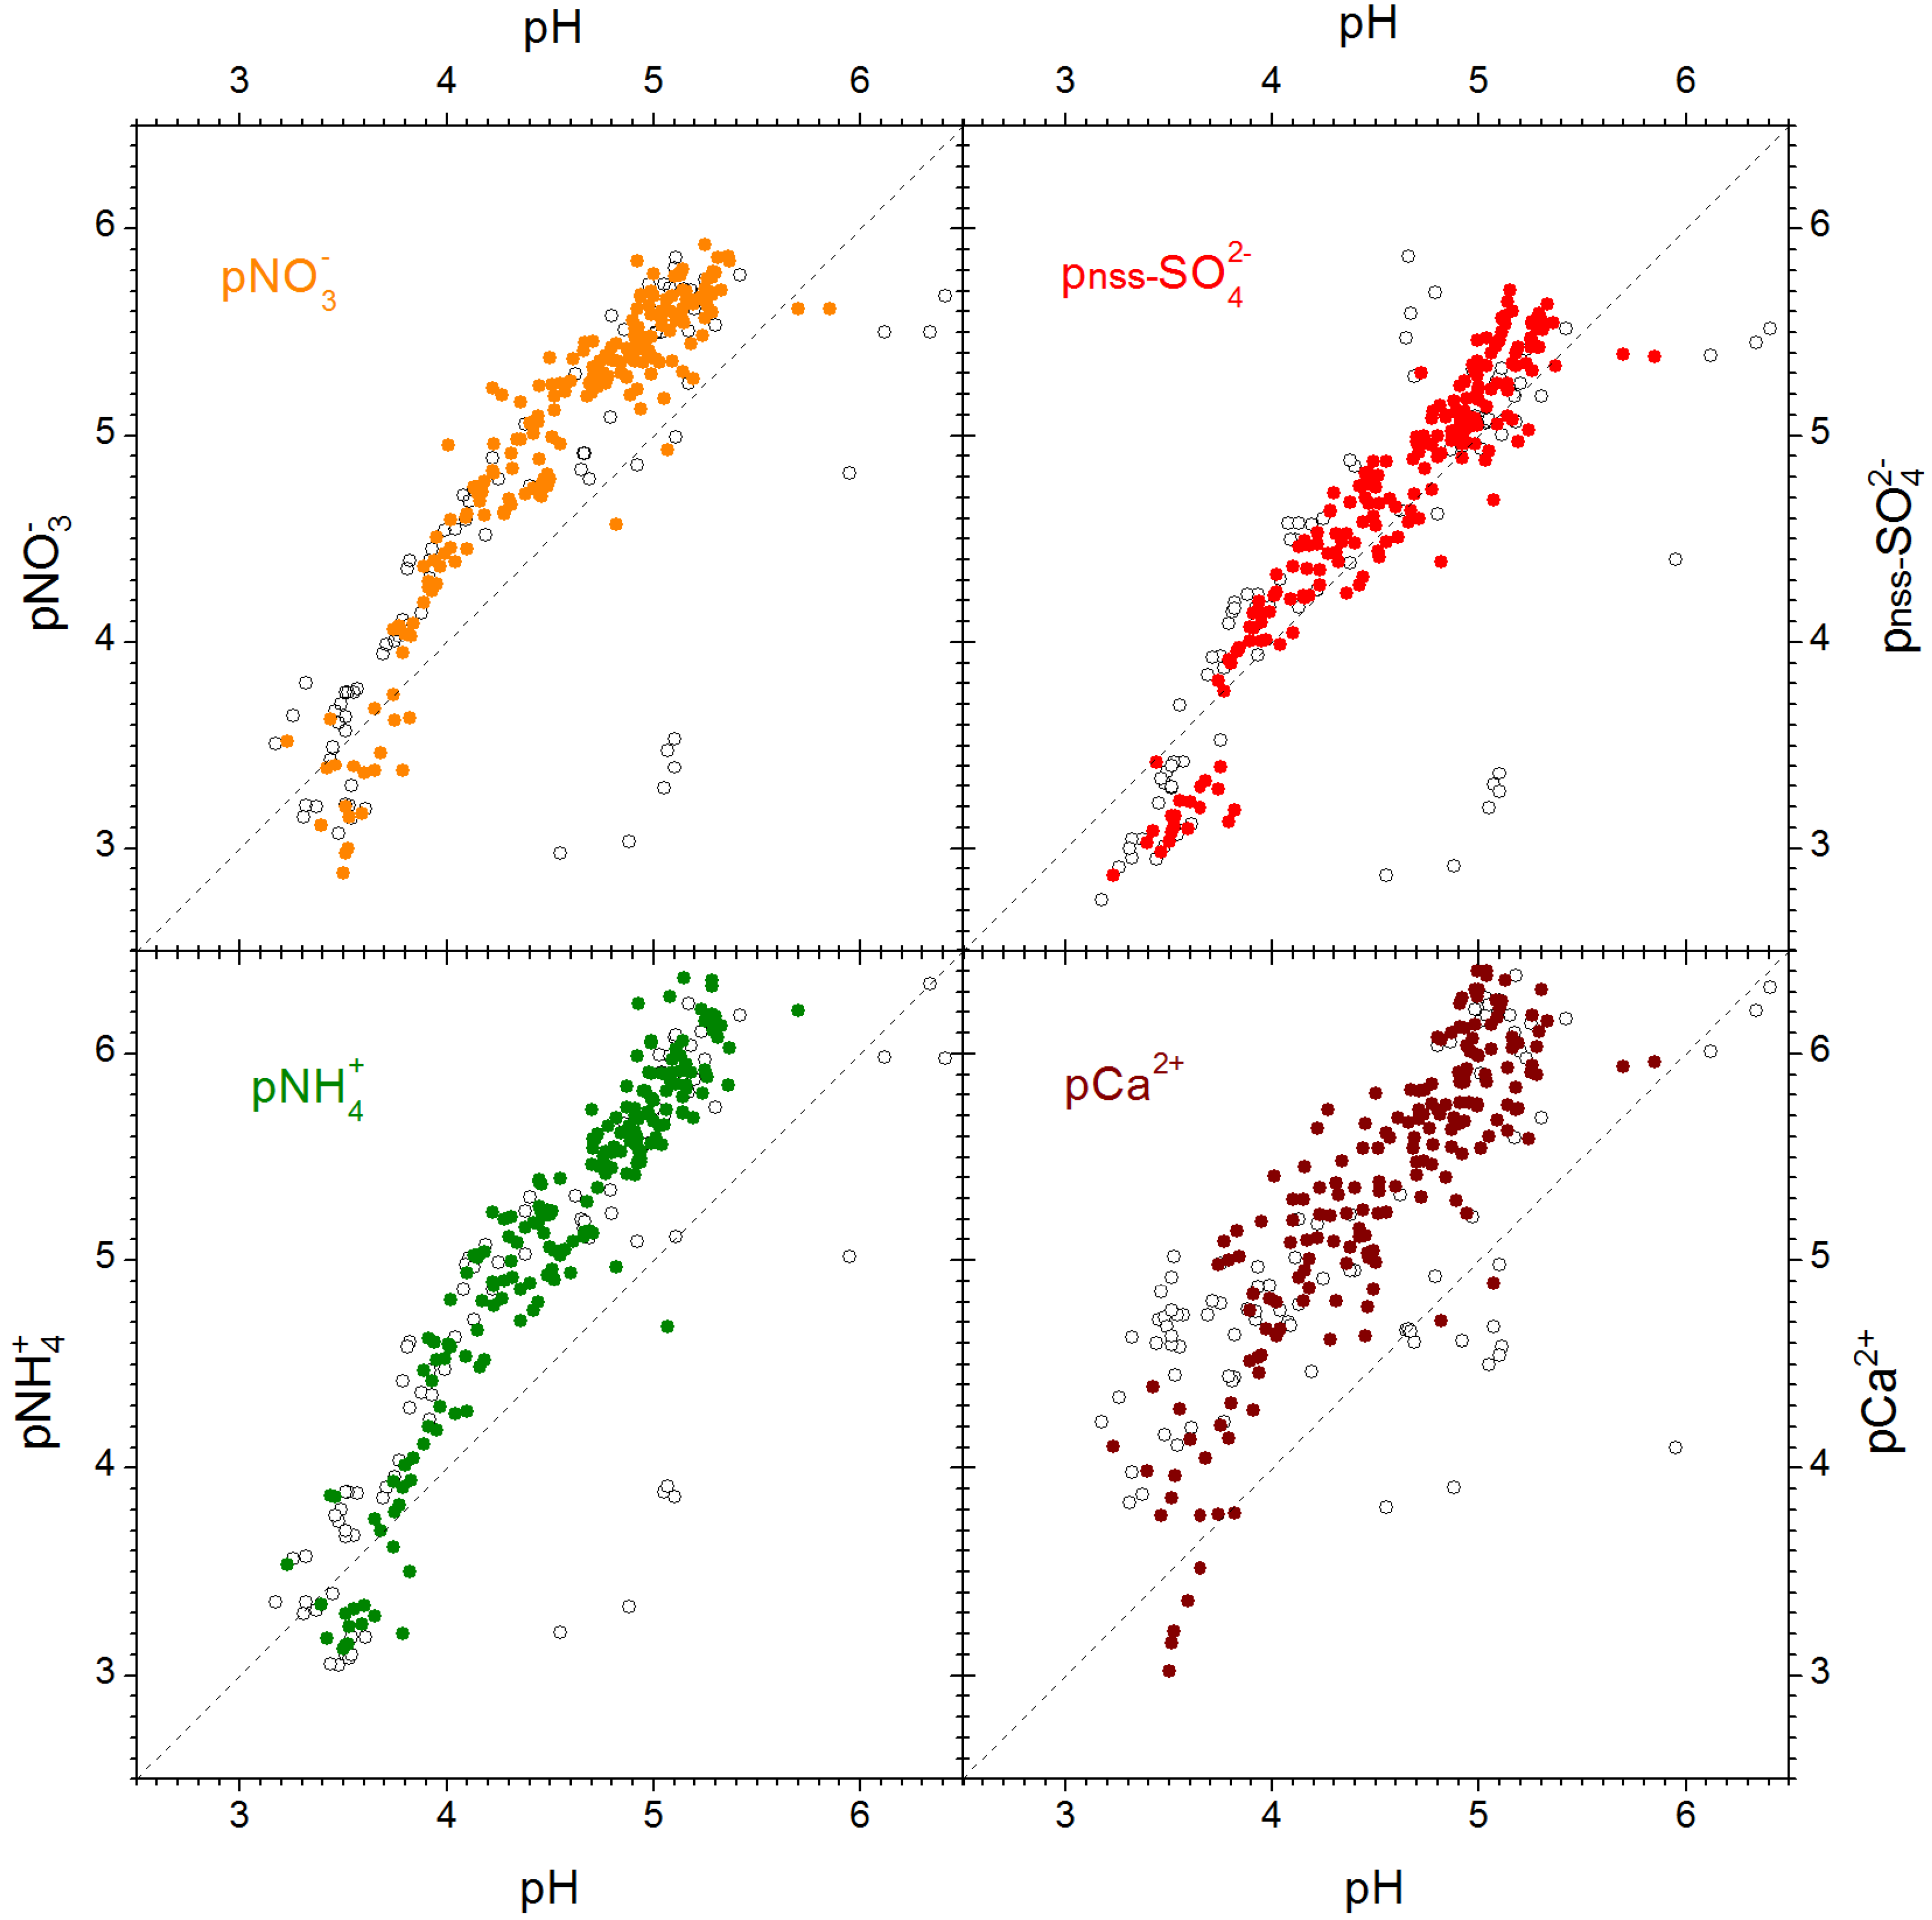
Figure 2 presents the relationship of some ions in relation to the sample pHs as scatterplots. The p-notation is applied in order to illustrate the similarity of the concentration patterns. These suggest that NH4+, SO42−, and NO3 covary very much with H+ and also with each other (not shown). It has been shown for many locations that the ions NH4+, SO42−, and NO3 make up a large fraction of the ion balance, typically 85% or more (e.g., [5,7,8,20,21]). In our data set, the maximum contribution of NH4+, SO42−, and NO3 is 66%, mainly because our site is influenced by the ocean and the sea-salt-derived ions Na+ and Cl contribute more to the ion balance. This phenomenon has been described for other sites as well (e.g., [12,22]). Nevertheless, it is the balance between the three ions NH4+, SO42−, and NO3 that determines the pH of the fog samples. Calcium plays a role as well, which will be discussed below. Ammonium and NO3 apparently show steeper correlations than the respective 1:1 lines (Figure 2). Sulfate correlated well with H+.
There are six outliers in Figure 2 which can be best recognized in the upper-left panel with pH > 4 and pNO3 < 4. These six samples also stand out in Figure 1 on 30 January between 11:00 a.m. and 06:00 p.m. because they clearly fall out from the temporal series of pH (second panel from top), but not in the nss-SO42− (3rd panel) and most of the other ion concentrations (not shown). In Figure 2, these samples are least prominent in the pCa2+-plot (lower-right). There was a period of enhanced Ca2+-concentrations in fog between 02:00 a.m. and 01:00 p.m. on 30 January. Figure 1 also shows (bottom panel) that there was a period with enhanced PM10 concentrations from about 01:00 p.m. on 29 January until the end of the experimental period, peaking with 52 µg·m−3 at 07:00 a.m. on 30 January and indicating the advection of dust through long-range transport. Although the respective six fog samples do not meet either DQO (QA = 2), and although the periods of high pH do not match perfectly with the periods of enhanced PM10, we presume that a real phenomenon was identified. The respective air masses likely picked up some Ca2+-rich particles in the desert region of northern China and Mongolia 96 to 48 h before arrival at Mt. Bamboo (as analyzed from the individual backward trajectories, not shown in detail), but also incorporated sulfur-rich emissions from the industrial regions of eastern China during the two days before its arrival at Mt. Bamboo. Although the pHs of these samples are normal in our data set, they seem to be partly controlled by the presence of calcium.
Another six samples are rather prominent in Figure 2 through their pHs above 5.6. Five of these six samples were collected in series on 28 January between 03:00 a.m. and 08:00 a.m. Only two can be detected in Figure 1 (second panel from above) because the other three are out of the displayed scale (pHs of 6.1, 6.3, 6.4). These samples are very clean, with total ion concentrations (neglecting the sea salt components Na+ and Cl) between 11 and 21 µeq.·L−1. The median Na+ and Cl-concentrations are 33 and 37 µeq.·L−1, respectively, reflecting the strong influence of sea salt. Only two of the five samples meet the DQO of the WMO. The sixth sample with very high pH was collected at 08:00 p.m. on 14 January. It is a QA = 2 sample with high concentrations of Na+, Cl and other ions. The high pH is, in this case, caused by the neutralization of the acidity from SO42− through high Ca2+-concentrations. The backward trajectory (not shown in detail) confirms that the respective air mass had travelled over the desert areas in NW China, then over the industrialized areas of eastern China towards Shandong province, and eventually two more days at low altitude over the East China Sea before arriving at Mt. Bamboo.
Figure 2. Scatterplots of nitrate (upper left panel), non-sea-salt sulfate (upper right panel), ammonium (lower left panel), and calcium (lower right panel) against pH in fog, and respective 1:1 lines. The p-notation represents the –log10 of the respective concentration in unit eq.·L−1, analogous to the definition of pH. Filled symbols are used for samples that met the DQO criteria of WMO (QA = 1), open circles for QA = 2 samples.
Atmosphere 06 01785 g002
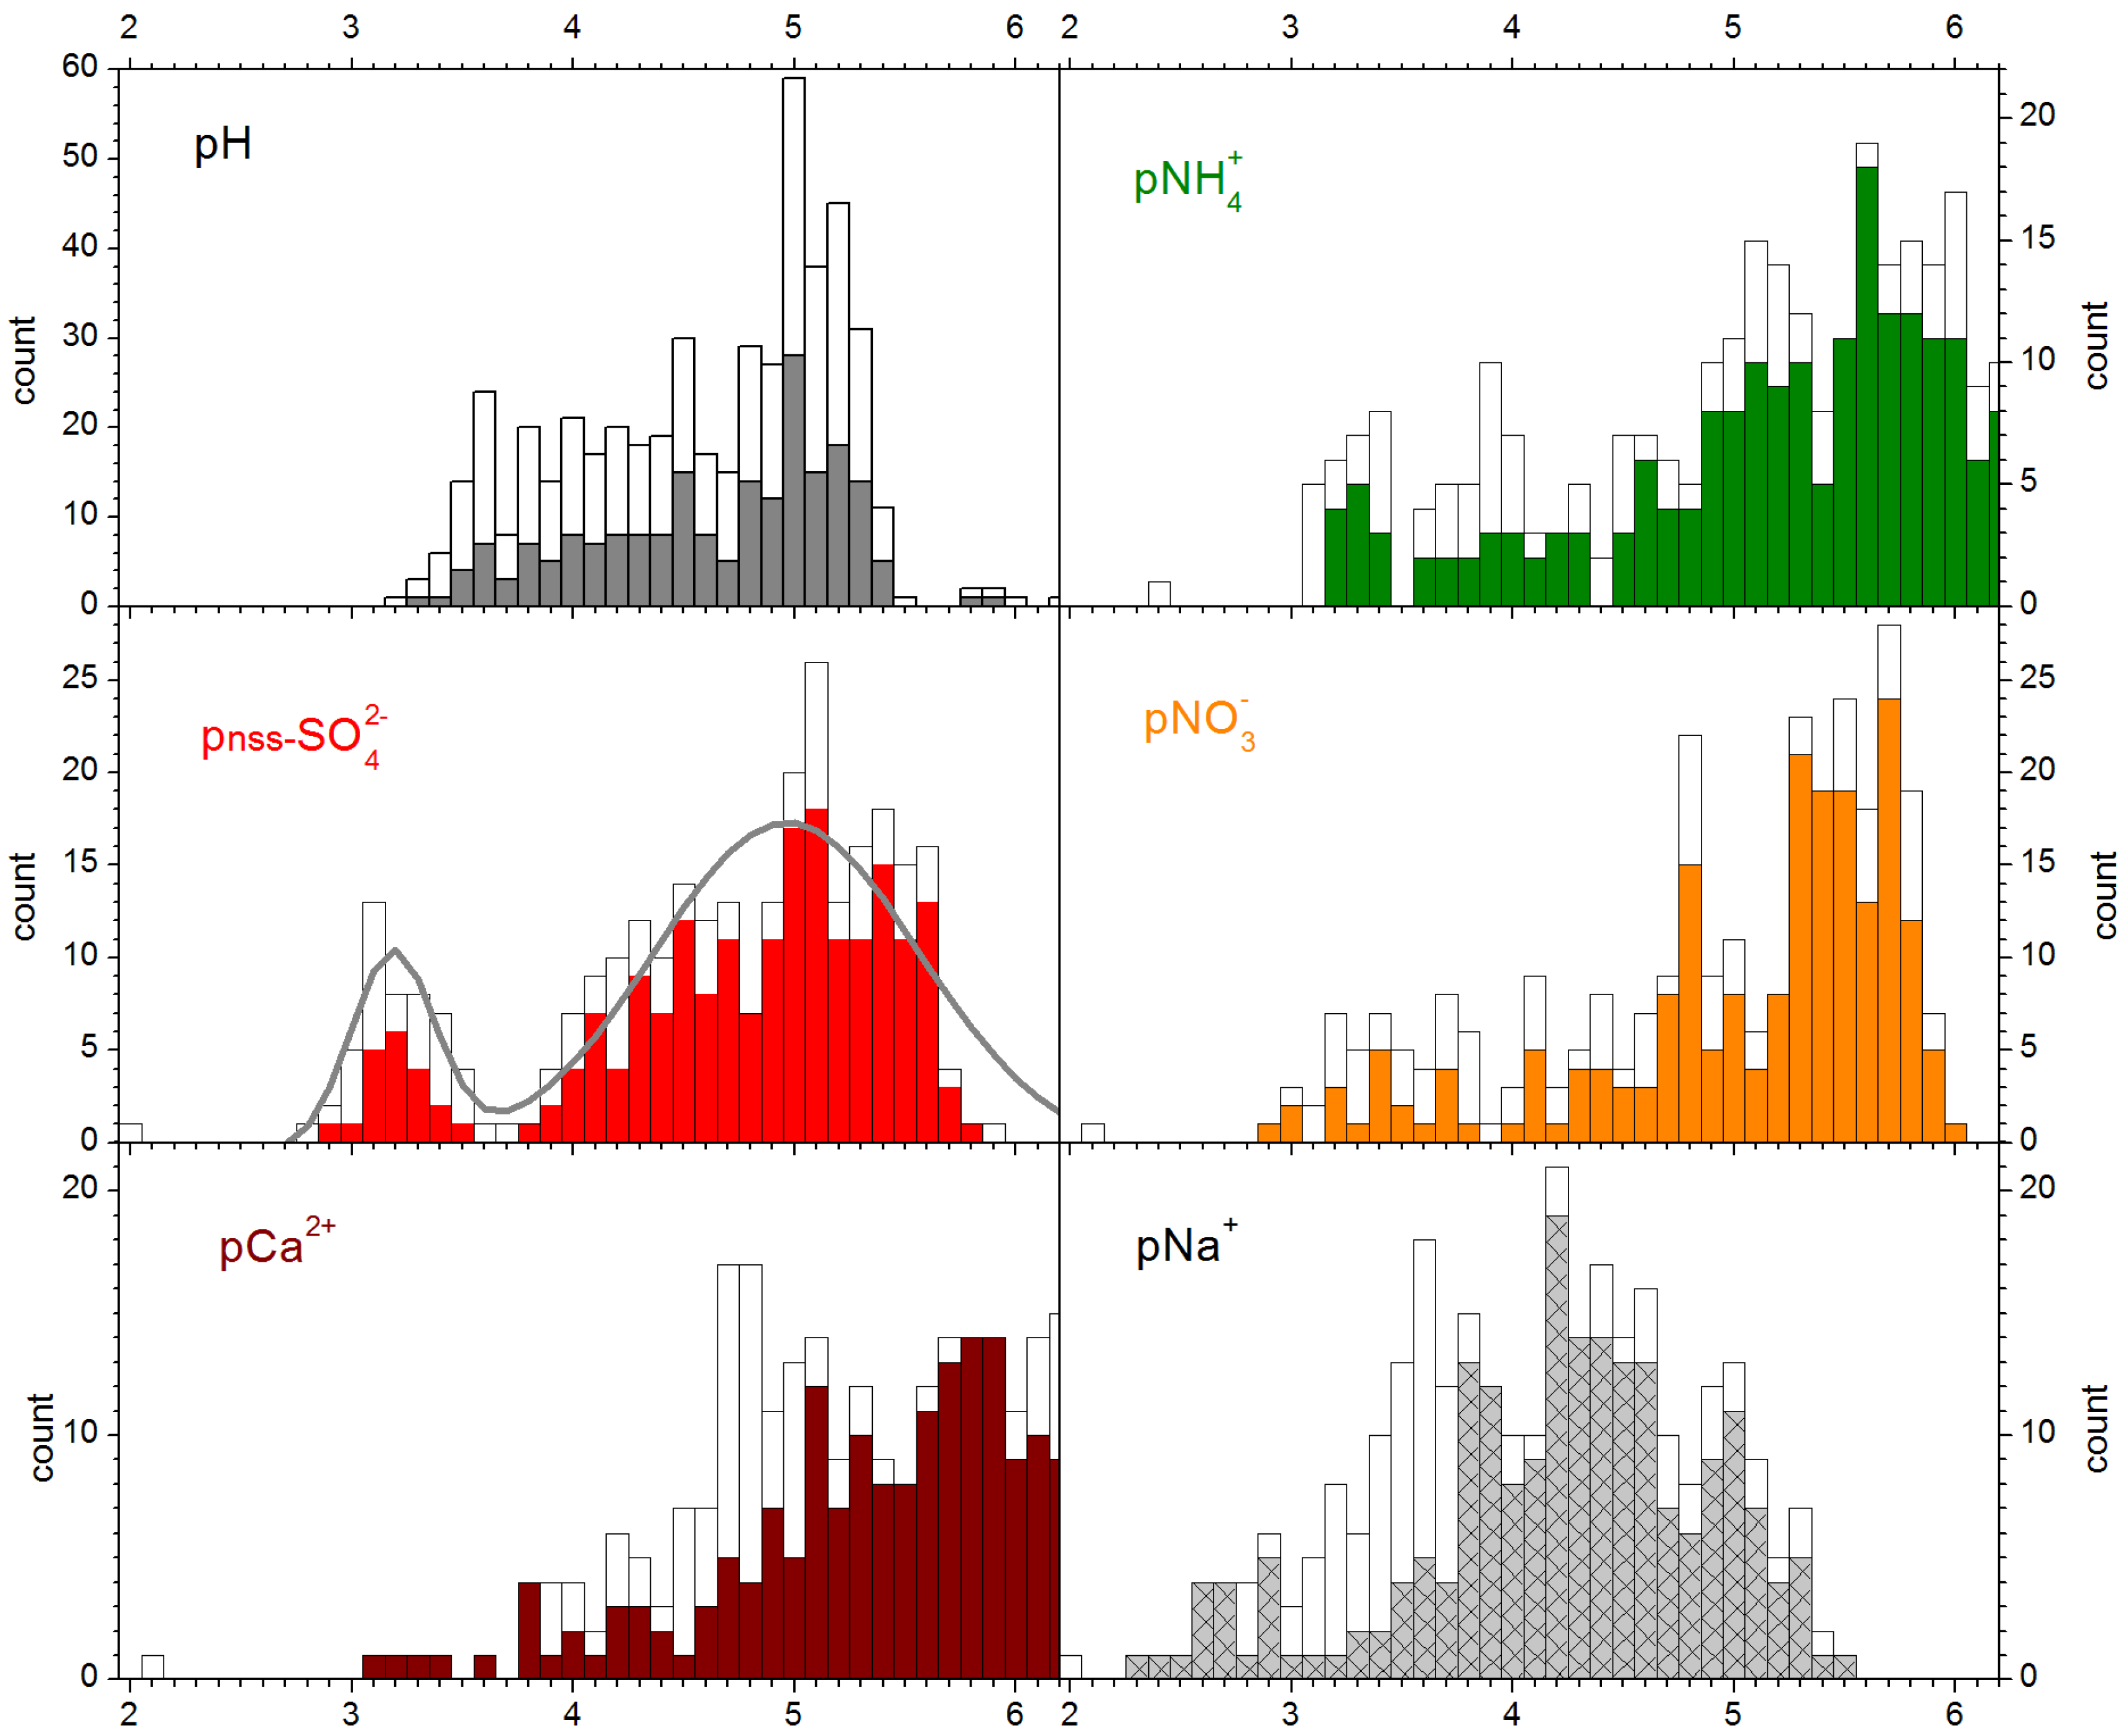
The upper-right plot in Figure 2 further indicates that there are two main groups of data with high or low concentrations of nss-SO42−, the groups appear to be rather separate from each other. We further studied this feature in Figure 3. We plotted histograms for pH, pNH4+, pnss-SO42−, pNO3, pCa2+, and pNa+, for QA = 1 data (filled bars) and QA = 2 data (open bars). All ion concentration histograms support the hypothesis that two or more groups of data exist, although the separation of the groups is most evident for pnss-SO42−.
Figure 3. Histograms of the counting statistics of pH, pNH4+, pnss-SO42−, pNO3, pCa2+, and pNa+ data in fog. Filled bars indicate the samples in full compliance with the DQOs (QA = 1 data), open bars show the data not in compliance (QA = 2). The lines in the left-middle panel indicates a two-mode Gaussian distribution approximating the full data set (QA = 1 plus QA = 2 data subsets), for illustration only.
Atmosphere 06 01785 g003
Based on this finding, we separated the data pool into two groups for further analysis, group_1 with pnss-SO42− < 3.52 (nss-SO42− > 300 µeq.·L−1), and group_2 for p nss-SO42− > 3.70 (nss-SO42− < 200 µeq.·L−1). Between these groups were two samples that did not meet the DOQs. They are excluded from the following “group analysis” in order to achieve a better separation of the two groups. The chemical information (medians and interquartile ranges) of the two groups are presented in Table 1. The full data set is presented separately from the data that comply with the DQOs (QA = 1) so that there are four columns representing the two groups.
The concentrations of all ions are much higher in group_1 than in group_2. This is not surprising, since the grouping was done on the basis of the nss-SO42− data and the concentrations covary to a high degree (Figure 2). The concentration ratios of the medians between the groups are between 30 (Mg2+) and 150 (NH4+) for QA = 1 data and between 8.0 and 130 for the same ions and for the entire data set (QA = 1 data and QA = 2 data). The respective difference in pH (just below 1.3 units) reflects a variability between the groups that is at the lower end of the ion variabilities (just below a factor of 20 for the re-calculated H+-concentrations).
Table 1. pH and concentrations of ions (medians and interquartile ranges) for 2 groups of samples (group_1 for high nss-SO42− data, group_2 for cleaner samples), presented separately for quality assurance (QA) = 1 samples, and for all data (QA = 1 and QA = 2). Anbu rain data, as collected daily, are also shown.
----Fog QA = 1 and QA = 2 DataFog QA = 1 and QA = 2 DataFog QA = 1 DataFog QA = 1 DataRain
Group_1Group_2Group_1Group_2
n = 49n = 242n = 20n = 183n = 16
pH25 percentile3.464.293.494.394.15
median3.524.803.544.814.86
75 percentile3.655.173.665.065.91
nss-SO42−25 percentile5005.65705.612
median770117001130
75 percentile930348303292
NO325 percentile2402.82902.74.7
median4105.24205.014
75 percentile640186901561
NH4+25 percentile1801.42301.53.9
median4403.54703.09.0
75 percentile630116009.760
Ca2+25 percentile230.9760.912
median672.41402.135
75 percentile1409.72406.266
Na+25 percentile5502215002240
median100057210050160
75 percentile18001602800110290
K+25 percentile170.4310.41.3
median321.2401.04.8
75 percentile514.4682.89.1
Mg2+25 percentile403.31403.58.3
median86112909.636
75 percentile240364702569
Cl25 percentile6502515002545
median99060210054170
75 percentile190001802700110280
NO3/nss-SO42−25 percentile0.460.340.480.340.38
median0.680.540.670.510.58
75 percentile0.780.750.870.700.83
Cl/Na+25 percentile0.951.000.951.020.97
median1.111.091.021.111.06
75 percentile1.351.171.061.171.11
Group_2 fog sample represent very clean fog water. With exception of the sea-salt derived ions (Na+, Cl, Mg2+), the concentrations are by a factor of about 10 lower than the fog concentrations from Mt. Lulin in Central Taiwan at 2862 m a.s.l. [23]. The 25 percentiles of concentrations are in the order of the cleanest fog water reported in the literature (e.g., [12,24]). The NO3/nss-SO42− ratio of the medians is 0.43 for QA = 1 data and 0.47 for the entire data set. The median pHs are 4.94 or 4.82, respectively, which is representative for rather pristine pH of the atmospheric liquid phase [25]. The 75 percentiles are well above pH 5. In contrast, group_1 samples represent rather high concentrations of ions in fog. The median NO3/nss-SO42− ratio is 0.54 for the full data set and 0.47 for the QA = 1 data. The biggest enhancement of concentrations in group_1 as compared to group_2 was found for NH4+.
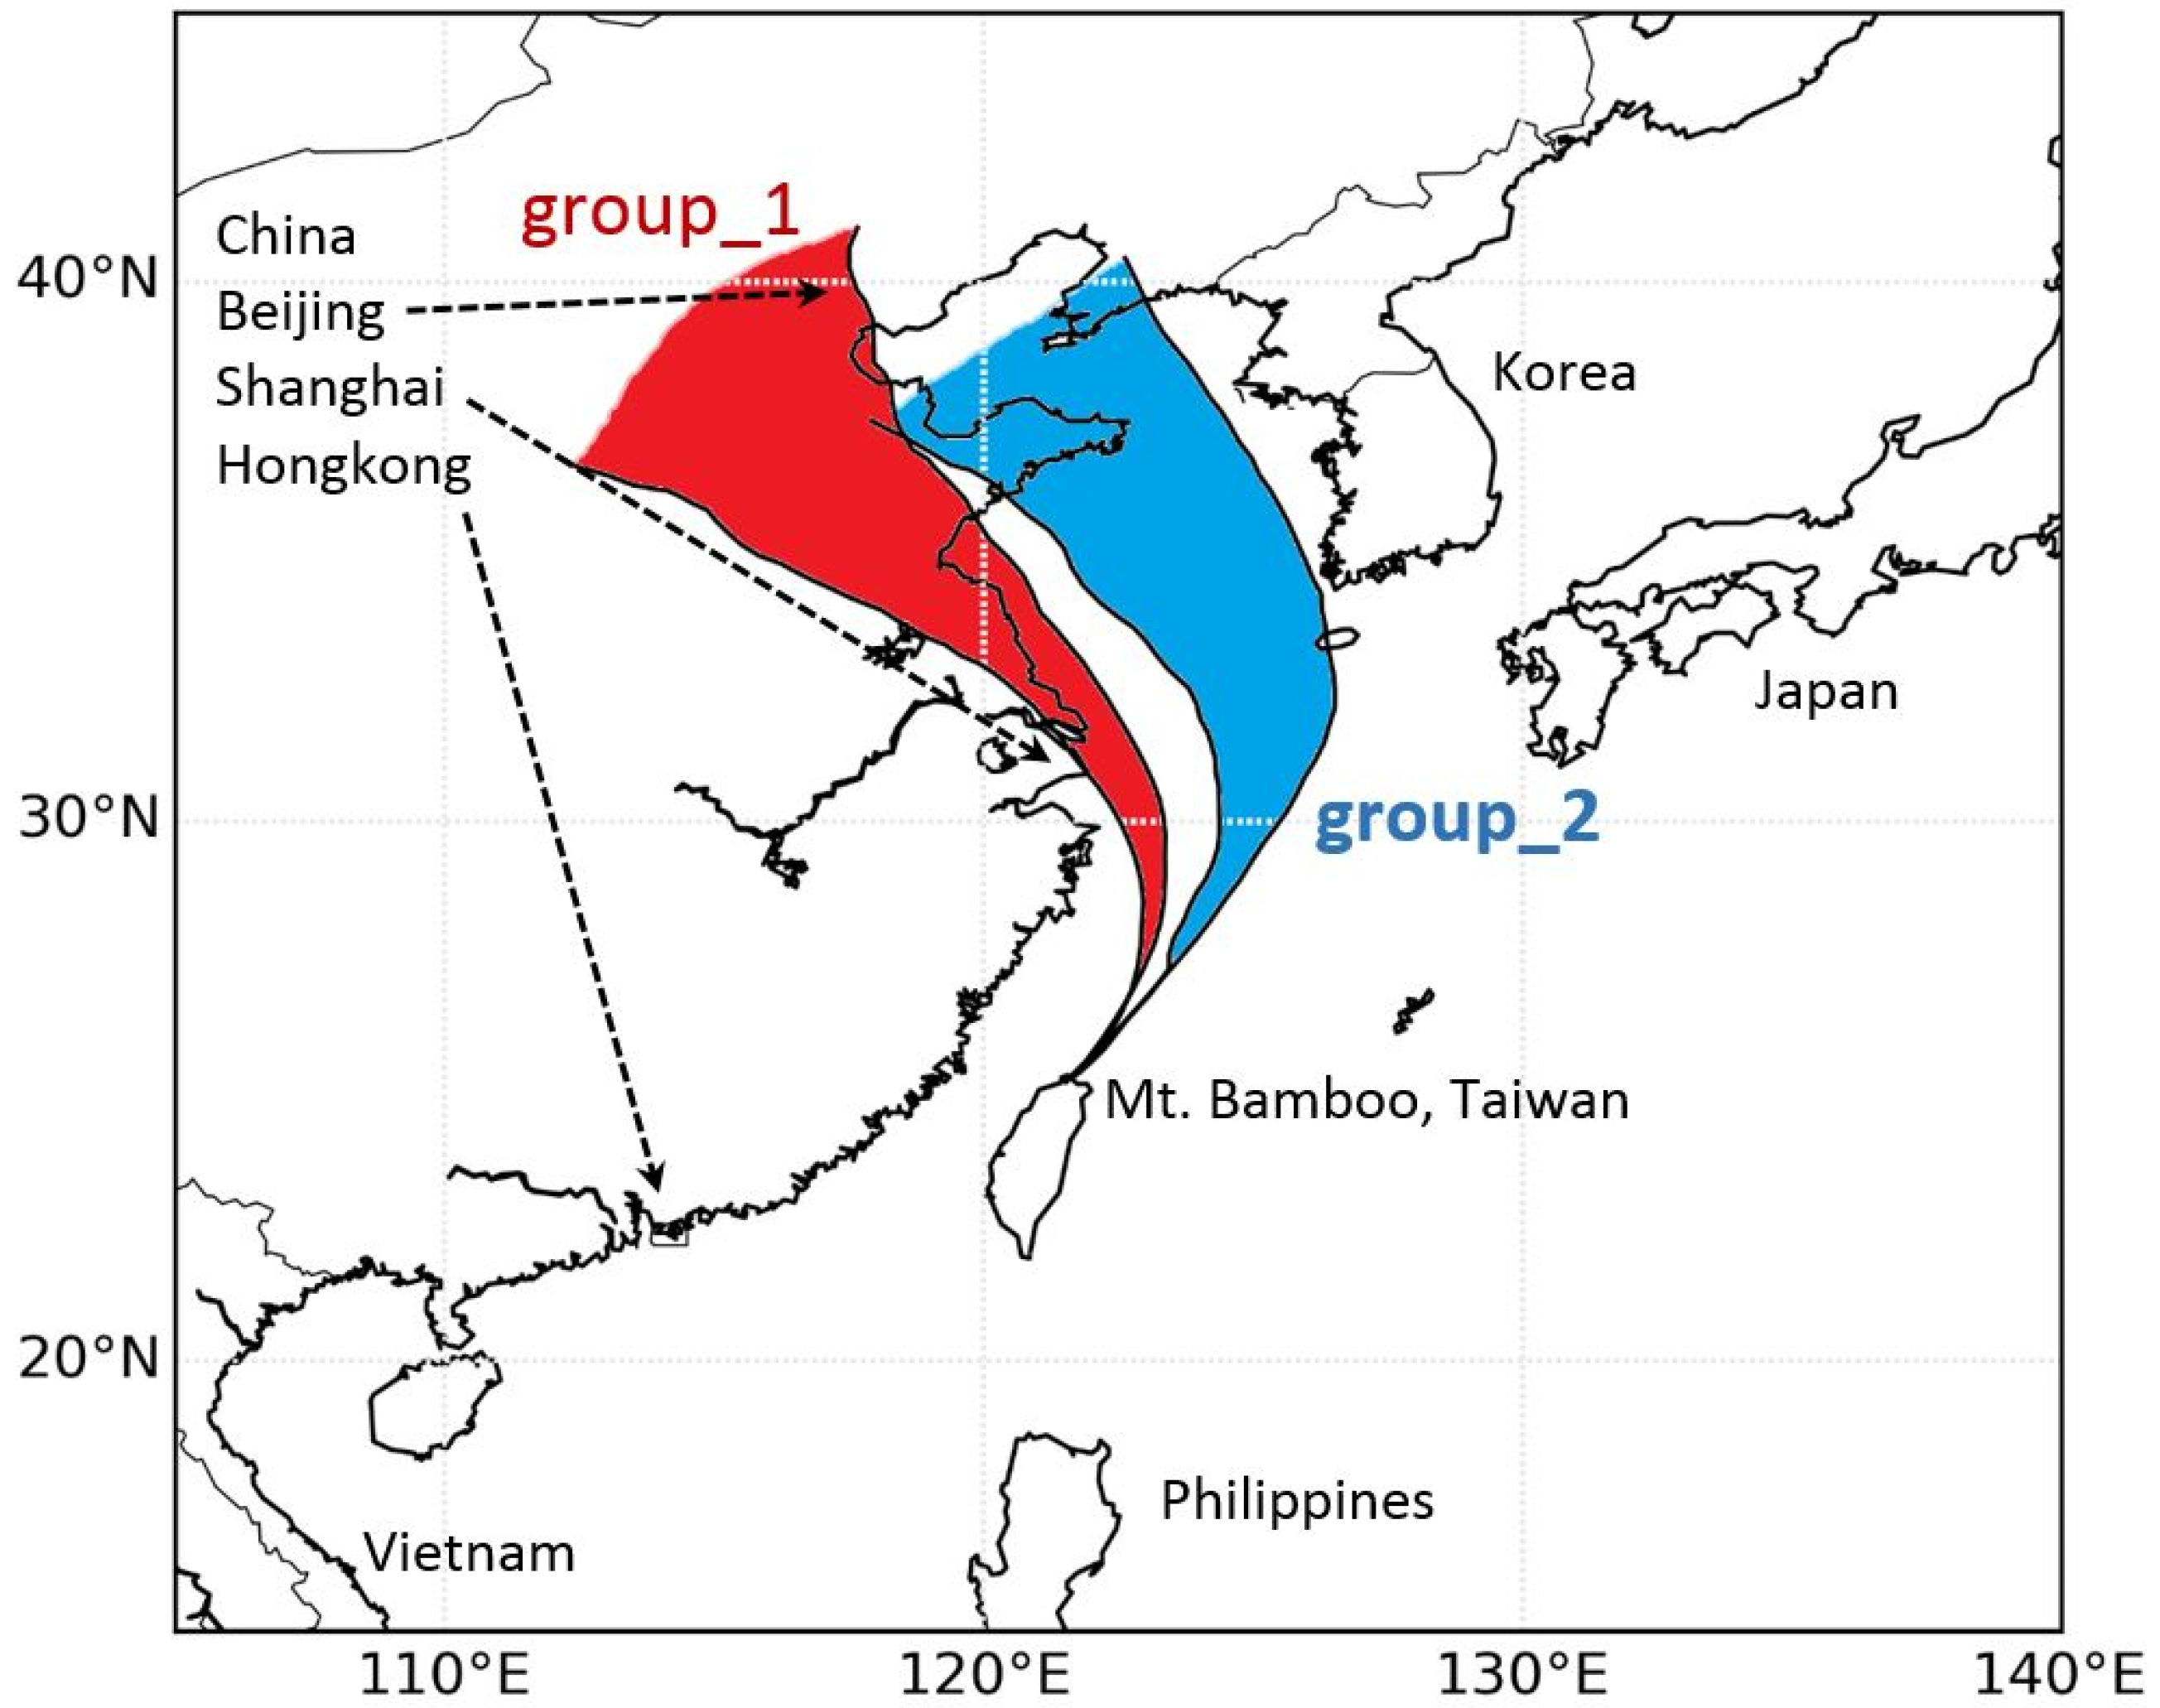
Ensemble backward trajectories for group_1 and group_2 fog samples are shown as medians and interquartile ranges in Figure 4. All trajectories arrive Taiwan from the northeast. Group_1 trajectories originate from the regions around the greater Beijing area, the Shandong province, Nanjing and Shanghai regions. In contrast, the group_2 trajectories travelled much more time over the South China Sea. The terrestrial influence is from the northeast of China, Manchuria province and considerable less influence from the Beijing region. It is evident from this analysis why group_2 samples are considerably less polluted than group_1 fog, which is strongly influenced by the heavily populated and industrialized regions of eastern China.
Figure 4. Map section of East Asia with ensemble 48-h back-trajectories arriving at Mt. Bamboo, Taiwan, during the experimental period in January 2011. The red-color trajectory sector represents the 25 to 75 percentiles of group_1 (more polluted) fog samples (all data, n = 49), group_2 (blue color) are the respective trajectories for less polluted samples (n = 242).
Atmosphere 06 01785 g004
The NO3/nss-SO42− ratios of our fog samples were within a narrow range between 0.34 and 0.87 for the interquartile ranges (Table 1). The median for the group_2 samples was about 0.53. In the group_1 data set, the median ratio is 0.67, which shows that the nitrate plays a slightly more important role than in group_2. This data is in general agreement with data from coastal and mountain sites in the USA [22] and a mountain site in China [7]. Another mountain site in Japan, which is, however, influenced by advection of highly polluted air masses, exhibits much higher ratios, throughout above unity [20].

3.3. Rain Chemistry and Scavenging

Two data subsets are available for the rain chemistry. One covers the samples taken daily from 15 January through 31 January 2011. On 23 January, no sample was taken for chemical analysis due to a lack of sufficient sample volume, so that a total of 16 samples are available. This daily data (Table 1, last column) does not reflect the same variability as the fog samples (Table 1), which had been taken on an hourly basis. The additional recording of rain pH on an hourly basis (open symbols in Figure 1, second panel), however, indicates that the variability of the composition of the rain is as large as that of the fog. The pHs are similar, although there seems to be a temporal tendency of higher pHs in rain as compared to fog, particularly on 21–22 January and on 29–30 January.
All 16 rain samples do not meet the ion balance data quality objective of the WMO (the conductivity DQO could not be tested due to the absence of measured conductivity data). The rain sample ion charges were positive, with cation surpluses between 31% and 40%. This indicates a systematic error with an important anion not having been analyzed. Likely, one or more carboxylic acids were present in the rainwater but not analyzed or other organic species such as organosulfates may have been formed during atmospheric transport and not analyzed, too [26]. Although the DQO was not met, we will have a closer look at the chemical composition of the rain samples in the following section.
We analyze the below-cloud scavenging by applying the concept described in detail by Lin and Peng [13] for Taipei rain. Briefly, it is assumed that the differences in concentrations in rain from those in the overlaying cloud (fog at the higher mountain site) is caused (i) by dilution of the cloud water and (ii) by scavenging of aerosols by raindrops falling through the air mass between the cloud base and the surface. The dilution is quantified through the decrease of the Na+ concentration, assuming that the Na+ in both cloud water and rainwater originated exclusively from sea salt and no scavenging of sea-salt-containing aerosol particles took place. Based on the comparison of the Na+ concentrations in cloud water and fog water, additional changes (increases) of concentrations of other ions are attributed to below-cloud scavenging. The contribution of below-cloud scavenging f is quantified for each event and each ion. For example, a value f(NO3) of 60% would indicate that 60% of the nitrate in rain originates from below-cloud scavenging, while the remaining 40% were originally present in the cloud water.
Table 2 shows the quartiles of f-values for ions in the 16 rain events. Chloride, NO3, nss-SO42−, and K+ exhibit no contribution of below-cloud scavenging to the rainwater chemistry. In fact, f-values below zero are physically meaningless and thus interpreted here as zero, i.e., no contribution of below-cloud scavenging took place. Likewise positive f-values below 35% are considered to be zero rather than indicators for below-cloud scavenging. Ammonium (f(NH4+) up to 54%) and Mg2+ (f(Mg2+) up to 67%) exhibit some contributions in 5 and 3 rain samples, respectively (data not shown in detail). Most striking are the contributions of below-cloud scavenging of calcium. The f(Ca2+)-values are always above 25% and reach up to 92%. It seems that a contribution of Ca2+-rich soil and bedrock material from the surrounding of the sampling sites [27] contributes largely to the respective Ca2+-concentration in rainwater. 
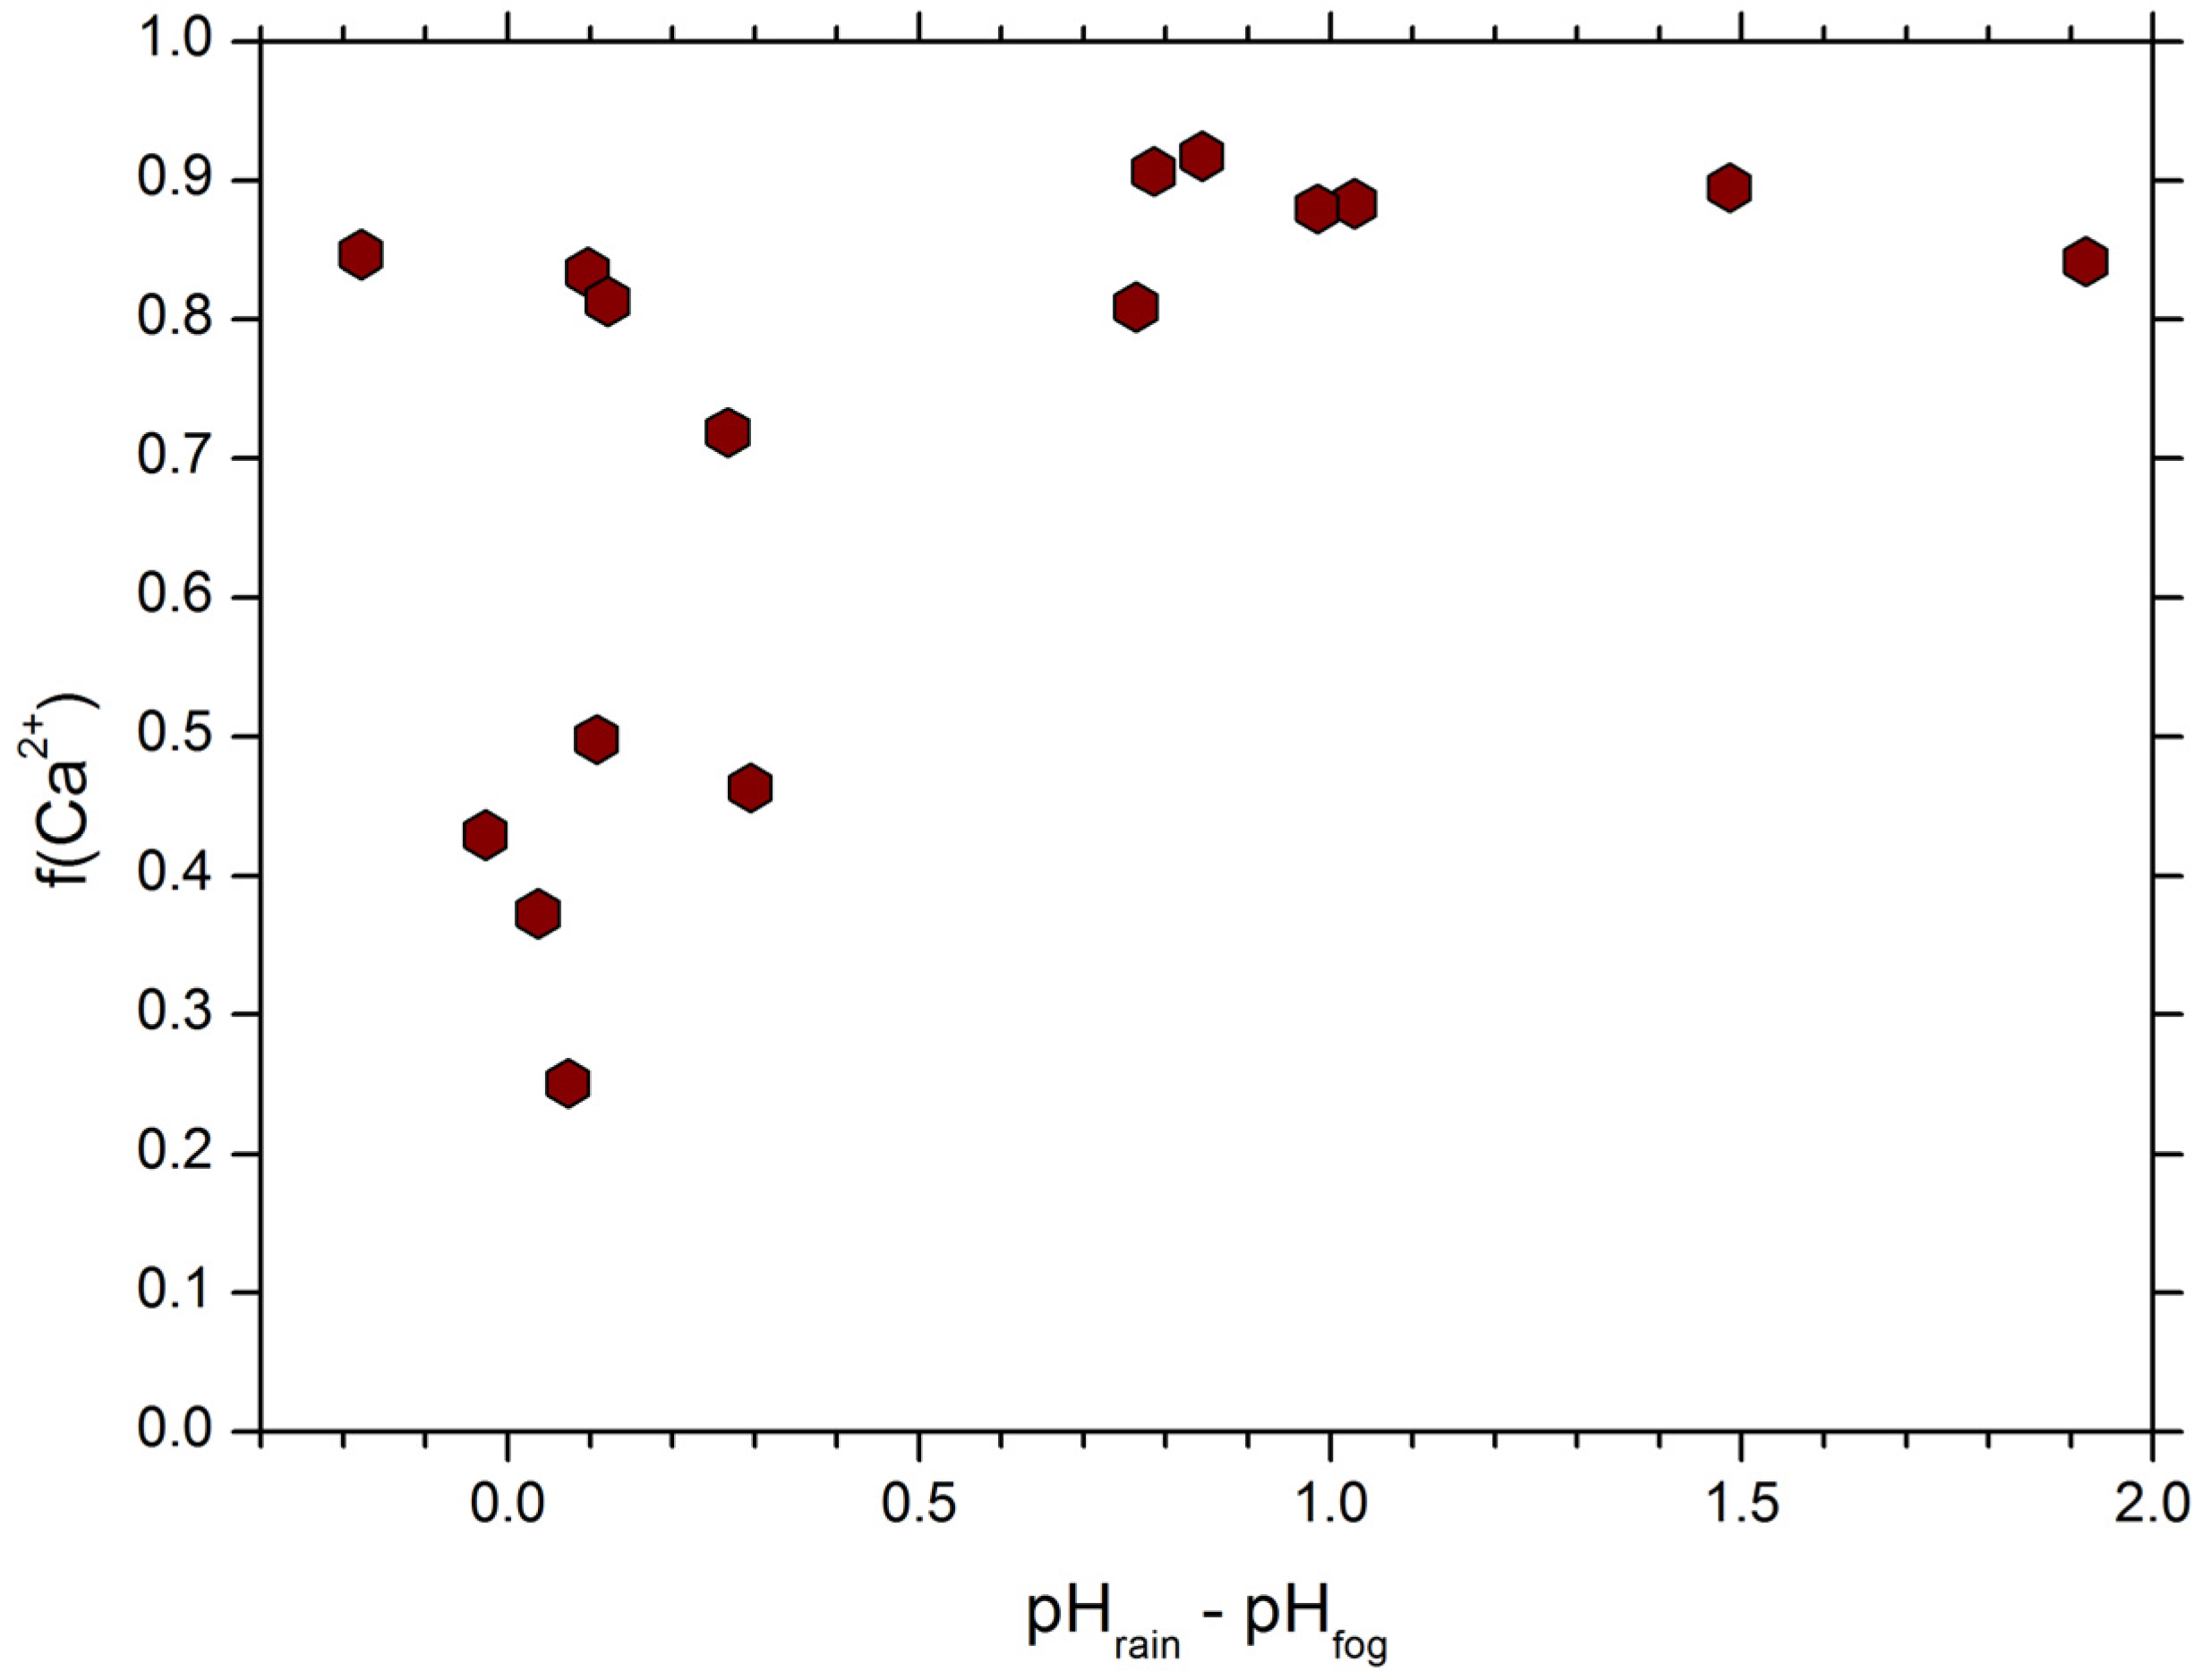
Figure 5 shows a scatterplot of f(Ca2+) versus ΔpH, which is the difference between rain-pH and cloud water pH: ΔpH = pHrain − pHfog. Whenever the rain pH was 0.5 or more units above the cloud water pH, f(Ca2+) was above 0.5. Clearly the scavenging of Ca2+-containing particles increased the pH of rain in these cases.
Table 2. Quartiles of contributions of below-cloud scavenging (f-values) for ions at the Anbu site from 14 through 31 January 2011.
--25 PercentileMedian75 Percentile
f(Cl)−0.080.000.10
f(NO3)−0.060.050.20
f(nss-SO42−)−0.250.100.34
f(NH4+)−0.090.250.41
f(Na+)0.000.000.00
f(K+)0.060.300.40
f(Mg2+)0.000.090.15
f(Ca2+)0.490.820.88
Figure 5. Scatterplot of the contribution of below-cloud scavenging to the Ca2+-concentration in rainwater f(Ca2+), against the difference of rainwater pH at the TEPA-site Anbu minus cloud water pH, based on daily rainwater samples and volume-weighted 24-h fog water concentrations between 14 and 31 January 2011.
Atmosphere 06 01785 g005

4. Conclusions

We analyzed fog water and rainwater at a mountain range at the northern tip of Taiwan during the second half of January 2011. While the mountain fog persisted over long time periods, rain was collected at a site that is situated about 200 m lower a.s.l. Therefore, the mountain fog may as well be considered as a cloud, and the separation of these two nouns is not important in the context of this study.
The general flow pattern was almost exclusively from the northeast during the experimental phase. Air masses of very different characteristics were advected to Taiwan, as documented in the fog chemistry and gaseous and particle concentrations. One group of air mass had travelled over the industrialized and densely populated regions of eastern China during the 48 h before arrival at the site, and was associated with fog pHs of about 3.5 (median). The second group of air masses, which makes up over 80% of our data set, lead to extremely clean fog water with pHs of 4.8 (median) and very low concentrations of ions. The classification of the air masses into two groups was performed on the basis of the nss-SO42−-concentrations and could be well mirrored in the origin of the air masses on the basis of backward trajectories as mentioned. However, the wind direction during the respective fog sampling periods upon arrival at Mt. Bamboo, Taiwan, was identical during both types of air masses.
The pHs in fog were mostly controlled by the balance of NH4+, NO3, and nss-SO42−, with Ca2+ from desert erosion playing a role in some cases. In general, low pHs were associated with high concentrations of all ions. The highest pHs co-occurred with the lowest concentrations of all ions. Despite this fact, it is not the LWC that drives the concentrations of ions or the pH through varying degrees of dilution of fog water; the variability of the LWC is less than that of the ions. In fact, low pHs and high concentrations of ions in fog water occurred when the PM10 concentrations were high as well. The air masses associated with low fog pHs were generally highly polluted, while high fog pHs occurred synchronously with low PM10 concentrations (Figure 1) and low PM2.5 concentrations (not shown). As the ion concentrations covary largely, it is not the acidifying or neutralizing action of a single ion that drives the pH regime. The variability of the pH (and of the derived hydrogen ion concentration 10−pH) was less than the variability of the ions driving it. This makes the pH a rather robust parameter on the one hand but also a less suitable marker for the chemical characteristics than the concentrations of the respective ions. The rain chemistry was largely similar to that of the fog. However, some below-cloud scavenging of Ca2+ lead to an increase of the pH in rain as compared to the simultaneous pH of the overlaying fog (cloud) layer.
Very clean cloud water was sampled during extensive time periods at Mt. Bamboo during January 2011. Neglecting the influence of sea salt ions, which plays a rather important role at this site near the ocean, the total ion sums were around 50 µeq.·L−1 (median of 242 samples in group_2). Such low concentrations were not measured during preceding experiments at other sites in Taiwan (e.g., [23]), and may be partly due to the fact that our sampling period was quite rainy throughout. Scavenging of pollutants could happen before the arrival of the air masses to our collection sites. The chloride and sodium concentrations are not only at a relatively high level of concentrations, but their equivalent ratios Cl/Na+ are also very close to 1.16 (Table 1), which is the typical value for ocean water. The depletion of chloride from the liquid phase due to the presence of strong acids, a phenomenon that is observed worldwide including during previous experiments in Taiwan [23], was not an important process at our site and during the analyzed episode. After all, the advection of very clean clouds is certainly to be considered a temporal phenomenon. However, the large number of fog samples representing the very low median concentrations, and the fact that there is a period of northeasterly flow during the first two or three months of each year in this region of East Asia, confirm that the observed phenomenon is not an exceptional one either.
About 31% of our fog samples as well as all rain samples did not meet the data quality objectives (DQO) of the World Meteorological Organization (WMO) for precipitation water. We decided to analyze these data as well in fear of losing valuable information they might carry. Of course, the data set that contains only the high-quality results (QA = 1), shows somewhat different results than the full data set including the QA = 2 data. The differences are low, though (Table 1), with the quartile pHs being different between the data subsets by a maximum of only 0.11 units. On the other hand, the QA = 2 data provided us quite some insight into processes that would otherwise have stayed concealed: In some cases, Ca2+ from apparent long-range transport lead to an increased pH in fog. For rain, below-cloud scavenging of Ca2+ leads to a significant increase of the pH in some cases. Last not least, the sample with the lowest pH of 3.17, which is the only sample that was collected during southerly wind and exhibited the influence of the local volcanic activity, would not have been analyzed.

Acknowledgments

The fog water collection and chemical analysis were supported by the National Science Council of Taiwan under grant number 100-2111-M-008-011. The authors would like to thank the Taiwan Ministry of Science and Technology (MOST) and the NRW Heinrich Hertz Stiftung for supporting this study. Further, the authors gratefully acknowledge the NOAA Air Resources Laboratory (ARL) for the provision of the HYSPLIT transport and dispersion model and/or READY website used in this publication. We also thank the Taiwan Environmental Protection Administration for data access through their websites.

Author Contributions

Otto Klemm drafted the main text body. Wei-Ti Tseng, Chia-Ching Lin and Kerstin Klemm contributed to sample collection and data analysis. Neng-Huei Lin designed the sampling strategy, overviewed data analysis, and edited the text body. Correspondence may be addressed to either Otto Klemm or Neng-Huei Lin.

Conflicts of Interest

The authors declare no conflict of interest.

References

  1. Yang, J.-Y.; Xie, C.-E.; Shi, C.-E.; Liu, D.-Y.; Niu, S.-J.; Li, Z.-H. Ion composition of fog water and its relation to air pollutants during winter fog events in Nanjing, China. Pure Appl. Geophys. 2011, 169, 1037–1052. [Google Scholar] [CrossRef]
  2. Giulianelli, L.; Gilardoni, S.; Tarozzi, L.; Rinaldi, M.; Decesari, S.; Carbone, C.; Facchini, M.C.; Fuzzi, S. Fog occurrence and chemical composition in the Po valley over the last twenty year. Atmos. Environ. 2014, 98, 394–401. [Google Scholar] [CrossRef]
  3. Herckes, P.; Marcotte, A.; Wang, Y.; Collett, J.L. Fog composition in the Central Valley of California over three decades. Atmos. Res. 2015, 151, 20–30. [Google Scholar] [CrossRef]
  4. Kim, M.-G.; Lee, B.-K.; Kim, H.-J. Cloud/fog water chemistry at a high elevation site in South Korea. J. Atmos. Chem. 2006, 55, 13–29. [Google Scholar] [CrossRef]
  5. Tago, H.; Kimura, H.; Kozawa, K.; Fujie, K. Long-term observation of fogwater composition at two mountainous sites in Gunma Prefecture, Japan. Water Air Soil Pollut. 2006, 175, 375–391. [Google Scholar] [CrossRef]
  6. Watanabe, K.; Honoki, H.; Iwai, A.; Tomatsu, A.; Noritake, K.; Miyashita, N.; Yamada, K.; Yamada, H.; Kawamura, H.; Aoki, K. Chemical characteristics of fog water at Mt. Tateyama, near the coast of the Japan Sea in central Japan. Water Air Soil Pollut. 2010, 211, 379–393. [Google Scholar] [CrossRef]
  7. Wang, Y.; Guo, J.; Wang, T.; Ding, A.; Gao, J.; Zhou, Y.; Collett, J.L.; Wang, W. Influence of regional pollution and sandstorms on the chemical composition of cloud/fog at the summit of Mt. Taishan in northern China. Atmos. Res. 2011, 99, 434–442. [Google Scholar] [CrossRef]
  8. Guo, J.; Wang, Y.; Shen, X.; Wang, Z.; Lee, T.; Wang, X.; Li, P.; Sun, M.; Collett, J.L.; Wang, W.; et al. Characterization of cloud water chemistry at Mount Tai, China: Seasonal variation, anthropogenic impact, and cloud processing. Atmos. Environ. 2012, 60, 467–476. [Google Scholar] [CrossRef]
  9. Ding, X.; Wang, X.-M.; Zheng, M. The influence of temperature and aerosol acidity on biogenic secondary organic aerosol tracers: Observations at a rural site in the central Pearl River Delta region, South China. Atmos. Environ. 2011, 45, 1303–1311. [Google Scholar] [CrossRef]
  10. Hu, G.; Zhang, Y.; Sun, J.; Zhang, L.; Shen, X.; Lin, W.; Yang, Y. Variability, formation and acidity of water-soluble ions in PM2.5 in Beijing based on the semi-continuous observations. Atmos. Res. 2014, 145–146, 1–11. [Google Scholar] [CrossRef]
  11. Li, P.; Li, X.; Yang, C.; Wang, X.; Chen, J.; Collett, J.L. Fog water chemistry in Shanghai. Atmos. Environ. 2011, 45, 4034–4041. [Google Scholar] [CrossRef]
  12. Wang, Y.; Zhang, J.; Marcotte, A.R.; Karl, M.; Dye, C.; Herckes, P. Fog chemistry at three sites in Norway. Atmos. Res. 2015, 151, 72–81. [Google Scholar] [CrossRef]
  13. Lin, N.-H.; Peng, C.-M. Estimates of the contribution of below-cloud scavenging to the pollutant loadings of rain in Taipei, Taiwan. Terr. Atmos. Ocean. Sci. 1999, 10, 693–704. [Google Scholar]
  14. Galloway, J.N.; Savoie, D.L.; Keene, W.C.; Prospero, J.M. The temporal and spatial variability of scavenging ratios for nss sulfate, nitrate, methanesulfonate and sodium in the atmosphere over the North Atlantic Ocean. Atmos. Environ. 1993, 27A, 235–250. [Google Scholar] [CrossRef]
  15. Gonser, S.; Klemm, O.; Griessbaum, F.; Chang, S.-C.; Chu, H.-S.; Hsia, Y.J. The relation between humidity and liquid water content in fog: An experimental approach. Pure Appl. Geophys. 2011, 169, 821–833. [Google Scholar] [CrossRef]
  16. Taiwan Air Quality Monitoring Network. Available online: http://taqm.epa.gov.tw/taqm/en/ (accessed on 8 July 2015).
  17. Draxler, R.R.; Hess, G.D. An overview of the Hysplit 4 modeling system for trajectories, and deposition. Aust. Meteorol. Mag. 1998, 47, 295–308. [Google Scholar]
  18. NOAA ARL Air Resources Laboratory. Available online: http://ready.arl.noaa.gov/HYSPLIT.php (accessed on 10 July 2015).
  19. Allan, M.A. World Meteorological Organization. Manual for the GAW Precipitation Chemistry Programme—Guidelines, Data Quality Objectives and Standard Operating Procedures. Available online: ftp://ftp.wmo.int/Documents/PublicWeb/arep/gaw/gaw160.pdf (accessed on 16 June 2015).
  20. Igawa, M.; Matsumura, K.; Okochi, H. Fog water chemistry at Mt. Oyama and its dominant factors. Water Air Soil Pollut. 2001, 130, 607–612. [Google Scholar] [CrossRef]
  21. Klemm, O.; Wrzesinsky, T. Fog deposition fluxes of water and ions to a mountainous site in Central Europe. Tellus B 2007, 59, 705–714. [Google Scholar] [CrossRef]
  22. Collett, J.L.; Bator, A.; Eli Sherman, D.; Moore, K.F.; Hoag, K.J.; Demoz, B.B.; Rao, X.; Reilly, J.E. The chemical composition of fogs and intercepted clouds in the United States. Atmos. Res. 2002, 64, 29–40. [Google Scholar] [CrossRef]
  23. Simon, S.; Klemm, O.; El-Madany, T.; Walk, J.; Amelung, K.; Lin, P.-H.; Chang, S.-C.; Lin, N.H.; Engling, G.; Hsu, S.C.; et al. Chemical composition of fog water at four sites in Taiwan. Aerosol Air Qual. Control 2015. [Google Scholar] [CrossRef]
  24. Verhoeven, W.; Herrmann, R.; Eiden, R.; Klemm, O. A comparison of the chemical composition of fog and rainwater collected in the Fichtelgebirge, F.R. of Germany, and the South Island of New Zealand. Theor. Appl. Climatol. 1987, 38, 210–221. [Google Scholar] [CrossRef]
  25. Seinfeld, J.H.; Pandis, S.N. Atmospheric Chemistry and Physics: From Air Pollution to Climate Change; Wiley: Hoboken, NJ, USA, 2006. [Google Scholar]
  26. Ervens, B.; Turpin, B.J.; Weber, R.J. Secondary organic aerosol formation in cloud droplets and aqueous particles (aqSOA): A review of laboratory, field and model studies. Atmos. Chem. Phys. 2011, 11, 11069–11102. [Google Scholar] [CrossRef]
  27. Shellnutt, J.G.; Belousov, A.; Belousova, M.; Wang, K.-L.; Zellmer, G.F. Generation of calc-alkaline andesite of the Tatun volcanic group (Taiwan) within an extensional environment by crystal fractionation. Int. Geol. Rev. 2014, 56, 1156–1171. [Google Scholar] [CrossRef]

