Article

Vertical Structure of Global Oceanic Summer Precipitation Identified from GPM GMI EOF Analysis

Department of Earth Science Education, Kongju National University, Kongju 32588, Republic of Korea
Atmosphere 2026, 17(9), 901; https://doi.org/10.3390/atmos17090901
Submission received: 19 August 2026 / Revised: 10 September 2026 / Accepted: 13 September 2026 / Published: 16 September 2026
(This article belongs to the Section Atmospheric Techniques, Instruments, and Modeling)

Abstract

This study extends an Empirical Orthogonal Function (EOF)-based diagnostic framework to a global scale to characterize oceanic precipitation systems during hemispheric summer, applied to multi-channel Polarization Corrected Temperature (PCT) observations from the Global Precipitation Measurement (GPM) Microwave Imager (GMI). The EOF framework condenses multi-channel microwave variability into a two-dimensional coordinate space defined by the first two principal components ( P C 1 and P C 2 ), providing a physically interpretable structural representation of precipitation systems. P C 1 represents bulk hydrometeor loading; its global distribution is characterized by elevated values in the ITCZ, Asian monsoon regions, and major midlatitude storm-track belts. P C 2 modulates the relative contributions of upper-level ice scattering and lower-level liquid emission, characterizing vertical phase partitioning within the column. Collocated GPM Dual-frequency Precipitation Radar (DPR) observations demonstrate that the P C coordinates correspond systematically to three-dimensional reflectivity structures across both convective and stratiform regimes. This partitioning exhibits a systematic meridional contrast, shifting toward greater ice-phase contribution in the tropics and greater liquid-phase contribution across the midlatitudes—consistent with DPR-observed reflectivity profiles, storm-top height, and the Ice-to-Rain Path Ratio (IRPR). The EOF framework provides an observation-based reference for evaluating microphysical representations in numerical models and satellite precipitation retrieval algorithms.

1. Introduction

Understanding the global distribution and physical characteristics of precipitation is fundamental to comprehending Earth’s water cycle and climate system (e.g., [1,2]). While surface precipitation measurements provide essential information, the vertical structure of precipitation systems is equally critical because it regulates latent heat release and cloud–radiation interactions (e.g., [3,4,5,6]). Through its control of vertical heating profiles, it influences storm dynamics and contributes to large-scale atmospheric circulation variability (e.g., [7,8,9,10]).
Since the pioneering emission-based rainfall estimation of Nimbus-5 [11], satellite microwave observations have advanced through SSM/I [12,13] to the Tropical Rainfall Measuring Mission (TRMM) [14,15,16] and the current GPM mission [2,17], both of which integrate a microwave radiometer and a spaceborne precipitation radar. The Global Precipitation Mission (GPM) core observatory provides a coordinated radiometer–radar dataset that enables direct comparison between multi-channel microwave signatures and the vertical organization of hydrometeors, facilitating structural analyses of precipitation systems. This radiometer–radar synergy has been used to construct precipitation-radiation databases or retrieval algorithms for passive microwave rainfall estimation (e.g., [18,19,20,21]).
To emphasize precipitation-related signals while reducing sensitivity to varying surface emissivity, the Polarization Corrected Temperature (PCT) has been widely used as a polarization-based metric [22,23]. By removing the background brightness temperature associated with the underlying surface, PCT mitigates much of the variability due to surface emissivity differences. However, the non-uniqueness problem inherent to microwave retrievals remains: distinct vertical hydrometeor configurations can produce similar brightness temperature signatures, and this ambiguity cannot be fully resolved regardless of the number of channels used (e.g., [24,25]). Meanwhile, multi-channel PCT observations span a high-dimensional variability space that is difficult to interpret directly. A PCT-based EOF framework addresses this by condensing the coupled variability among multiple microwave channels into a small number of statistically dominant modes, providing a low-dimensional yet physically interpretable representation of precipitation vertical structure. This approach was demonstrated by comparing TB manifolds between model-generated and observed clouds [26], and subsequently extended to evaluate cloud microphysical parameterizations [27] and characterize regional precipitation structure over tropical oceans [28]. In particular, the physical basis for this interpretation was independently established through forward radiative-transfer modeling of cloud-resolving model simulations, in which EOF coefficients were directly linked to the underlying simulated hydrometeor profiles (rain, cloud ice, snow, and graupel) [27]. In this reduced space, precipitation systems with structurally distinct vertical configurations are likely to occupy separate regions along the leading EOF axes, offering improved structural differentiation across diverse precipitation regimes.
Such a structural framework is particularly valuable when applied at a global scale, where precipitation systems span a wide range of dynamical and thermodynamical regimes. Characterizing these structural variations in a physically interpretable coordinate space provides a basis for understanding large-scale precipitation climatology. Numerical weather prediction and climate models still struggle to reproduce the vertical distribution and life cycle of hydrometeors, owing in part to uncertainties in cloud microphysical parameterizations [25,29,30,31]. While radiometric diagnostics do not replace in situ measurements, global maps of EOF-derived structural parameters offer an observation-based reference for evaluating whether modeled storms reproduce the dominant observed modes of vertical organization, particularly over data-sparse oceans.
While precipitation intensity and rain-type structure have been documented across scales [9,32,33], a systematic characterization of precipitation vertical structure over the global oceans remains limited. Studies examining vertical organization have largely focused on specific regions or individual storm types, owing in part to the difficulty of representing three-dimensional structural variability in a two-dimensional horizontal map domain. Retrieval-based estimates of vertical hydrometeor profiles also exhibit systematic, rain-type-dependent biases [34], further underscoring the difficulty of achieving a reliable global characterization. The near-global oceanic coverage of GPM GMI now makes it possible to extend the EOF-based structural framework to a global scale, enabling a systematic characterization of precipitation vertical structure across diverse oceanic regions and meteorological regimes. Collocated DPR observations serve as an independent physical reference to validate the structural interpretation derived from the EOF analysis.
The primary objective of this study is to characterize global oceanic precipitation structures during hemispheric summer by extending the EOF-based diagnostic framework to a global scale using GPM GMI observations. The analysis is restricted to the oceans to minimize uncertainties from heterogeneous land-surface emissivity and to isolate precipitation-structure variability more directly expressed in microwave radiances. The leading EOF modes are interpreted in terms of storm vertical structure through compositing of collocated three-dimensional reflectivity profiles from the GPM DPR. The associated P C coordinates are then evaluated against independent variables, including rain rate, rainwater path (RWP), ice water path (IWP), and storm-top height. Together, these analyses establish an EOF-defined structural framework that links passive microwave radiative signatures to three-dimensional storm organization and provides an observationally constrained reference for evaluating cloud microphysical parameterizations in numerical models and structural consistency in satellite precipitation retrieval algorithms.

2. Materials and Methods

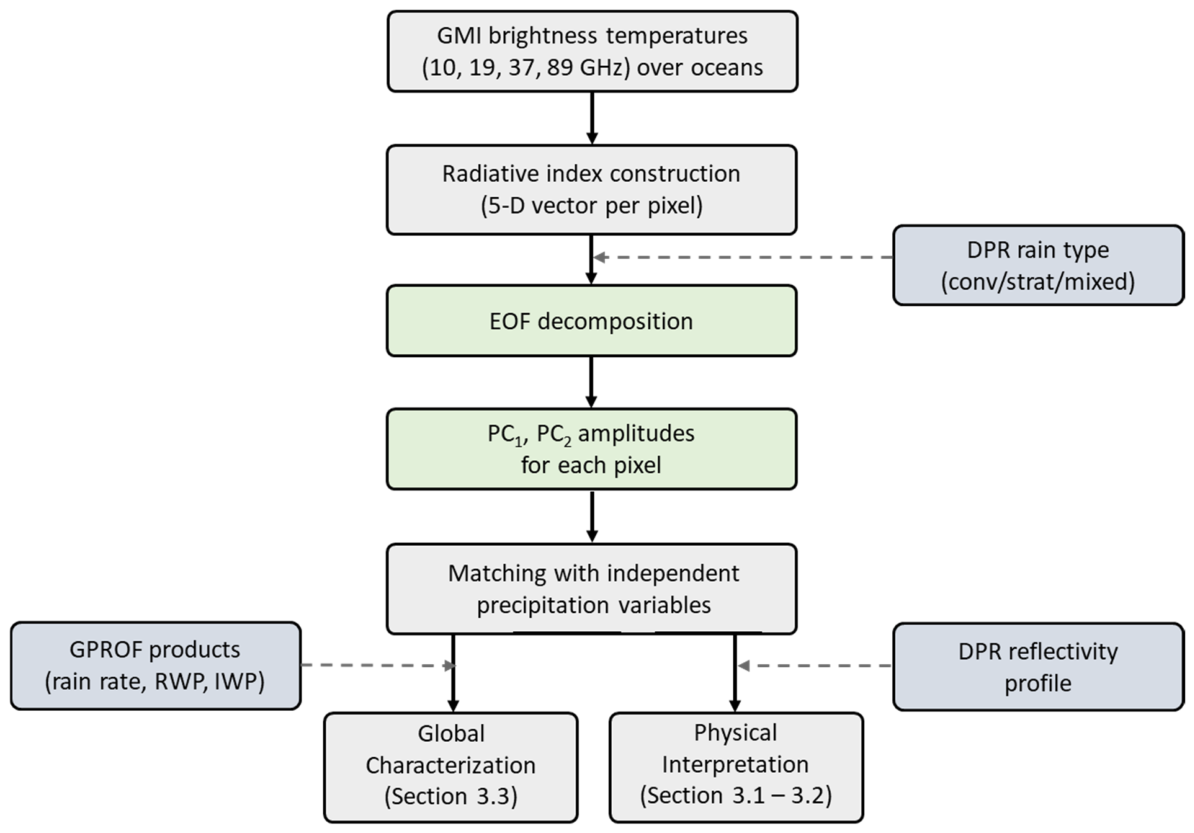
This study uses satellite observations from the GPM core observatory to construct a global characterization of oceanic precipitation structure within the EOF-based framework (Figure 1). The following sections describe the data selection criteria, preprocessing of multi-channel microwave signals, and the statistical procedures used to derive the EOF-based structural representation of precipitation systems.

2.1. Satellite Data and Sampling Strategy

This study uses observations from the GPM Microwave Imager (GMI) and the Dual-frequency Precipitation Radar (DPR) [2]. The GMI is a multi-channel conical-scanning radiometer that provides brightness temperature (TB) measurements at 13 channels ranging from 10.65 to 183.31 GHz. The DPR is a spaceborne radar operating at Ku-band (13.6 GHz) and Ka-band (35.5 GHz), providing three-dimensional reflectivity profiles of precipitation systems [35].
In this study, five years (2020–2024) of GPM Level 2 products are analyzed over the global oceans to characterize hemispheric-summer precipitation structure. To emphasize summertime precipitation conditions in each hemisphere, the analysis is restricted to the respective three-month summer seasons: June–August (JJA) for the Northern Hemisphere and December–February (DJF) for the Southern Hemisphere. This seasonal restriction reflects the expectation that dominant precipitation cloud structures—and consequently the leading EOF modes of the TB-based radiative indices—differ across seasons. Restricting the analysis to a single, dynamically consistent season in each hemisphere avoids blending structurally distinct regimes within a single EOF decomposition, thereby preserving the physical interpretability of the leading modes.
A latitude-dependent sampling adjustment is applied to reduce sampling bias. Because the density of satellite footprints increases toward higher latitudes owing to the GPM orbital inclination (65°), simple pixel aggregation would introduce disproportionate weighting of high-latitude regions. To reduce this sampling bias, the number of pixels retained within each latitudinal band is adjusted in proportion to its relative surface area. A target sample count proportional to cos(latitude) was defined for each 1° latitude band to ensure equal-area representation. Raw sample counts exceeded this target at every band across the effectively sampled latitude range, and latitude bands were accordingly downsampled via random selection without replacement.

2.2. Preprocessing and Data Screening

Prior to radiative-index construction, a screening procedure is applied. The analysis is restricted to open-ocean pixels using the GMI surface-type flag (surfaceTypeIndex) provided in the GPM GMI Level-2/3 product; land and coastal pixels are excluded to minimize surface-emissivity contamination. Sea-ice regions are also removed because their radiative characteristics differ substantially from those of open ocean. It should be noted that isolated icebergs are not represented as a dedicated category in this classification and would therefore not be expected to be screened out.
Following the spatial filtering, the collocated GMI TBs across frequencies are converted into attenuation and scattering indices following the approach of [22,23]. To compute these indices, background TBs—representing the brightness temperatures for the same scene in the absence of all clouds—must be determined. Clear-sky background TBs are identified using the observation-based methodology of [36], which provides channel-consistent reference TBs under varying oceanic and atmospheric conditions.
The attenuation index P ν at a given frequency ν represents a normalized polarization difference, ranging from 0 to 1, where lower P ν values indicate increasing liquid-cloud opacity, and values approaching 1 suggest cloud-free field of view (FOV). P ν is converted to an emission index ( E ν ) following [27]:
E ν = 100 1 P ν
The scattering index ( S ν ) is modified to a depression index ( D ν ):
D ν = S ν
Larger E ν values correspond to enhanced liquid hydrometeor emission, consistent with the behavior of lower-frequency GMI TBs. More negative values of D ν indicate higher volumes of high-density ice and stronger scattering signatures, consistent with characteristics of higher-frequency GMI TBs.
At 37 GHz, emission typically dominates in most oceanic rainfall regimes, whereas significant scattering-related TB depressions emerge primarily in intense convection with substantial ice aloft (e.g., [37]). Accordingly, 37 GHz is treated primarily as an emission-sensitive channel in our index construction, while representing ice-scattering variability using the 89-GHz depression index D 89 , which is more consistently sensitive to frozen hydrometeors across a broad range of precipitation intensities.

2.3. EOF Analysis Framework

To characterize the coupled variability among the microwave radiative index components, a five-dimensional radiative index vector, I , is constructed for each observed pixel:
I x , t = [ E 10 ,     E 19 ,   E 37 ,   E 89 ,   D 89 ]
where x and t denote the spatial location and time of observation. The components of E 10 ,   E 19 , E 37 , and E 89 represent the emission indices at 10.65, 18.7, 36.5, and 89.0 GHz, respectively, while D 89 denotes the depression index at 89.0 GHz. Although GMI provides 13 channels, these indices are derived from eight core channels (10.65, 18.7, 36.5, and 89.0 GHz in both V and H polarizations). Channels primarily sensitive to atmospheric water vapor (23.8, 166, and 183 GHz) are excluded to focus on precipitation-column structure. The index components are constructed to have comparable dynamic ranges (e.g., scaling E ν to 0–100 and adjusting the sign and magnitude of D 89 ). The global climatological mean vector, I ¯ , is subtracted from each observation to obtain the anomaly vector:
I x , t =   I x , t   I ¯
An EOF analysis is then applied to the covariance matrix of I to identify the dominant covariance modes of coupled variability among the index components [27,28]. Through eigenvalue decomposition, a set of five orthogonal eigenvectors (EOF modes), e i , and their corresponding eigenvalues are obtained. The anomaly vector can be expressed as:
I x , t = i = 1 5 P C i x , t · e i
where P C i x , t is the i th principal component ( P C ) coefficient. These P C coefficients are calculated by projection:
P C i x , t = I x , t · e i
The leading EOF modes define orthogonal axes of the radiative-index space, and the associated principal components ( P C 1 and P C 2 ) provide coordinates for each precipitation pixel.

2.4. Collocation of GMI-DPR and Rain Type Classification

The 2-D P C coefficient fields are collocated with DPR-observed vertical reflectivity structures and rain-type classifications from the DPR Level-2 algorithm [35], as well as microphysical parameters retrieved from the GPROF algorithm. Because the GMI and DPR have different spatial resolutions, DPR reflectivity profiles, rain-type information, and storm-top height within each GMI footprint are aggregated using channel-specific Gaussian antenna gain weights to ensure consistency between radar-derived vertical structure and microwave radiative observations.
From the collocated GPROF Version 9 products, each GMI pixel is assigned rainwater path (RWP), ice water path (IWP), surface precipitation rate, and total column water vapor. Pixels are categorized as convective, stratiform, or mixed based on the gain-weighted DPR rain-type classification. Although mixed-type footprints occur at a relatively high frequency (47.6% of precipitating footprints), their contribution to total precipitation amount is comparatively small (16.5%) [38]; the analysis therefore focuses primarily on the convective and stratiform regimes that dominate accumulated precipitation, with the spatial distributions of P C 1 and P C 2 for mixed-type precipitation presented separately in Appendix A.
The analysis is restricted to precipitating pixels with surface precipitation rates exceeding 0.2 mm h−1, following the GPROF-based threshold adopted in [38]. The collocated vertical reflectivity profiles and storm-top heights are examined within the EOF coordinate space to assess how passive-microwave-derived P C parameters correspond to radar-observed vertical structure and associated microphysical properties.

2.5. AI Usage Statement

Artificial intelligence (AI) tools (Claude Sonnet 5) were used solely for language editing purposes. All scientific content, analysis, and conclusions are the author’s own.

3. Results

The following sections present the physical interpretation of the leading EOF modes and their global spatial distributions over the oceans during hemispheric summer. The EOF-derived P C coordinates are examined in relation to collocated DPR reflectivity profiles and independent microphysical parameters to establish the structural framework.

3.1. Physical Interpretation of EOF Modes

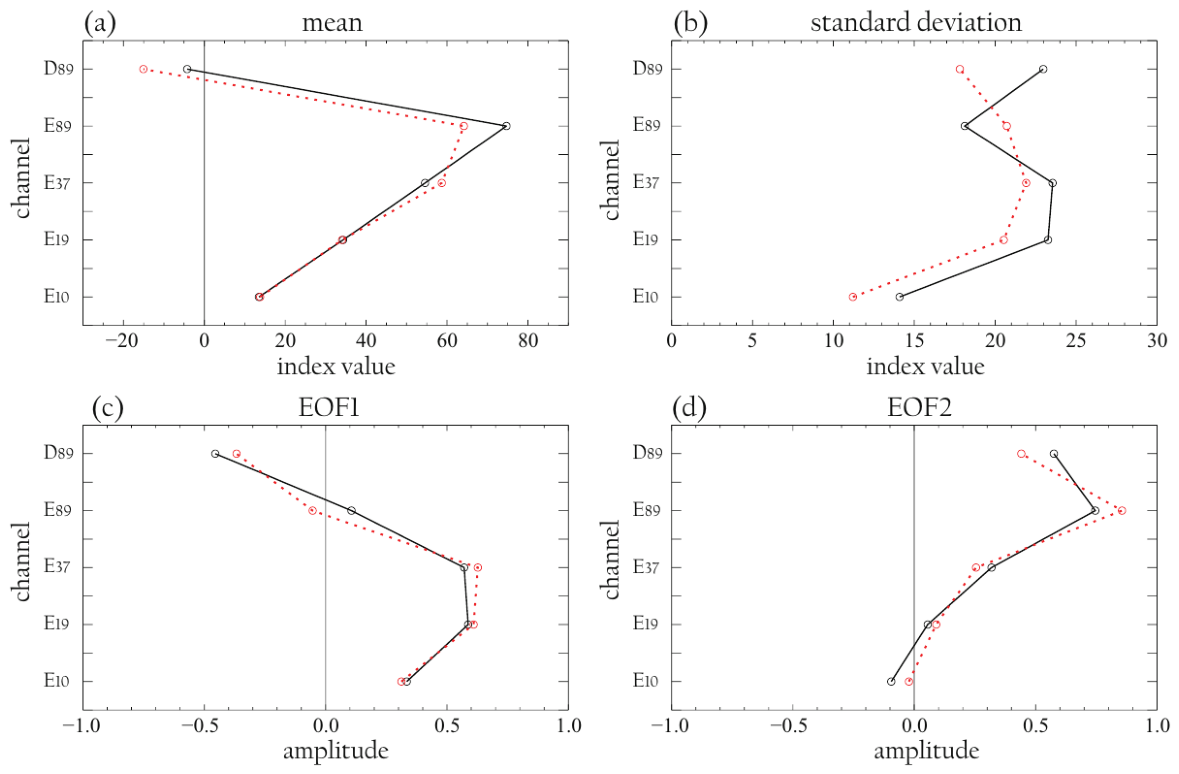
The physical interpretation of the EOF analysis is established through the climatological mean state and the leading eigenvectors. Figure 2a and Figure 2b illustrate the mean radiative baseline and the variance structure of the dominant modes, respectively. The first two EOF modes explain over 92% of the total multi-channel TB variance for both convective (70.4% and 21.6%) and stratiform (61.5% and 30.7%) precipitation types. These eigenvector shapes and explained variances are highly consistent when computed separately for each of the five analyzed years (2020–2024), closely matching the five-year mean shown here. This high explained variance supports representing the five-dimensional radiative-index vector ( I ) within a two-dimensional EOF space. The higher-order modes (EOF3–EOF5) exhibit complex loading patterns that are difficult to map to a coherent physical mechanism. These modes are therefore not further interpreted.
As shown in Figure 2c, EOF1 exhibits positive loadings for both the emission indices ( E ν ) and the depression index ( D 89 ), indicating concurrent increases in both liquid emission and ice scattering signatures. A positive P C 1 therefore represents concurrent increases in RWP and IWP. This structure is consistent for both convective and stratiform regimes. Increasing P C 1 corresponds to greater total hydrometeor mass and stronger surface precipitation rates. Conversely, negative P C 1 values characterize weakly loaded systems with reduced total hydrometeor content.
The second mode, EOF2, modulates the vertical liquid–ice partitioning within the column (Figure 2d). A positive P C 2 enhances lower-level liquid emission relative to upper-level ice scattering, whereas negative P C 2 emphasizes the influence of ice-scattering signatures aloft. Table 1 summarizes the structural regimes associated with the sign of each P C , and together P C 1 and P C 2 define a physically interpretable coordinate framework.

3.2. Characteristics of Vertical Reflectivity Profiles Across the PC Grid

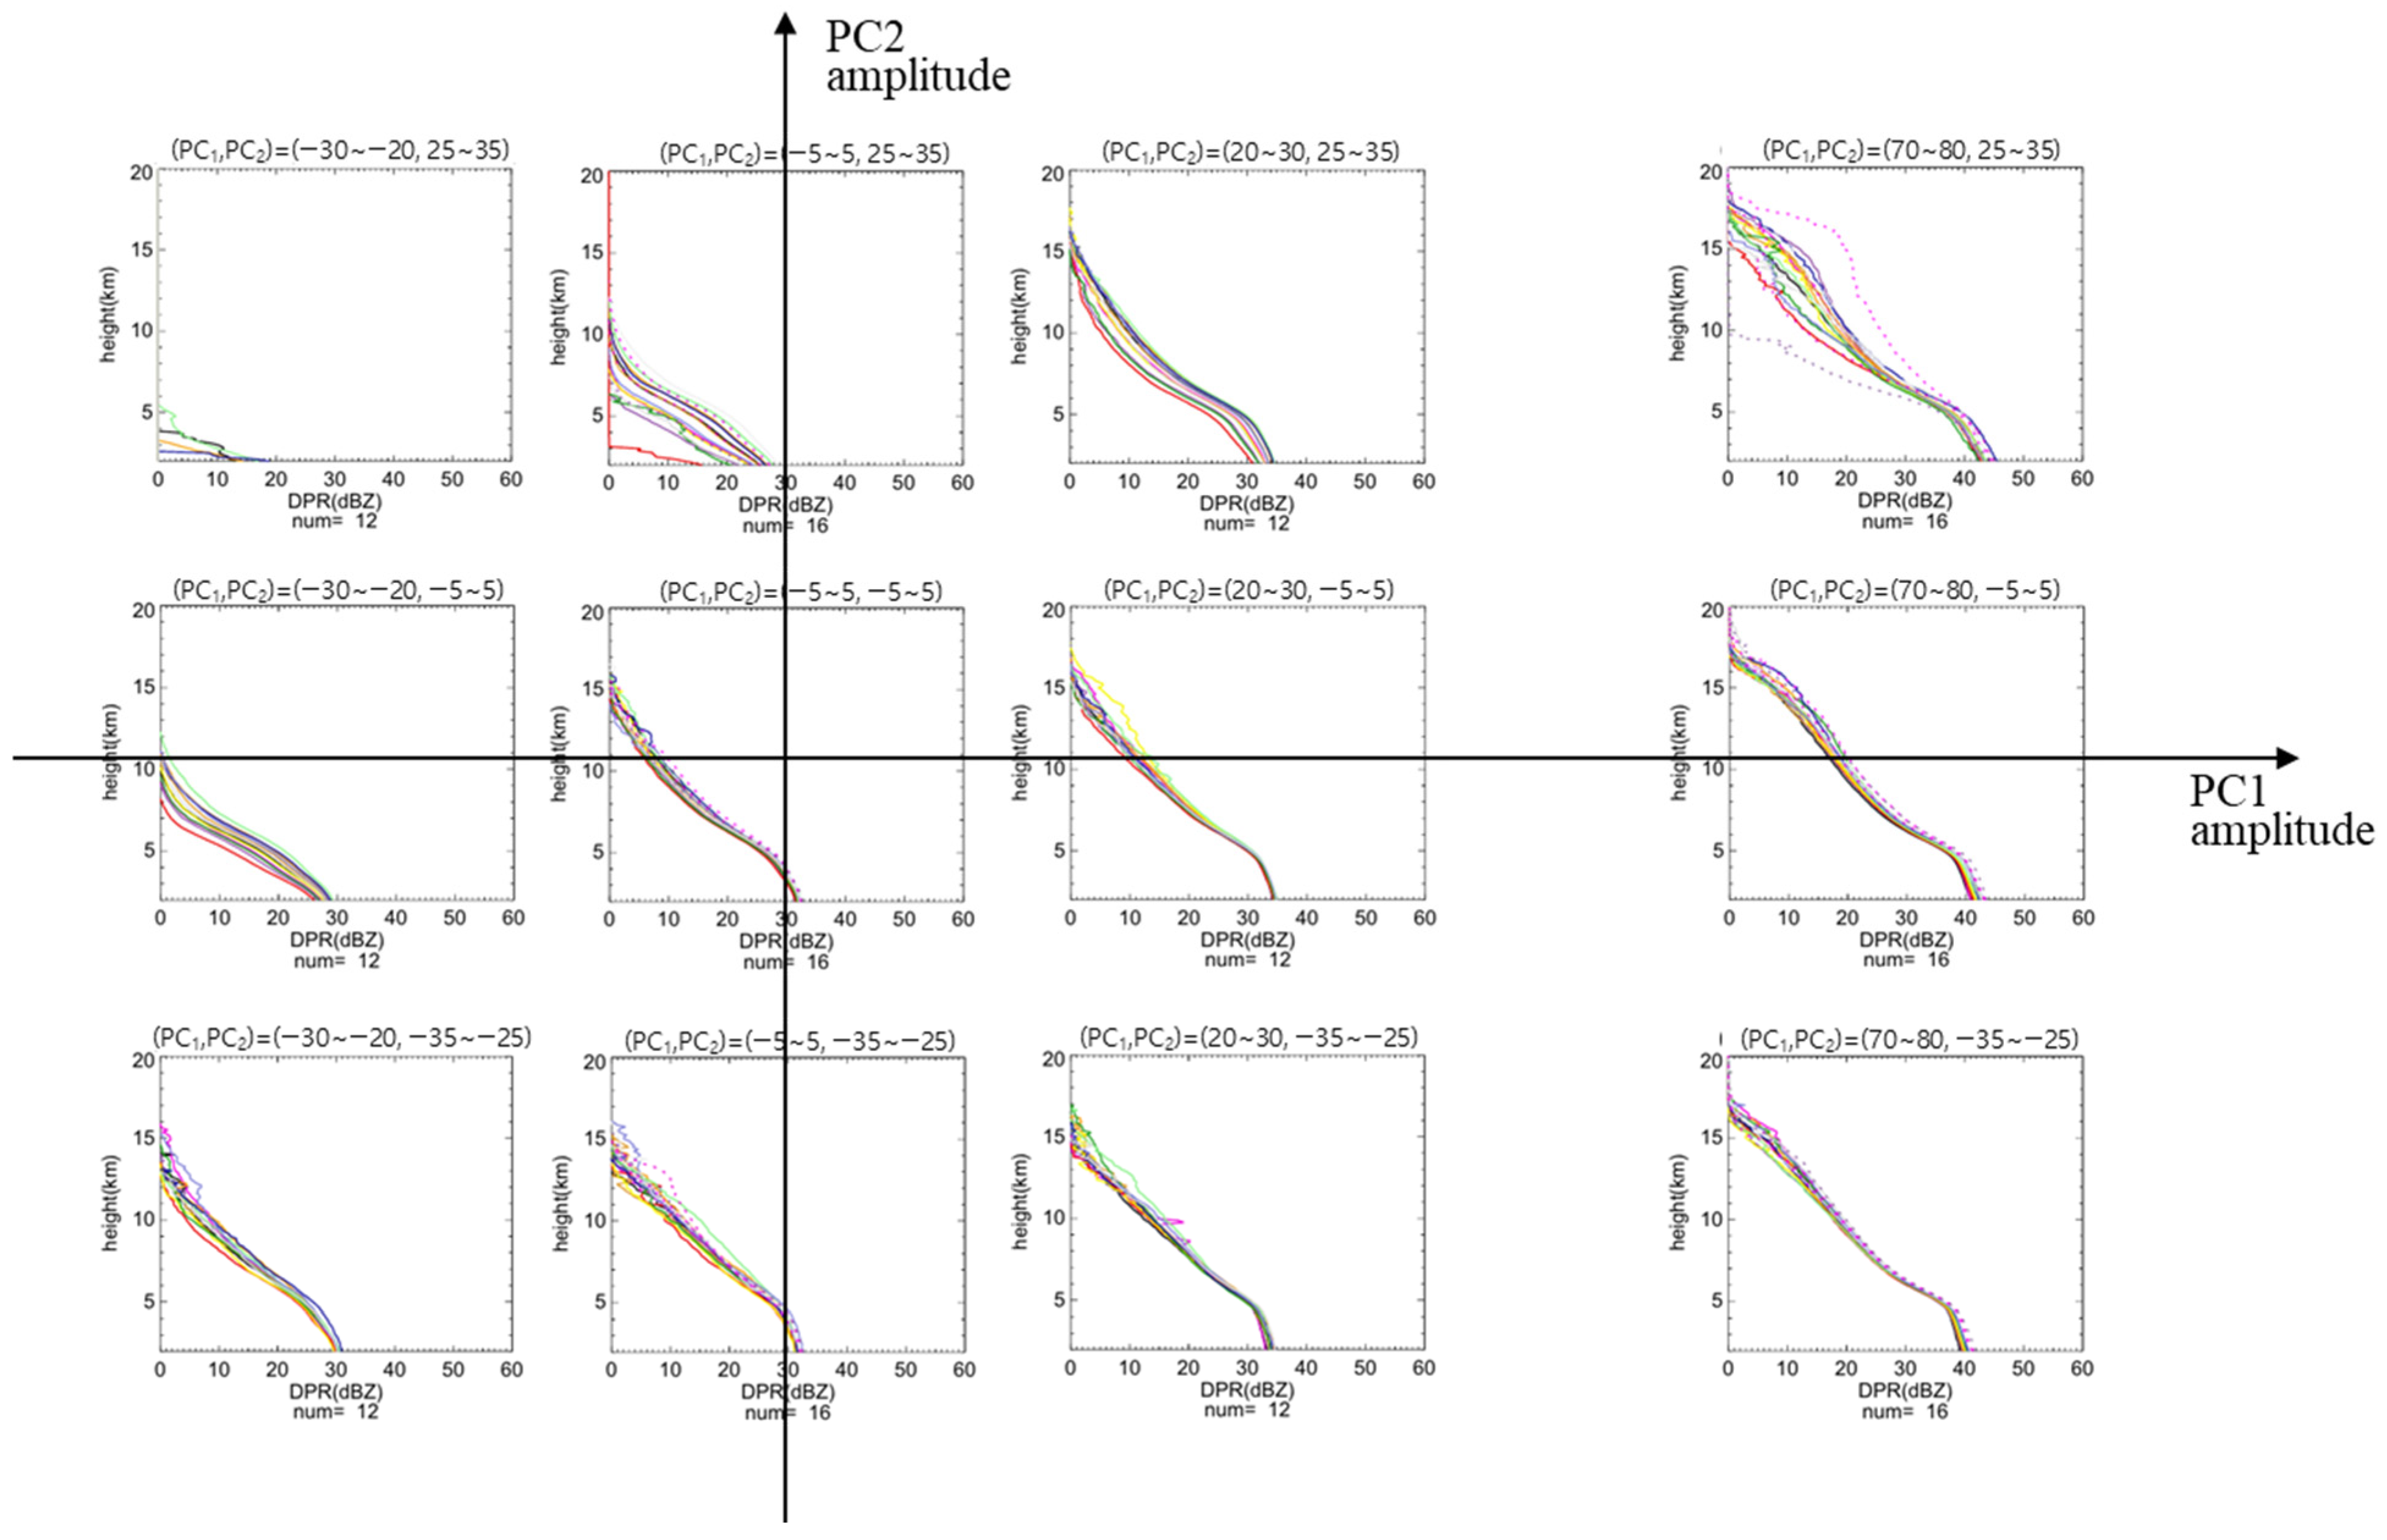
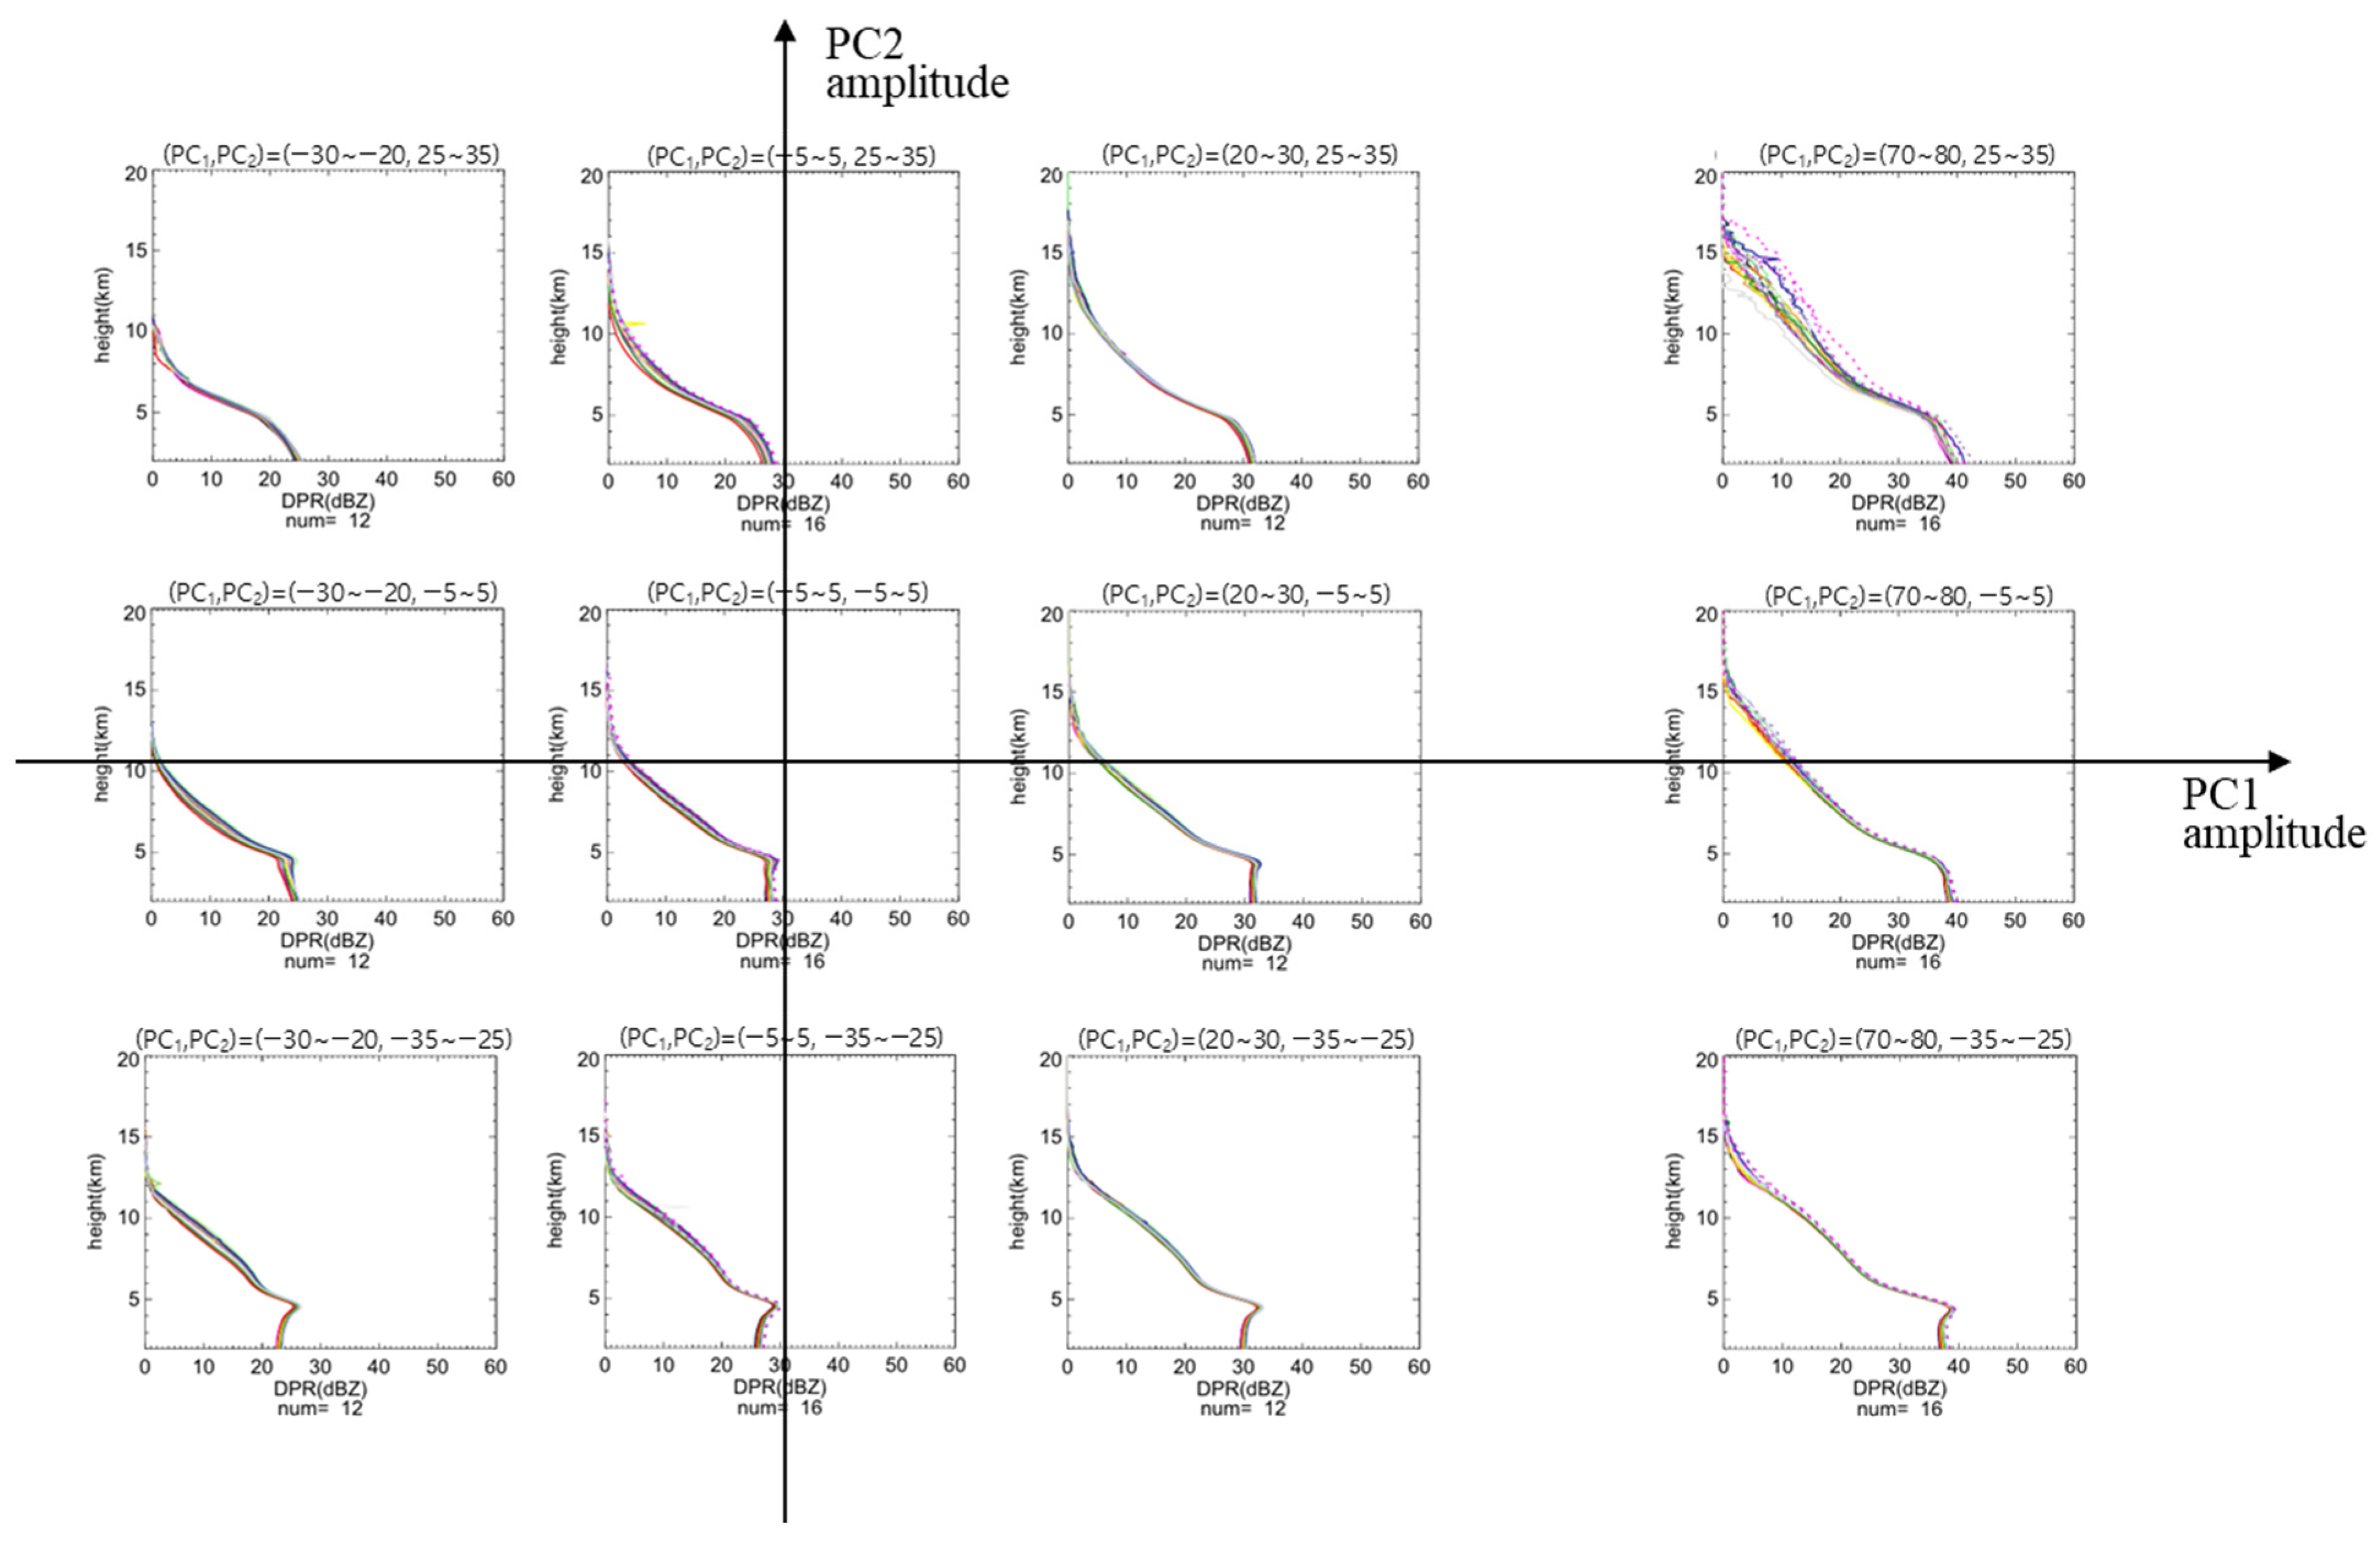
Collocated DPR reflectivity profiles are examined across the P C 1 P C 2 grid (Figure 2 and Figure 3). These figures present composite vertical reflectivity structures over selected intervals of P C 1 (−30 to −20, −5 to 5, 20 to 30, and 70 to 80) and P C 2 (25 to 35, −5 to 5, and −35 to −25), forming a 3 × 4 matrix.

3.2.1. Convective Precipitation Profiles

Reflectivity increases systematically with increasing P C 1 across the convective P C grid (Figure 3), indicating progressive intensification of both liquid and ice hydrometeors. In the strongly negative P C 1 regime (−30 to −20), vertical reflectivity structures vary depending on the sign of P C 2 . Positive P C 2 corresponds to shallow, liquid-dominated profiles in convectively suppressed open-ocean environments. These profiles resemble isolated warm-rain cells or shallow convection with enhanced lower-level reflectivity, structurally similar to the shallow, warm-rain-dominated systems characteristic of the eastern Pacific ITCZ [39]. In contrast, negative P C 2 enhances reflectivity above the freezing level at comparable P C 1 values, indicating relatively stronger ice development aloft and deeper vertical growth. This modulation by P C 2 is evident across most of the P C 1 range; at the highest P C 1 values, however, reflectivity profiles for positive and negative P C 2 become more similar to one another.
As P C 1 increases to moderate positive values (20 to 30), reflectivity strengthens throughout the column and vertical extent expands to as much as ~15 km, identifying well-developed convective cells with vigorous vertical transport. At the strong positive extreme (70 to 80), reflectivity exceeds 40 dBZ across much of the column, representing intense convective cores with substantial liquid loading below and strong ice scattering aloft.
Reflectivity increases sharply below the melting layer (~5 km altitude) in the highest P C 1 intervals, consistent with efficient collision–coalescence growth and associated with extreme surface rainfall intensity [40,41]. Thus, P C 1 controls bulk reflectivity magnitude, while P C 2 governs its vertical redistribution.

3.2.2. Stratiform Precipitation Profiles

Stratiform reflectivity structures (Figure 4) exhibit a similar progression across the P C grid. Reflectivity increases systematically throughout the column as P C 1 transitions from negative to strongly positive values. In the weak-loading regime (−30 to −20 in P C 1 ), reflectivity remains modest but vertically coherent, with a discernible bright-band signature. P C 2 modulates the relative vertical distribution between the upper-level ice-bearing layer and the lower-tropospheric liquid-dominated region, including the melting layer and rain below. At comparable P C 1 values, negative P C 2 is associated with stronger reflectivity above the melting level and a more distinct bright band, whereas positive P C 2 corresponds to enhanced lower-level reflectivity and a less pronounced upper-level ice signature. At the highest P C 1 values, however, reflectivity profiles for positive and negative P C 2 become more similar to one another, consistent with the convective case.
As P C 1 increases to moderate and strong positive values (20–30 and 70–80), total hydrometeor loading intensifies and the vertical extent of stratiform precipitation expands, with the bright-band structure becoming increasingly pronounced. The central region of the P C plane (−5 to 5 in P C 1 ; −5 to 5 in P C 2 ) represents the global mean stratiform state.

3.3. Global Precipitation Characteristics in EOF Space

Spatial variations in P C 1 and P C 2 are examined over the global oceans during hemispheric summer and compared with independent parameters: GMI-derived rain rate, RWP, IWP, and the Ice-to-Rain Path Ratio (IRPR), and DPR-derived storm height.

3.3.1. Convective Precipitation

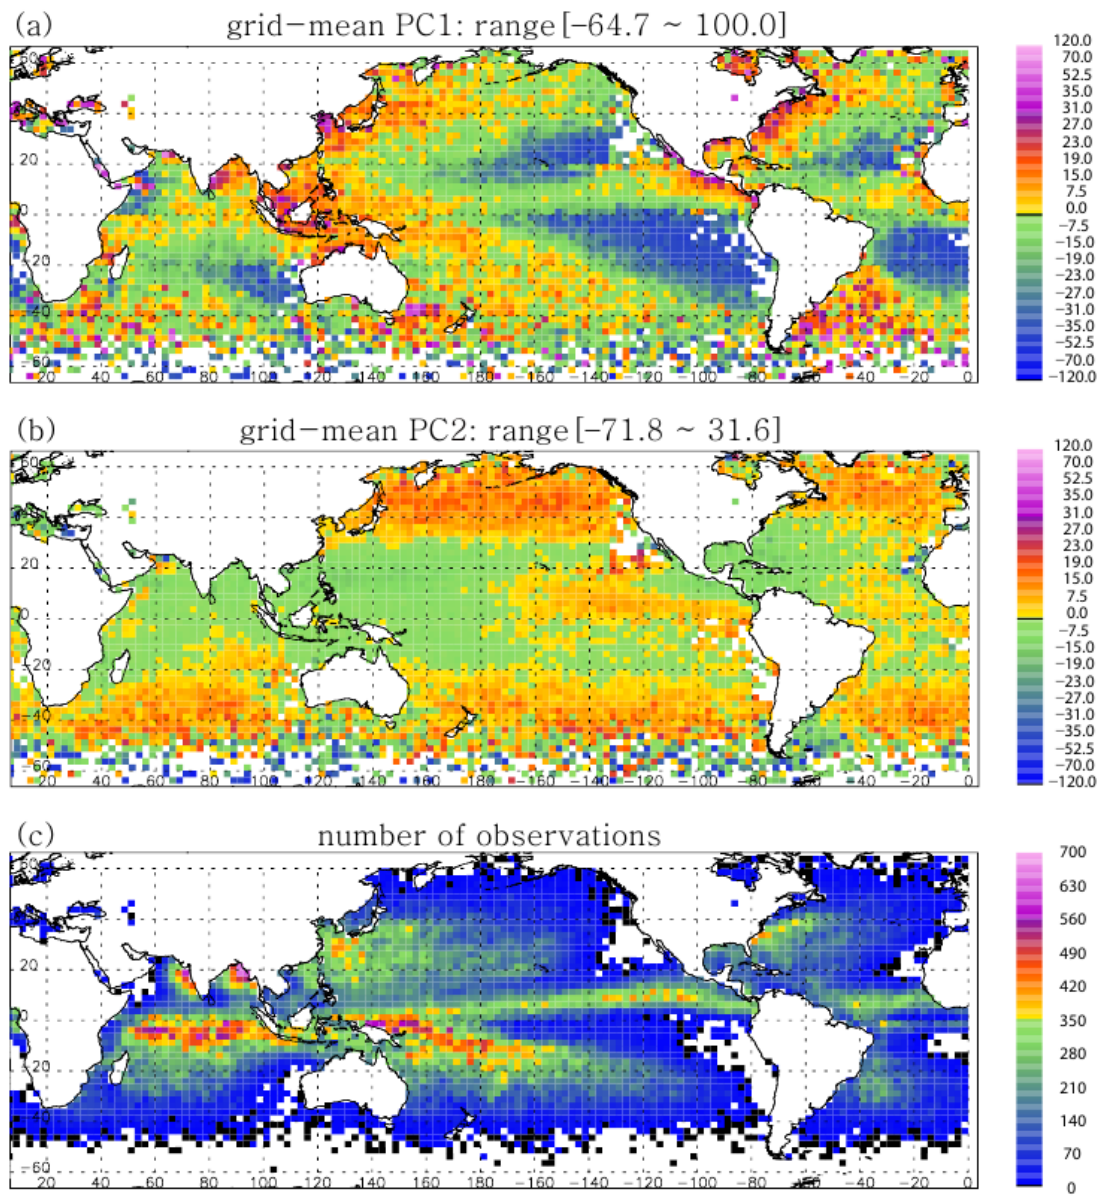
The global distribution of convective precipitation in the P C 1 P C 2 framework reveals coherent regional patterns across major oceanic basins (Figure 5). Strong positive P C 1 values are concentrated in the Western Pacific Warm Pool, the Asian monsoon sectors (including the Bay of Bengal and the vicinity of the Korean Peninsula), the eastern Pacific near Central America, and along portions of the east coasts of North and South America.
A pronounced zonal contrast emerges along the ITCZ. The western segment, adjacent to the Warm Pool, exhibits strong positive P C 1 values. Moving eastward into the central open-ocean ITCZ, P C 1 decreases markedly and frequently becomes weakly positive or negative. Farther east, near the American coast, P C 1 increases again to large positive values. This west–central–east progression highlights substantial longitudinal variability within the same large-scale convergence belt. In contrast to the ITCZ, the SPCZ displays a mixture of weak-to-moderately positive and negative P C 1 values rather than a uniformly strong positive signal.
On a broader scale, P C 2 values are predominantly negative across low latitudes (excluding subtropical high-pressure zones) and become mostly positive in mid-to-high latitudes. Variations in P C 2 within high- P C 1 regions further differentiate internal vertical structure. The Western Pacific Warm Pool tends to exhibit weak-to-moderately negative P C 2 values, with enhanced upper-level ice development. In contrast, the East Asian monsoon region (including the vicinity of the Korean Peninsula) shows comparatively positive P C 2 , reflecting relatively stronger lower-level liquid contributions. Regional studies of Korean summer monsoon heavy rainfall have documented convective structures in which precipitation intensity is substantially influenced by enhanced lower-tropospheric hydrometeor growth [42].
Subtropical high-pressure regions, including the Pacific and Bermuda Highs, are characterized by strong negative P C 1 and a weak but statistically significant positive P C 2 tendency. Convection in these regions remains shallow and weakly organized, consistent with subsidence-dominated conditions. The normalized count distribution (Figure 5c) shows that regions of enhanced P C 1 also exhibit elevated convective occurrence.
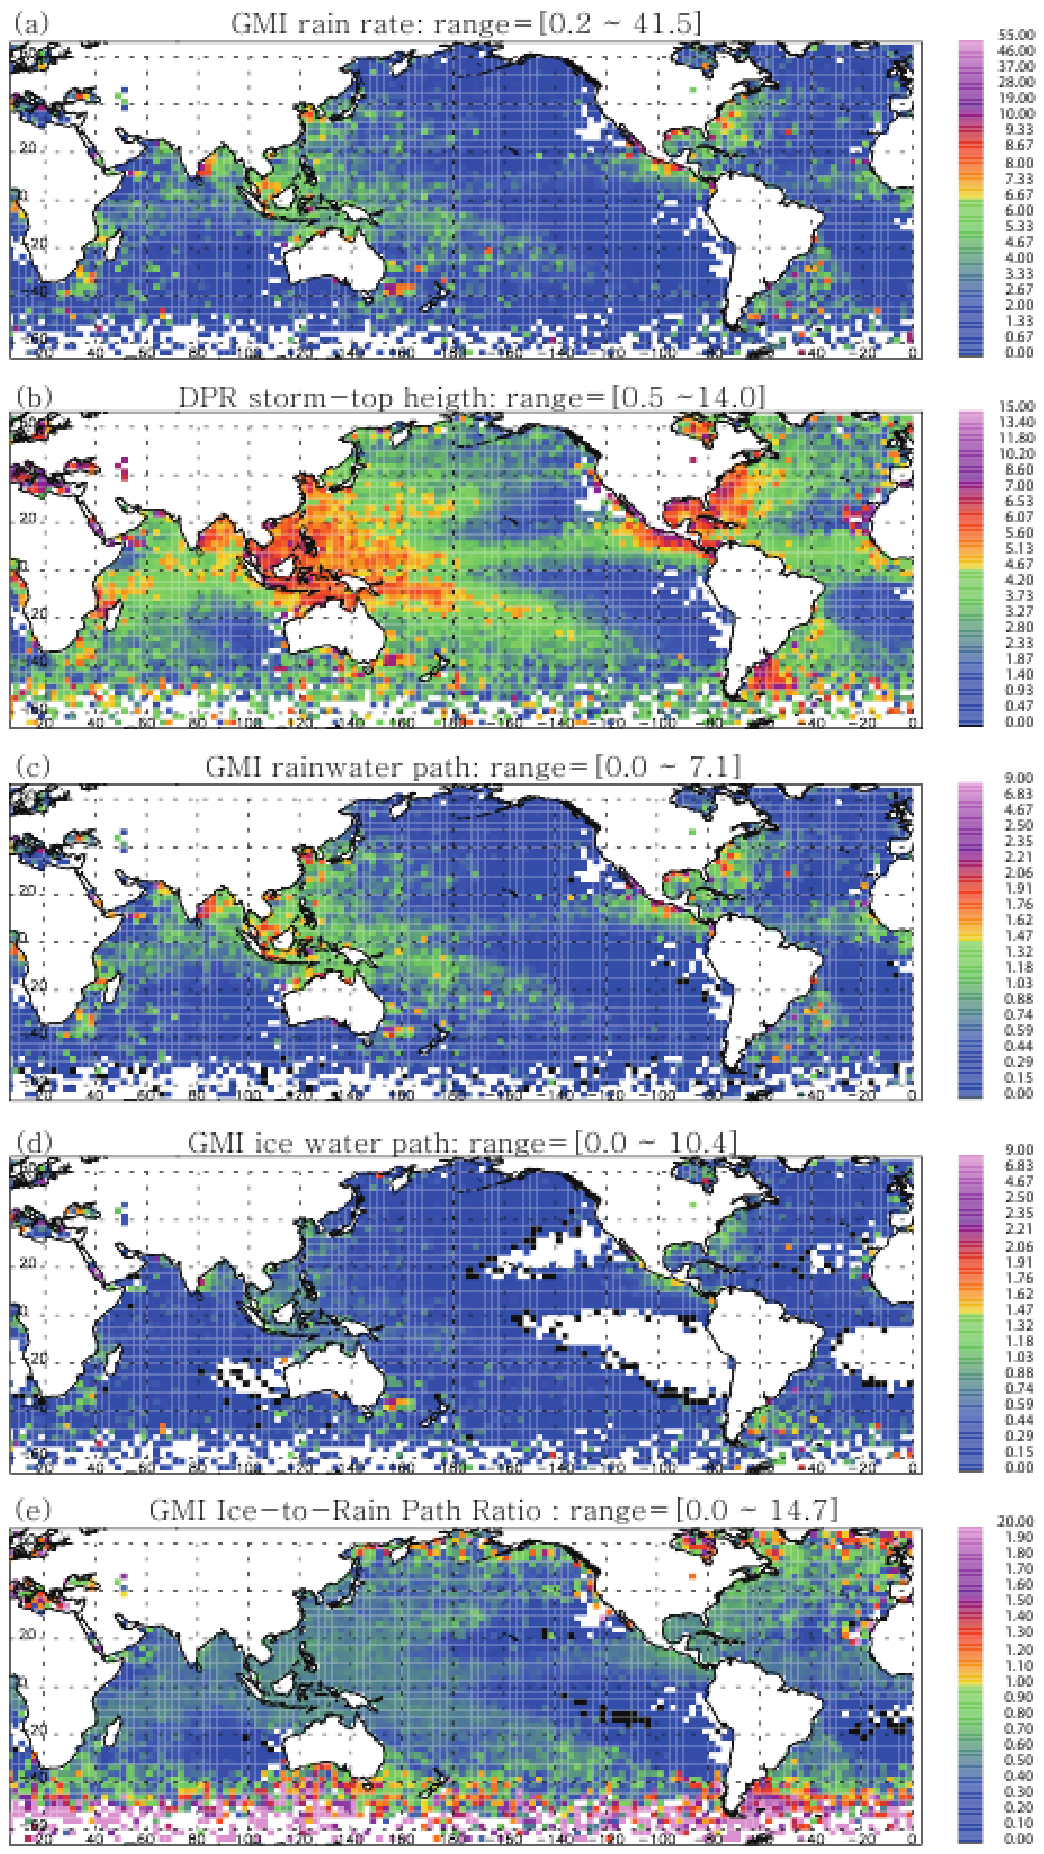
Figure 6 compares the P C distributions with precipitation parameters derived from DPR (surface rain rate and storm-top height) and GMI (Total Precipitable Water (TPW), RWP, and IWP). Regions of high P C 1 coincide with enhanced surface rain rate, TPW, RWP, IWP, and greater storm heights, confirming that the radiatively derived bulk-loading axis is physically manifested in observed precipitation properties.
The IRPR further clarifies the structural role of P C 2 . For a given P C 1 magnitude, variations in P C 2 correspond systematically to changes in the relative ice-to-liquid partitioning within the column. Unlike storm-top height above, which is retrieved from an independent radar instrument (DPR), IRPR is a retrieval output from GPROF. The storm-top height relationship therefore provides the more independent confirmation of this vertical structure. Regions characterized by more negative P C 2 exhibit enhanced IRPR, consistent with stronger upper-level reflectivity signatures in Figure 2. Conversely, positive P C 2 corresponds to reduced IRPR and enhanced lower-level reflectivity. Across most regions, IRPR values range between approximately 0.3 and 1.1 with tropical convective systems typically near 0.7.
At higher latitudes (~50–60° S), regions characterized by negative P C 1 and negative P C 2 values tend to be associated with weaker rain rates and reduced storm heights, consistent with vertically limited precipitation systems. IRPR values also appear elevated in these regions, tentatively suggesting a disproportionate reduction in RWP relative to IWP under colder thermodynamic environments that favor ice-phase hydrometeors.

3.3.2. Stratiform Precipitation

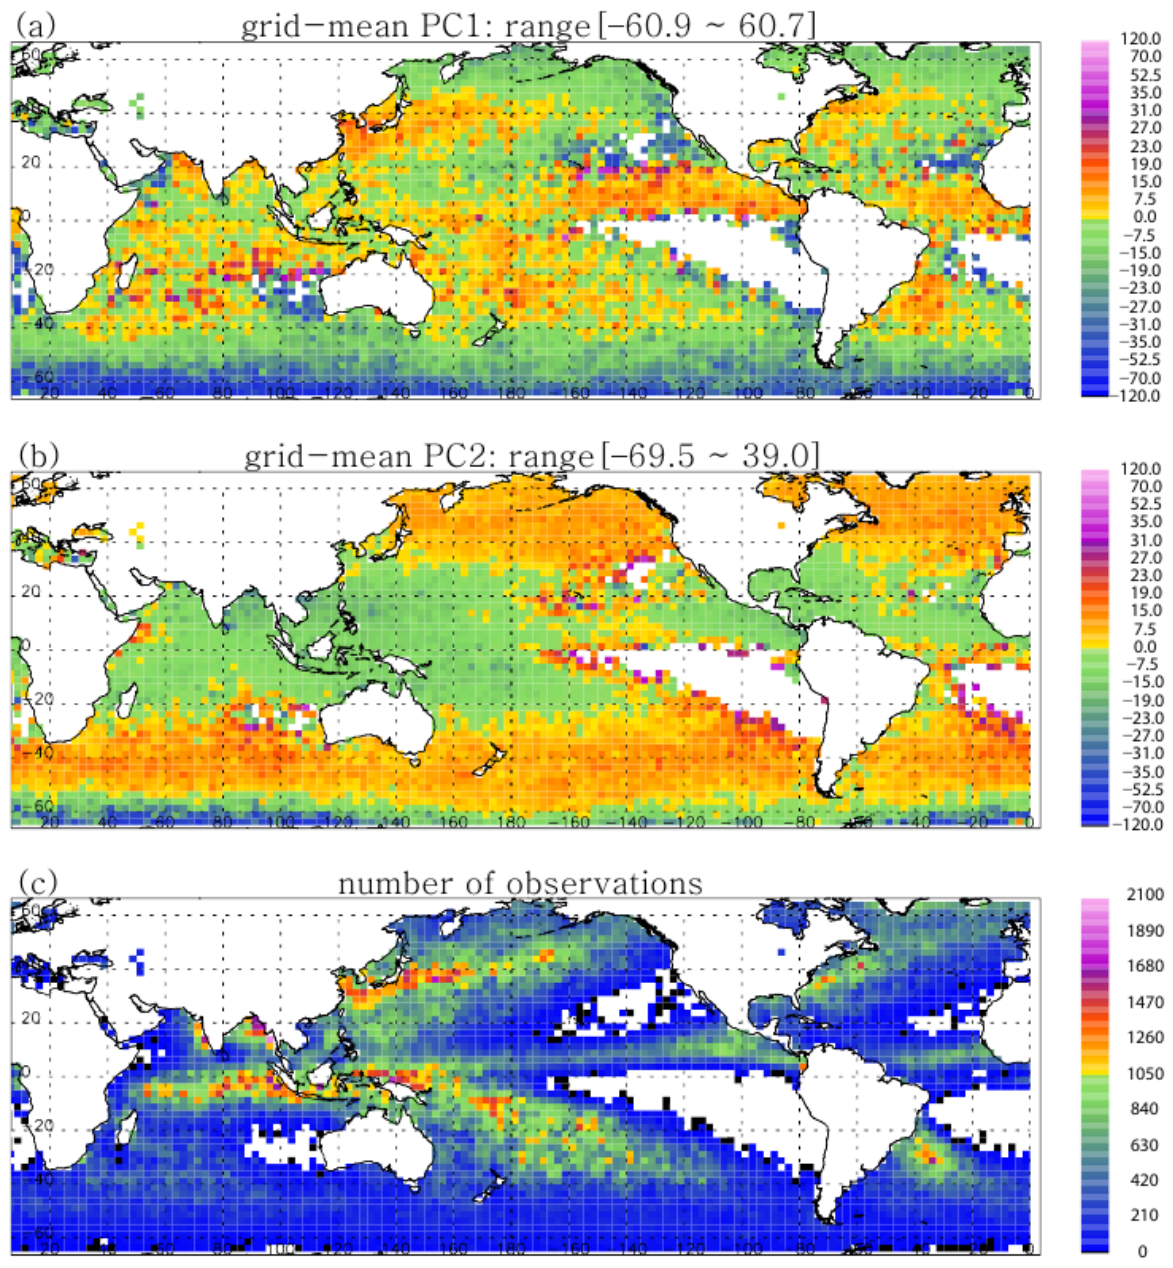
The first EOF mode explains 61.5% of the stratiform variance, less than that for convective precipitation (~70%), reflecting greater structural diversity within stratiform systems. The global distribution of P C 1 shows that stratiform precipitation is largely absent over subtropical high-pressure regions, where persistent subsidence suppresses precipitation and limits vertical cloud development [43,44] (Figure 7). In contrast, pronounced positive P C 1 values occur within tropical convergence zones, where mesoscale convective systems generate extensive trailing stratiform regions as convective cores mature and decay [7,45].
Poleward of the tropics, similarly elevated P C 1 values appear along mid-latitude storm-track belts. Stratiform precipitation is commonly embedded within midlatitude cyclones, where broad stratiform shields and rainbands dominate during the mature and decaying stages of system evolution [46]. In the Southern Hemisphere mid-latitudes, elevated P C 1 extends across a wide zonal sector, reflecting the spatial continuity of storm-track activity over the largely oceanic domain [47]. The normalized count distribution (Figure 7c) further indicates that regions of elevated P C 1 correspond to climatologically frequent stratiform occurrence.
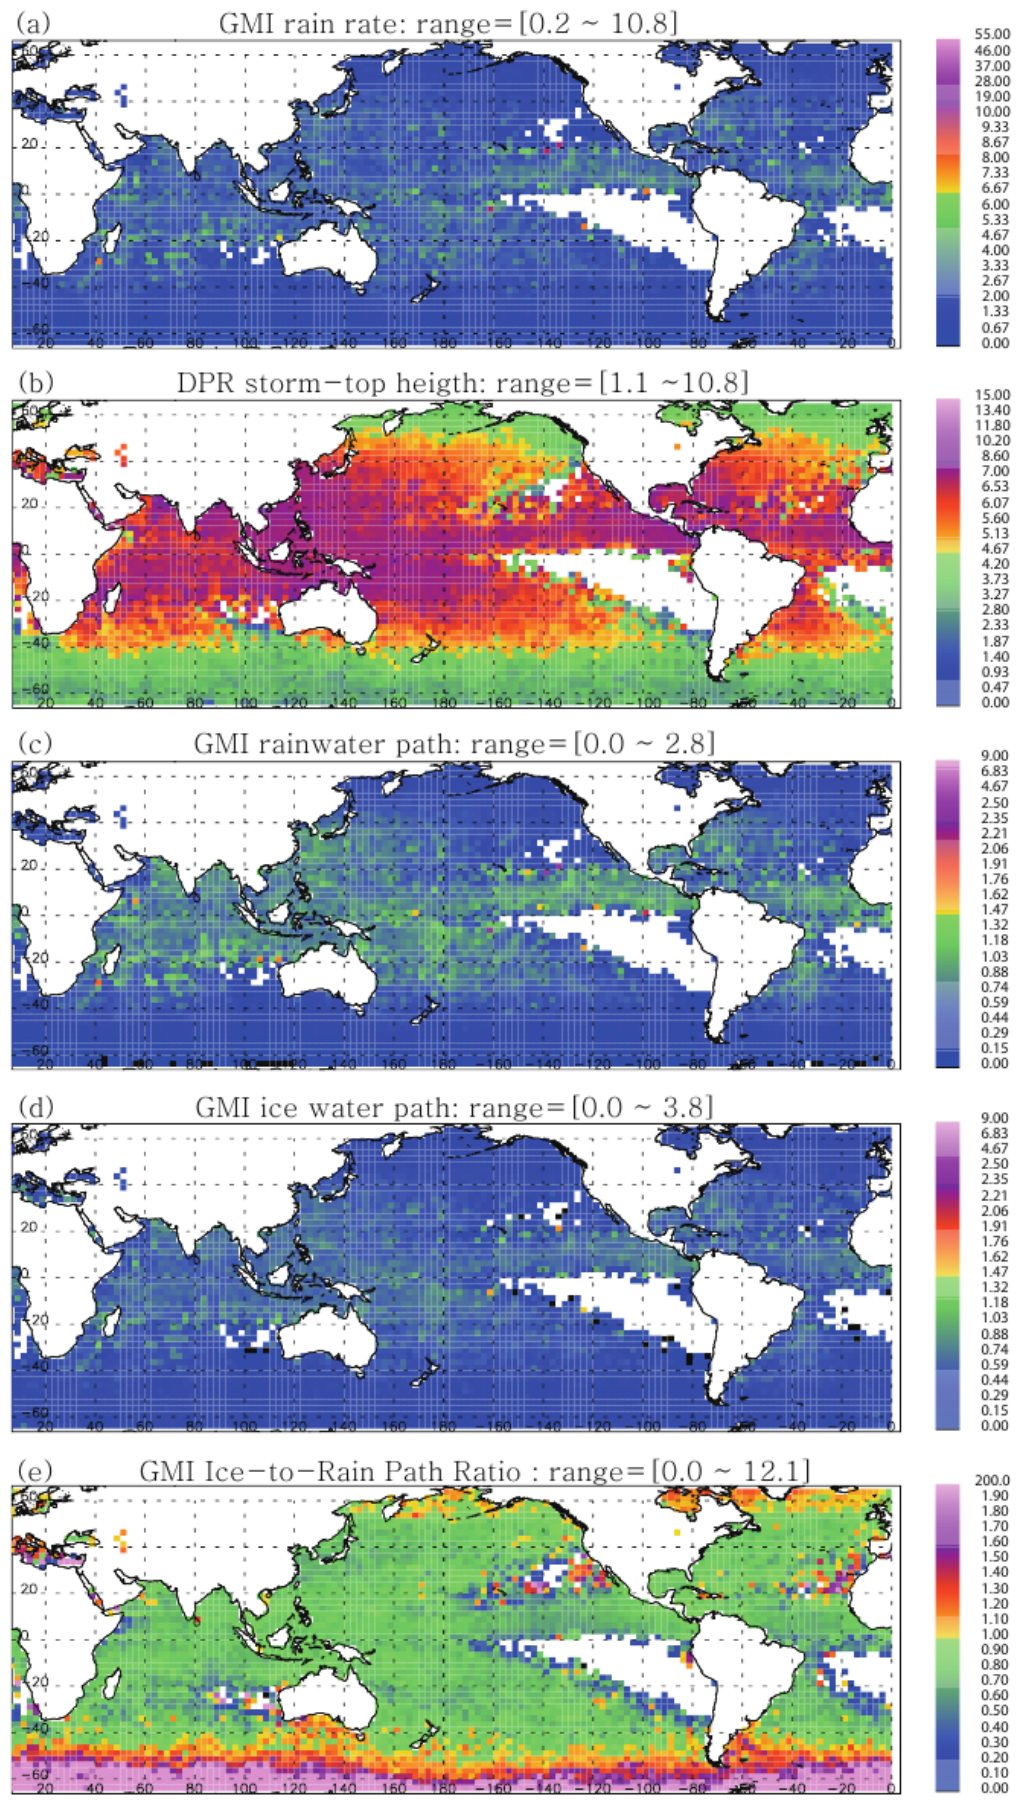
P C 2 shows a quasi-dipole structure, with negative values dominating low latitudes and positive values prevailing in mid-to-high latitudes (Figure 7b). In tropical regions, negative P C 2 corresponds to relatively enhanced upper-level ice reflectivity within deep stratiform clouds. Elevated storm-top heights and higher freezing levels support vertically extended ice-bearing layers (Figure 8).
Toward mid-and-high latitudes, positive P C 2 becomes increasingly prevalent. As storm-top heights decrease and freezing levels lower during hemispheric summer (Figure 8), the vertical extent of the ice-bearing layer becomes shallower, indicating thermodynamic control on vertical phase partitioning.
The IRPR distribution further clarifies this phase structure. Across most regions, IRPR values range between approximately 0.6 and 1.0, indicating broadly comparable contributions of ice and rainwater mass within the column—a narrower range than found for convective precipitation (0.3–1.1), consistent with the coexistence of liquid and ice hydrometeors that structurally define stratiform precipitation. Reduced IRPR values (below ~0.5) are primarily confined to narrow belts surrounding subtropical high-pressure systems. In these regions, negative P C 1 and positive P C 2 coincide with weak hydrometeor loading and relatively greater lower-level liquid contribution, yielding RWP exceeding IWP. In contrast, localized IRPR values exceeding unity in high southern latitudes appear mainly associated with reduced rainwater mass rather than anomalously large ice loading, tentatively consistent with colder thermodynamic environments that favor ice-phase hydrometeors. In this high-latitude band, P C 1 indicates strongly reduced overall hydrometeor loading, while P C 2 tends toward negative values, broadly mirroring the convective-type behavior.

4. Discussion

As demonstrated in Section 3, the leading EOF modes of GPM GMI brightness temperatures capture physically interpretable dimensions of precipitation structure, validated against independent DPR-observed vertical reflectivity profiles. Here, the broader implications of these findings are briefly discussed.
P C 1 represents bulk hydrometeor loading, reflecting a positive covariance between liquid and ice hydrometeor contents throughout the column, and successfully captures the global distribution of precipitation intensity across diverse climate regimes—from tropical convergence zones and monsoon sectors to mid-latitude storm tracks. P C 2 accounts for the residual variability in vertical precipitation structure not explained by P C 1 alone, partially capturing the predominant contrasting phase partitioning between liquid and ice contributions through a negative covariance. This second mode encodes the meridional contrast in microphysical structure, reflecting the transition from ice-enhanced precipitation systems in the tropics to liquid-dominated systems in the midlatitudes, with an increasing ice-phase contribution at the highest southern latitudes. In the tropics, deep updrafts transport hydrometeors well above the freezing level, sustaining a thick ice-bearing layer. In contrast, the estimated climatological freezing level poleward of ~40° lies near ~3 km during hemispheric summer, based on typical sea-surface temperatures and a standard tropospheric lapse rate. Given that storm-top heights in this latitude band are predominantly near ~4 km (Figure 5 and Figure 7), the layer available for ice-phase growth above the freezing level remains thin, so that the relative contribution of RWP is well reflected in the positive P C 2 values found in this region. This compact two-dimensional framework, defined by P C 1 and P C 2 as orthogonal axes, provides a powerful tool for characterizing three-dimensional precipitation structure at global scales. Bulk hydrometeor loading and the relative vertical partitioning of ice and liquid hydrometeors together govern the magnitude and vertical distribution of latent heat release—upper-tropospheric deposition and riming versus lower-tropospheric condensation. The P C 1 P C 2 structure identified here offers an observational proxy for the vertical distribution of diabatic heating, a key forcing term for atmospheric circulation.
The EOF-based approach offers significant advantages for validating cloud microphysics parameterizations in global and regional climate models. The vertical distribution of hydrometeors—critical for radiative forcing—has been difficult to evaluate due to sparse observational constraints. This potential is supported by prior evidence that different microphysical parameterization schemes produce systematically different TB–hydrometeor structure relationships, with the resulting uncertainty exceeding the inherent natural variability in these relationships [48]. By mapping observed precipitation systems onto the P C 1 P C 2 phase space, this framework establishes an observational benchmark against which model-simulated precipitation structure could be compared. For example, model-generated hydrometeor databases could be adapted toward satellite-observed brightness temperature characteristics using microwave radiative transfer models, potentially enabling efficient diagnosis of systematic biases in microphysical schemes. This framework can also inform the development of passive microwave precipitation retrieval algorithms, providing a physically interpretable structural reference for microphysical variability. This is consistent with broader community efforts toward standardized observational benchmarks for precipitation algorithms (e.g., [49]).
This study characterizes precipitation structure at the ~15 km scale of the GMI footprint during hemispheric summer over the global oceans. Future work should extend this framework to other seasons to more fully characterize the global precipitation structure.

5. Conclusions

This study extends a PCT-based EOF diagnostic framework to global oceanic precipitation using GPM GMI measurements. The resulting P C coordinate space summarizes systematic variations in vertical precipitation structure across diverse precipitation regimes, providing structural information beyond what surface rain rates alone can offer.
P C 1 represents bulk hydrometeor loading and organizes the global distribution of precipitation intensity in both convective and stratiform regimes. Regions with elevated P C 1 values are concentrated in tropical convergence zones, monsoon sectors, and mid-latitude storm tracks, whereas subtropical subsidence zones are characterized by predominantly negative P C 1 values. Rain rate, RWP, IWP, and storm-top height all increase systematically with P C 1 , confirming that the radiatively derived loading axis corresponds to observed variations in precipitation depth and intensity.
P C 2 modulates vertical phase structure within this loading framework, for a given P C 1 magnitude. Negative P C 2 values are common across tropical and monsoon regimes, excluding subtropical high-pressure belts, and are associated with enhanced upper-level ice contributions and moderately elevated Ice-to-Rain Path Ratio (IRPR; ~0.7). Positive values dominate many mid-latitude storm-track regions, where lower freezing levels and shallower storm structures—compared to the tropics—favor stronger lower-level liquid contributions. This systematic meridional transition in the sign of P C 2 is evident across both convective and stratiform precipitation types, with broadly comparable IRPR values maintained across this gradient. In contrast, at the highest southern latitudes (~50–60° S), P C 1 indicates strongly reduced overall hydrometeor loading, while P C 2 tends toward negative values for both convective and stratiform precipitation. In this cold regime, RWP continues to decline toward higher latitudes, while IWP remains relatively maintained, suggesting that the limited hydrometeor mass present is preferentially ice-phase. This pattern, observed consistently across both precipitation types, is suggestive of a thermodynamic influence in high-latitude environments. This study is limited to oceanic precipitation during hemispheric summer, and the identified structural patterns should be interpreted within this scope.
The PCT-based EOF space provides a statistical, low-dimensional representation that links the P C 1 P C 2 coordinate space of microwave radiative signatures to the dominant modes of three-dimensional precipitation structure. This framework provides an observation-based reference for evaluating microphysical representations in numerical models and structural consistency in satellite retrieval algorithms such as GPROF.

Funding

This research received no external funding.

Institutional Review Board Statement

Not applicable.

Informed Consent Statement

Not applicable.

Data Availability Statement

The datasets analyzed during the current study are available from the NASA Global Precipitation Measurement mission data archive (https://gpm.nasa.gov/data (accessed on 30 June 2025)).

Conflicts of Interest

The author declares no conflicts of interest.

Abbreviations

The following abbreviations are used in this manuscript:
DPRDual-frequency Precipitation Radar
EOFEmpirical Orthogonal Function
FOVField of View
GMIGPM Microwave Imager
GPMGlobal Precipitation Measurement
GPROFGoddard Profiling Algorithm
IRPRIce-to-Rain Path Ratio
ITCZIntertropical Convergence Zone
IWPIce Water Path
PCPrincipal Component
PCTPolarization Corrected Temperature
RWPRainwater Path
SPCZSouth Pacific Convergence Zone
TBBrightness Temperature
TMITRMM Microwave Imager
TRMMTropical Rainfall Measuring Mission

Appendix A

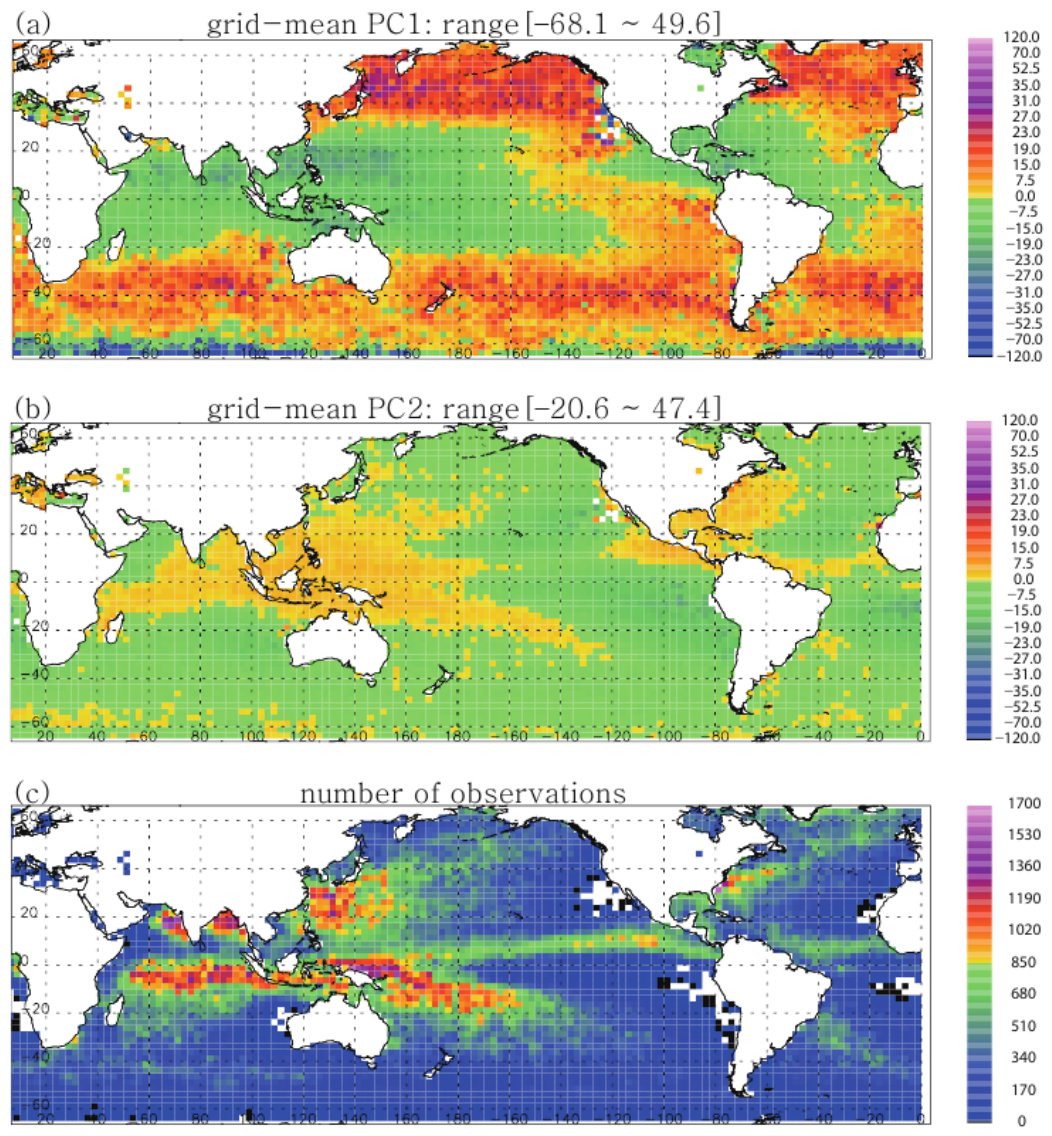
Mixed precipitation is defined at the GMI-footprint scale using gain-weighted DPR precipitation-type information (Section 2.4), representing footprints that contain both convective and stratiform subfootprint structures. Figure A1 presents the spatial distributions of grid-mean P C 1 and P C 2 for mixed-type precipitation, along with the number of observations. The sampling and gridding procedures are identical to those used in the main analysis. Mixed-type observations are most prevalent in tropical convergence zones and warm-pool/monsoon regions, where convective cores and stratiform anvil structures frequently coexist within a single radiometer footprint.
Figure A1. Spatial distributions of (a) grid-mean P C 1 , (b) grid-mean P C 2 , and (c) number of observations for mixed precipitation.
Atmosphere 17 00901 g0a1

References

  1. Peixoto, J.P.; Oort, A.H. Physics of Climate; American Institute of Physics: New York, NY, USA, 1992. [Google Scholar]
  2. Hou, A.Y.; Kakar, R.K.; Neeck, S.; Azarbarzin, A.A.; Kummerow, C.D.; Kojima, M.; Oki, R.; Nakamura, K.; Iguchi, T. The global precipitation measurement mission. Bull. Amer. Meteorol. Soc. 2014, 95, 701–722. [Google Scholar] [CrossRef] [Scilit]
  3. Stephens, G.L.; Webster, P.J. Clouds and climate: Sensitivity of simple systems. J. Atmos. Sci. 1981, 38, 235–247. [Google Scholar] [CrossRef] [Scilit]
  4. Tao, W.-K.; Lang, S.; Simpson, J.; Adler, R. Retrieval algorithms for estimating the vertical profiles of latent heat release: Their applications for TRMM. J. Meteorol. Soc. Jpn. 1993, 71, 685–700. [Google Scholar] [CrossRef] [Scilit] [PubMed]
  5. Tao, W.-K.; Smith, E.A.; Adler, R.F.; Haddad, Z.S.; Hou, A.Y.; Iguchi, T.; Kakar, R.; Krishnamurti, T.N.; Kummerow, C.D.; Lang, S.; et al. Retrieval of latent heating from TRMM measurements. Bull. Amer. Meteorol. Soc. 2006, 87, 1555–1572. [Google Scholar] [CrossRef] [Scilit]
  6. Olson, W.S.; Kummerow, C.D.; Hong, Y.; Tao, W.-K. Atmospheric latent heating distributions in the tropics derived from satellite passive microwave radiometer measurements. J. Appl. Meteorol. 1999, 38, 633–664. [Google Scholar] [CrossRef] [Scilit] [PubMed]
  7. Hartmann, D.L.; Hendon, H.H.; Houze, R.A., Jr. Some implications of the mesoscale circulations in tropical cloud clusters for North–South and East–West tropical circulations. J. Atmos. Sci. 1984, 41, 113–121. [Google Scholar] [CrossRef] [Scilit]
  8. Biggerstaff, M.I.; Houze, R.A., Jr. Kinematic and precipitation structure of the 10–11 June 1985 squall line. Mon. Weather Rev. 1991, 119, 3034–3065. [Google Scholar] [CrossRef] [Scilit]
  9. Biggerstaff, M.I.; Houze, R.A., Jr. Kinematics and microphysics of the transition zone of the 10–11 June 1985 squall line. J. Atmos. Sci. 1993, 50, 3091–3110. [Google Scholar] [CrossRef] [Scilit]
  10. Houze, R.A., Jr. Mesoscale convective systems. Rev. Geophys. 2004, 42, RG4003. [Google Scholar] [CrossRef] [Scilit]
  11. Wilheit, T.T.; Chang, A.T.C.; Rao, M.S.V.; Rodgers, E.B.; Theon, J.S. A satellite technique for quantitatively mapping rainfall rates over the oceans. J. Appl. Meteorol. 1977, 16, 551–560. [Google Scholar] [CrossRef] [Scilit] [PubMed]
  12. Hollinger, J.P.; Peirce, J.L.; Poe, G.A. SSM/I instrument evaluation. IEEE Trans. Geosci. Remote Sens. 1990, 28, 781–790. [Google Scholar] [CrossRef] [Scilit]
  13. Weng, F.; Grody, N.C.; Ferraro, R.R.; Basist, A.; Forsyth, D. Cloud liquid water climatology derived from the special sensor microwave imager. J. Clim. 1997, 10, 1086–1098. [Google Scholar] [CrossRef] [Scilit]
  14. Simpson, J.; Adler, R.F.; North, G.R. A proposed tropical rainfall measuring mission (TRMM) satellite. Bull. Amer. Meteorol. Soc. 1988, 69, 278–295. [Google Scholar] [CrossRef] [Scilit]
  15. Kummerow, C.; Barnes, W.; Kozu, T.; Shiue, J.; Simpson, J. The tropical rainfall measuring mission (TRMM) sensor package. J. Atmos. Ocean. Technol. 1998, 15, 809–817. [Google Scholar] [CrossRef] [Scilit]
  16. Iguchi, T.; Kozu, T.; Meneghini, R.; Awaka, J.; Okamoto, K. Rain-profiling algorithm for the TRMM precipitation radar. J. Appl. Meteorol. 2000, 39, 2038–2052. [Google Scholar] [CrossRef] [Scilit] [PubMed]
  17. Kummerow, C.D.; Randel, D.L.; Kulie, M.; Wang, N.-Y.; Ferraro, R.; Munchak, S.J.; Petkovic, V. The evolution of the Goddard profiling algorithm to a fully parametric scheme. J. Atmos. Ocean. Technol. 2015, 32, 2265–2280. [Google Scholar] [CrossRef] [Scilit]
  18. Kummerow, C.; Ringerud, S.; Crook, J.; Randel, D.; Berg, W. An observationally generated a priori database for microwave rainfall retrievals. J. Atmos. Ocean. Technol. 2011, 28, 113–130. [Google Scholar] [CrossRef] [Scilit]
  19. Munchak, S.J.; Kummerow, C.D. A modular optimal estimation method for combined radar–radiometer precipitation profiling. J. Appl. Meteorol. Climatol. 2011, 50, 433–448. [Google Scholar] [CrossRef] [Scilit]
  20. Seo, E.-K.; Yang, S.-D.; Grecu, M.; Ryu, G.-H.; Liu, G.; Hristova-Veleva, S.; Noh, Y.-J.; Haddad, Z.; Shin, J. Optimization of cloud-radiation databases for passive microwave precipitation retrievals over ocean. J. Atmos. Ocean. Technol. 2016, 33, 1649–1671. [Google Scholar] [CrossRef] [Scilit]
  21. Grecu, M.; Olson, W.S.; Munchak, S.J.; Ringerud, S.; Liao, L.; Haddad, Z.; Kelley, B.L.; McLaughlin, S.F. The GPM combined algorithm. J. Atmos. Ocean. Technol. 2016, 33, 2225–2245. [Google Scholar] [CrossRef] [Scilit]
  22. Spencer, R.W.; Goodman, H.M.; Hood, R.E. Precipitation retrieval over land and ocean with the SSM/I: Identification and characteristics of the scattering signal. J. Atmos. Ocean. Technol. 1989, 6, 254–273. [Google Scholar] [CrossRef] [Scilit]
  23. Petty, G.W. Physical retrievals of over-ocean rain rate from multichannel microwave imagery. Part I: Theoretical characteristics of normalized polarization and scattering indices. Meteorol. Atmos. Phys. 1994, 54, 79–99. [Google Scholar] [CrossRef] [Scilit]
  24. Twomey, S. Introduction to the Mathematics of Inversion in Remote Sensing and Indirect Measurements; Elsevier: New York, NY, USA, 1977. [Google Scholar]
  25. Seo, E.-K.; Biggerstaff, M.I.; Hristova-Veleva, S.M.; Kim, K.-Y. Impact of Cloud Model Microphysics on Passive Microwave Retrievals of Cloud Properties. Part I: Model Comparison Using EOF Analyses. J. Appl. Meteorol. Climatol. 2006, 45, 930–954. [Google Scholar] [CrossRef] [Scilit]
  26. Seo, E.-K.; Liu, G.; Tao, W.-K.; Han, S.-O. Adaptation of a model-generated cloud database to satellite observations. Geophys. Res. Lett. 2007, 34, L03805. [Google Scholar] [CrossRef] [Scilit]
  27. Biggerstaff, M.I.; Seo, E.-K. An EOF-based comparison and evaluation of simulated passive microwave signatures to observations over tropical oceans. J. Geophys. Res. 2010, 115, D19208. [Google Scholar] [CrossRef] [Scilit]
  28. Seo, E.-K.; Biggerstaff, M.I. Regional variability within global-scale relations between passive microwave signatures and raining clouds over the tropical oceans. J. Appl. Meteorol. Climatol. 2012, 51, 897–911. [Google Scholar] [CrossRef] [Scilit]
  29. Hristova-Veleva, S.M. Impact of Microphysical Parameterizations on Simulated Storm Evolution and Remotely-Sensed Characteristics. Ph.D. Thesis, Texas A&M University, College Station, TX, USA, 2000. [Google Scholar]
  30. Khairoutdinov, M.; Randall, D.A. Cloud-resolving modeling of the ARM summer 1997 IOP: Model formulation, results, uncertainties, and sensitivities. J. Atmos. Sci. 2003, 60, 607–625. [Google Scholar] [CrossRef] [Scilit]
  31. Morrison, H.; Grabowski, W.W. A novel approach for representing ice microphysics in models: Description and tests using a kinematic framework. J. Atmos. Sci. 2008, 65, 1528–1548. [Google Scholar] [CrossRef] [Scilit]
  32. Liu, C.; Zipser, E.J. Why does radar reflectivity tend to increase downward toward the ocean surface, but decrease downward toward the land surface? J. Geophys. Res. Atmos. 2013, 118, 135–148. [Google Scholar] [CrossRef] [Scilit]
  33. Schumacher, C.; Funk, A. Assessing convective-stratiform precipitation regimes in the tropics and extratropics with the GPM satellite radar. Geophys. Res. Lett. 2023, 50, e2023GL102786. [Google Scholar] [CrossRef] [Scilit]
  34. Utsumi, N.; Turk, F.J.; Haddad, Z.S.; Kirstetter, P.-E.; Kim, H. Evaluation of precipitation vertical profiles estimated by GPM-era satellite-based passive microwave retrievals. J. Hydrometeorol. 2021, 22, 95–112. [Google Scholar] [CrossRef] [Scilit] [PubMed]
  35. Iguchi, T.; Seto, S.; Meneghini, R.; Yoshida, N.; Awaka, J.; Le, M.; Chandrasekar, V.; Kubota, T. GPM/DPR Level-2 Algorithm Theoretical Basis Document; JAXA/NASA: Tokyo, Japan, 2017.
  36. Hristova-Veleva, S.M.; Callahan, P.S.; Dunbar, R.S.; Stiles, B.W.; Yueh, S.H.; Huddleston, J.N.; Hsiao, S.V.; Neumann, G.; Vanhoff, B.A.; Gaston, R.W.; et al. Revealing the winds under the rain. Part I: Passive microwave rain retrievals using a new observation-based parameterization of subsatellite rain variability and intensity—Algorithm description. J. Appl. Meteorol. Climatol. 2013, 52, 2828–2848. [Google Scholar] [CrossRef] [Scilit][Green Version]
  37. Cecil, D.J. Relating passive 37-GHz scattering to radar profiles in strong convection. J. Appl. Meteorol. Climatol. 2011, 50, 233–240. [Google Scholar] [CrossRef] [Scilit]
  38. Seo, E.-K. Comparative analysis of GMI and DPR precipitation measurements over global oceans during summer season. Geosciences 2025, 15, 227. [Google Scholar] [CrossRef] [Scilit]
  39. Berg, W.; Kummerow, C.; Morales, C.A. Differences between east and west Pacific rainfall systems. J. Clim. 2002, 15, 3659–3672. [Google Scholar] [CrossRef] [Scilit]
  40. Zipser, E.J.; Lutz, K.R. The vertical profile of radar reflectivity of convective cells: A strong indicator of storm intensity and lightning probability? Mon. Weather Rev. 1994, 122, 1751–1759. [Google Scholar] [CrossRef] [Scilit]
  41. Hamada, A.; Takayabu, Y.N.; Liu, C.; Zipser, E.J. Weak linkage between the heaviest rainfall and tallest storms. Nat. Commun. 2015, 6, 6213. [Google Scholar] [CrossRef] [Scilit] [PubMed]
  42. Sohn, B.J.; Ryu, G.; Song, H.; Ou, M. Characteristic features of warm-type rain producing heavy rainfall over the Korean Peninsula inferred from TRMM measurements. Mon. Weather Rev. 2013, 141, 3873–3888. [Google Scholar] [CrossRef] [Scilit]
  43. Short, D.A.; Nakamura, K. TRMM radar observations of shallow precipitation over the tropical oceans. J. Clim. 2000, 13, 4107–4124. [Google Scholar] [CrossRef] [Scilit]
  44. Wood, R. Stratocumulus clouds. Mon. Weather Rev. 2012, 140, 2373–2423. [Google Scholar] [CrossRef] [Scilit]
  45. Houze, R.A., Jr. Observed structure of mesoscale convective systems and implications for large-scale heating. Q. J. R. Meteorol. Soc. 1989, 115, 425–461. [Google Scholar] [CrossRef]
  46. Houze, R.A., Jr. Structures of atmospheric precipitation systems: A global survey. Radio Sci. 1981, 16, 671–689. [Google Scholar] [CrossRef] [Scilit]
  47. Trenberth, K.E. Storm tracks in the Southern Hemisphere. J. Atmos. Sci. 1991, 48, 2159–2178. [Google Scholar] [CrossRef] [Scilit]
  48. Seo, E.-K.; Biggerstaff, M.I. Impact of Cloud Model Microphysics on Passive Microwave Retrievals of Cloud Properties. Part II: Uncertainty in Rain, Hydrometeor Structure, and Latent Heating Retrievals. J. Appl. Meteorol. Climatol. 2006, 45, 955–972. [Google Scholar] [CrossRef] [Scilit][Green Version]
  49. Pfreundschuh, S.; Arulraj, M.; Behrangi, A.; Bogerd, L.; Calheiros, A.J.P.; Casella, D.; Dolatabadi, N.; Guilloteau, C.; Gong, J.; Kummerow, C.D.; et al. A benchmark dataset for satellite-based estimation and detection of rain. Sci. Data 2026, 13, 244. [Google Scholar] [CrossRef] [Scilit] [PubMed]
Figure 1. Overview of the data processing and analysis workflow.
Atmosphere 17 00901 g001
Figure 2. Mean, standard deviation, and the first two EOF loading patterns of the radiative indices ( E 10 , E 19 , E 37 , E 89 , D 89 ) for convective (solid line) and stratiform (dotted line) precipitation. Panels show (a) mean, (b) standard deviation, (c) EOF1, and (d) EOF2. Explained variances are given in the EOF panels.
Atmosphere 17 00901 g002
Figure 3. Vertical distributions of DPR radar reflectivity profiles (dBZ) for convective rain types as a function of P C 1 and P C 2 amplitudes. The panels are arranged in a 3 × 4 matrix where P C 1 amplitude increases from left to right (−30 to −20, −5 to 5, 20 to 30, and 70 to 80) and P C 2 amplitude decreases from top to bottom (25 to 35, −5 to 5, and −35 to −25). Each line represents an individual reflectivity profile within the corresponding P C 1 P C 2 interval. The height ranges from 0 to 20 km and DPR reflectivity ranges from 0 to 60 dBZ.
Atmosphere 17 00901 g003
Figure 4. Vertical distributions of DPR radar reflectivity profiles (dBZ) for stratiform rain types as a function of P C 1 and P C 2 amplitudes. The panels are arranged in a 3 × 4 matrix where P C 1 amplitude increases from left to right (−30 to −20, −5 to 5, 20 to 30, and 70 to 80) and P C 2 amplitude decreases from top to bottom (25 to 35, −5 to 5, and −35 to −25). Each line represents an individual reflectivity profile within the corresponding P C 1 P C 2 interval. The height ranges from 0 to 20 km and DPR reflectivity ranges from 0 to 60 dBZ.
Atmosphere 17 00901 g004
Figure 5. Spatial distributions of (a) grid-mean P C 1 , (b) grid-mean P C 2 , and (c) number of observations for convective precipitation.
Atmosphere 17 00901 g005
Figure 6. Spatial distributions of precipitation characteristics for convective precipitation: (a) GMI rain rate (mm h−1), (b) DPR storm height (km), (c) GMI rainwater path (kg m−2), (d) GMI ice water path (kg m−2), and (e) Ice-to-Rain Path Ratio (IRPR).
Atmosphere 17 00901 g006
Figure 7. Spatial distributions of (a) grid-mean P C 1 , (b) grid-mean P C 2 , and (c) number of observations for stratiform precipitation.
Atmosphere 17 00901 g007
Figure 8. Spatial distributions of precipitation characteristics for stratiform precipitation: (a) GMI rain rate (mm h−1), (b) DPR storm height (km), (c) GMI rainwater path (kg m−2), (d) GMI ice water path (kg m−2), and (e) Ice-to-Rain Path Ratio (IRPR).
Atmosphere 17 00901 g008
Table 1. Physical interpretation of the first two EOF modes and the associated principal component ( P C ) coefficients under the fixed sign convention used in this study.
Title 1Positive (+) AmplitudeZero (0) AmplitudeNegative (–) Amplitude
P C 1
(bulk hydrometeor loading)
Enhanced hydrometeor loading: Concurrent increases in liquid and ice content; above-average column-integrated mass and radiative signaturesClimatological mean state: Represents the global average hydrometeor loading and precipitation intensityReduced hydrometeor loading: Below-average column-integrated mass with weaker radiative signatures
P C 2
(vertical phase partitioning)
Liquid-enhanced configuration: Greater relative contribution from lower-level liquid emission for a given loadingBalanced phase state: Near-average partitioning between liquid emission and ice scatteringIce-enhanced configuration: Greater relative contribution from upper-level ice scattering for a given loading
Disclaimer/Publisher’s Note: The statements, opinions and data contained in all publications are solely those of the individual author(s) and contributor(s) and not of MDPI and/or the editor(s). MDPI and/or the editor(s) disclaim responsibility for any injury to people or property resulting from any ideas, methods, instructions or products referred to in the content.