Article

Toward Integrated Hospital IAQ Monitoring: Continuous Sensing and Targeted Chemical Characterization

1
Agrofood and Sustainable Processes, CARTIF Technology Center, 47151 Valladolid, Spain
2
FOTOAIR, Department of Energy, Centro de Investigaciones Energéticas Medioambientales y Tecnológicas (CIEMAT), 28040 Madrid, Spain
3
Department of Mycology at Real Jardín Botánico, CSIC (RJB-CSIC), Plaza de Murillo 2, 28014 Madrid, Spain
4
inBiot Monitoring, 31192 Mutilva, Spain
5
Directorate of Infrastructure and Biomedical Engineering, Hospital Clinic de Barcelona, Villarroel 170., 08036 Barcelona, Spain
6
Public Health Research Centre, Comprehensive Health Research Center, CHRC, NOVA National School of Public Health, NOVA University Lisbon, 1990-096 Lisbon, Portugal
7
Fundació de Recerca Clínic Barcelona-Institut d’Investigacions Biomèdiques August Pi i Sunyer (FRCB-IDIBAPS), 08036 Barcelona, Spain
*
Author to whom correspondence should be addressed.
Atmosphere 2026, 17(9), 895; https://doi.org/10.3390/atmos17090895
Submission received: 4 August 2026 / Revised: 7 September 2026 / Accepted: 9 September 2026 / Published: 14 September 2026

Abstract

Indoor air quality (IAQ) in healthcare environments is affected by dynamic interactions between occupancy, ventilation, operational activities, and indoor emission sources, which are not always captured through conventional punctual assessments. This study evaluated long-term IAQ dynamics in different hospital microenvironments using continuous low-cost sensor monitoring combined with targeted chemical characterization of volatile organic compounds (VOCs) and specific aldehydes. Continuous monitoring was conducted from June 2023 to December 2025, measuring CO2, PM2.5, PM10, formaldehyde (CH2O), temperature, relative humidity, and total VOCs (TVOC). A total of 1.79 million raw records were processed, generating 1.42 million indoor measurements and 264,311 hourly aggregated observations. Complementary VOC and aldehyde sampling campaigns supported the interpretation of pollutant specific temporal patterns. Results revealed differentiated and recurrent IAQ signatures across hospital areas. CO2 dynamics were mainly associated with occupancy and ventilation demand, whereas formaldehyde showed more persistent and seasonally dependent sensor patterns, compatible with the influence of indoor emission sources and ventilation heterogeneity. Targeted chemical characterization further identified area specific pollutant profiles associated with cleaning activities, laboratory processes, materials, and operational conditions. Importantly, recurrent periods were identified in which acceptable occupancy related CO2 conditions coincided with elevated chemical pollutant levels. These findings show how long-term multi-parameter monitoring can distinguish function and pollutant specific IAQ signatures that would remain obscured by aggregated or single parameter assessments, providing an evidence base for area specific monitoring strategies and future adaptive hospital IAQ management.

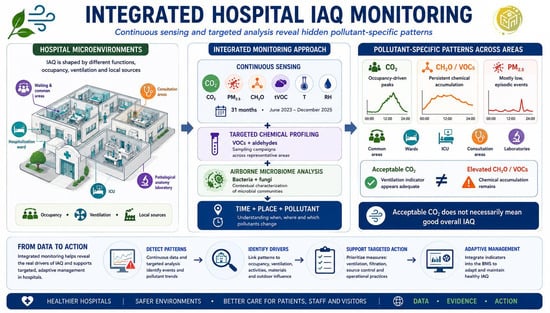
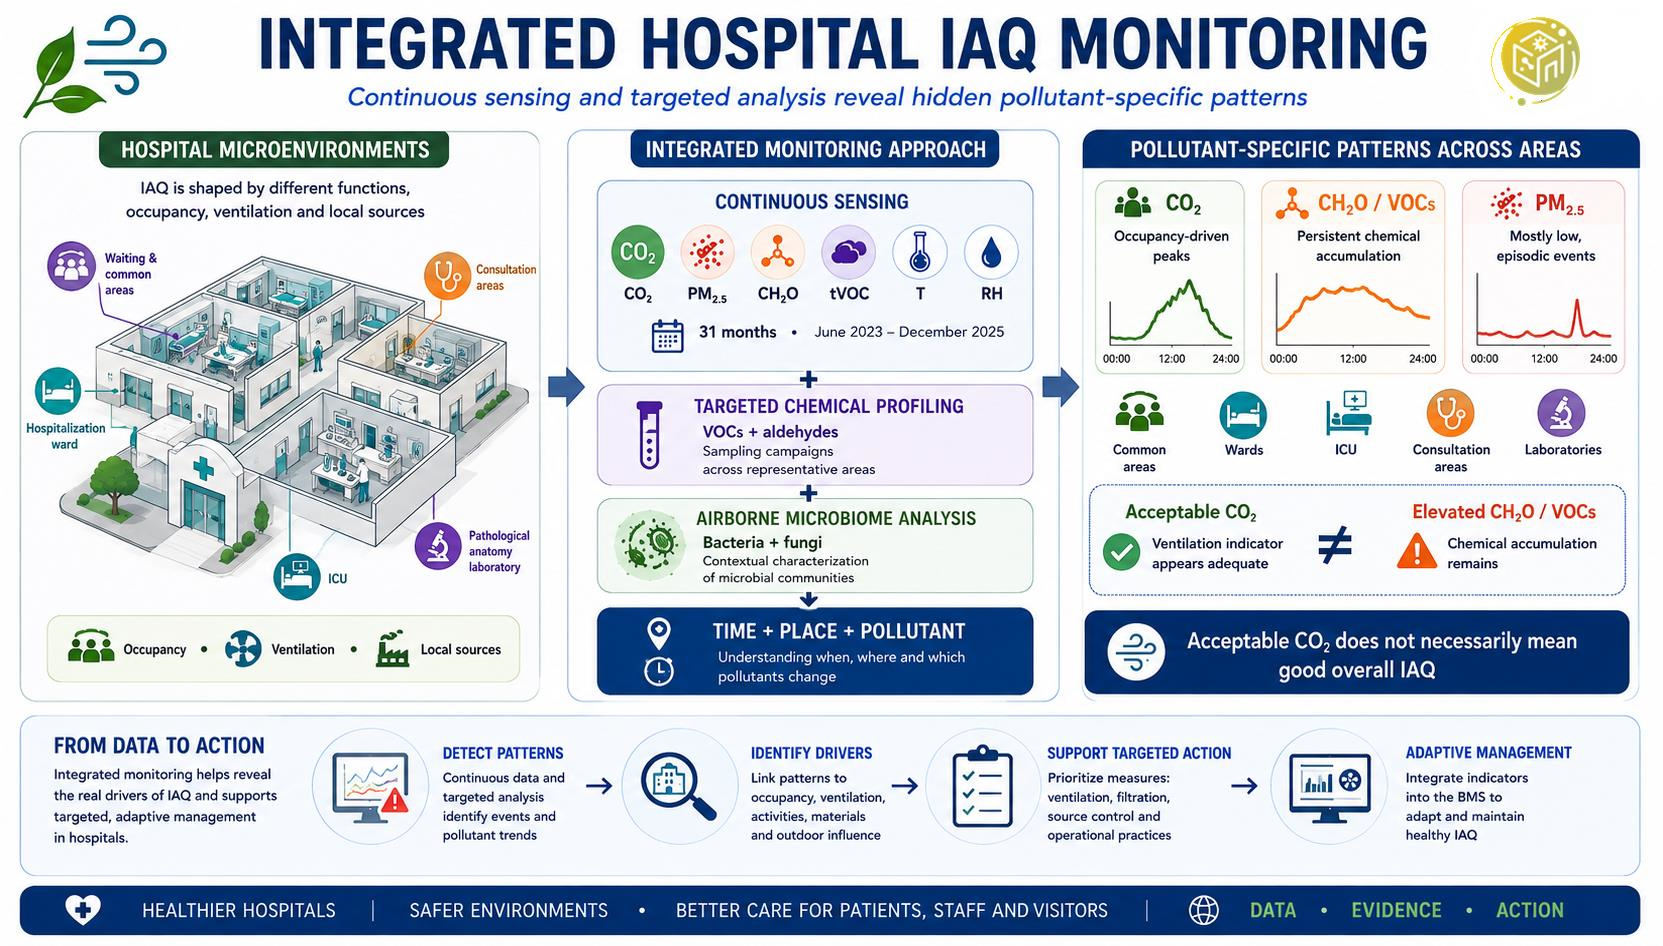
Graphical Abstract

1. Introduction

Indoor air quality (IAQ) has become an increasingly important public health concern due to the large proportion of time spent indoors and the growing evidence linking indoor pollutant exposure with adverse health effects [1,2,3]. Healthcare facilities represent particularly sensitive indoor environments because they host vulnerable populations, including immunocompromised patients, elderly individuals, children, and healthcare workers who may be subjected to more prolonged and intensive exposure [3,4,5,6]. In these environments, inadequate IAQ may contribute not only to discomfort and reduced well-being, but also to respiratory irritation, exacerbation of chronic diseases, increased susceptibility to infections, and impaired recovery processes [2,4]. Maintaining adequate IAQ conditions in hospitals is therefore a critical component of preventive healthcare and healthy building strategies [5,7,8], as is reflected in the European building and environmental policies [9,10].
Previous studies have shown that hospitals may contain elevated concentrations of particulate matter (PM), volatile organic compounds (VOCs), aldehydes such as formaldehyde, bioaerosols, and other airborne contaminants originating from outdoor infiltration, cleaning and disinfection products, medical procedures, building materials, occupant related activities, and ventilation system operation [6,11,12,13]. Beyond chemical pollutants, hospital air hosts complex microbial communities whose composition is shaped by occupancy levels, human activity, ventilation strategy, and the functional specialization of each space, resulting in substantial variability between wards, waiting rooms, intensive care units (ICUs), operating theatres, and laboratories [14]. Such spatial and temporal heterogeneity makes IAQ characterization in healthcare environments particularly challenging [14].
Despite the growing awareness of IAQ relevance in healthcare settings, conventional assessment approaches are still frequently based on punctual measurements, periodic inspections, or integrated sampling campaigns with limited temporal resolution [15,16]. Although these methodologies provide valuable chemical or microbiological characterization, they often fail to capture the strong short-term variability associated with occupancy dynamics, ventilation changes, cleaning activities, clinical operations, or episodic emission events [17]. Indoor environments are not static, and pollutant hotspots may vary substantially both spatially and temporally [18]. Consequently, average or discontinuous measurements may overlook transient exposure conditions that can be operationally and clinically relevant [17,18]. Moreover, relying exclusively on ventilation indicators such as CO2 may lead to incomplete interpretations of IAQ conditions, since acceptable CO2 levels do not necessarily imply the absence of VOCs, aldehydes, or other chemically driven exposure scenarios [19,20].
Recent advances in low-cost sensing technologies, Internet of Things (IoT) infrastructures, cloud-based platforms, and smart building systems have enabled a shift from episodic IAQ assessment toward continuous, high-resolution monitoring [21,22,23]. Compared with traditional instrumentation, distributed low-cost sensor (LCS) networks provide greater spatiotemporal coverage, facilitating the identification of recurrent exposure patterns, transient peaks, room specific pollutant dynamics, and operational anomalies [17,18,24]. Although their absolute accuracy may be limited, properly calibrated and quality controlled LCS systems can provide valuable information for environmental characterization, exposure assessment, and decision support [21,22,25]. Particular caution is required for low-cost metal-oxide (MOX) VOC sensors, whose responses may be affected by cross-sensitivity to different volatile compounds and environmental conditions and therefore do not provide the chemical specificity of analytical VOC measurements. Their value is consequently greater for tracking relative temporal changes and recurrent volatile accumulation patterns than for identifying or quantifying individual VOCs [22]. Moreover, their integration with Building Management Systems (BMS), smart ventilation strategies, and data-driven control approaches can transform IAQ monitoring into an operational tool, supporting adaptive responses to occupancy, pollutant peaks, and ventilation performance while enabling predictive, exposure oriented, and energy efficient building management [23,26,27].
The present study addresses these limitations through a 31-month longitudinal assessment combining continuous multi-parameter monitoring with targeted chemical characterization across functionally distinct areas of a tertiary care hospital. Rather than evaluating IAQ solely in terms of average pollutant concentrations or individual compliance indicators, the study investigates whether different hospital functions exhibit recurrent pollutant-specific temporal and spatial signatures that can be related to occupancy, ventilation demand, indoor emission sources, and operational activities. Particular attention is given to situations in which occupancy related ventilation indicators and chemical pollutant accumulation become decoupled, as these conditions may remain undetected by monitoring or control strategies based predominantly on CO2.
Accordingly, the specific objectives were to: (1) characterize area and pollutant specific temporal patterns and exceedance behaviour for CO2, PM2.5, and CH2O; (2) integrate continuous monitoring with targeted VOC and aldehyde characterization to identify complementary chemical and operational signatures; and (3) assess how these differentiated patterns can inform area specific IAQ management and future multi-parameter Building Management System strategies. The contribution of the study therefore lies not in establishing the general need for multi-parameter IAQ monitoring, but in identifying, over an extended period under real hospital operating conditions, pollutant and function specific operational IAQ signatures, including recurrent temporal decoupling between occupancy related ventilation indicators and chemical pollutant accumulation, and translating these findings into operationally relevant information for healthcare environmental management.

2. Materials and Methods

2.1. Study Design

This study was conducted at Hospital Clínic de Barcelona (HCB), a tertiary care hospital located in Barcelona, Spain within the framework of the K-HEALTHinAIR project (Knowledge for improving Indoor Air Quality and Health, 2022–2026, 101057693, https://k-healthinair.eu/, Accessed on 8 September 2026).
A longitudinal observational design was implemented between June 2023 and December 2025, enabling the characterization of IAQ dynamics across different seasons and occupancy conditions. The study integrated three complementary methodological approaches: (i) continuous real-time monitoring using LCS devices, (ii) periodic chemical characterization of VOCs and aldehydes, and (iii) seasonal airborne microbiome and bioaerosol characterization.
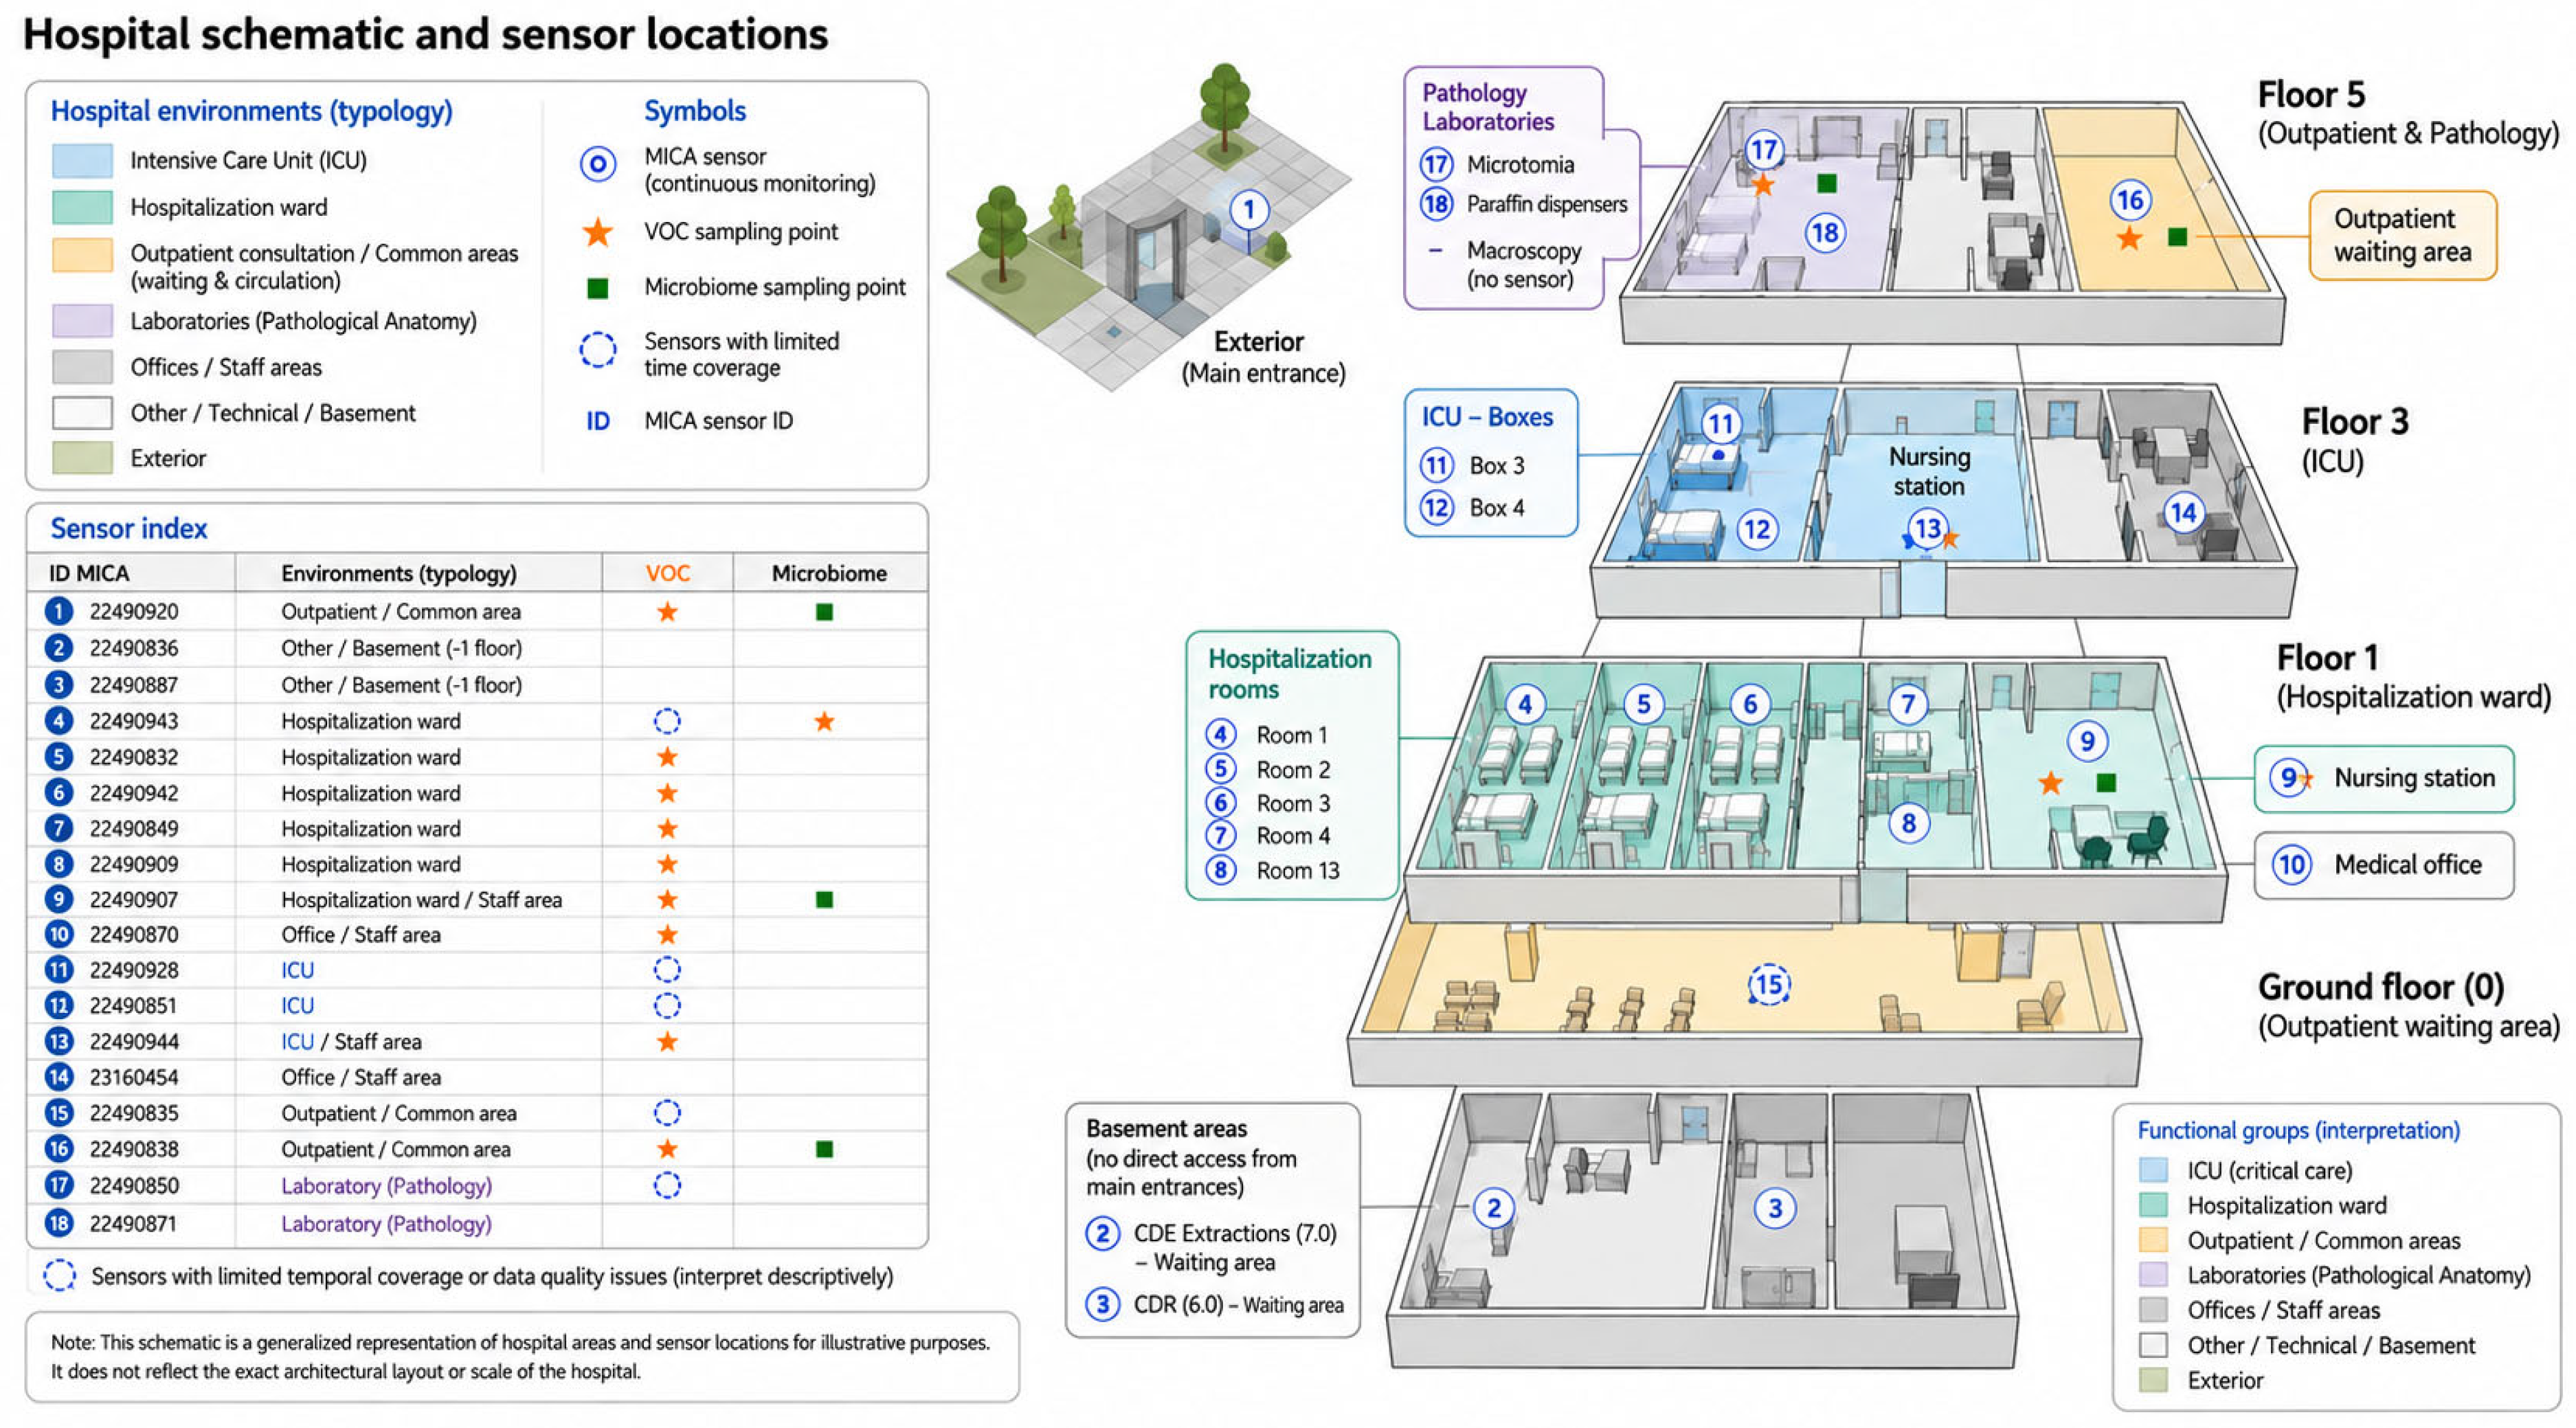
Monitoring was conducted across five hospital microenvironment typologies grouped into three broad functional categories: (i) public spaces (main entrance hall and waiting areas), (ii) clinical environments (consultation rooms, hospitalization wards, and intensive care units), and (iii) technical or laboratory areas. This approach enabled the evaluation of IAQ under highly diverse operational conditions, ranging from controlled environments with advanced ventilation systems to highly dynamic occupancy driven spaces. The study was designed as a long-term observational assessment under routine hospital operating conditions. Direct measurements of air exchange rates or ventilation flows, tracer gas experiments, and controlled material emission tests were not performed. Consequently, associations between observed pollutant patterns and ventilation conditions or potential indoor sources are interpreted as plausible explanations supported by temporal and chemical evidence, rather than as direct measurements of emission or air exchange processes. A schematic overview of the monitored hospital environments and the distribution of continuous monitoring and complementary sampling approaches is provided in Figure 1.

2.2. Continuous Monitoring

Continuous IAQ monitoring was performed using commercially available LCS devices (MICA Plus, inBiot Monitoring S.L., Mutilva, Spain). The monitoring systems incorporated sensors for CO2 (non-dispersive infrared—NDIR sensor) PM1, PM2.5 and PM10 (optical particle counting), CH2O (electrochemical sensor), temperature, relative humidity, and TVOC (metal-oxide—MOX). Measurements were nominally recorded at 10 min intervals, although the effective acquisition cadence showed some variability during long-term field operation. TVOC measurements were interpreted qualitatively as indicators of volatile accumulation dynamics rather than quantitative measurements of specific compounds.
Detailed specifications and the laboratory and field validation of these devices have been reported previously [27,28]. In addition, periodic on-site checks using portable handheld instruments were conducted during field campaigns to qualitatively verify the consistency of selected measurements. The MICA Plus devices are designed for long-term IAQ monitoring, with a manufacturer reported device lifespan of >10 years and a modular sensor architecture intended to facilitate maintenance. Data were communicated via a 2.4 GHz Wi-Fi connection to the cloud-based monitoring platform; consequently, temporary losses of Wi-Fi connectivity resulted in gaps in data acquisition, as further described in Section 2.5.1.

2.3. VOC Sampling and Processing

Twelve monthly sampling campaigns were conducted to characterize VOCs and aldehydes. Sampling campaigns were scheduled approximately during the second week of each month, generally on Wednesdays or Thursdays. At each sampling location, samples were collected in the morning and at approximately the same time of day across campaigns to improve temporal comparability. Sampling locations were selected to complement the continuous monitoring network. VOC sampling was performed using active air collection on sorbent tubes, followed by thermal desorption and gas chromatography coupled to mass spectrometry (TD-GC/MS) analysis [29]. Aldehydes, including CH2O, were collected using derivatization cartridges and analysed by high-performance liquid chromatography (HPLC) following established analytical procedures [30]. Following collection, samples were transported under refrigerated conditions and stored refrigerated until subsequent processing and instrumental analysis. Samples were stored separately to minimize the risk of contamination. VOC sorbent tubes were maintained refrigerated until thermal desorption as part of the TD-GC/MS analysis, whereas derivatization cartridges were maintained refrigerated until solvent extraction, which was generally performed within 1–2 days after collection. Following extraction, aldehyde extracts were maintained under refrigerated conditions until HPLC analysis. The interval between sample preparation and instrumental analysis varied according to laboratory availability but was kept as short as practicable.
An exploratory chemometric analysis based on Principal Component Analysis (PCA) was also performed to support the interpretation of the chemical dataset and identify grouping patterns among hospital areas, following established chemometric approaches [31,32]. However, the detailed multivariate analysis is outside the scope of the present manuscript. Accordingly, the present study reports only the descriptive results of the targeted chemical characterization that are directly relevant to the interpretation of the continuous IAQ monitoring data.

2.4. Microbiome Sampling and Processing

Seasonal airborne microbiome and bioaerosol sampling campaigns were conducted in representative hospital environments. Air samples were analysed using culture-based methods and amplicon sequencing targeting bacterial 16S rRNA gene and fungal ITS markers [33,34,35,36]. The full methodological details and descriptive results are provided in the Supplementary Material.
In the present study, microbiome characterization was included as an exploratory complementary layer to contextualize environmental differences among hospital areas. Detailed microbiome analyses will be reported separately; here, only findings directly relevant to the interpretation of hospital IAQ patterns are considered.

2.5. Data Processing and Statistical Analysis

2.5.1. Sensor Data Processing and Quality Control

Raw sensor datasets were processed using a reproducible Python (Visual Studio Code 1.133.0) based workflow developed for data harmonization, consistency assessment, coverage evaluation, and temporal aggregation of the hospital IAQ monitoring data. The Python scripts used for sensor data processing, hourly aggregation, coverage assessment, and generation of the main descriptive outputs are publicly available in Zenodo (https://doi.org/10.5281/zenodo.22141208). The public workflow was validated against the original processing pipeline and reproduces the processed hourly dataset and the principal numerical outputs used in the present study.
Data pre-processing included timestamp normalization, deduplication of repeated outdoor records, separation of indoor and outdoor measurements, consistency checks, and generation of hourly aggregated datasets. For each sensor and pollutant, hourly concentrations were calculated as the arithmetic mean of all available valid measurements within the corresponding hourly interval; no minimum number of within hour observations was required for an hourly value to be retained. Sensor coverage and temporal representativeness were evaluated considering monitoring span, number of observations, hourly completeness, seasonal coverage, and percentage of valid measurements. Hourly data completeness was calculated for each sensor as the percentage of hourly intervals containing at least one valid measurement over the total number of expected hourly intervals within the sensor specific monitoring period. This completeness metric therefore represents general sensor level data availability; pollutant specific availability within retained hourly intervals could differ among variables. The percentage of missing days was calculated separately over the same monitoring period; a calendar day was considered available when it contained at least one valid measurement and missing when no valid measurements were recorded. Area level values for both indicators were summarized as the arithmetic mean of the sensor specific percentages together with the minimum–maximum range. Missing days percentage therefore quantifies completely absent calendar days and should not be interpreted as within day or hourly completeness. Missing data were mainly associated with temporary technical interruptions, including Wi-Fi connectivity and power supply issues. In addition, a firmware update issue resulted in an interruption in data acquisition of approximately two months, between September and November 2024, for the affected devices. Missing observations were not interpolated or imputed. All valid sensor hours were retained for aggregated descriptive analyses. Coverage was taken into account when interpreting individual sensor patterns and when making annual or seasonal comparisons; differences in temporal coverage were considered when assessing the representativeness of individual sensor patterns. The final processed dataset included continuous measurements of temperature, relative humidity, CO2, PM2.5, CH2O, and TVOC collected across five hospital microenvironment typologies between June 2023 and December 2025.

2.5.2. Pollutant Specific IAQ Assessment

IAQ assessment was performed using a pollutant specific adaptation of the GO IAQS methodology [37]. Continuous measurements of CO2, PM2.5, and CH2O were classified into “Good”, “Moderate”, and “Unhealthy” IAQ categories using pollutant specific upper thresholds. Concentrations were classified as Good when they were ≤800 ppm for CO2, ≤10 µg/m3 for PM2.5, and ≤27 ppb (≤33.16 µg/m3) for CH2O; as Moderate when they were above these values but ≤1400 ppm, ≤25 µg/m3, and ≤100 ppb (≤122.81 µg/m3), respectively; and as Unhealthy when the corresponding upper thresholds were exceeded. For the CH2O figure presented in the main manuscript, a continuous colour scale was additionally used to facilitate visualization of concentration magnitude and within category temporal variation, while the GO IAQS thresholds were retained for interpretation. For each pollutant and monitoring location, the percentage of time spent within each IAQ category was calculated together with exceedance frequencies, mean concentrations, and upper tail exposure indicators (P90 concentrations). For the seasonal hourly profiles, P90 was calculated as the 90th percentile of all valid sensor hour values available for each hospital area, season, and hour of day combination. Time resolved analyses included hourly profiles, monthly distributions, and heatmaps (seasonal and full period) to identify recurrent periods of pollutant accumulation and operational IAQ patterns. For each sensor, heatmaps were generated by grouping valid measurements according to the hour of the day and day of the week and calculating the mean pollutant concentration for each temporal combination. Heatmaps from all sensors deployed within each hospital area were examined when interpreting area specific patterns; however, only selected representative examples are presented in the figures to facilitate visualization. Because TVOC measurements were obtained using MOX-based sensors with different scaling phases during the monitoring campaign, TVOC data were interpreted qualitatively as relative indicators of volatile accumulation dynamics rather than quantitative measurements of specific compounds.

2.5.3. Integrated Multi-Pollutant Assessment

To support operational interpretation of IAQ conditions, pollutant specific classifications were combined into an integrated multi-parameter assessment framework. Rather than relying exclusively on average concentrations, the analysis considered the coexistence of recurrent exceedances across multiple pollutants and the temporal persistence of non optimal IAQ conditions.
Overall IAQ interpretation was therefore based on the combined behaviour of occupancy related indicators (CO2), PM2.5, and volatile pollutant indicators (CH2O and qualitative TVOC signals). This approach enabled the identification of pollutant specific operational signatures and situations where acceptable occupancy related ventilation conditions did not necessarily correspond to low chemical pollutant accumulation.
Continuous sensor measurements were available during targeted chemical and microbiological sampling campaigns, providing concurrent environmental context for the discrete samples. For the chemical characterization, temporally matched sensor data were additionally used for specific comparative analyses, including the comparison between continuous CH2O measurements and DNPH/HPLC determinations. For this comparison, continuous measurements were matched at area and sensor level to the corresponding DNPH/HPLC sampling events, and sensor measurements recorded during the 3 h sampling window were aggregated for comparison with the integrated reference measurement.
These matched data were used as a complementary assessment of agreement between continuous and reference CH2O measurements rather than as a calibration procedure.

2.6. Ethics

The Ethical Committee for Human Research at the Hospital Clínic de Barcelona approved the core study protocol for K-HEALTHinAIR on 29 June 2023 (HCB/2023/128). This study focused on environmental indoor air quality monitoring and targeted environmental sampling within hospital facilities; therefore, no personal or clinical data were collected, and no patients were directly involved in the study.

2.7. Use of Artificial Intelligence Tools

During the preparation and revision of this manuscript, the authors used ChatGPT (OpenAI, GPT-5.6) as a support tool for English language editing, improvement of textual clarity and organisation, and assistance with the conceptual development of the graphical abstract. Generative AI was used to produce an initial visual draft of the graphical abstract, which was subsequently reviewed and edited by the corresponding author. AI tools were not used to generate, process, statistically analyse, or independently interpret the experimental data, nor to formulate the scientific conclusions of the study. All AI assisted content was critically reviewed and verified by the authors, who take full responsibility for the accuracy, integrity, and final content of the manuscript.

3. Results

3.1. IAQ Conditions and Exposure Overview Across Hospital Areas

Table 1 summarizes continuous sensor data coverage and pollutant behaviour across the monitored areas. For hospital areas monitored with more than one sensor, the reported ranges represent the variability among individual sensors deployed within that area over their respective valid monitoring periods, rather than temporal ranges within a single sensor.
Concentrations remained within the GO-AQS “Good” air quality thresholds of 800 ppm for CO2, 10 µg/m3 for PM2.5 and 33.16 µg/m3 for CH2O during most of the monitoring period in the majority of areas, but time resolved analysis revealed substantial differences in exposure dynamics, variability, and dominant drivers. CO2 was the most spatially variable parameter, with consultation areas emerging as hotspots reflecting recurrent ventilation limitations during occupancy peaks. PM2.5 was generally low and showed weaker recurrent temporal structure, with elevations occurring mainly as episodic events rather than persistent patterns. CH2O showed the strongest seasonal and sensor level heterogeneity, with recurrent elevated sensor signals in selected hospitalization and outpatient consultation spaces, particularly during summer and during nighttime or early morning periods. These patterns contrasted with the predominantly occupancy related daytime behaviour observed for CO2. In addition, the higher variability observed for CH2O in the hospitalization ward and outpatient consultation area should be interpreted considering that these categories included several sensors deployed in different rooms or functional spaces within the same hospital area, thereby capturing spatial heterogeneity in local emission sources, ventilation conditions and room use. The parameter specific temporal and seasonal patterns underlying this overview are examined in Section 3.2.1, Section 3.2.2 and Section 3.2.3 and are further documented through the seasonal hourly profiles provided in the Supplementary Material.
These findings show that hospital areas with similar overall IAQ classifications may exhibit markedly different exposure dynamics.

3.2. Temporal Dynamics and Exceedance Patterns

3.2.1. Occupancy Driven CO2 Dynamics

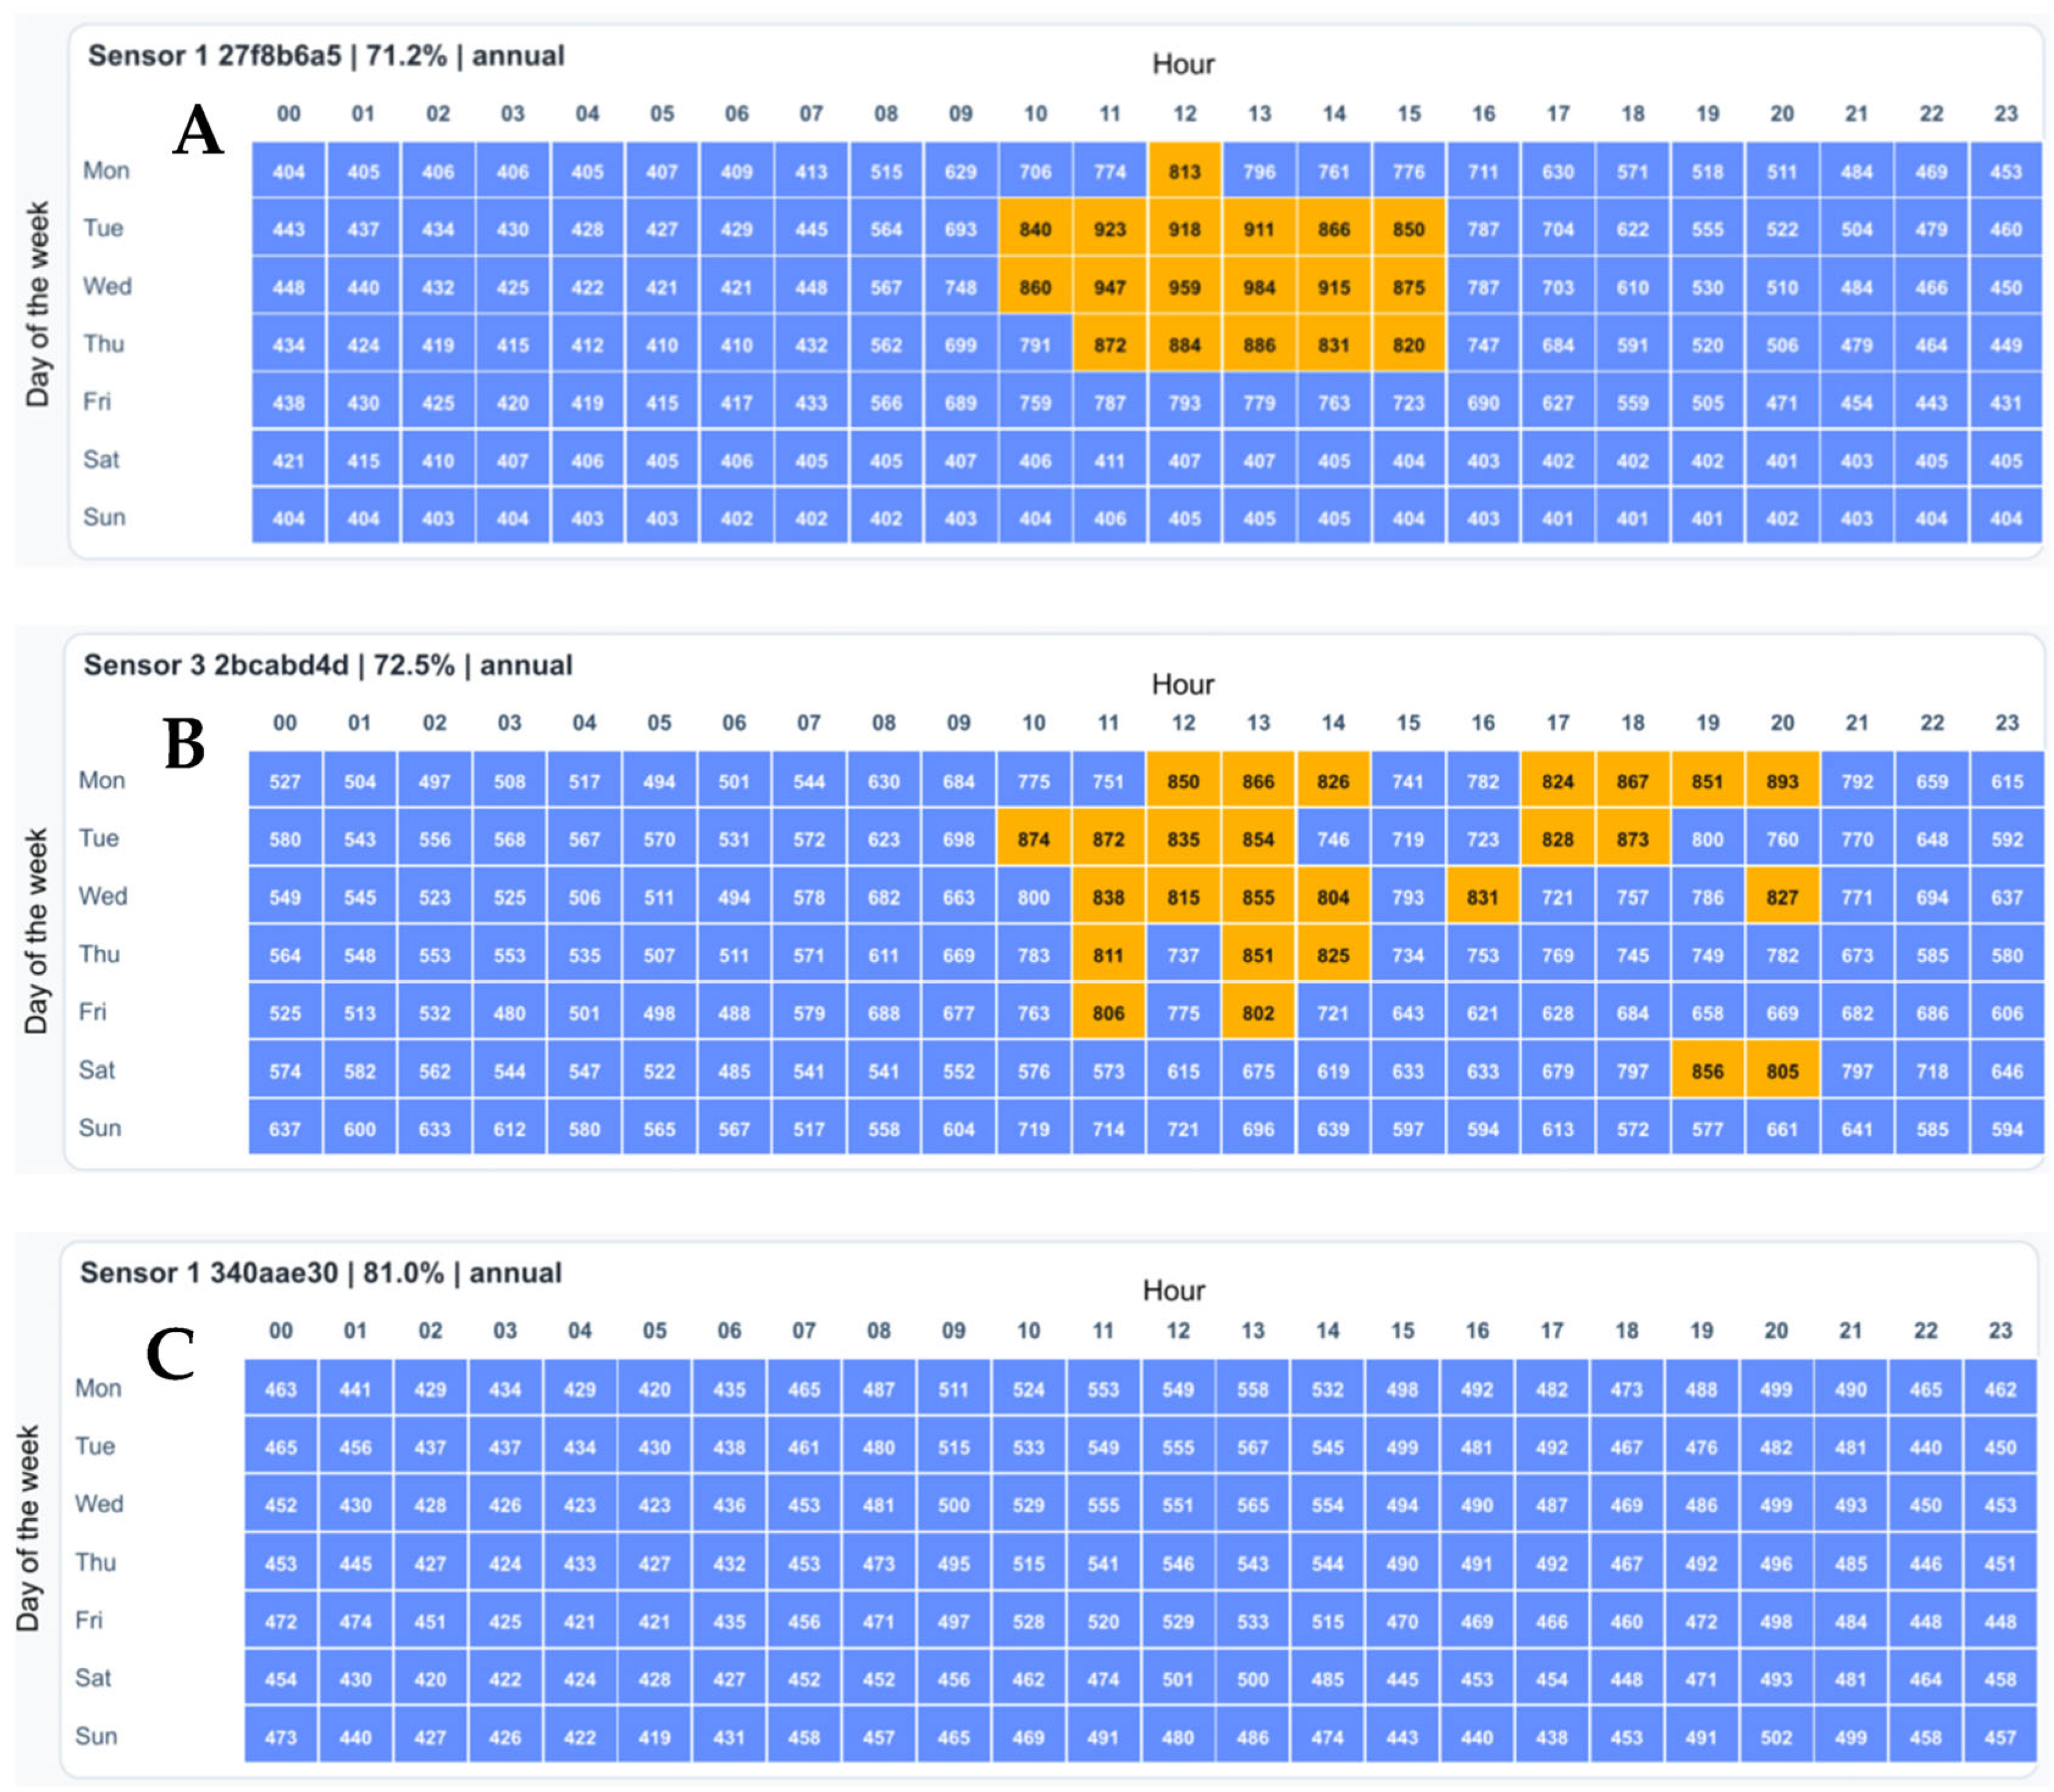
Temporal analysis of CO2 concentrations revealed clear occupancy driven patterns across several hospital areas, particularly in common spaces, outpatient consultation areas, and hospitalization wards, whereas the ICU exhibited remarkably stable concentrations consistent with controlled ventilation and limited sensitivity to occupancy fluctuations. Heatmaps from all monitored sensors and seasons were analysed, although only representative examples are shown in Figure 2. Each panel corresponds to an individual representative sensor and should therefore not be interpreted as an average across all sensors deployed within the corresponding hospital area. Complementary seasonal hourly CO2 profiles are provided in Supplementary Figure S1.
The strongest occupancy related behaviour was observed in common spaces and outpatient consultation areas (Figure 2A), where recurrent daytime increases occurred between approximately 10:00 and 15:00. Although annual mean concentrations generally remained within the GO IAQS “Good” category, recurrent high exposure periods were identified, particularly during autumn and summer, with P90 values exceeding 1100–1200 ppm despite mean concentrations remaining below 800 ppm. These results highlight the added value of upper tail indicators for identifying recurrent ventilation demand events.
Hospitalization wards exhibited a different temporal signature (Figure 2B), characterized by more persistent but less sharply defined CO2 elevations distributed throughout daytime hours rather than concentrated occupancy peaks. In contrast, the ICU maintained minimal temporal variability and very low exceedance frequencies throughout the study period (Figure 2C), with P90 values consistently remaining within the GO IAQS “Good” category.

3.2.2. Seasonal and Room Dependent Formaldehyde Behaviour

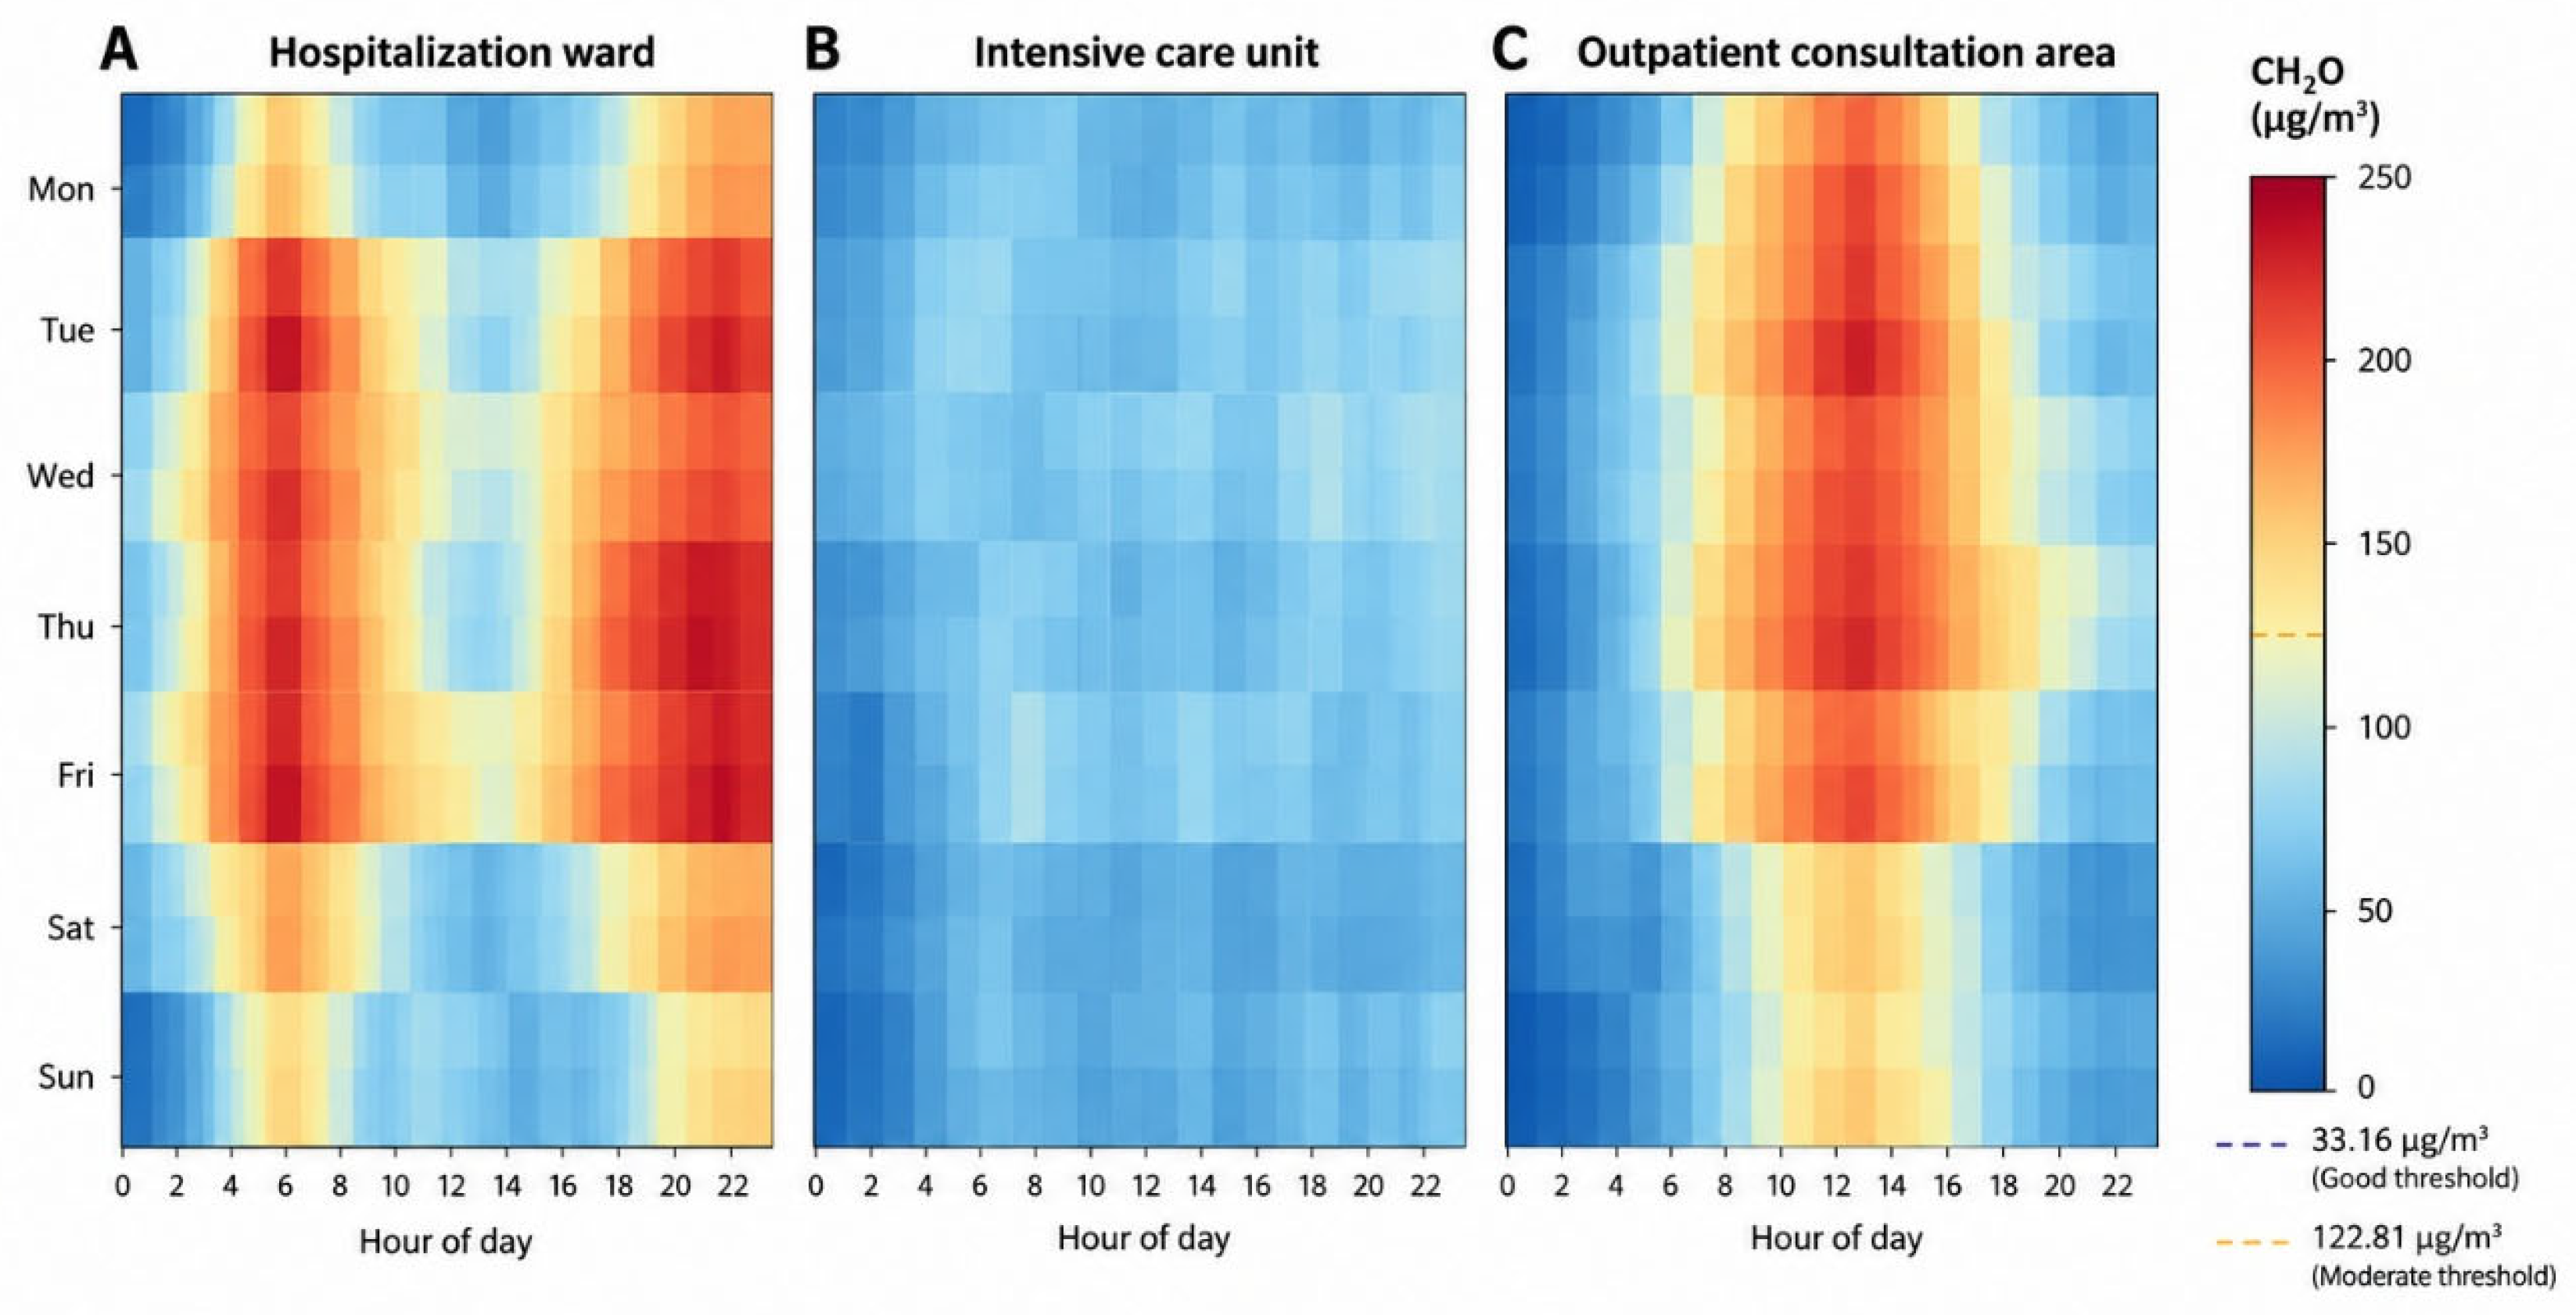
CH2O exhibited markedly different temporal behaviour from CO2, showing strong seasonal dependence, persistence during low occupancy periods, and substantial variability between rooms within the same hospital area (Figure 3). Complementary seasonal hourly CH2O profiles across the monitored hospital areas are provided in Supplementary Figure S2.
The highest CH2O levels were observed in specific monitored spaces within the hospitalization wards and outpatient consultation areas, particularly during the summer period. Unlike CO2, exceedances frequently occurred at night and in the early morning rather than during occupancy peaks, suggesting temperature dependent emissions, material off-gassing, or pollutant accumulation under reduced ventilation. Persistent exceedances characterized some sensors in the hospitalization wards (Figure 3A), whereas some monitored spaces within the outpatient consultation areas emerged as the main CH2O hotspot, exhibiting sustained early morning accumulation during summer (Figure 3C). In contrast, the ICU maintained consistently low concentrations and minimal temporal variability throughout the monitoring period (Figure 3B). This sensor level variability indicates that CH2O behaviour was not homogeneous within these broad hospital areas, but was influenced by local room conditions, emission sources and ventilation patterns.
Overall, CH2O patterns appeared to be more strongly associated with seasonal conditions and potential indoor emission sources than with occupancy related ventilation demand, highlighting the complementary information provided by continuous multi-parameter monitoring.

3.2.3. PM2.5 Episodic Behaviour

PM2.5 showed a weaker temporal structure and lower variability than the other parameters. Most areas remained within the GO IAQS “Good” category throughout the monitoring period, with annual averages generally below 10 µg/m3. Its temporal behaviour was mainly episodic, characterized by short and irregular concentration increases across zones, without clear occupancy related schedules or recurrent daily patterns. These patterns suggest localized activities, transient indoor processes or occasional outdoor infiltration rather than ventilation limitations.
The ICU showed the lowest variability and exceedance frequency. Occasional events were detected in outpatient consultation and laboratory areas, where intermittent increases coincided with specific operational periods. Overall, PM2.5 was not a dominant IAQ concern, but its temporal behaviour appeared to reflect episodic local sources or outdoor infiltration more than occupancy related dynamics. Complementary seasonal hourly PM2.5 profiles are provided in Supplementary Figure S3.
Taken together, these pollutant specific patterns revealed distinct operational IAQ signatures across hospital environments, ranging from stable, well controlled conditions in the ICU to occupancy driven ventilation demand in outpatient areas and persistent, source related chemical accumulation in hospitalization wards and laboratories.

3.3. VOCs and Aldehydes Characterization

3.3.1. Spatial Chemical Characterization Across Hospital Environments

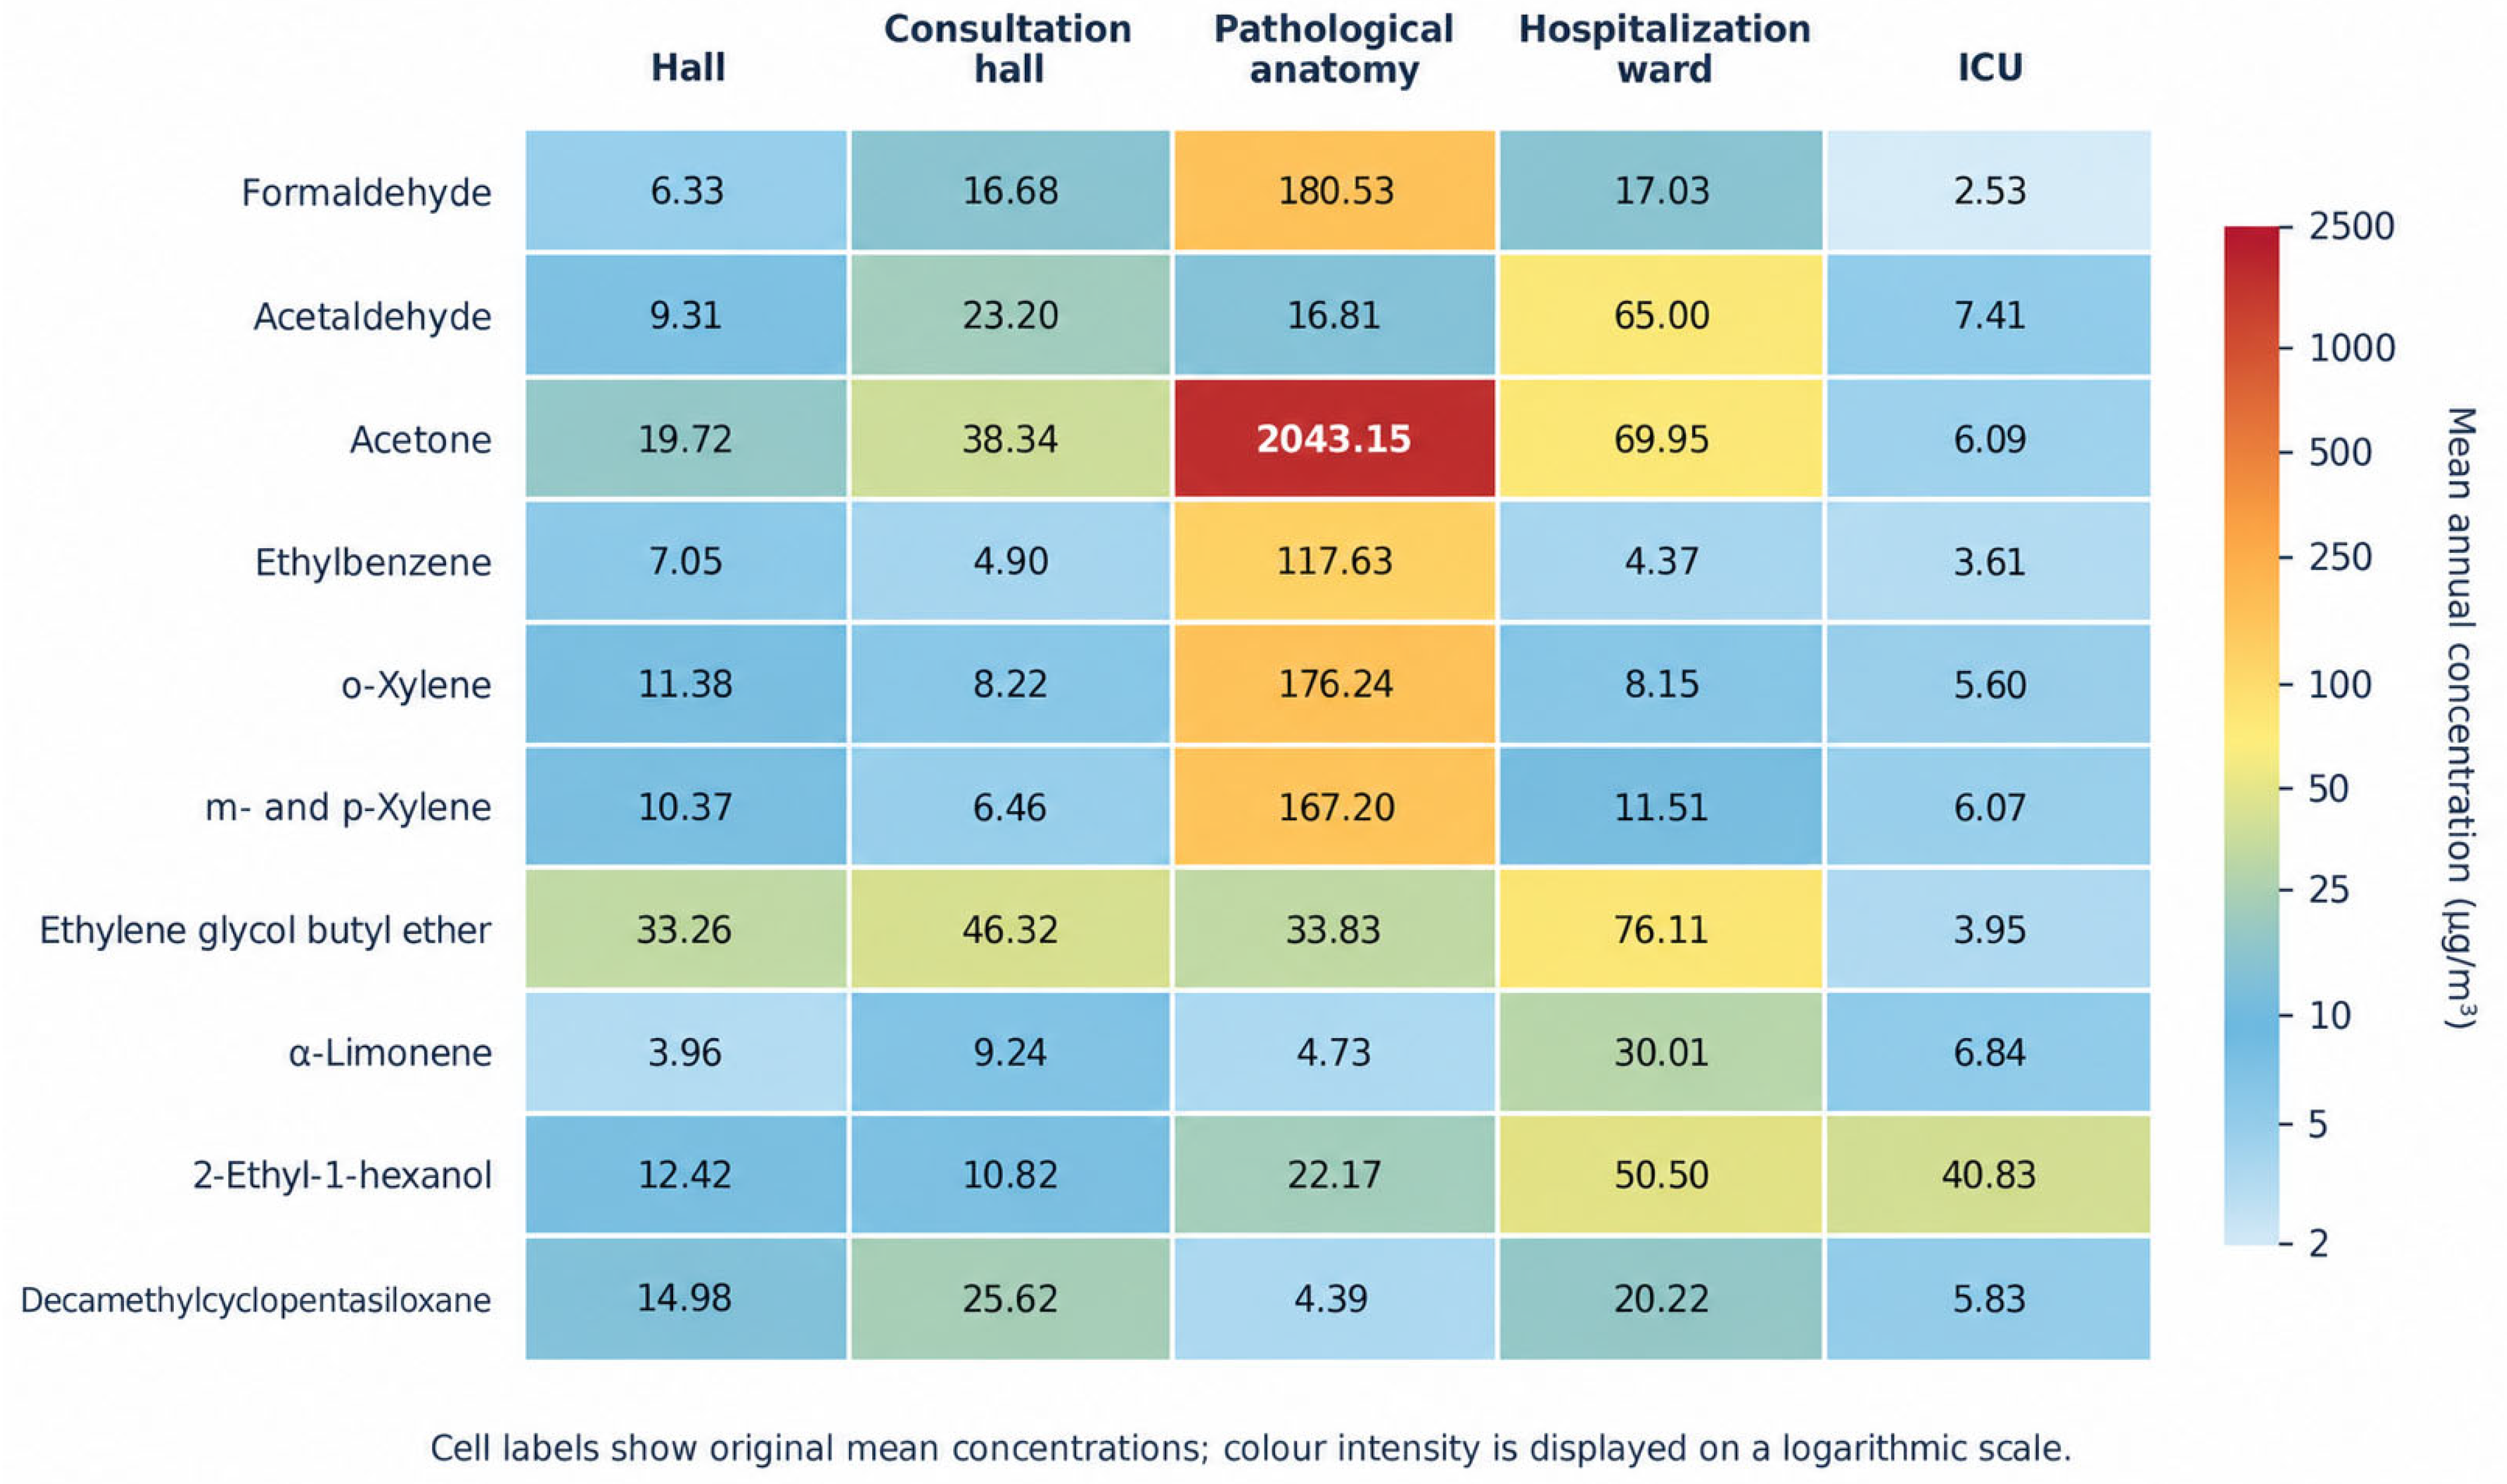
Targeted chemical sampling revealed marked spatial differences in the mean concentrations of selected VOCs and aldehydes across hospital environments during the annual sampling period from June 2023 to May 2024 (Figure 4). The pathological anatomy laboratory showed the clearest chemical signature, with substantially higher concentrations of acetone (2043.15 µg/m3), formaldehyde (180.53 µg/m3), ethylbenzene (117.63 µg/m3), and xylenes (167.20–176.24 µg/m3) than the other monitored areas. This profile was consistent with the use of chemicals and solvents associated with laboratory activities and material processing.
The hospitalization ward presented a different chemical profile, with the highest mean concentrations of acetaldehyde (65.00 µg/m3), ethylene glycol butyl ether (76.11 µg/m3), α-limonene (30.01 µg/m3), and 2-ethyl-1-hexanol (50.50 µg/m3) among the monitored areas. These compounds may reflect a combination of cleaning and disinfection products, indoor materials, and routine activities, although the present analysis did not allow individual sources to be conclusively identified. The hall and outpatient consultation area generally showed intermediate concentrations, whereas the ICU presented comparatively low concentrations for most of the selected compounds. However, 2-ethyl-1-hexanol remained relatively elevated in the ICU (40.83 µg/m3), indicating that its chemical profile was not uniformly lower for every compound.
These results demonstrate that VOC and aldehyde concentrations were strongly dependent on hospital function and local operational conditions and were broadly consistent with the area specific patterns observed through continuous monitoring. Median concentrations, concentration ranges (minimum–maximum), and the number of observations for each selected compound and hospital environment are provided in Supplementary Table S4.
Targeted sampling supported the presence of process related chemical sources in the pathological anatomy laboratory, where higher annual mean concentrations of formaldehyde, acetone, ethylbenzene and xylenes were observed. Overall, the chemical sampling results were consistent with the spatial patterns identified by continuous monitoring, particularly in the hospitalization ward and ICU. However, both approaches captured complementary dimensions of IAQ: targeted sampling identified and quantified individual compounds, whereas continuous monitoring provided the temporal context needed to detect seasonal accumulation, recurrent short-duration events and area specific variability. This was especially relevant for CH2O in the outpatient consultation area, where annual mean concentrations did not fully reflect the summer and early morning temporal patterns indicated by continuous monitoring. Additional seasonal hourly CH2O profiles supporting these temporal patterns are provided in Supplementary Figure S2.
A total of 147 temporally concurrent, area matched comparisons between continuous CH2O measurements and DNPH/HPLC determinations, covering 17 of the 18 sensors, showed variable agreement over the reference covered period, with an increasing tendency toward sensor under response during the later campaigns. This behaviour remained apparent when comparisons were restricted to similar reference concentration ranges, indicating that changes in ambient CH2O concentration alone were insufficient to explain the observed temporal differences. However, because measurements were area matched rather than strictly co-located and reference measurements covered only part of the complete monitoring period, these findings were not used to derive a retrospective correction of the continuous measurements.

3.3.2. Decoupling and Implications for Operational IAQ Management

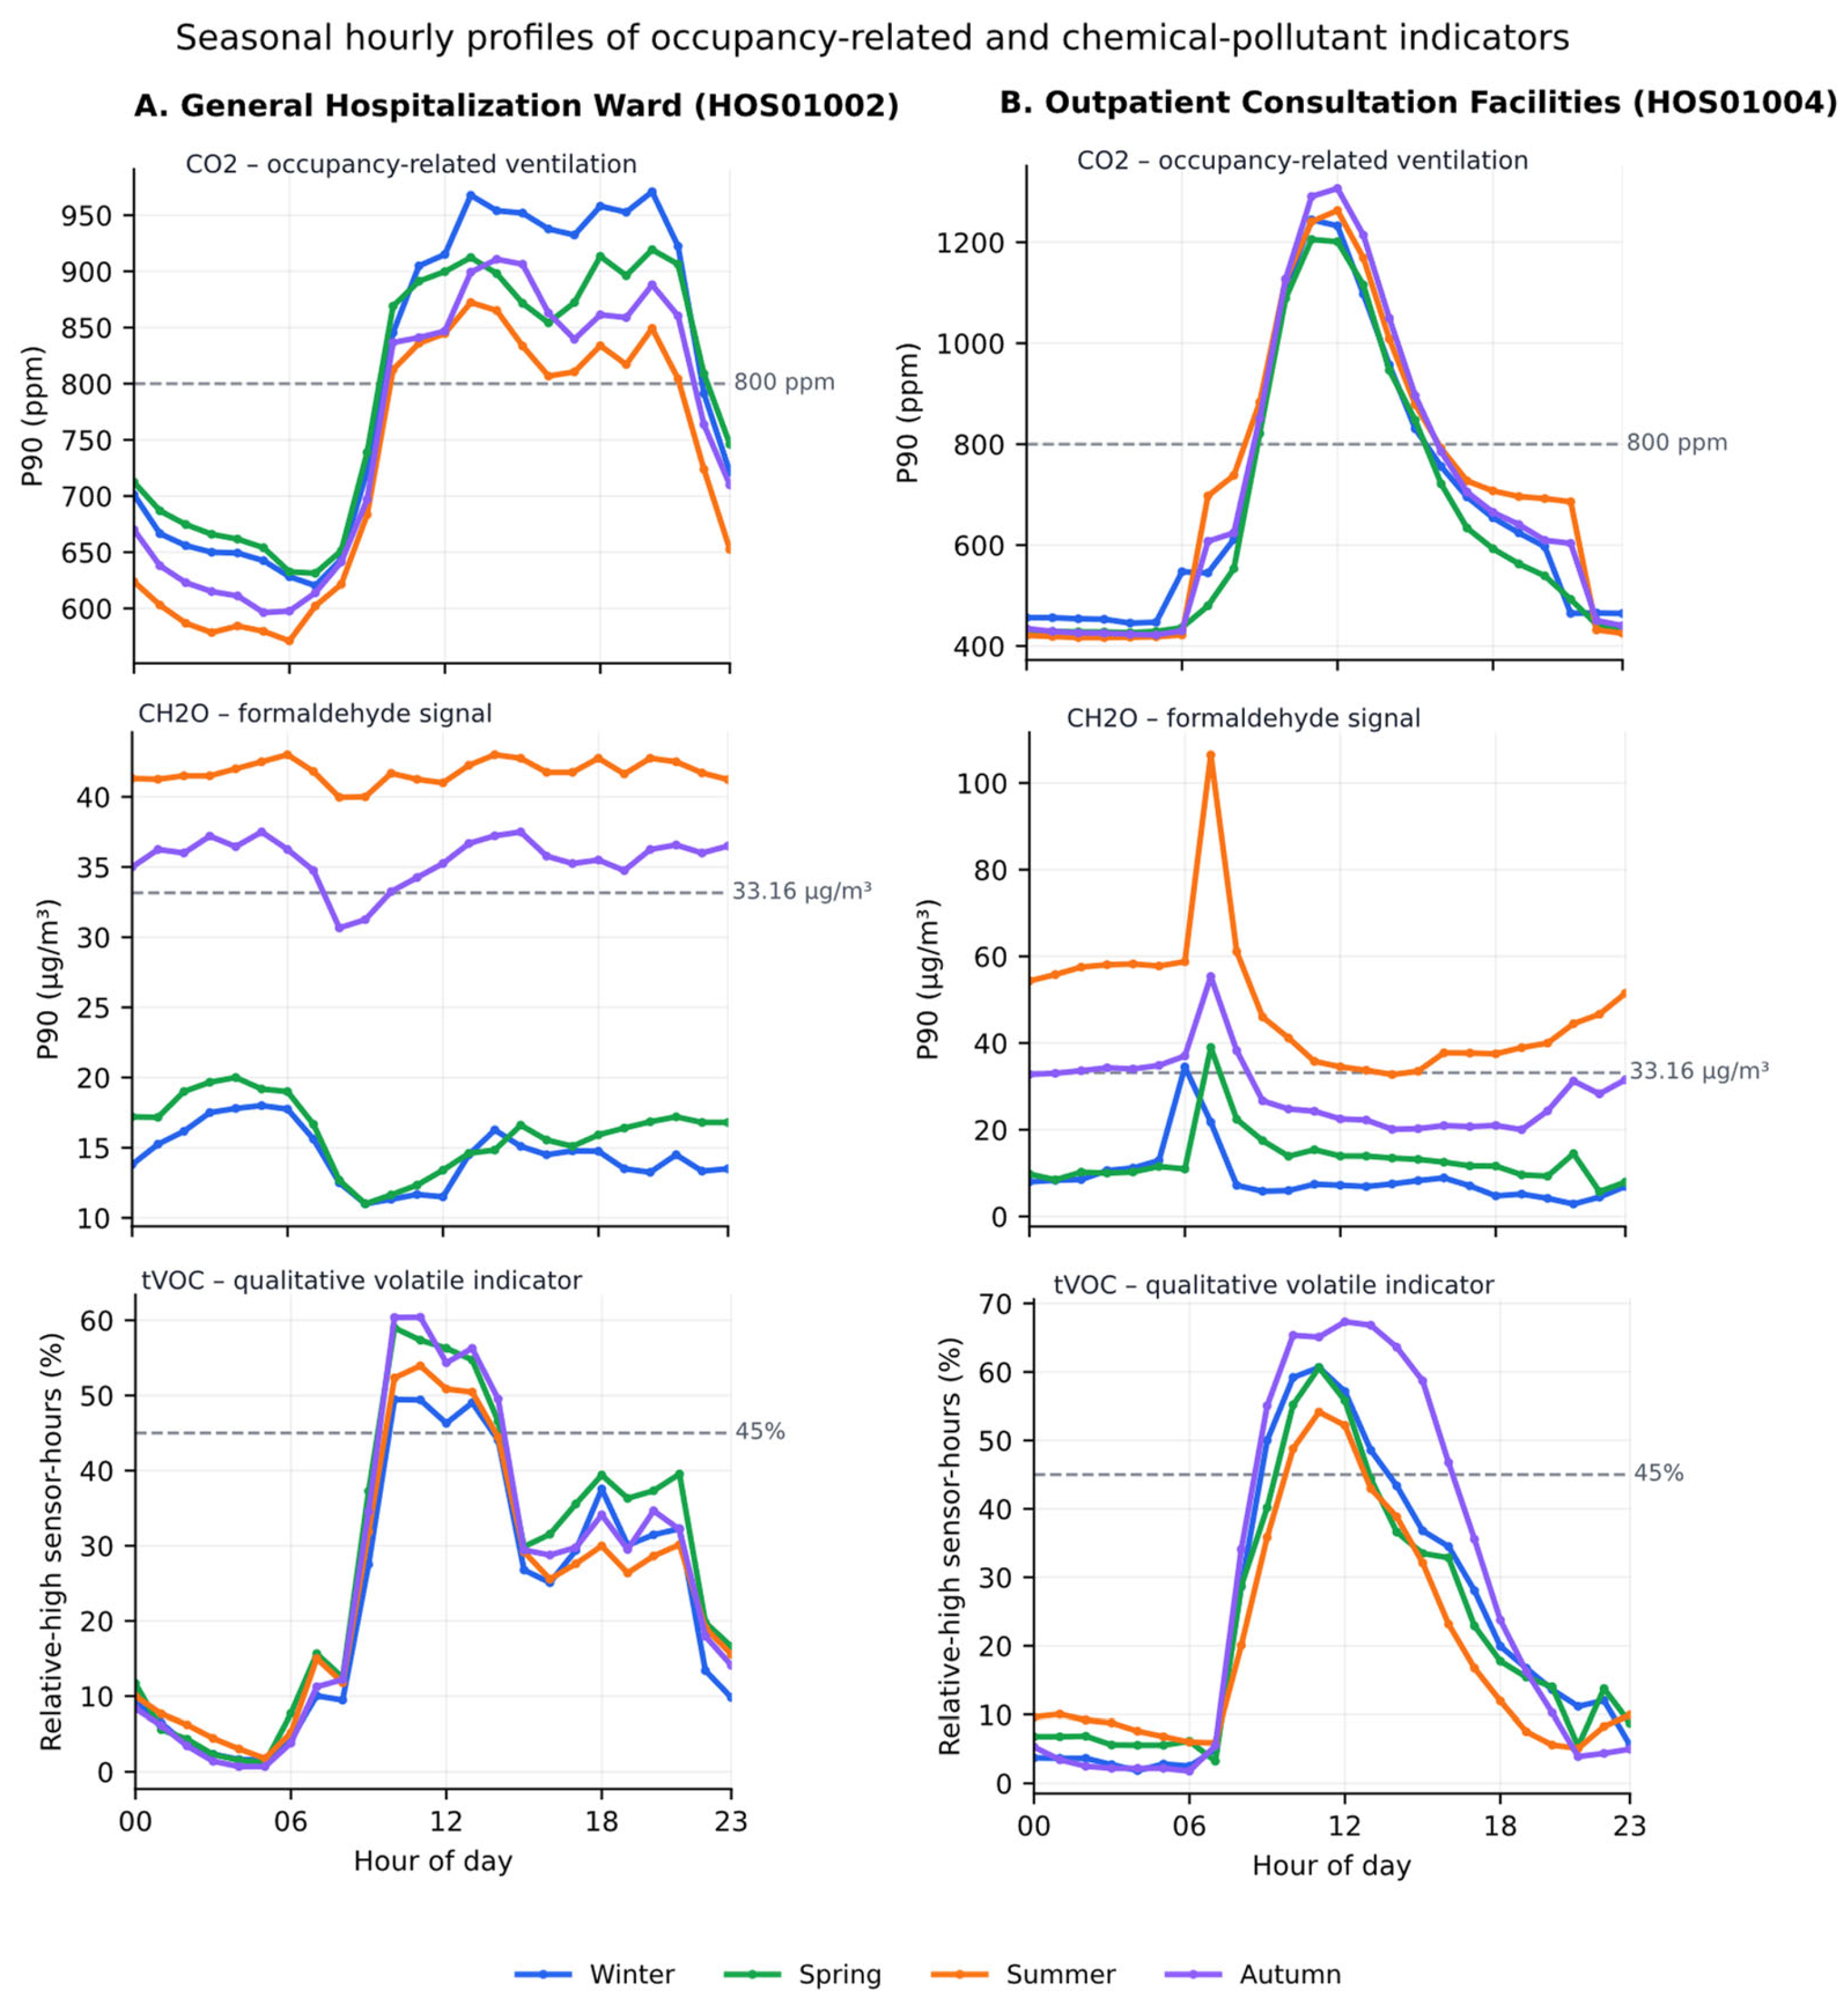
Representative hourly profiles revealed recurrent situations in which occupancy related ventilation indicators suggested acceptable IAQ conditions while volatile pollutant accumulation remained elevated (Figure 5). Although the analysis was performed across all seasons, the clearest decoupling patterns were identified during summer and were therefore selected as representative examples in Figure 5. In particular, outpatient consultation facilities showed a pronounced summer pattern, where CO2 P90 concentrations remained below the GO IAQS “Good” threshold and less than 5% of hours were outside the “Good” category, while the CH2O P90 at 07:00 reached 106.5 µg/m3 and 54.2% of the corresponding sensor-hour observations were outside the ‘Good’ category (Supplementary Table S3). These CH2O values and threshold-based frequencies should be interpreted considering the long-term sensor response uncertainty described above; accordingly, the decoupling analysis is used primarily to identify contrasting temporal patterns between occupancy related CO2 dynamics and chemical pollutant signals rather than to provide a precise estimate of CH2O threshold exceedance.
A similar pattern was observed in the hospitalization ward, particularly during summer nighttime and early morning periods, when elevated CH2O sensor signals and relative TVOC signals occurred without corresponding increases in CO2 (Figure 5). In contrast, the ICU exhibited comparatively stable CO2 and CH2O profiles and limited evidence of recurrent decoupling; the corresponding seasonal multi-parameter profiles are provided in Supplementary Figure S4.
CO2 therefore provided information on occupancy related ventilation demand, whereas CH2O and qualitative TVOC signals provided complementary information on chemical pollutant patterns that CO2 monitoring alone could not identify. Consequently, CO2 based ventilation control alone may be insufficient in areas affected by emissions from materials, cleaning and disinfection activities, or process specific chemical sources. The combined interpretation of these parameters can help detect different types of non-optimal IAQ conditions and support pollutant and area specific operational responses.
Based on these complementary findings, Table 2 summarizes the main measurement supported observations, their operational interpretation, and potential BMS supported responses for each hospital environment. These responses should be regarded as evidence informed recommendations rather than interventions validated within the present study. BMS integration may support trend detection, pollutant specific alerts, ventilation scheduling, and verification of corrective measures. However, these responses should complement—not replace—source control, local extraction, and targeted investigation where persistent chemical contamination is identified.

3.4. Microbiological Characterization

Airborne microbiome characterization was used as an exploratory complement to the physicochemical IAQ assessment. Overall bacterial and fungal community composition showed substantial similarity across the sampled hospital environments, with no significant differences in community structure or richness among hospital subzones. Bacterial community composition, however, showed a significant association with seasonality, suggesting that temporal environmental variability may have exerted a stronger influence than spatial compartmentalization within the hospital.
A more operationally relevant distinction emerged when areas were grouped according to environmental control and human influence. Corridors and waiting rooms showed higher relative abundances of Gram-positive bacteria than more controlled environments, including hospitalization areas and pathological anatomy laboratories. These differences are shown in Supplementary Figures S5 and S6, including the comparison between controlled and non-controlled hospital environments. This pattern is consistent with a greater contribution of occupancy associated microbial sources in highly transited spaces. These results are interpreted as contextual environmental information rather than indicators of pathogen presence or nosocomial infection risk; detailed microbiome characterization is provided in the Supplementary Material and will be reported separately.

4. Discussion

4.1. Dynamic and Pollutant Specific IAQ Behaviour in Healthcare Environments

The results of this study highlight the importance of time resolved IAQ assessment for understanding pollutant behaviour in complex healthcare environments. Although average concentrations frequently remained within acceptable IAQ ranges, detailed temporal analyses revealed recurrent short-term exposure events, seasonal accumulation patterns, and pollutant specific operational behaviours that would have remained masked using aggregated metrics alone.
The monitored hospital microenvironments exhibited clearly differentiated pollutant dynamics associated with occupancy patterns, ventilation conditions, and local emission sources related to specific tasks and processes. CO2 showed strong occupancy related temporal signatures, especially in waiting and consultation areas characterized by fluctuating ventilation demand. In contrast, formaldehyde displayed more persistent sensor based temporal patterns in selected hospitalization rooms and outpatient consultation spaces, compatible with chemical accumulation occurring independently of occupancy related CO2 dynamics. PM2.5 concentrations generally remained low and stable, although localized short-term peaks were identified in selected operational areas.
These findings demonstrate that different IAQ parameters capture complementary aspects of indoor environmental quality and should not be interpreted interchangeably. While CO2 primarily reflects occupancy related ventilation adequacy, volatile compounds and aldehydes provide additional information regarding indoor emissions, cleaning activities, and pollutant accumulation processes not directly associated with occupancy intensity [38]. Several monitored spaces exhibited acceptable CO2 concentrations while simultaneously showing persistent formaldehyde elevations and volatile accumulation patterns, indicating that occupancy related indicators alone may not fully represent IAQ conditions in healthcare environments.
The integration of continuous monitoring with targeted chemical characterization substantially improved the interpretation of pollutant dynamics across the monitored areas. Stable sensor profiles observed in the ICU were coherent with the low VOC burden and homogeneous chemical composition identified through targeted sampling, whereas laboratory and hospitalization areas exhibiting recurrent formaldehyde accumulation also showed differentiated aldehyde and solvent related chemical signatures. Together, these results support the concept that IAQ conditions in hospitals should be interpreted as dynamic and multidimensional phenomena rather than as isolated concentration measurements.
The main contribution of the present study is therefore not the general demonstration that hospital IAQ requires multi-parameter assessment, but the long-term identification of distinct pollutant and function specific operational signatures under real hospital conditions and the characterization of recurrent situations in which occupancy related ventilation demand and chemical pollutant accumulation become temporally decoupled.
The exposure relevance of the observed IAQ patterns may also differ among hospital occupants. Patients may include individuals with pre-existing health conditions and potentially greater susceptibility to poor IAQ, while their exposure duration may range from a few hours during outpatient visits to several days during hospitalization. Hospital staff, in contrast, may experience repeated exposure during working shifts over substantially longer occupational periods. Consequently, the area specific pollutant patterns identified in this study should be interpreted not only in terms of pollutant concentration but also considering the duration and frequency of occupancy. However, the present study was based on area level environmental monitoring and did not include individual time–activity patterns, personal exposure measurements, clinical outcomes, or physiological or psychological stress indicators. Therefore, individual health effects, occupational stress, and quantitative exposure differences between patients and staff cannot be inferred from these data. Future studies integrating long-term IAQ monitoring with personal exposure, time–activity, clinical, symptom, well-being, or occupational information would enable these relationships to be investigated.

4.2. Implications for Adaptive Ventilation Management and Hospital BMS Operation

The results obtained in this study demonstrate the potential of continuous multi-parameter IAQ monitoring to support more adaptive and operationally oriented ventilation management strategies in healthcare environments. This interpretation is consistent with previous studies highlighting the potential of continuous sensor networks and smart building approaches to support real-time environmental monitoring, building operation, and more responsive indoor environmental management [22,39]. In particular, sensor-based demand-controlled ventilation strategies have demonstrated the potential to dynamically adapt ventilation operation to real-time indoor conditions while maintaining adequate IAQ and improving energy efficiency [39]. Beyond their use as descriptive monitoring tools, the deployed sensor networks provided high temporal resolution information capable of identifying recurrent pollutant accumulation periods, occupancy driven ventilation demand, localized emission events, and pollutant specific operational behaviours across different hospital microenvironments. While most implemented demand-controlled ventilation approaches rely primarily on CO2 or occupancy as control variables, the integration of multi-pollutant sensing has been identified as an important next step towards more comprehensive IAQ management [39]. In this context, the pollutant specific and spatially heterogeneous patterns observed in the present study indicate that CO2 alone may not adequately represent the IAQ conditions relevant for operational management across all hospital areas.
The observed temporal signatures suggest that different hospital areas may require differentiated ventilation management approaches depending on their dominant IAQ drivers. Waiting and consultation areas were characterized primarily by occupancy related CO2 dynamics, indicating that these spaces may benefit from demand-controlled ventilation strategies responsive to fluctuating occupancy conditions. In contrast, hospitalization rooms and laboratory associated spaces exhibited more persistent volatile pollutant accumulation patterns, suggesting that occupancy-based ventilation control alone may be insufficient in environments influenced by continuous indoor emission sources or operational activities.
These findings support the transition from static ventilation approaches toward more flexible IAQ management frameworks integrating multiple environmental indicators simultaneously. The combined interpretation of CO2, formaldehyde, PM2.5, and qualitative TVOC signals may allow building management systems (BMS) to better distinguish between overcrowding events, ventilation limitations, transient operational activities, and persistent chemical accumulation scenarios. The recurrent temporal patterns identified through heatmaps and hourly profiles additionally suggest the potential for predictive and preventive IAQ management strategies, including ventilation schedule optimization, anomaly detection, and prioritization of corrective actions in sensitive hospital areas, supporting the consideration of localized ventilation, source control, or extraction strategies where persistent process related pollutant emissions are identified.
Overall, the findings support the concept that continuous multi-parameter IAQ monitoring may serve as a practical foundation for next generation hospital IAQ management systems combining occupancy indicators with pollutant specific environmental information to implement more adaptive, exposure oriented, and operationally efficient ventilation strategies.

4.3. Integrated IAQ Monitoring Frameworks for Healthcare Environments

The present study highlights the value of combining continuous sensor monitoring with targeted chemical and biological characterization for IAQ assessment in complex healthcare environments. While each methodological approach independently provides useful environmental information, their integration enabled a more comprehensive interpretation of pollutant dynamics, operational IAQ patterns, and potential exposure scenarios across the monitored hospital microenvironments.
Continuous monitoring provided the temporal resolution necessary to identify recurrent pollutant accumulation periods, occupancy driven ventilation demand, seasonal variability, and short-term operational events that would have been difficult to capture through isolated sampling campaigns alone. In parallel, targeted VOC and aldehyde characterization provided contextual information regarding pollutant composition and dominant emission sources associated with different hospital activities, substantially improving the interpretation of qualitative TVOC signals and recurrent volatile accumulation patterns.
From an operational perspective, the proposed framework aligns closely with emerging IAQ 4.0 concepts, where continuous environmental monitoring supports actionable building management, adaptive ventilation strategies, and exposure oriented environmental control. Importantly, the methodology presented in this study was implemented using commercially available monitoring technologies and reproducible analytical workflows under real hospital operating conditions, supporting its practical applicability within healthcare environments.

4.4. Limitations and Future Work

Several limitations should be considered when interpreting the results of this study. First, the monitoring strategy relied primarily on commercially available low-cost sensor (LCS) devices operating under real hospital conditions. Although these technologies provide important advantages in terms of scalability, temporal resolution, and operational deployment, they also present known limitations related to sensor drift, environmental sensitivity, cross-interferences, and reduced analytical specificity compared with reference grade instrumentation. In particular, an exploratory retrospective comparison with the available DNPH/HPLC determinations suggested a progressive change in apparent CH2O sensor response during the reference covered period. This behaviour may reflect a combination of time-related response change, concentration dependent response, spatial differences between continuous and reference measurements, and potentially previous high-exposure conditions. The available data were insufficient to separate these effects or derive a validated retrospective correction. Consequently, absolute CH2O concentrations and small temporal differences should be interpreted cautiously. However, the predominantly decreasing apparent response over time would be expected to attenuate rather than generate later concentration elevations and was considered insufficient, by itself, to explain the main recurrent temporal patterns identified in the continuous dataset. Consequently, the continuous sensor measurements should be interpreted primarily from a temporal and operational perspective rather than as high-precision analytical measurements.
Particular caution is required when interpreting TVOC measurements. Changes in sensor scaling and firmware implementation during the monitoring campaign limited direct quantitative comparability across the entire study period. For this reason, TVOC data were interpreted qualitatively as indicators of volatile accumulation dynamics rather than as quantitative measurements of total VOC concentrations. Nevertheless, the integration of targeted chemical characterization substantially improved the contextual interpretation of these signals.
Another limitation relates to the spatial representativeness of the monitoring network. Although multiple hospital microenvironments were included over an extended monitoring period, some areas were represented by a limited number of sensors or exhibited lower temporal coverage. To minimize potential biases, a dedicated QA/QC and sensor coverage assessment framework was applied, and temporal coverage was explicitly considered when interpreting sensor level and temporal patterns; sensors with limited coverage were not treated as equally representative of the full monitoring period.
The targeted chemical and microbiological campaigns additionally represented discrete snapshots of environmental conditions and therefore could not fully capture the complete temporal variability of pollutant composition or airborne microbial dynamics. While pairing these campaigns with continuous monitoring substantially improved contextual interpretation, future studies incorporating higher frequency chemical characterization and emerging real-time or near-real-time approaches for bioaerosol and microbiome monitoring may further strengthen the understanding of hospital IAQ dynamics. Dedicated study designs would nevertheless be required to link these measurements with infection control or clinical risk outcomes.
Future work should additionally explore the integration of continuous IAQ monitoring with real-time BMS operation and adaptive ventilation control strategies. The recurrent temporal patterns identified in this study suggest that predictive and exposure-oriented ventilation management approaches may be feasible using multi-parameter IAQ datasets combined with machine learning techniques, anomaly detection algorithms, and predictive occupancy modelling.

5. Conclusions

This long-term study demonstrated the value of combining continuous multi-parameter IAQ monitoring with targeted chemical characterization to identify pollutant and function specific environmental patterns within a hospital under routine operating conditions. Despite generally acceptable aggregated IAQ conditions, time-resolved analysis revealed recurrent patterns that differed substantially among hospital areas and pollutants. CO2 primarily reflected occupancy-related ventilation demand, PM2.5 elevations were generally episodic, and CH2O showed stronger seasonal and sensor level heterogeneity, including recurrent accumulation during periods when CO2 remained within the Good category. Targeted VOC and aldehyde measurements provided complementary chemical information that supported the interpretation of these continuous monitoring patterns.
The specific pollutant concentrations and temporal patterns observed in this hospital should not be directly generalized to other healthcare facilities, as they depend on building characteristics, ventilation systems, occupancy, materials, cleaning practices, and operational conditions. However, the monitoring approach and the identification of distinct operational IAQ signatures are transferable concepts. The results show that long-term monitoring can be used to establish area specific IAQ baselines, identify recurrent non-optimal conditions that may be obscured by aggregated metrics, and determine which environmental indicators are most informative for different hospital functions.
These findings provide an evidence base for moving from uniform or predominantly CO2 based monitoring toward area and pollutant specific IAQ management. Integration of appropriate environmental indicators with hospital BMS could support pollutant specific alerts, ventilation scheduling, source investigation, and verification of corrective actions. Prospective studies incorporating direct ventilation measurements and intervention testing are required to validate such control strategies and determine their effectiveness in different healthcare settings.


Supplementary Materials

The following supporting information can be downloaded at https://www.mdpi.com/article/10.3390/atmos17090895/s1. Table S1: Hospital areas and continuous monitoring coverage; Table S2: Sensor-specific monitoring periods and temporal coverage; Table S3: Selected representative decoupling cases; Table S4: Median and range concentrations of selected VOCs and aldehydes across the five hospital environments; Figure S1: Seasonal hourly CO2 profiles across the five monitored hospital areas; Figure S2: Seasonal hourly CH2O profiles across the five monitored hospital areas; Figure S3: Seasonal hourly PM2.5 profiles across the five monitored hospital areas; Figure S4: Multi-parameter seasonal hourly profiles for the Intensive Care Unit (ICU), included as a comparatively stable reference area; Figure S5: Relative abundance of Gram-positive bacteria across hospital subzones and control samples; Figure S6: Relative abundance of Gram-positive bacteria in controlled and non-controlled hospital environments.

Author Contributions

Conceptualization, J.F., A.R., J.D., M.F., M.S., C.M. and R.G.-C.; methodology, J.F., A.R. and R.G.-C.; validation, M.S., F.L. and F.R.; formal analysis, S.R.-S., S.V. and R.G.-C.; investigation, J.F., S.R.-S., A.R., S.S., J.D., C.P.-S., M.F., M.S., F.L., F.R., C.M., S.V. and R.G.-C.; resources, J.D., M.F., S.V., M.S., F.L. and F.R.; data curation, J.F., A.R., C.P.-S. and R.G.-C.; writing—original draft preparation, J.F., A.R., C.P.-S. and R.G.-C.; writing—review and editing, J.F., S.R.-S., A.R., S.S., J.D., C.P.-S., M.F., M.S., F.L., F.R., C.M., S.V. and R.G.-C.; supervision, J.D., M.F., S.V., M.S., F.L. and F.R.; project administration, J.F. and S.R.-S.; funding acquisition, J.F. and S.R.-S. All authors have read and agreed to the published version of the manuscript.

Funding

The K-HEALTHinAIR project funded this study, Grant Agreement No. 101057693, under a European Union’s Call on Environment and Health (HORIZONHLTH-2021-ENVHLTH-02).

Institutional Review Board Statement

Views and opinions expressed are, however, those of the authors only and do not necessarily reflect those of the European Union or the European Health and Digital Executive Agency as granting authority. Neither the European Union nor the granting authority can be held responsible.

Informed Consent Statement

Not applicable.

Data Availability Statement

The datasets generated and analyzed during the present study are publicly available in the Zenodo repository at https://zenodo.org/records/21526988 (accessed on 28 August 2026). The Python workflow used for sensor-data processing and generation of the principal analytical outputs is also publicly available in Zenodo at [https://doi.org/10.5281/zenodo.22141208].

Acknowledgments

The authors would like to thank all colleagues and partners involved in the K-HEALTHinAIR project for their valuable collaboration and for fostering a constructive and supportive working environment that has greatly contributed to the development of this research. The authors also acknowledge the exchange of knowledge and collaborative activities promoted through the IDEAL Cluster and its participating projects. Particular thanks are extended to Sotirios Papathanasiou for his valuable support and guidance regarding the application and interpretation of the GO IAQS methodology.

Conflicts of Interest

Author María Figols was employed by the company inBiot Monitoring. The remaining authors declare that the research was conducted in the absence of any commercial or financial relationships that could be construed as a potential conflict of interest.

Abbreviations

The following abbreviations are used in this manuscript:
BMSBuilding Management System
CH2OFormaldehyde
CO2Carbon dioxide
DNADeoxyribonucleic acid
GO IAQSGlobal Open Indoor Air Quality Standards
HCBHospital Clínic de Barcelona
HPLCHigh-performance liquid chromatography
I/OIndoor-to-outdoor ratio
IAQIndoor air quality
ICUIntensive care unit
IoTInternet of Things
ITSInternal transcribed spacer
LCSLow-cost sensor
MOXMetal-oxide sensor
NDIRNon-dispersive infrared
PCAPrincipal Component Analysis
PMParticulate matter
PM1Particulate matter with an aerodynamic diameter ≤ 1 µm
PM2.5Particulate matter with an aerodynamic diameter ≤ 2.5 µm
PM10Particulate matter with an aerodynamic diameter ≤ 10 µm
QA/QCQuality assurance and quality control
rRNARibosomal ribonucleic acid
TD-GC/MSThermal desorption–gas chromatography/mass spectrometry
TVOCTotal volatile organic compounds
VOCVolatile organic compound

References

  1. World Health Organization (WHO). WHO Guidelines for Indoor Air Quality: Selected Pollutants; WHO Regional Office for Europe: Copenhagen, Denmark, 2010. [Google Scholar]
  2. Tsai, W.-T. An overview of health hazards of volatile organic compounds regulated as indoor air pollutants. Rev. Environ. Health 2019, 34, 81–89. [Google Scholar] [CrossRef] [Scilit]
  3. Le Cann, P.; Bonvallot, N.; Glorennec, P.; Deguen, S.; Goeury, C.; Le Bot, B. Indoor environment and children’s health: Recent developments in chemical, biological, physical and social aspects. Int. J. Hyg. Environ. Health 2012, 215, 1–18. [Google Scholar] [CrossRef] [Scilit]
  4. Ibrahim, F.; Samsudin, E.Z.; Ishak, A.R.; Sathasivam, J. Hospital indoor air quality and its relationships with building design, building operation, and occupant-related factors: A mini-review. Front. Public Health 2022, 10, 1067764. [Google Scholar] [CrossRef] [Scilit]
  5. Leung, M.H.Y.; Chan, A.H.S. Control and management of hospital indoor air quality. Med. Sci. Monit. 2006, 12, SR17–SR23. [Google Scholar]
  6. Bessonneau, V.; Mosqueron, L.; Berrubé, A.; Mukensturm, G.; Buffet-Bataillon, S.; Gangneux, J.-P.; Thomas, O. VOC contamination in hospital, from stationary sampling of a large panel of compounds, in view of healthcare workers and patients exposure assessment. PLoS ONE 2013, 8, e55535. [Google Scholar] [CrossRef] [Scilit]
  7. Stockwell, R.E.; Ballard, E.L.; O’Rourke, P.; Knibbs, L.D.; Morawska, L.; Bell, S.C. Indoor hospital air and the impact of ventilation on bioaerosols: A systematic review. J. Hosp. Infect. 2019, 103, 175–184. [Google Scholar] [CrossRef] [Scilit]
  8. Baurès, E.; Blanchard, O.; Mercier, F.; Surget, E.; Le Cann, P.; Rivier, A.; Gangneux, J.-P.; Florentin, A. Indoor air quality in two French hospitals: Measurement of chemical and microbiological contaminants. Sci. Total Environ. 2018, 642, 168–179. [Google Scholar] [CrossRef] [Scilit]
  9. European Commission. Communication from the Commission on the EU Action Plan: Towards Zero Pollution for Air, Water and Soil; European Commission: Brussels, Belgium, 2021. [Google Scholar]
  10. European Parliament and Council of the European Union. Directive (EU) 2024/1275 of 24 April 2024 on the energy performance of buildings (recast). Off. J. Eur. Union 2024, L 2024/1275, 8.5.2024. [Google Scholar]
  11. Baudet, A.; Baurès, E.; Guegan, H.; Blanchard, O.; Guillaso, M.; Le Cann, P.; Gangneux, J.-P.; Florentin, A. Indoor air quality in healthcare and care facilities: Chemical pollutants and microbiological contaminants. Atmosphere 2021, 12, 1337. [Google Scholar] [CrossRef] [Scilit]
  12. Hwang, S.-H.; Roh, J.; Park, W.-M. Evaluation of PM10, CO2, airborne bacteria, TVOCs, and formaldehyde in facilities for susceptible populations in South Korea. Environ. Pollut. 2018, 242, 700–708. [Google Scholar] [CrossRef] [Scilit]
  13. Mandin, C.; Trantallidi, M.; Cattaneo, A.; Canha, N.; Mihucz, V.G.; Szigeti, T.; Mabilia, R.; Perreca, E.; Spinazzè, A.; Fossati, S.; et al. Assessment of indoor air quality in office buildings across Europe—The OFFICAIR study. Sci. Total Environ. 2017, 579, 169–178. [Google Scholar] [CrossRef] [Scilit]
  14. Guo, K.; Qian, H.; Ye, J.; Sun, F.; Zhuge, Y.; Wang, S.; Liu, C.; Cao, G.; Zheng, X. Assessment of airborne bacteria and fungi in different-type buildings in Nanjing, a hot summer and cold winter moist Chinese city. Build. Environ. 2021, 205, 108258. [Google Scholar] [CrossRef] [Scilit]
  15. ISO 16000-1; Indoor Air—Part 1: General Aspects of Sampling Strategy. International Organization for Standardization: Geneva, Switzerland, 2004.
  16. Fanti, G.; Spinazzè, A.; Borghi, F.; Rovelli, S.; Campagnolo, D.; Keller, M.; Borghi, A.; Cattaneo, A.; Cauda, E.; Cavallo, D.M. Evolution and applications of recent sensing technology for occupational risk assessment: A rapid review of the literature. Sensors 2022, 22, 4841. [Google Scholar] [CrossRef] [Scilit]
  17. Schneider, P.; Castell, N.; Vogt, M.; Dauge, F.R.; Lahoz, W.A.; Bartonova, A. Mapping urban air quality in near real time using observations from low-cost sensors and model information. Environ. Int. 2017, 106, 234–247. [Google Scholar] [CrossRef] [Scilit]
  18. Kumar, P.; Skouloudis, A.N.; Bell, M.; Viana, M.; Carotta, M.C.; Biskos, G.; Morawska, L. Real-time sensors for indoor air monitoring and challenges ahead in deploying them to urban buildings. Sci. Total Environ. 2016, 560–561, 150–159. [Google Scholar] [CrossRef] [Scilit]
  19. Colas, A.; Baudet, A.; Le Cann, P.; Blanchard, O.; Gangneux, J.-P.; Baurès, E.; Florentin, A. Quantitative health risk assessment of the chronic inhalation of chemical compounds in healthcare and elderly care facilities. Toxics 2022, 10, 141. [Google Scholar] [CrossRef] [Scilit]
  20. Fan, H.-Y.; Lin, J.-P.; Yang, T.-A.; Tsao, Y.-C. Health effects of low-dose formaldehyde exposure: A cross-sectional study in occupational settings. Int. J. Occup. Med. Environ. Health 2025, 38, 236–248. [Google Scholar] [CrossRef] [Scilit]
  21. Chojer, H.; Branco, P.T.B.S.; Martins, F.G.; Alvim-Ferraz, M.C.M.; Sousa, S.I.V. Development of low-cost indoor air quality monitoring devices: Recent advancements. Sci. Total Environ. 2020, 727, 138385. [Google Scholar] [CrossRef] [Scilit]
  22. Silva, G.; Duarte, J.; Baptista, J.S.; Rufo, J.C. Low-cost sensors for indoor air quality monitoring: A systematic review of accuracy, applications, and limitations. J. Air Waste Manag. Assoc. 2026, 76, 315–341. [Google Scholar] [CrossRef] [Scilit]
  23. Castell, N.; Dauge, F.R.; Schneider, P.; Vogt, M.; Lerner, U.; Fishbain, B.; Broday, D.; Bartonova, A. Can commercial low-cost sensor platforms contribute to air quality monitoring and exposure estimates? Environ. Int. 2017, 99, 293–302. [Google Scholar] [CrossRef] [Scilit]
  24. Lewis, A.; Edwards, P. Validate personal air-pollution sensors. Nature 2016, 535, 29–31. [Google Scholar] [CrossRef] [Scilit]
  25. Dai, H.; Zhao, B. Association of the infection probability of COVID-19 with ventilation rates in confined spaces. Build. Simul. 2020, 13, 1321–1327. [Google Scholar] [CrossRef] [Scilit]
  26. Peng, Z.; Jimenez, J.L. Exhaled CO2 as a COVID-19 infection risk proxy for different indoor environments and activities. Environ. Sci. Technol. Lett. 2021, 8, 392–397. [Google Scholar] [CrossRef] [Scilit]
  27. Aguado, A.; Rodríguez-Sufuentes, S.; Verdugo, F.; Rodríguez-López, A.; Figols, M.; Dalheimer, J.; Gómez-López, A.; González-Colom, R.; Badyda, A.; Fermoso, J. Verification and usability of indoor air quality monitoring tools in the framework of health-related studies. Air 2025, 3, 3. [Google Scholar] [CrossRef] [Scilit]
  28. González-Colom, R.; Gómez-López, A.; Aguado, A.; Soler, N.; Sánchez-Ruano, N.; Sorribes, M.; Montilla-Ibarra, A.; Figols, M.; Rodríguez, A.; Vela, E.; et al. Should household air quality monitoring be considered in selected patients with asthma and COPD? BMJ Open Respir. Res. 2026, 13, e003899. [Google Scholar] [CrossRef] [Scilit]
  29. Woolfenden, E.A.; McClenny, W.A. Compendium Method TO-17: Determination of Volatile Organic Compounds in Ambient Air Using Active Sampling onto Sorbent Tubes; Center for Environmental Research Information, Office of Research and Development, U.S. Environmental Protection Agency: Cincinnati, OH, USA, 1999.
  30. Sousa, F.W.; Caracas, I.B.; Nascimento, R.F.; Cavalcante, R.M. Exposure and cancer risk assessment for formaldehyde and acetaldehyde in the hospitals, Fortaleza-Brazil. Build. Environ. 2011, 46, 2115–2120. [Google Scholar] [CrossRef] [Scilit]
  31. Wold, S.; Esbensen, K.; Geladi, P. Principal component analysis. Chemom. Intell. Lab. Syst. 1987, 2, 37–52. [Google Scholar] [CrossRef] [Scilit]
  32. Nunes, C.R.O.; Sánchez, B.; Gatts, C.E.N.; Almeida, C.M.S.; Canela, M.C. Evaluation of volatile organic compounds coupled to seasonality effects in indoor air from a commercial office in Madrid (Spain) applying chemometric techniques. Sci. Total Environ. 2019, 650, 868–877. [Google Scholar] [CrossRef] [Scilit]
  33. Bokulich, N.A.; Subramanian, S.; Faith, J.J.; Gevers, D.; Gordon, J.I.; Knight, R.; Mills, D.A.; Caporaso, J.G. Quality-filtering vastly improves diversity estimates from Illumina amplicon sequencing. Nat. Methods 2013, 10, 57–59. [Google Scholar] [CrossRef] [Scilit]
  34. Edgar, R.C.; Haas, B.J.; Clemente, J.C.; Quince, C.; Knight, R. UCHIME improves sensitivity and speed of chimera detection. Bioinformatics 2011, 27, 2194–2200. [Google Scholar] [CrossRef] [Scilit]
  35. Magoč, T.; Salzberg, S.L. FLASH: Fast length adjustment of short reads to improve genome assemblies. Bioinformatics 2011, 27, 2957–2963. [Google Scholar] [CrossRef] [Scilit]
  36. Wang, Y.; Guo, H.; Gao, X.; Wang, J. The intratumor microbiota signatures associate with subtype, tumor stage, and survival status of esophageal carcinoma. Front. Oncol. 2021, 11, 754788. [Google Scholar] [CrossRef] [Scilit]
  37. Papathanasiou, S. Global Open Indoor Air Quality Standards (GO IAQS): Executive Summary; Global Open Air Quality Standards (GO AQS): Cardiff, UK, 2024; Available online: https://goaqs.org/open-documents/ (accessed on 28 August 2026).
  38. Martins, C.; Teófilo, V.; Clemente, M.; Corda, M.; Fermoso, J.; Aguado, A.; Rodriguez, S.; Moshammer, H.; Kristian, A.; Ferri, M.; et al. Sources, levels, and determinants of indoor air pollutants in Europe: A systematic review. Sci. Total Environ. 2025, 964, 178574. [Google Scholar] [CrossRef] [Scilit]
  39. Chenari, B.; Saadatian, S.; da Silva Gameiro, M. Experimental assessment of demand-controlled ventilation strategies for energy efficiency and indoor air quality in office spaces. Air 2025, 3, 17. [Google Scholar] [CrossRef] [Scilit]
Figure 1. Schematic representation of the monitored hospital environments and sensor/sampling locations. The figure shows the five functional areas included in the study and the distribution of continuous MICA sensors, VOC sampling points, and microbiome sampling points. The schematic is illustrative and does not represent the exact architectural layout or scale of the hospital.
Atmosphere 17 00895 g001
Figure 2. Representative day–hour heatmaps of CO2 concentrations in (A) common spaces and waiting areas, (B) hospitalization ward, and (C) intensive care unit (ICU). Each cell represents the mean CO2 concentration recorded by the selected sensor for the corresponding hour of the day and day of the week over the study period. The annotations in the upper left corner of each panel indicate the sensor number, unique device identifier, percentage of valid data available for the period analysed, and temporal aggregation period. Colours indicate the GO IAQS categories: blue, Good (≤800 ppm); orange, Moderate (>800–1400 ppm); and red, Unhealthy (>1400 ppm).
Atmosphere 17 00895 g002
Figure 3. Summer day–hour heatmaps of mean CH2O concentrations in representative hospital areas: (A) hospitalization ward, (B) intensive care unit, and (C) outpatient consultation area. Each cell represents the mean CH2O concentration (µg/m3) for the corresponding hour of the day and day of the week during the summer monitoring period. A common continuous colour scale is used across panels to facilitate visualization of the magnitude and temporal variation in CH2O concentrations. The GO IAQS Good and Moderate upper thresholds are 33.16 and 122.81 µg/m3, respectively.
Atmosphere 17 00895 g003
Figure 4. Mean concentrations of selected VOCs and aldehydes across representative indoor hospital areas during the annual sampling period from June 2023 to May 2024. Numerical values indicate mean concentrations in µg/m3, while colour intensity represents their relative magnitude on a logarithmic scale. Compounds were selected to illustrate the principal spatial patterns relevant to the integrated hospital IAQ assessment.
Atmosphere 17 00895 g004
Figure 5. Representative examples of decoupling between occupancy related ventilation and chemical pollutant signals across seasons. Hourly seasonal profiles are shown for (A) the general hospitalization ward and (B) outpatient consultation facilities. CO2 and CH2O are represented as hourly P90 concentrations, with reference lines indicating the corresponding GO IAQS Good thresholds (800 ppm and 33.16 µg/m3, respectively). TVOC is represented as the percentage of sensor hours classified as relatively high (≥P75 within each area and TVOC scaling phase), with 45% used as the exploratory criterion for the decoupling analysis.
Atmosphere 17 00895 g005
Table 1. Summary of IAQ conditions, data coverage, and dominant patterns across hospital areas. Ranges for CO2, PM2.5, and CH2O Good-category percentages represent the minimum and maximum values among the individual sensors deployed within each hospital area, calculated over each sensor’s valid monitoring period. The percentage of missing days is reported as the area level mean and range across individual sensors.
AreaSensors (n)Missing Days per Sensor, Mean (Range) (%)Hourly Data Completeness (%)CO2, Good Time (%) RangePM2.5, Good Time (%) RangeCH2O, Good Time (%) Range
Common spaces and waiting areas244.5 (27.3–61.8)53.9 (36.6–71.2)85–94%>95%93–100%
Hospitalization ward824.1 (16.5–34.0)72.3 (60.5–81.9)77–100%89–94%61–98%
Intensive care unit420.7 (14.0–29.5)77.4 (68.9–84.3)>98%>98%98–100%
Outpatient consultation facilities224.3 (20.2–28.5)65.0 (55.0–74.9)78–99%>90%90–91%
Pathological anatomy labs214.5 (12.9–16.2)81.9 (78.7–85.1)>95%93–98%93–100%
Table 2. Evidence informed operational implications and potential BMS supported responses across hospital environments.
Hospital Area/TypologyEvidence from Monitoring and Targeted SamplingOperational InterpretationPotential BMS Supported Response
Intensive Care Unit (ICU)Generally low and stable continuous profiles; comparatively low concentrations of most selected compoundsConditions appear broadly controlled, although compound specific exceptions remain possibleMaintain current ventilation conditions and use trend monitoring to detect deviations
Common spaces, waiting and consultation areasOccupancy related CO2 increases and recurrent summer/early morning CH2O patternsVentilation demand and chemical pollutant signals do not necessarily occur simultaneouslyUse pollutant specific alerts and consider pre-occupancy ventilation when recurrent chemical pollutant patterns are detected
Hospitalization wardPersistent CH2O patterns and comparatively elevated concentrations of selected aldehydes and VOCsPossible contribution from materials, cleaning practices and periods of reduced air renewalCombine scheduled ventilation with IAQ trends; review cleaning schedules and investigate persistent events
Pathological anatomy laboratoriesHigh concentrations of formaldehyde, acetone, ethylbenzene and xylenesStrong process related chemical signature requiring source specific controlPrioritise local extraction and process-based ventilation; use BMS integration for alarms and verification, where suitable sensors are available
Disclaimer/Publisher’s Note: The statements, opinions and data contained in all publications are solely those of the individual author(s) and contributor(s) and not of MDPI and/or the editor(s). MDPI and/or the editor(s) disclaim responsibility for any injury to people or property resulting from any ideas, methods, instructions or products referred to in the content.