Article

Intercity Interaction Effects of PM2.5 Pollution and Their Determinants in the Guangdong–Hong Kong–Macao Greater Bay Area: A Network Analysis Based on CCM


1
Business School, Xinyang Normal University, Xinyang 464000, China
2
School of International Education, Xinjiang Agricultural University, Urumqi 830052, China
*
Author to whom correspondence should be addressed.
Atmosphere 2026, 17(7), 676; https://doi.org/10.3390/atmos17070676
Submission received: 28 May 2026 / Revised: 1 July 2026 / Accepted: 6 July 2026 / Published: 8 July 2026
(This article belongs to the Section Air Pollution Control)

Abstract

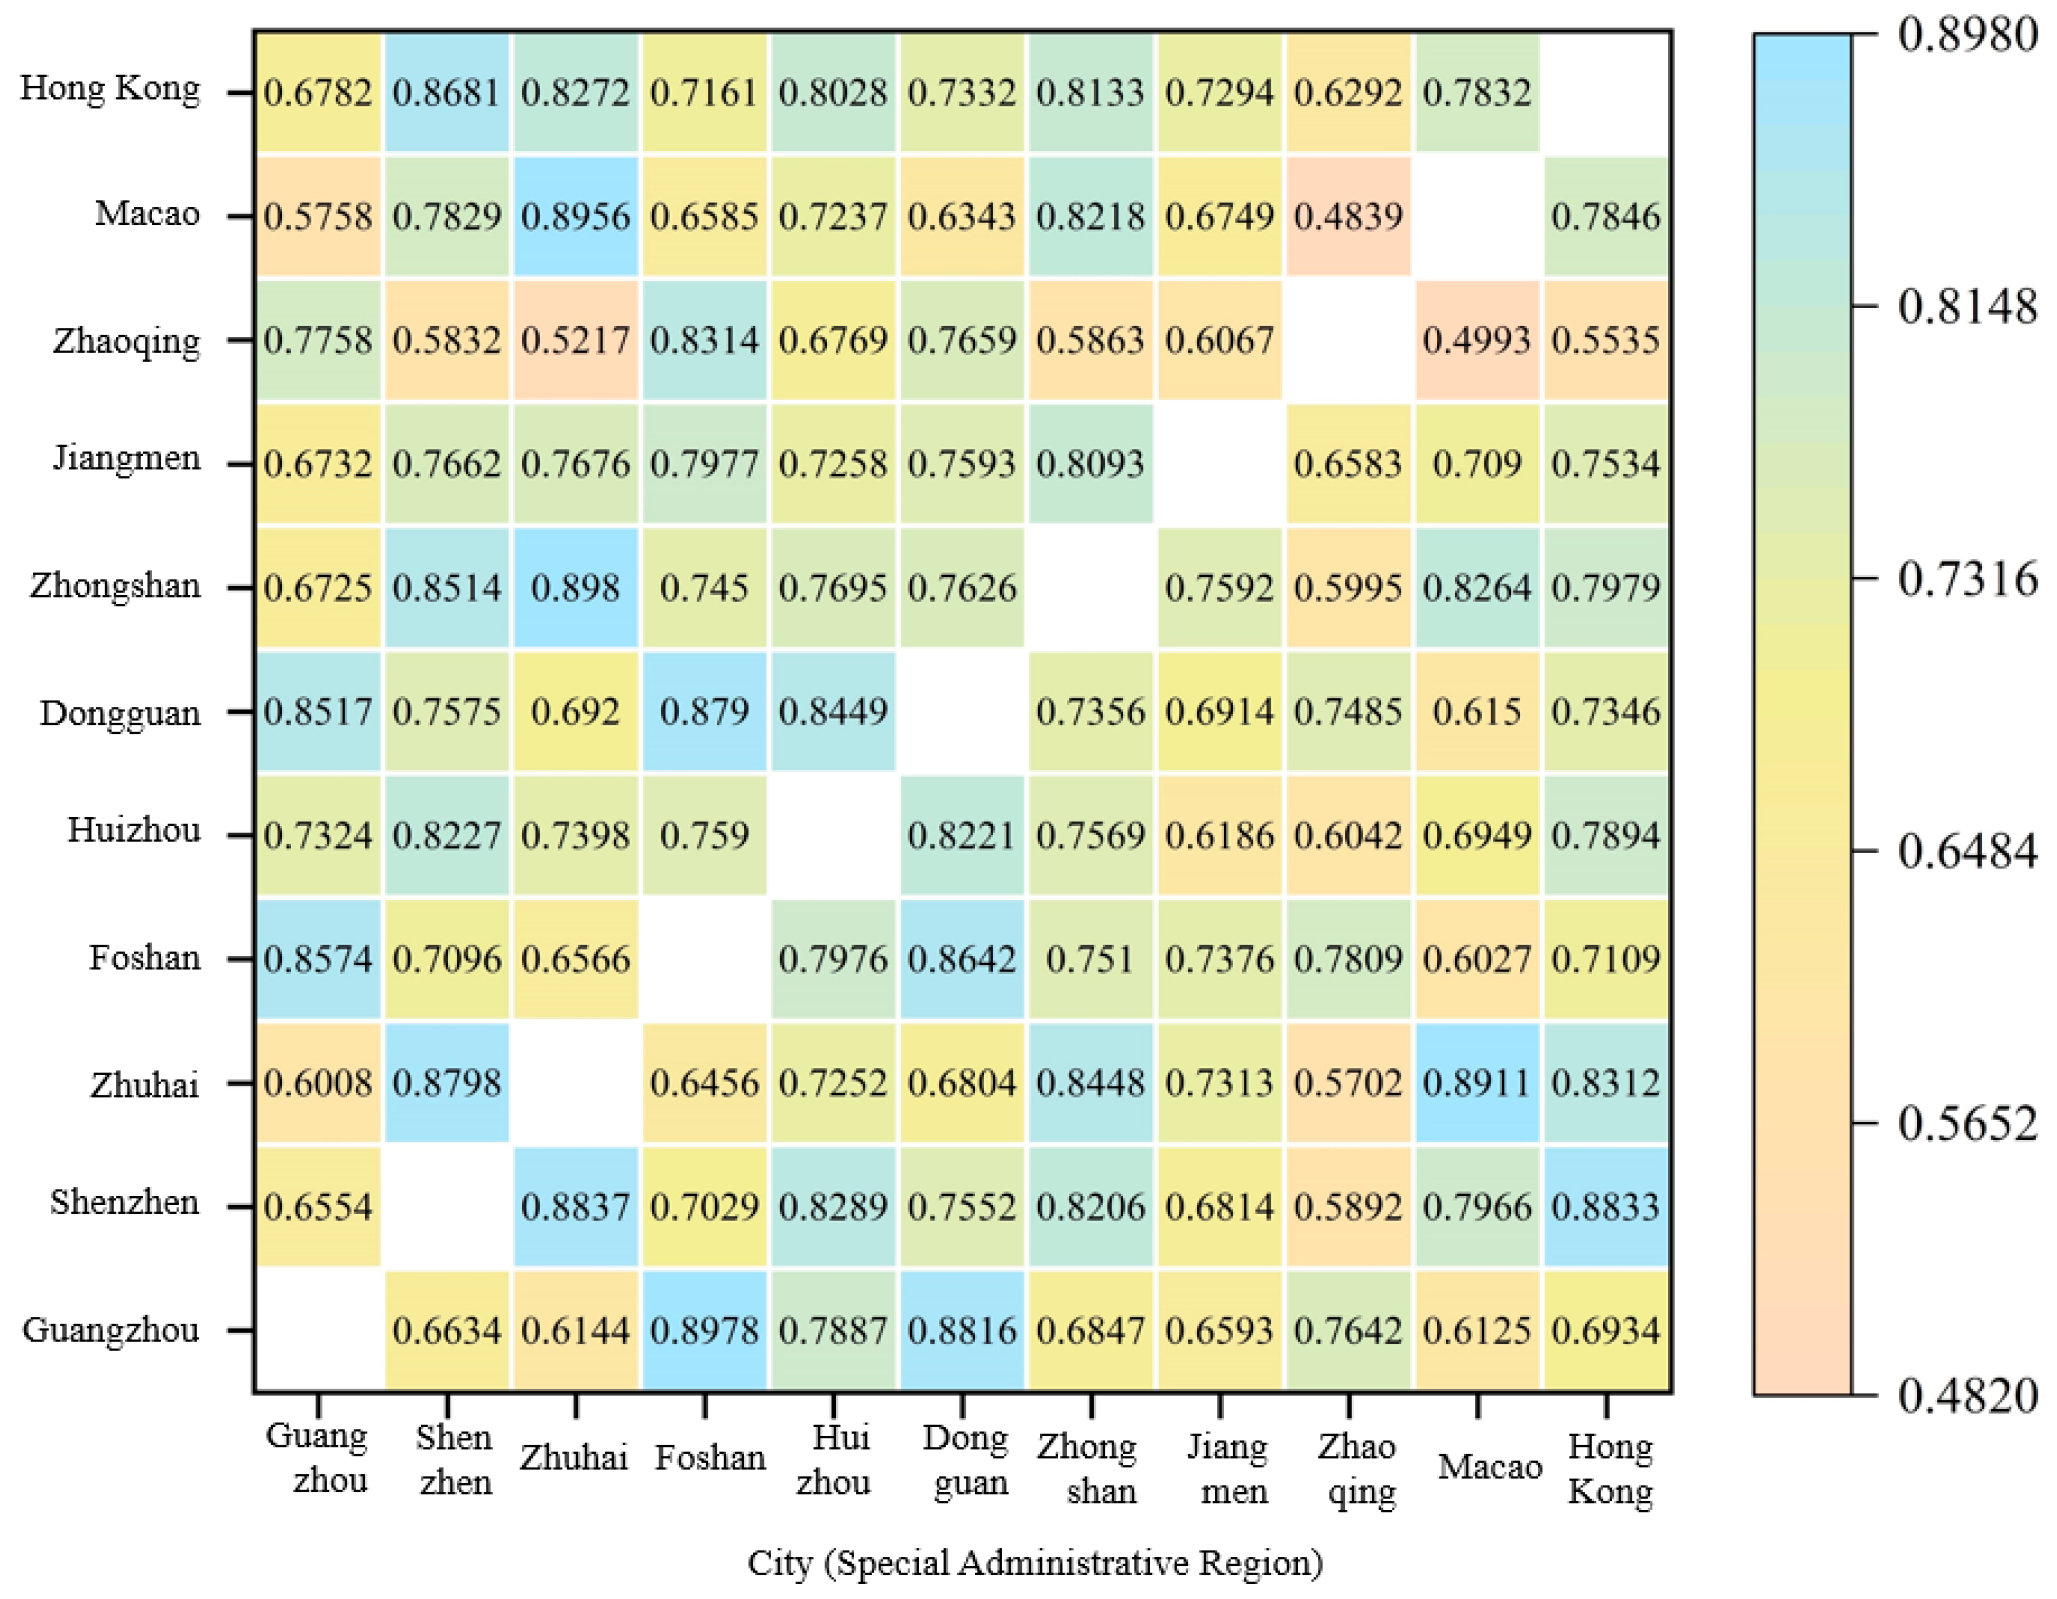
PM2.5 pollution control in the Guangdong–Hong Kong–Macao Greater Bay Area requires a clearer understanding of how PM2.5-related linkages are organized across closely connected cities and jurisdictions. This study develops a CCM-based directional-network framework using PM2.5 pollution data from nine cities and two special administrative regions in the Greater Bay Area. Convergent cross mapping is first applied to identify nonlinear directional associations among cities, based on which an intercity PM2.5 pollution network is constructed. Social network analysis and motif analysis are then used to reveal the network’s macro-level connectivity and micro-level interaction patterns. An exponential random graph model is further introduced to identify the natural and socioeconomic factors associated with the emergence of intercity PM2.5 pollution linkages. The results show that PM2.5 levels in the Greater Bay Area generally declined across the selected years, with high-value areas becoming more localized, while the CCM results revealed heterogeneous nonlinear directional linkages among cities. The strongest CCM linkage was observed from Foshan to Guangzhou (0.8978), whereas the weakest linkage was observed from Macao SAR to Zhaoqing (0.4993). The results derived from social network analysis indicate an east–west cross-regional linkage pattern, with most cities serving as bridging nodes in the network. Natural factors, including temperature and precipitation, as well as socioeconomic factors, including economic development and population density, were significantly associated with the formation of intercity PM2.5 pollution linkages. These findings highlight the need for an integrated governance approach that combines source-oriented control, coordinated management of intercity PM2.5-related linkages, and public participation to improve collaborative PM2.5 pollution management in the Greater Bay Area.

1. Introduction

Fine particulate matter PM2.5 continues to pose substantial health risks worldwide [1,2,3,4,5,6]. China has experienced severe PM2.5 pollution during its rapid industrialization and urbanization [7], but large-scale clean-air interventions since 2013 have led to marked reductions in PM2.5 and considerable health benefits [8,9]. However, the substantial decline in PM2.5 concentrations does not mean that the pressure to improve air quality has disappeared [10]. In recent years, China has also faced increasing challenges from ozone and compound air pollution, indicating that clean-air governance has entered a stage of consolidation and further improvement [11,12]. In this context, how to further reduce the pollution risks associated with PM2.5 and sustain long-term governance gains remains an important issue for regional air quality management. Because PM2.5 pollution is shaped not only by local emissions but also by atmospheric transport, neighboring regulatory actions, and spatial spillover effects, it often crosses administrative boundaries and generates environmental externalities among jurisdictions [13]. Therefore, unilateral local control and the conventional principle of “who pollutes, who controls” may be insufficient to fully address cross-boundary pollution interactions in highly connected urban agglomerations [14,15]. A more scientific understanding is needed to identify which cities are environmentally interdependent, how PM2.5-related linkages are organized across jurisdictions, and how collaborative governance should be arranged across administrative boundaries.
The Guangdong–Hong Kong–Macao Greater Bay Area (GBA) provides a distinctive case for examining these issues. Unlike many inland urban agglomerations, the GBA is a coastal, highly open, and economically integrated region characterized by intensive industrial activities, dense transport corridors, frequent intercity mobility, and complex land–sea atmospheric circulation [16]. In addition, the region operates under the institutional context of “one country, two systems”, involving different administrative hierarchies and regulatory arrangements [17]. These characteristics make regional PM2.5 pollution governance in the GBA more complex than ordinary intercity coordination. Previous studies have shown that the Pearl River Delta region and Hong Kong SAR have made important progress in science-based air quality management and regional monitoring cooperation [18,19]. However, particulate pollution and compound pollution in this region remain affected by local emissions, secondary formation, meteorological conditions, port and traffic activities, and cross-regional transport [20,21,22,23]. Therefore, identifying specific intercity PM2.5 linkage patterns in the GBA is important for improving the precision and effectiveness of collaborative governance.
Existing studies have examined PM2.5 pollution interactions mainly from two perspectives: physical transport and information transmission. From the physical transport perspective, air quality models, source-apportionment methods, trajectory analysis, and data-integration approaches have been widely applied in air-pollution studies to characterize pollutant dispersion, meteorological influences, chemical transformation, source contributions, and cross-regional transport processes [24,25,26,27,28,29]. These studies can reveal the transport pathways and potential sources of pollutants in the atmospheric environment and, through numerical simulation or source-apportionment frameworks, quantitatively estimate the relative contributions of local emissions and external transport to pollution levels, thereby providing an important basis for understanding regional pollution formation mechanisms and formulating joint prevention and control policies [21,22,26,27]. Meanwhile, with the continuous accumulation of city-level pollution observations, time-series-based information transmission methods have provided a new perspective for identifying dynamic linkages in pollution changes among cities. From the information transmission perspective, observed PM2.5 pollution time series can be regarded as integrated signals that contain information about emissions, meteorological conditions, human activities, and regional interactions. Earlier studies often used correlation coefficients, spatial autocorrelation, or spatial econometric models to measure spatial dependence among pollutants. However, correlation-based methods cannot determine whether pollution changes in one city are directionally associated with pollution changes in another city. Granger causality provides a way to infer temporal precedence [30], but it is sensitive to linear assumptions, stationarity requirements, and declining correlations caused by increasing geographic distance. These limitations are particularly relevant for complex urban systems in which pollution interactions may be nonlinear, asymmetric, and dynamically coupled.
Convergent cross mapping (CCM), proposed by Sugihara et al. [31], provides a data-driven approach for detecting nonlinear directional dependence in dynamic systems. By reconstructing the state space of observed time series, CCM can identify whether the historical information of one variable is embedded in the reconstructed dynamics of another variable. This makes it suitable for analyzing nonlinear and potentially weakly coupled intercity PM2.5 pollution interactions. However, identifying pairwise directional associations alone is not sufficient for understanding regional pollution governance. Once city-to-city pollution associations are identified, they need to be further transformed into a network structure so that the overall connectivity, nodal roles, local interaction patterns, and network formation mechanisms of the pollution system can be systematically examined.
Network-based approaches provide useful tools for this purpose. Social network analysis (SNA) can characterize the structure of a relational system by measuring network density, centrality, intermediary roles, and subgroup structures [32,33,34]. Motif analysis further reveals recurring local configurations that occur more frequently than expected in randomized networks, thereby helping to identify basic interaction patterns embedded in complex systems [35,36]. In addition, exponential random graph models (ERGMs) allow researchers to statistically examine why specific network ties emerge by considering endogenous network dependence, node-level attributes, and dyadic covariates simultaneously [37,38]. These methods have been widely used in social, ecological, and governance network studies. Nevertheless, their combined application to pollution networks remains relatively limited, especially in coastal, highly integrated, and cross-jurisdictional urban regions such as the GBA.
The literature on regional collaborative environmental governance also provides important theoretical insights. Collaborative governance theory emphasizes that cross-boundary public problems require joint decision-making, resource sharing, and institutionalized interaction among multiple actors [39,40]. Institutional collective action theory further suggests that interjurisdictional cooperation is shaped by transaction costs, interdependence, and the institutional arrangements that help local governments coordinate collective actions [41,42]. Studies on network governance and collaborative environmental governance show that network structure and management modes can affect collective action outcomes and environmental governance performance [43,44]. Recent research on PM2.5 pollution governance networks also indicates that network structure affects the efficiency of regional collaboration [45]. However, much of the existing governance-oriented literature focuses on formal cooperation relationships among governments, while paying less attention to the underlying PM2.5-related interdependence that characterizes environmental linkages among cities. In other words, existing studies have not fully answered the question of “collaboration with whom” from the perspective of PM2.5-related intercity linkages. This gap is particularly important for the GBA, where administrative boundaries, economic integration, and atmospheric interactions coexist.
To address these gaps, this study examines intercity PM2.5 pollution interactions and the factors associated with their formation in the GBA using PM2.5 as the indicator. Specifically, CCM is first employed to identify nonlinear directional associations among nine cities and two special administrative regions. Based on the identified CCM-based directional associations, an intercity network is constructed. SNA and motif analysis are then used to examine the macro-level network topology, nodal functions, and micro-level structural patterns. Finally, an ERGM is introduced to identify the natural and socioeconomic factors associated with the formation of intercity pollution linkages. Although regional air quality involves multiple pollutants, this study focuses specifically on PM2.5. PM2.5 was selected because fine particulate matter remains an important target of regional air-quality management and is closely related to both local emissions and regional atmospheric processes. Therefore, the term “PM2.5 pollution interaction” in this paper refers only to directional associations among city-level PM2.5 time series. The findings should not be generalized to other pollutants, such as O3, NO2, SO2, CO, or PM10, without pollutant-specific analysis.
The marginal contributions of this study are threefold. First, it provides new empirical evidence on PM2.5 pollution interactions in the GBA, a coastal and cross-jurisdictional urban region with distinctive institutional and economic characteristics. Second, it develops an integrated analytical framework that combines nonlinear directional-dependence analysis, network structural analysis, motif identification, and statistical network modeling. This framework helps move beyond traditional attribute-based or correlation-based analysis toward a relational understanding of PM2.5 pollution interactions. Third, by identifying key intercity linkage patterns, bridging cities, and factors associated with network formation, this study offers policy-relevant evidence for designing differentiated and coordinated PM2.5 pollution governance strategies in the GBA. The findings can help regional authorities refine collaborative governance by clarifying source-oriented control priorities, intercity linkage management strategies, and cross-jurisdictional coordination mechanisms.

2. Materials and Methods

2.1. Study Area

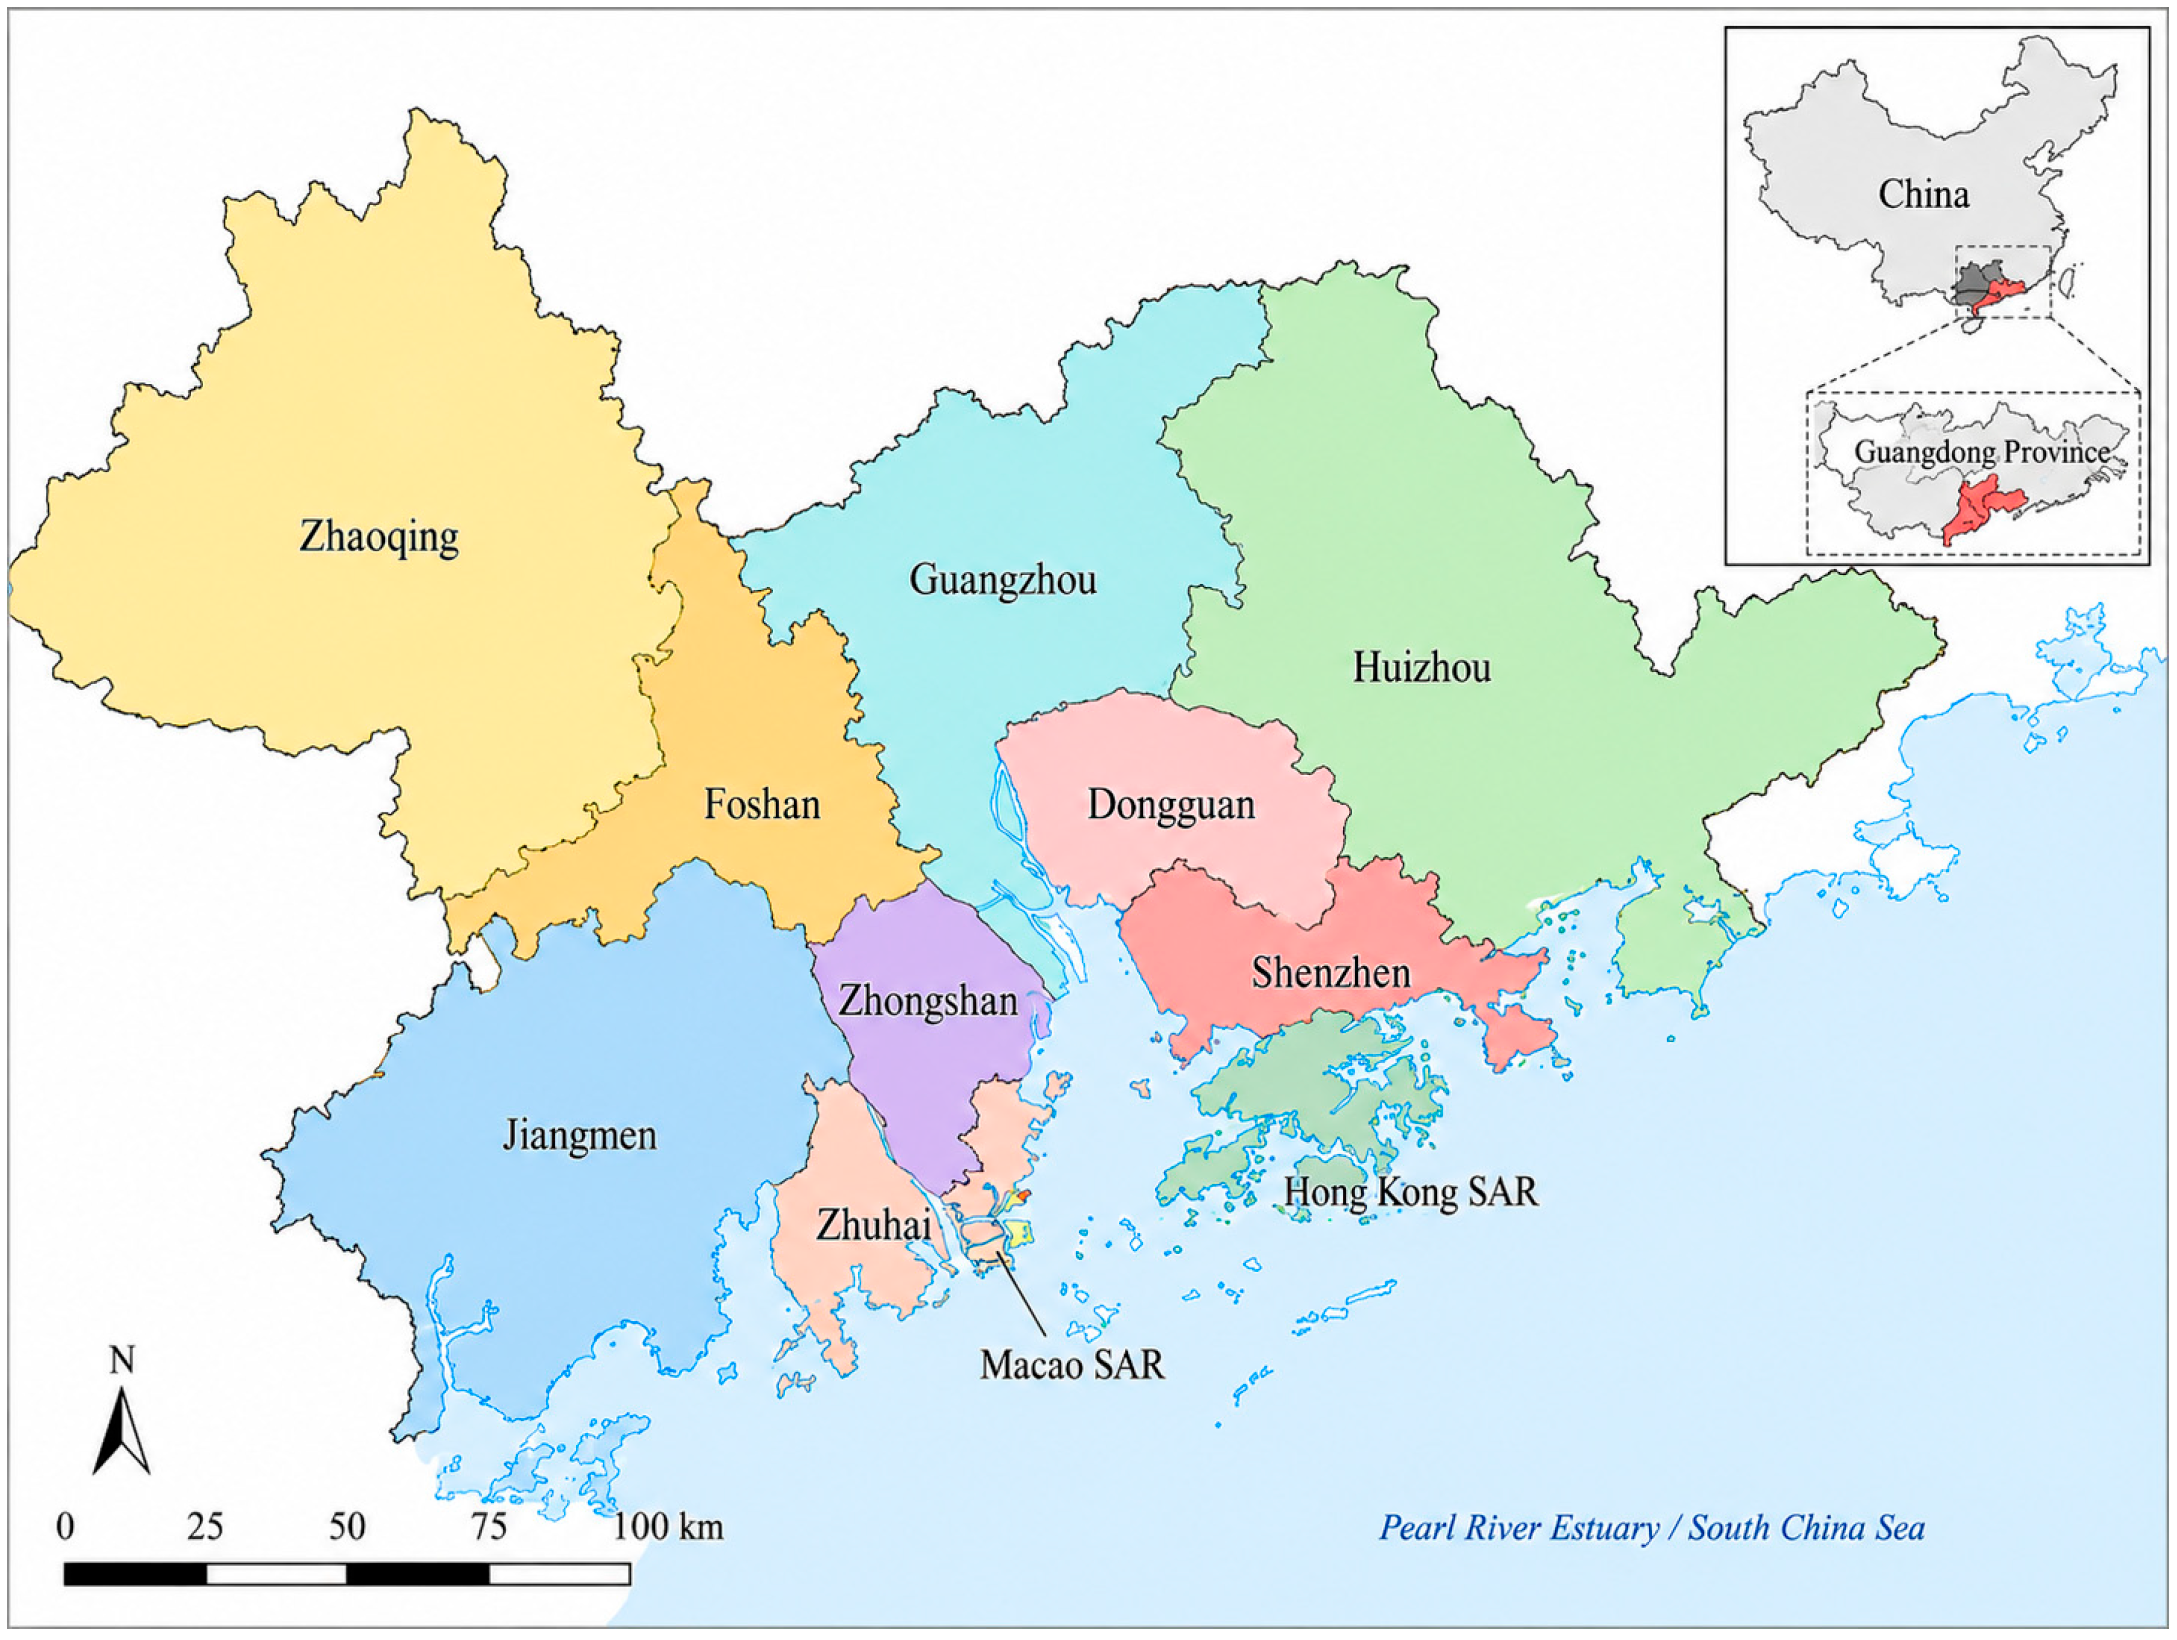
The GBA, as shown in Figure 1, is located around the Pearl River Estuary in southern coastal China and includes Hong Kong SAR, Macao SAR, Guangzhou, Shenzhen, Zhuhai, Foshan, Huizhou, Dongguan, Zhongshan, Jiangmen, and Zhaoqing. As a highly urbanized and economically integrated megacity region, the GBA features a dense population, intensive industrial and transport activities, frequent intercity mobility, and complex coastal meteorological conditions. These characteristics make regional PM2.5 pollution sensitive not only to local emissions but also to secondary aerosol formation, coastal atmospheric circulation, and cross-city transport [46,47,48,49]. Moreover, the coexistence of mainland cities and two special administrative regions under “one country, two systems” makes the GBA a suitable case for examining cross-jurisdictional PM2.5 governance.

2.2. Methods

2.2.1. Convergent Cross Mapping

Its core idea is that, if two variables are dynamically coupled, information about one variable may be embedded in the reconstructed state space of the other. Let X = { x t } t = 1 L and Y = { y t } t = 1 L denote two city-level PM2.5 time series. If X directionally influences Y , the reconstructed shadow manifold of Y , denoted as M Y , should contain information about X . Therefore, the directional dependence from X to Y can be evaluated by testing whether M Y can reliably cross-map X .
For two time series X and Y with length L , their shadow manifolds can be reconstructed using lagged-coordinate vectors:
M X : x t = X t , X t τ , X t 2 τ , , X t E 1 τ  
M Y : y t = Y t , Y t τ , Y t 2 τ , , Y t E 1 τ  
where E is the embedding dimension, τ is the time delay, and t = (   E   1 ) τ + 1 , , L . For a given point on the reconstructed manifold, its E + 1 nearest neighbors are identified, and their distances are converted into weights. These weights are then used to obtain a locally weighted prediction. For example, when M X is used to estimate Y ( t ) , the cross-mapped estimate is given by:
Y ^ t M X = i = 1 E + 1 ω i Y t i ,   ω i = u i j = 1 E + 1 u j ,   u i = e d i d 1  
where ω i is the weight assigned to the i -th nearest neighbor of x t on M X , Y ( t i ) is the observed value of Y at t i , d i is the distance between x t and its i -th nearest neighbor, and d 1 is the distance to the nearest neighbor [31].
The prediction skill of CCM is measured by the correlation between the observed and estimated values:
ρ C C M Y Y t ^ = ρ Y t , Y ^ t M X  
A larger ρ C C M indicates stronger cross-mapping skill. More importantly, CCM requires convergence: as the library length L increases, the reconstructed attractor becomes more complete, and the nearest-neighbor search becomes more reliable. If Y can be increasingly well predicted from M X as L grows, it suggests that information about Y is embedded in the dynamics of X , indicating a nonlinear directional dependence from Y to X . In this study, CCM coefficients captured the intensity of directional pollution linkages across city pairs, thereby providing the basis for constructing the intercity network.
For each directed city pair, statistical significance was assessed using a random-permutation surrogate test with 1000 replications, in which the observed CCM prediction skill was compared with the null distribution generated from randomly shuffled adjusted PM2.5 series. Since 110 directed city-pair relationships were tested, all p-values were adjusted using the Benjamini–Hochberg false discovery rate (BH-FDR) procedure. A directional linkage was retained only when the CCM convergence criterion was satisfied and the FDR-adjusted p-value was less than 0.05.
To provide a limited trajectory-based consistency check for selected CCM-based linkages, backward trajectories were calculated using the Hybrid Single-Particle Lagrangian Integrated Trajectory model (HYSPLIT; National Oceanic and Atmospheric Administration Air Resources Laboratory, College Park, MD, USA) for selected relatively strong and weak statistically significant mainland city-to-city linkages ranked by CCM coefficient. For each selected linkage from city A to city B, city B was treated as the receptor city, and the 20 highest-PM2.5 days in city B during 2016–2022 were selected as episode days. Forty-eight-hour backward trajectories were calculated using GDAS 1° meteorological data with an arrival height of 500 m above ground level. The source-side consistency ratio was calculated as the percentage of the trajectory cluster most consistent with the source-side direction from city A to city B divided by the largest trajectory-cluster percentage for the corresponding receptor city.

2.2.2. Social Network Analysis

Network Feature Analysis
Based on the statistically significant CCM results, a directed intercity PM2.5 linkage matrix was constructed for the GBA. Each city or special administrative region was treated as a network node, and each significant CCM-based directional association was defined as a directed network tie. In this way, the pairwise associations identified by CCM were transformed into a relational network for subsequent structural analysis.
The global network was evaluated in terms of compactness, integration, stratification, and redundancy. Network density measures the proportion of observed ties among all possible city-to-city directed ties and was calculated as
D = L N N 1
where D denotes network density, L is the number of observed directed ties, and N is the number of network nodes. A higher density indicates that pollution interactions are more extensively distributed across the region. Network connectedness, hierarchy, and efficiency were calculated using the Krackhardt Graph Theoretic Dimensions routine in UCINET 6.186. Connectedness reflects the extent to which cities are embedded in the same connected structure. Hierarchy captures asymmetry in reachability among cities; a higher hierarchy indicates a more stratified network structure. Network efficiency reflects the degree of redundant connections within the network. A lower efficiency value implies more alternative connection paths among cities, indicating stronger relational redundancy and higher structural stability [32].
City-level roles were further examined through centrality measures. Degree centrality reflects direct linkage activity, betweenness centrality captures a city’s bridging role in pollution transmission, and closeness centrality indicates how rapidly a city can connect with other nodes in the network [32,33,34]. In this study, closeness centrality was calculated for the directed network based on directed reachability. It was defined as
C C ( i ) = n 1 j i d ( i , j )
where d ( i , j ) is the directed shortest-path distance from node i to node j . If node i cannot reach other nodes through directed paths, its closeness centrality is reported as 0 in UCINET 6.186.
Motif Analysis
Motif analysis was used to examine the local interaction patterns embedded in the intercity PM2.5 pollution network. Network motifs are small, connected subgraphs that recur in a network more frequently than expected under an appropriate random-network benchmark [35,36]. Compared with global network indicators, motif analysis focuses on micro-level configurations and helps identify the basic building blocks of complex pollution interaction networks.
In this study, motif analysis was conducted to detect frequently occurring local structures among cities in the GBA PM2.5 pollution network. Three statistics were used to evaluate motif characteristics: frequency, p-value, and Z-score. Frequency records the number of occurrences of a given motif. The p-value measures the probability that the same motif could occur in randomized networks with comparable structural properties; a smaller p-value indicates that the motif is less likely to arise by chance. The Z-score compares the observed motif frequency with its expected frequency in random networks, and a higher Z-score indicates a more statistically overrepresented and structurally meaningful motif. Through this analysis, the study identifies the dominant local linkage patterns of PM2.5 pollution among cities and provides a microstructural basis for interpreting cross-city PM2.5-related interactions in the GBA.

2.2.3. Exponential Random Graph Model

ERGM was introduced to identify the factors associated with the formation of city-to-city PM2.5 pollution ties. ERGM is a statistical modeling framework for network data that explains the probability of observing a given network by decomposing its structure into a set of local configurations and explanatory statistics [37,38]. Unlike conventional regression models that assume independence among observations, ERGM explicitly considers dependence among network ties, making it suitable for analyzing relational structures in which cities are interconnected through directional pollution associations [50]. In this study, the dependent network is the binary directed matrix derived from the significant CCM-based intercity PM2.5 pollution linkages.
The ERGM is specified as follows:
P θ X = Y = 1 k e x p { n θ n g θ ( y ) }
where Y denotes the random network, y is the observed PM2.5 pollution network, g k ( y ) represents the k -th network statistic, and θ k is the corresponding parameter to be estimated. The term κ ( θ ) normalizes the distribution so that probabilities across all possible networks sum to one. A positive and significant θ k indicates that the corresponding network configuration or explanatory factor increases the likelihood of an intercity pollution linkage, whereas a negative coefficient suggests a suppressing effect. By incorporating endogenous network terms, city-level attributes, and dyadic covariates, ERGM helps identify the drivers of the GBA pollution network.
In the empirical specification, the model included endogenous network terms, nodal covariates, and dyadic covariates. The endogenous terms included edges and mutuality, which captured the baseline tendency of tie formation and reciprocal dependence between city pairs. The nodal covariates included PM2.5 pollution categories, temperature, precipitation, GDP per capita, population density, and the share of secondary industry. These variables were used to represent pollution conditions, meteorological background, socioeconomic activity, population concentration, and industrial structure. The dyadic covariates included geographical proximity, meteorological association, and economic association, which captured pairwise spatial, environmental, and socioeconomic connections between cities. The tertiary-sector share was not included in the main model because it is less directly linked to PM2.5-generating industrial processes and may overlap with GDP per capita, population density, and economic association.

2.3. Data and Variables

The pollutant variable used in this study was daily city-level PM2.5 concentration. For each city or special administrative region, the daily value was calculated as the arithmetic mean of valid monitoring-station observations on the same day. The PM2.5 dataset included 80 monitoring stations across the 11 cities/SARs. After data cleaning and city-level aggregation, the final CCM dataset contained 2557 daily observations for each city or special administrative region from 1 January 2016 to 31 December 2022. Across the complete dataset (28,127 city-day observations), only 16 city-day observations (0.057%) were missing and were filled using linear interpolation before CCM estimation. Before CCM estimation, each city-level daily PM2.5 series was detrended and seasonally adjusted using STL decomposition with a 365-day seasonal period, with the residual component retained for subsequent CCM analysis. Other pollutants, including O3, NO2, SO2, CO, and PM10, were not included in the empirical network construction or ERGM analysis.
Annual average PM2.5 values were used for descriptive spatial mapping, whereas the ERGM pollution-category variables were constructed from city-level average PM2.5 concentrations over the entire 2016–2022 study period. Based on the natural breaks method, the low-pollution group included Macao SAR, the medium-pollution group included Hong Kong SAR, Zhaoqing, Shenzhen, Zhuhai, Huizhou, Jiangmen, Guangzhou, and Zhongshan, and the high-pollution group included Dongguan and Foshan. The low-pollution group was used as the reference category, while Mid AP and High AP were included in the ERGM as dummy variables.
Five continuous nodal covariates were included: temperature, precipitation, GDP per capita, population density, and the share of secondary industry. Temperature and precipitation represented meteorological conditions affecting PM2.5 accumulation, dispersion, and removal. GDP per capita and population density were used to capture socioeconomic development and urban activity intensity, while the share of secondary industry represented industrial structure. All continuous nodal covariates were calculated as city-level averages over the 2016–2022 study period. The socioeconomic and meteorological data were obtained from the Guangdong Statistical Yearbook, the Hong Kong Annual Digest of Statistics, and the Macao Yearbook of Statistics. Descriptive statistics are reported in Table 1.

3. Results

3.1. Spatiotemporal Patterns of PM2.5 Pollution

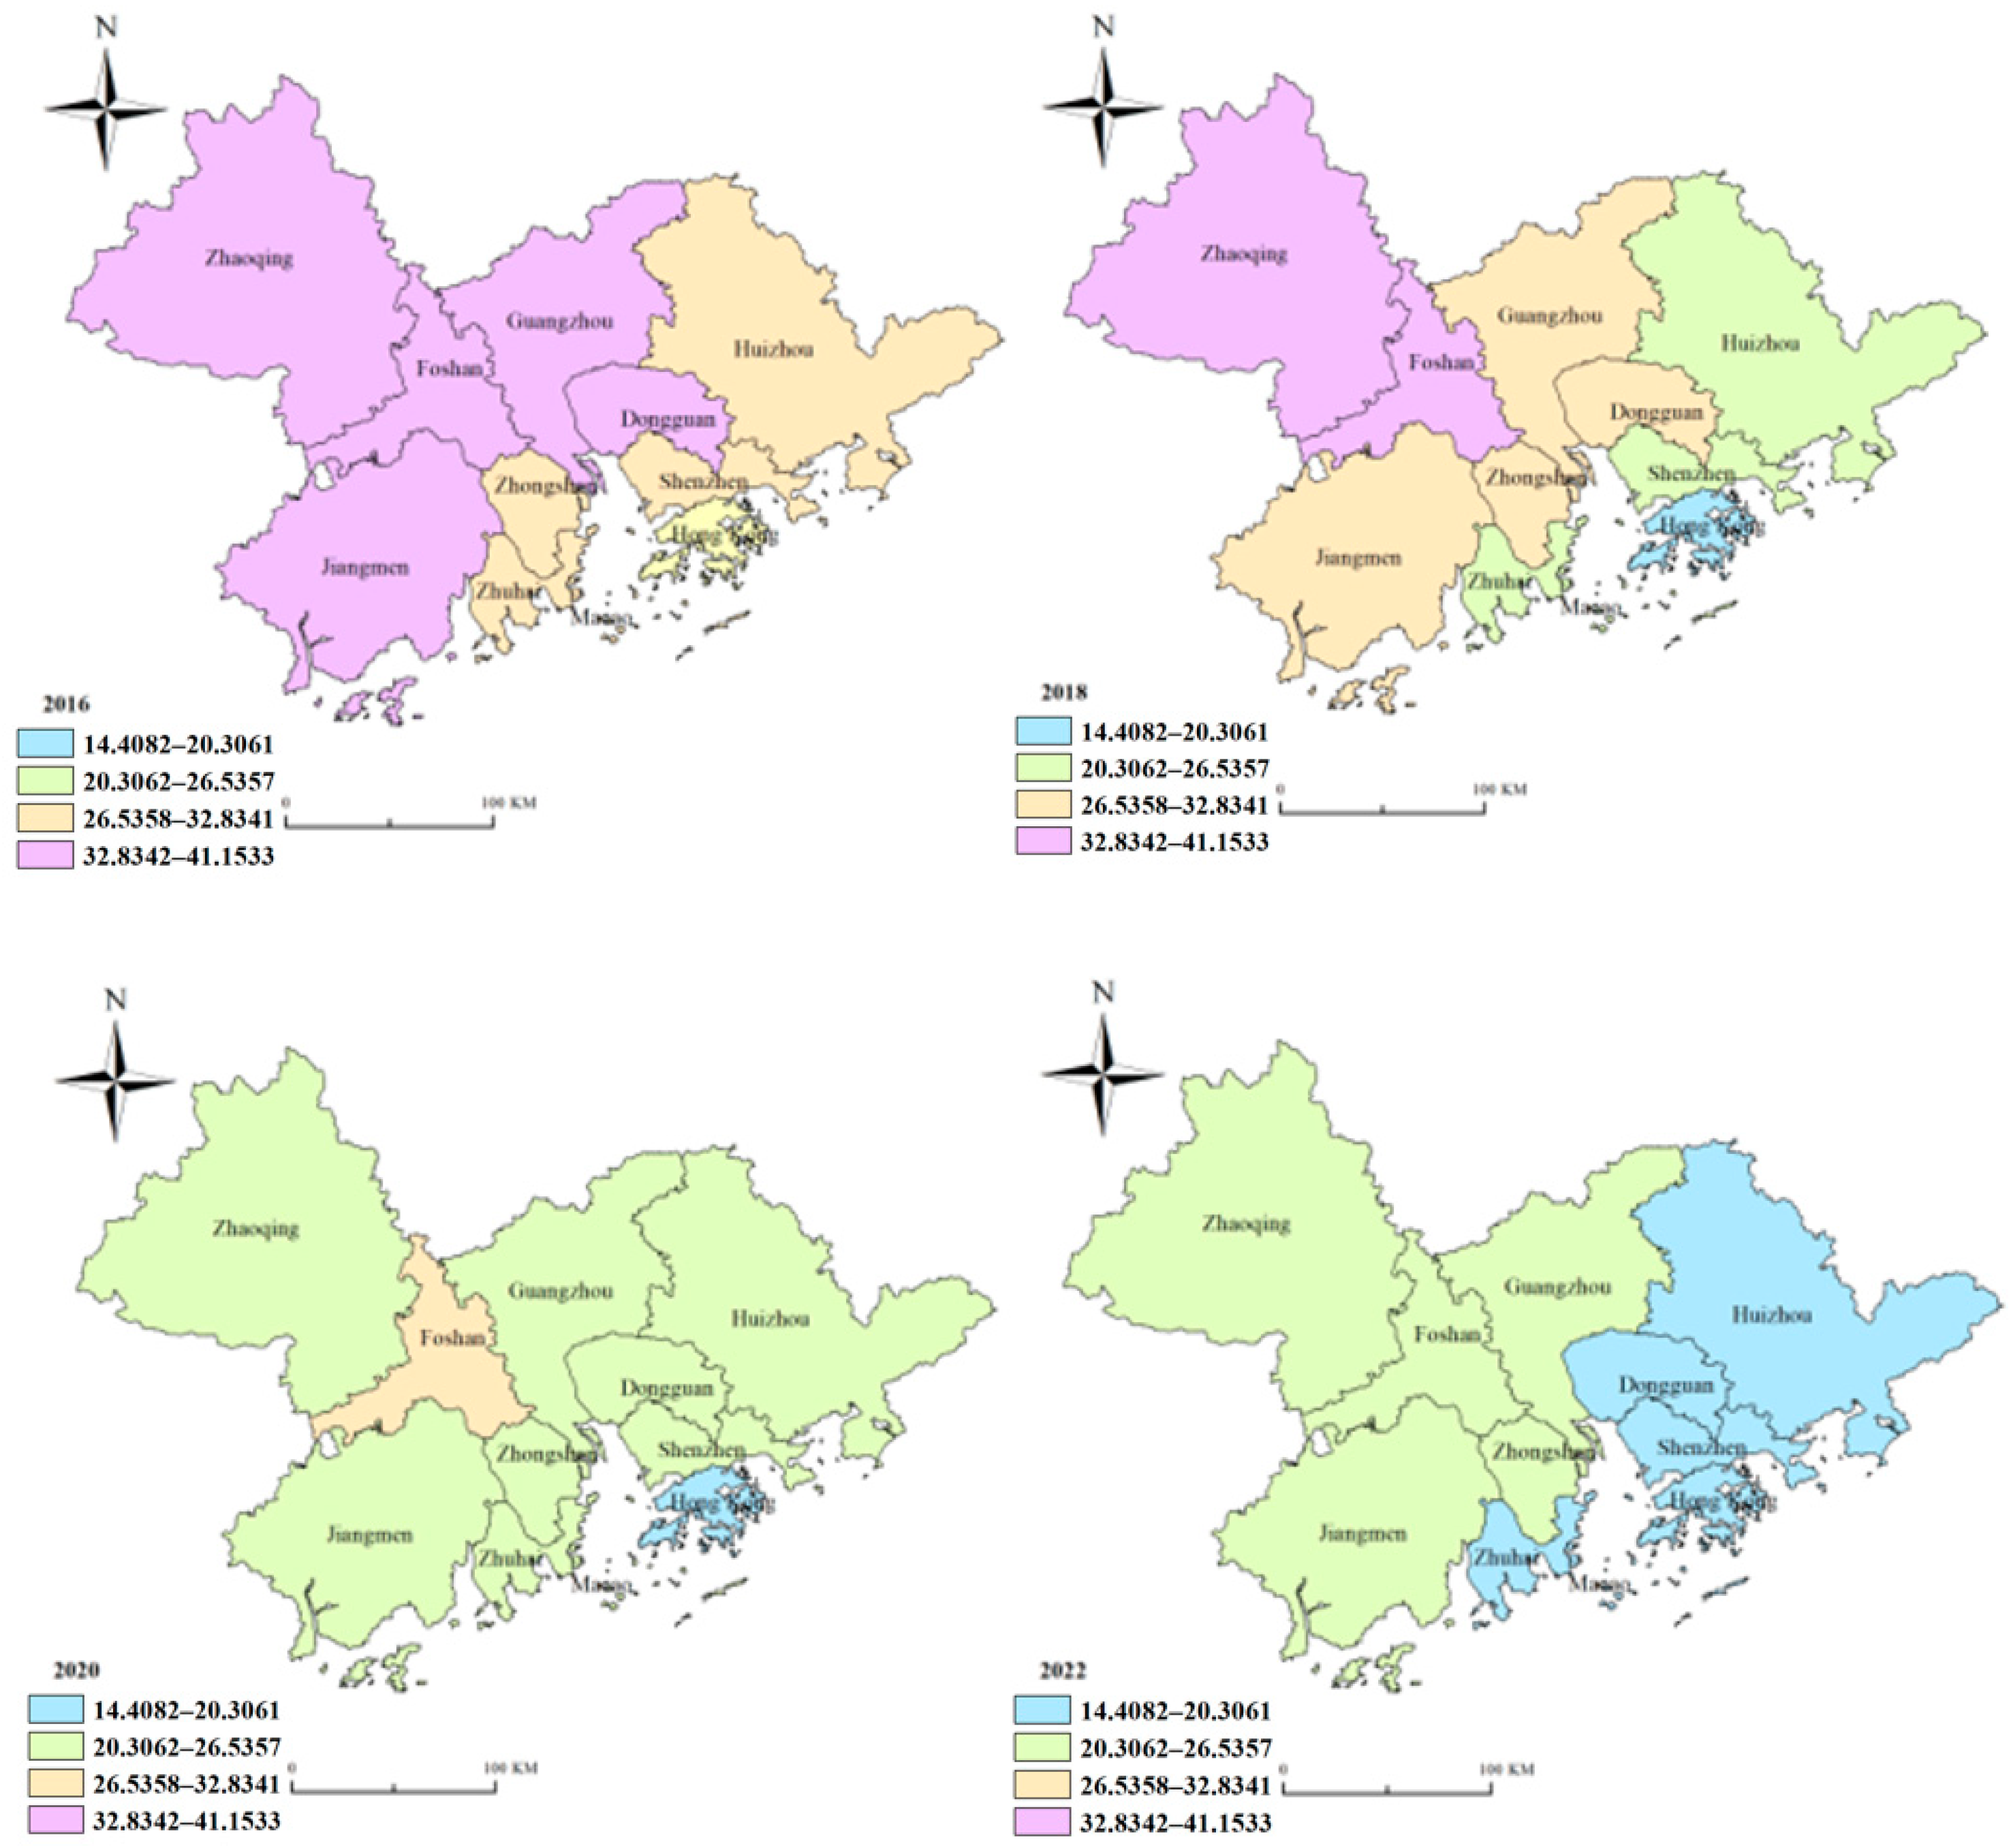
ArcGIS was used to map PM2.5 pollution in the 11 GBA cities and SARs for the selected years of 2016, 2018, 2020, and 2022. The natural breaks method was applied to the pooled city-year PM2.5 values for these four years, as shown in Figure 2.
During the mapped years, PM2.5 pollution in the GBA showed a clear overall decline under the unified classification. In 2016, the highest PM2.5 class was mainly concentrated in Guangzhou, Foshan, Dongguan, Jiangmen, and Zhaoqing, indicating relatively high pollution levels in the central and western parts of the GBA. By 2018, the highest class had narrowed to Foshan and Zhaoqing. In 2020, no city remained in the highest class, and only Foshan was classified into the 27–32 μg/m3 group. By 2022, all cities and SARs had fallen into the two lower classes, indicating a substantial reduction in PM2.5 levels across the region. Overall, the spatial pattern shifted from a broader high-value distribution in the central and western GBA to a lower and more localized residual pattern. The pollution-intensity classes in Figure 2 should be interpreted as sample-based PM2.5 categories rather than regulatory air-quality grades.

3.2. Dynamic Intercity Interactions of PM2.5 Pollution

3.2.1. Optimal Embedding Dimension

Selecting appropriate embedding parameters is essential for reliable CCM estimation. Before conducting CCM estimation, the time delay τ was set to 1, and the optimal embedding dimension E was identified according to univariate prediction skill. The choice of E directly affects the accuracy of state-space reconstruction and subsequent prediction. Univariate prediction skill refers to the correlation coefficient between observed and predicted values, and it generally reaches its maximum under the optimal embedding dimension [51]. The CCM convergence criterion follows Sugihara et al. [31]. In this study, the SSR_pred_boot function in R software (version 4.5.0; R Foundation for Statistical Computing, Vienna, Austria) was used to identify the optimal embedding dimensions. As shown in Table 2, the optimal embedding dimensions of the 11 cities and SARs ranged from 2 to 5, indicating that the temporal evolution of PM2.5 pollution across cities exhibits nonlinear dynamic characteristics and a certain degree of similarity.

3.2.2. CCM Significance Testing and Directional Linkage Identification

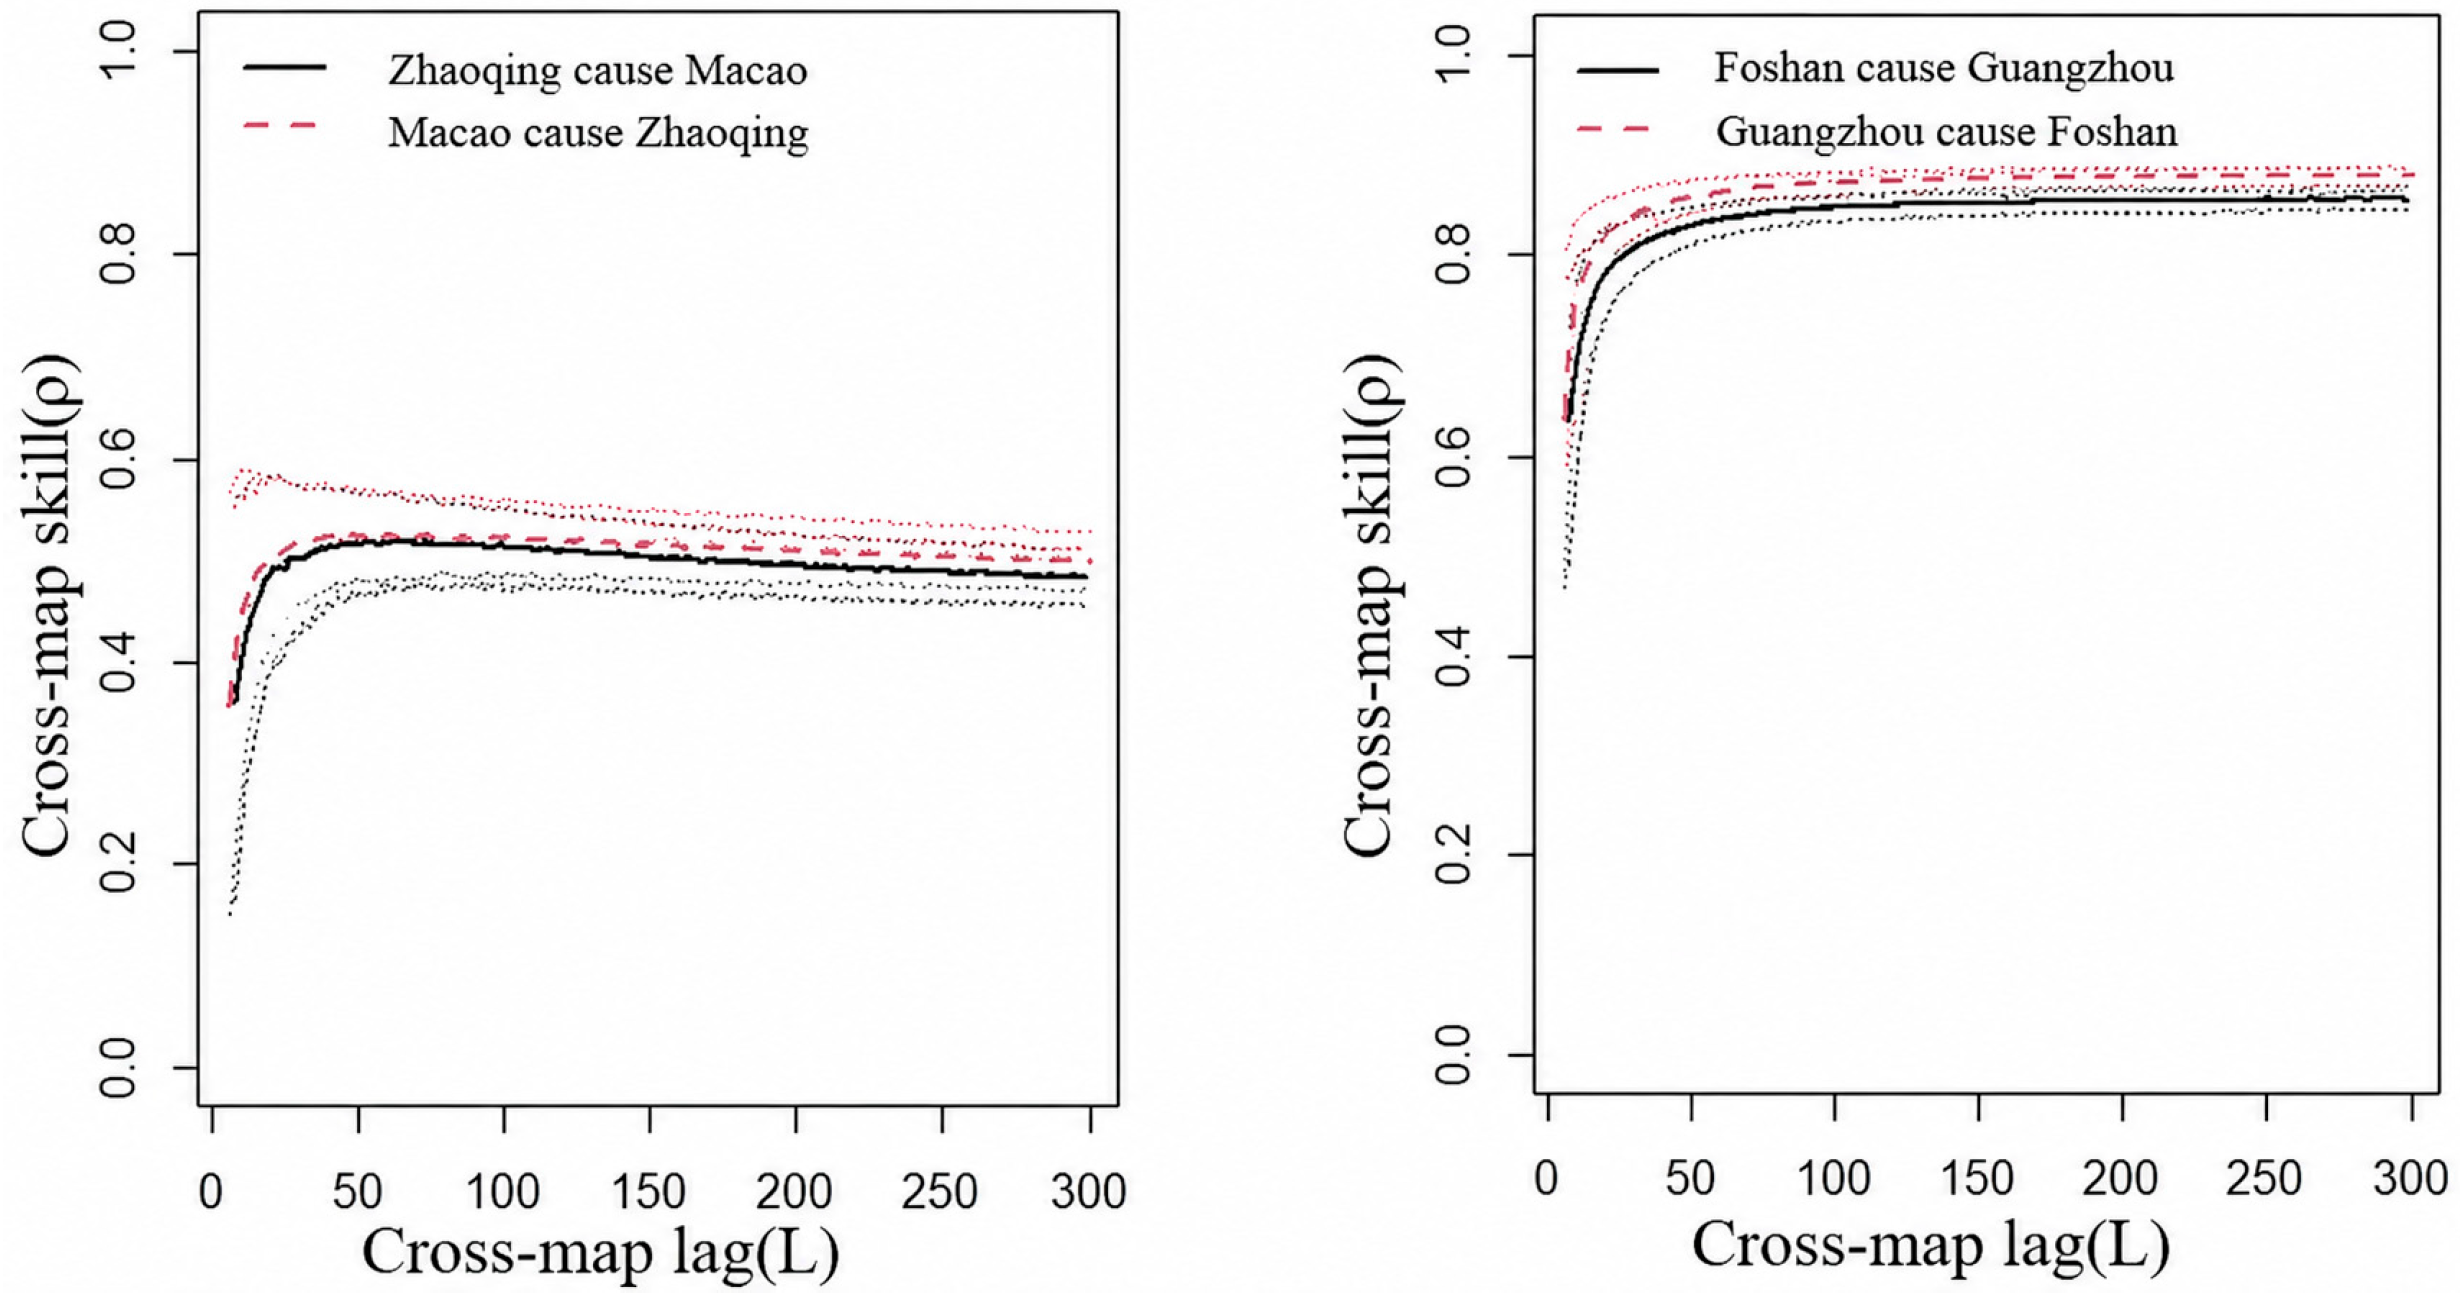
After applying the CCM convergence criterion, the random-permutation surrogate test, and the BH-FDR correction, statistically significant directional linkages were retained to construct the binary PM2.5 pollution interaction matrix. The key criterion is whether the cross-mapping prediction skill between two variables converges to a stable level as the library size increases. In the context of this study, a CCM-based directional association between city A and city B reflects the extent to which the PM2.5 dynamics of one city can be reconstructed from the temporal information of the other city. Since it is impractical to display all CCM test results, two representative city pairs with the highest and lowest CCM coefficients were selected for illustration, as shown in Figure 3.
For Zhaoqing and Macao SAR, the CCM curves remain low and decline slightly as the library size increases, indicating weak mutual predictability and limited spatial association between the two cities. In contrast, the CCM coefficients between Foshan and Guangzhou are relatively high, and the two curves converge to a similar level with increasing library sizes. This suggests that PM2.5 pollution in Foshan and Guangzhou is closely interconnected, with strong mutual predictability and a bidirectional CCM-based linkage.

3.2.3. Intercity Interaction Effects

Using daily city-level PM2.5 time series from 2016 to 2022, this study estimated CCM coefficients for all 110 possible directed city pairs. As shown in Figure 4, the coefficients ranged from 0.4993 to 0.8978. The strongest CCM-based directional association was observed from Foshan to Guangzhou, whereas the weakest association was observed from Macao SAR to Zhaoqing. In terms of outgoing effects, Shenzhen showed the strongest overall linkage with other cities, while Zhaoqing showed the weakest. For incoming effects, Zhongshan was most strongly associated with other cities, whereas Zhaoqing was least affected. These results indicate clear heterogeneity in outgoing and incoming PM2.5-related linkages among GBA cities.

3.3. Network Characteristics of Intercity Pollution Linkages

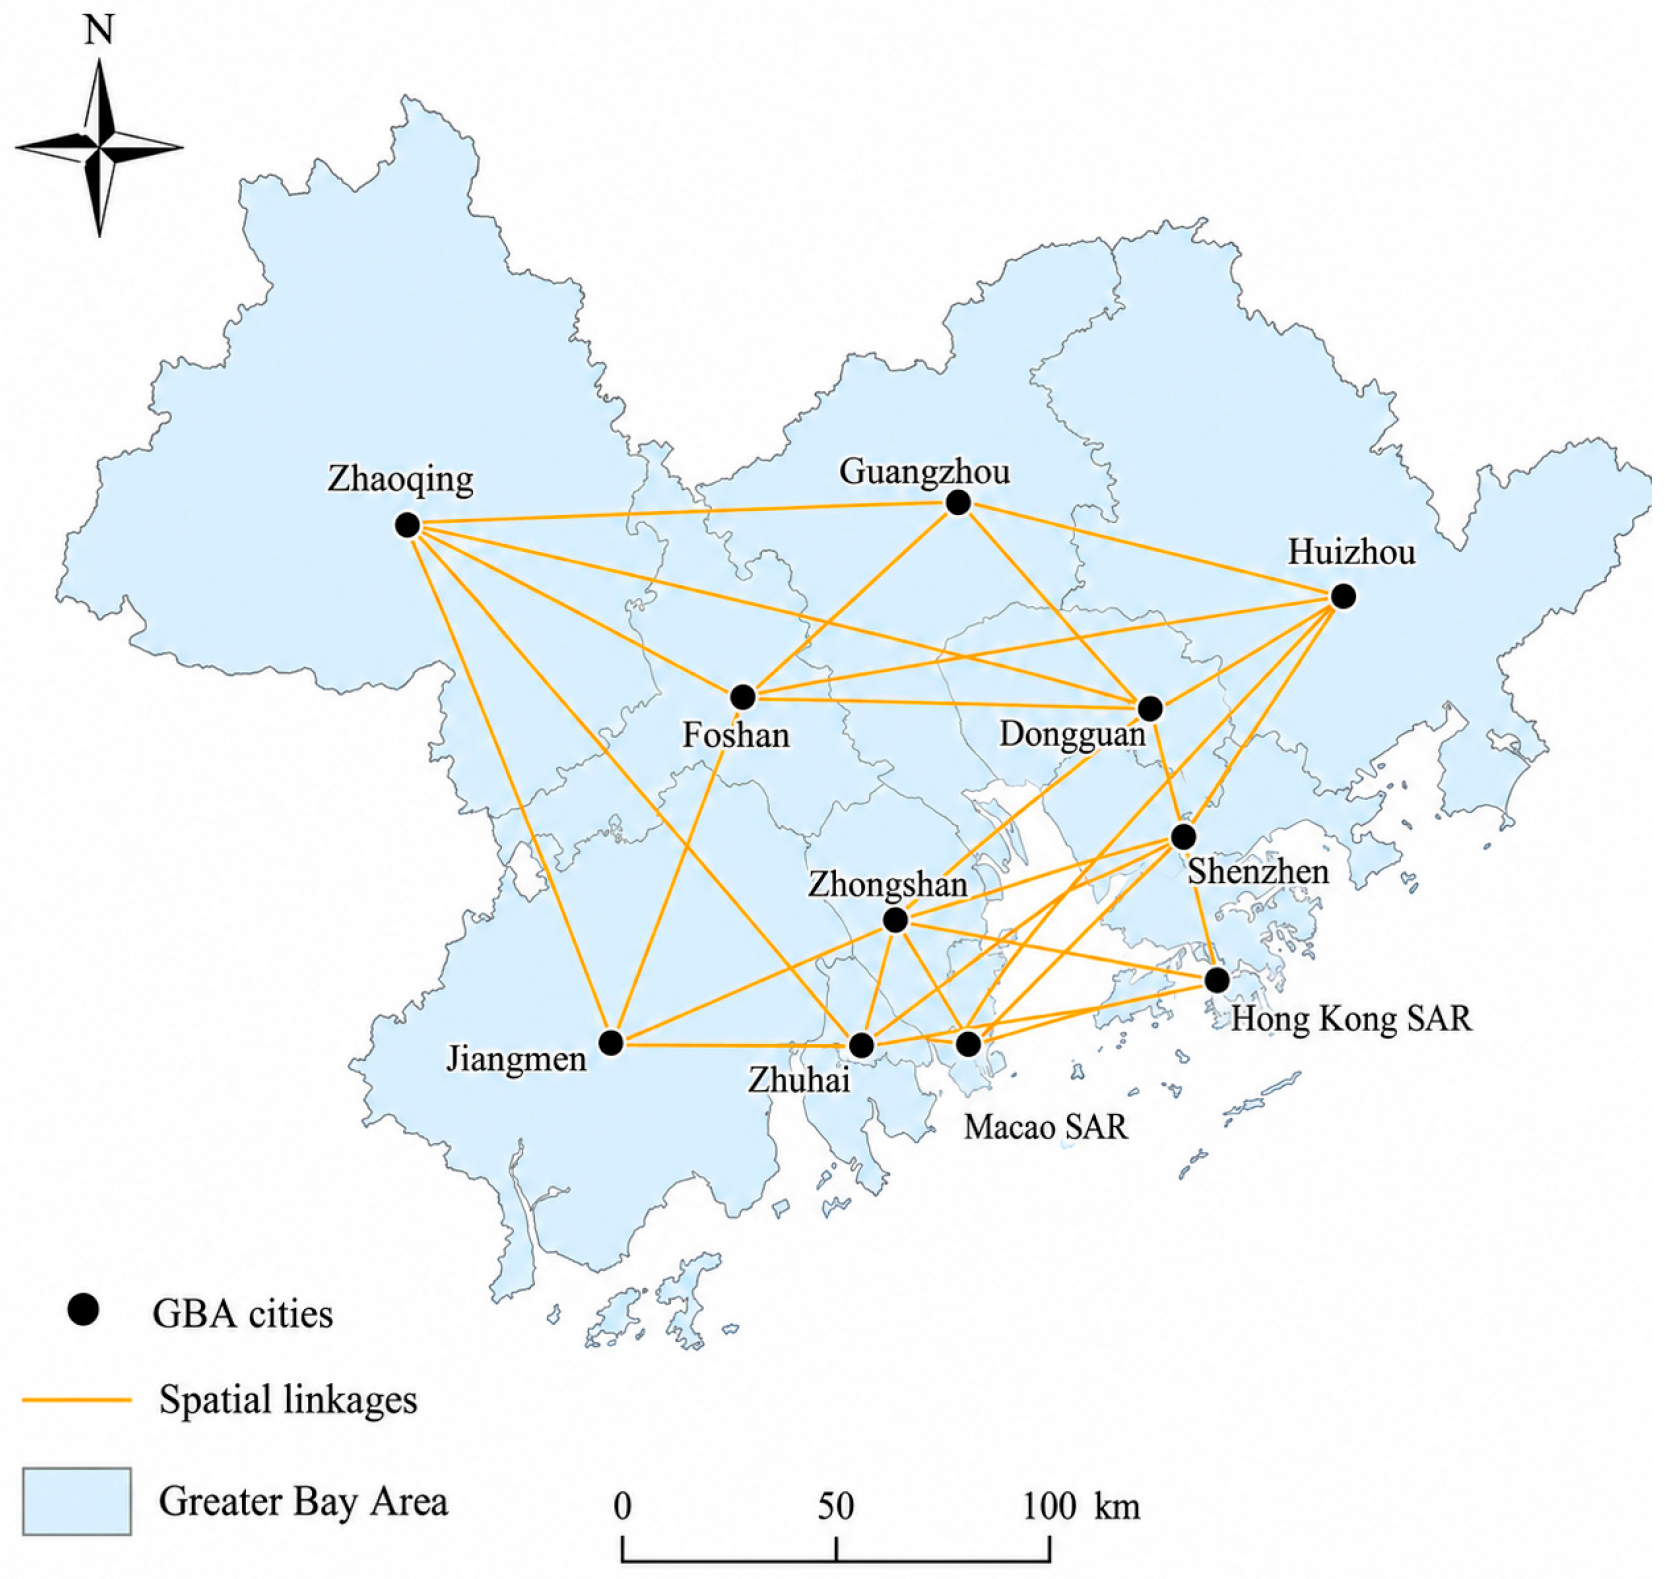
Based on the significant CCM-based directional associations, a directed PM2.5 pollution network was constructed for the 11 GBA cities and SARs. The network was visualized using ArcGIS, as shown in Figure 5. The results indicate that intercity PM2.5-related linkages in the GBA form a complex but structured network during the study period.

3.3.1. Overall Characteristics of the Pollution Network

Among the 11 GBA cities and SARs, the maximum number of possible directed ties is 110. After significance testing, 58 CCM-based directional linkages were identified, yielding a network density of 0.527. This indicates that approximately 53% of all possible city-to-city linkages were observed in the PM2.5 pollution network.
The network connectedness is 1, indicating that all cities and SARs belong to the same connected structure. The network efficiency is 0.533, suggesting that PM2.5-related directional associations are connected through relatively short paths. The network hierarchy is 0, indicating that there is no evident hierarchical structure among cities. Overall, the GBA PM2.5 pollution network is highly connected but weakly hierarchical, with linkages distributed across multiple cities rather than dominated by a single core city.

3.3.2. Individual Characteristics of the Pollution Network

Table 3 summarizes the centrality measures of cities in the GBA PM2.5 pollution network, including outdegree, indegree, degree, betweenness, and closeness.
The average degree centrality of the 11 cities and SARs is 10.545. Six cities and SARs, namely Shenzhen, Foshan, Huizhou, Dongguan, Zhongshan, and Macao SAR, have degree centrality values above the average. Zhongshan records the highest degree centrality, indicating strong incoming and outgoing linkage activity within the network. Therefore, fluctuations in PM2.5 pollution in Zhongshan may be closely associated with PM2.5 pollution changes in other GBA cities. This pattern may be shaped by multiple factors, such as geographical location, climatic conditions, and economic activities. Cities with lower degree centrality are mainly located in the northwestern GBA, suggesting fewer pollution linkages with other cities. This further highlights the role of geographical location in shaping intercity pollution associations.
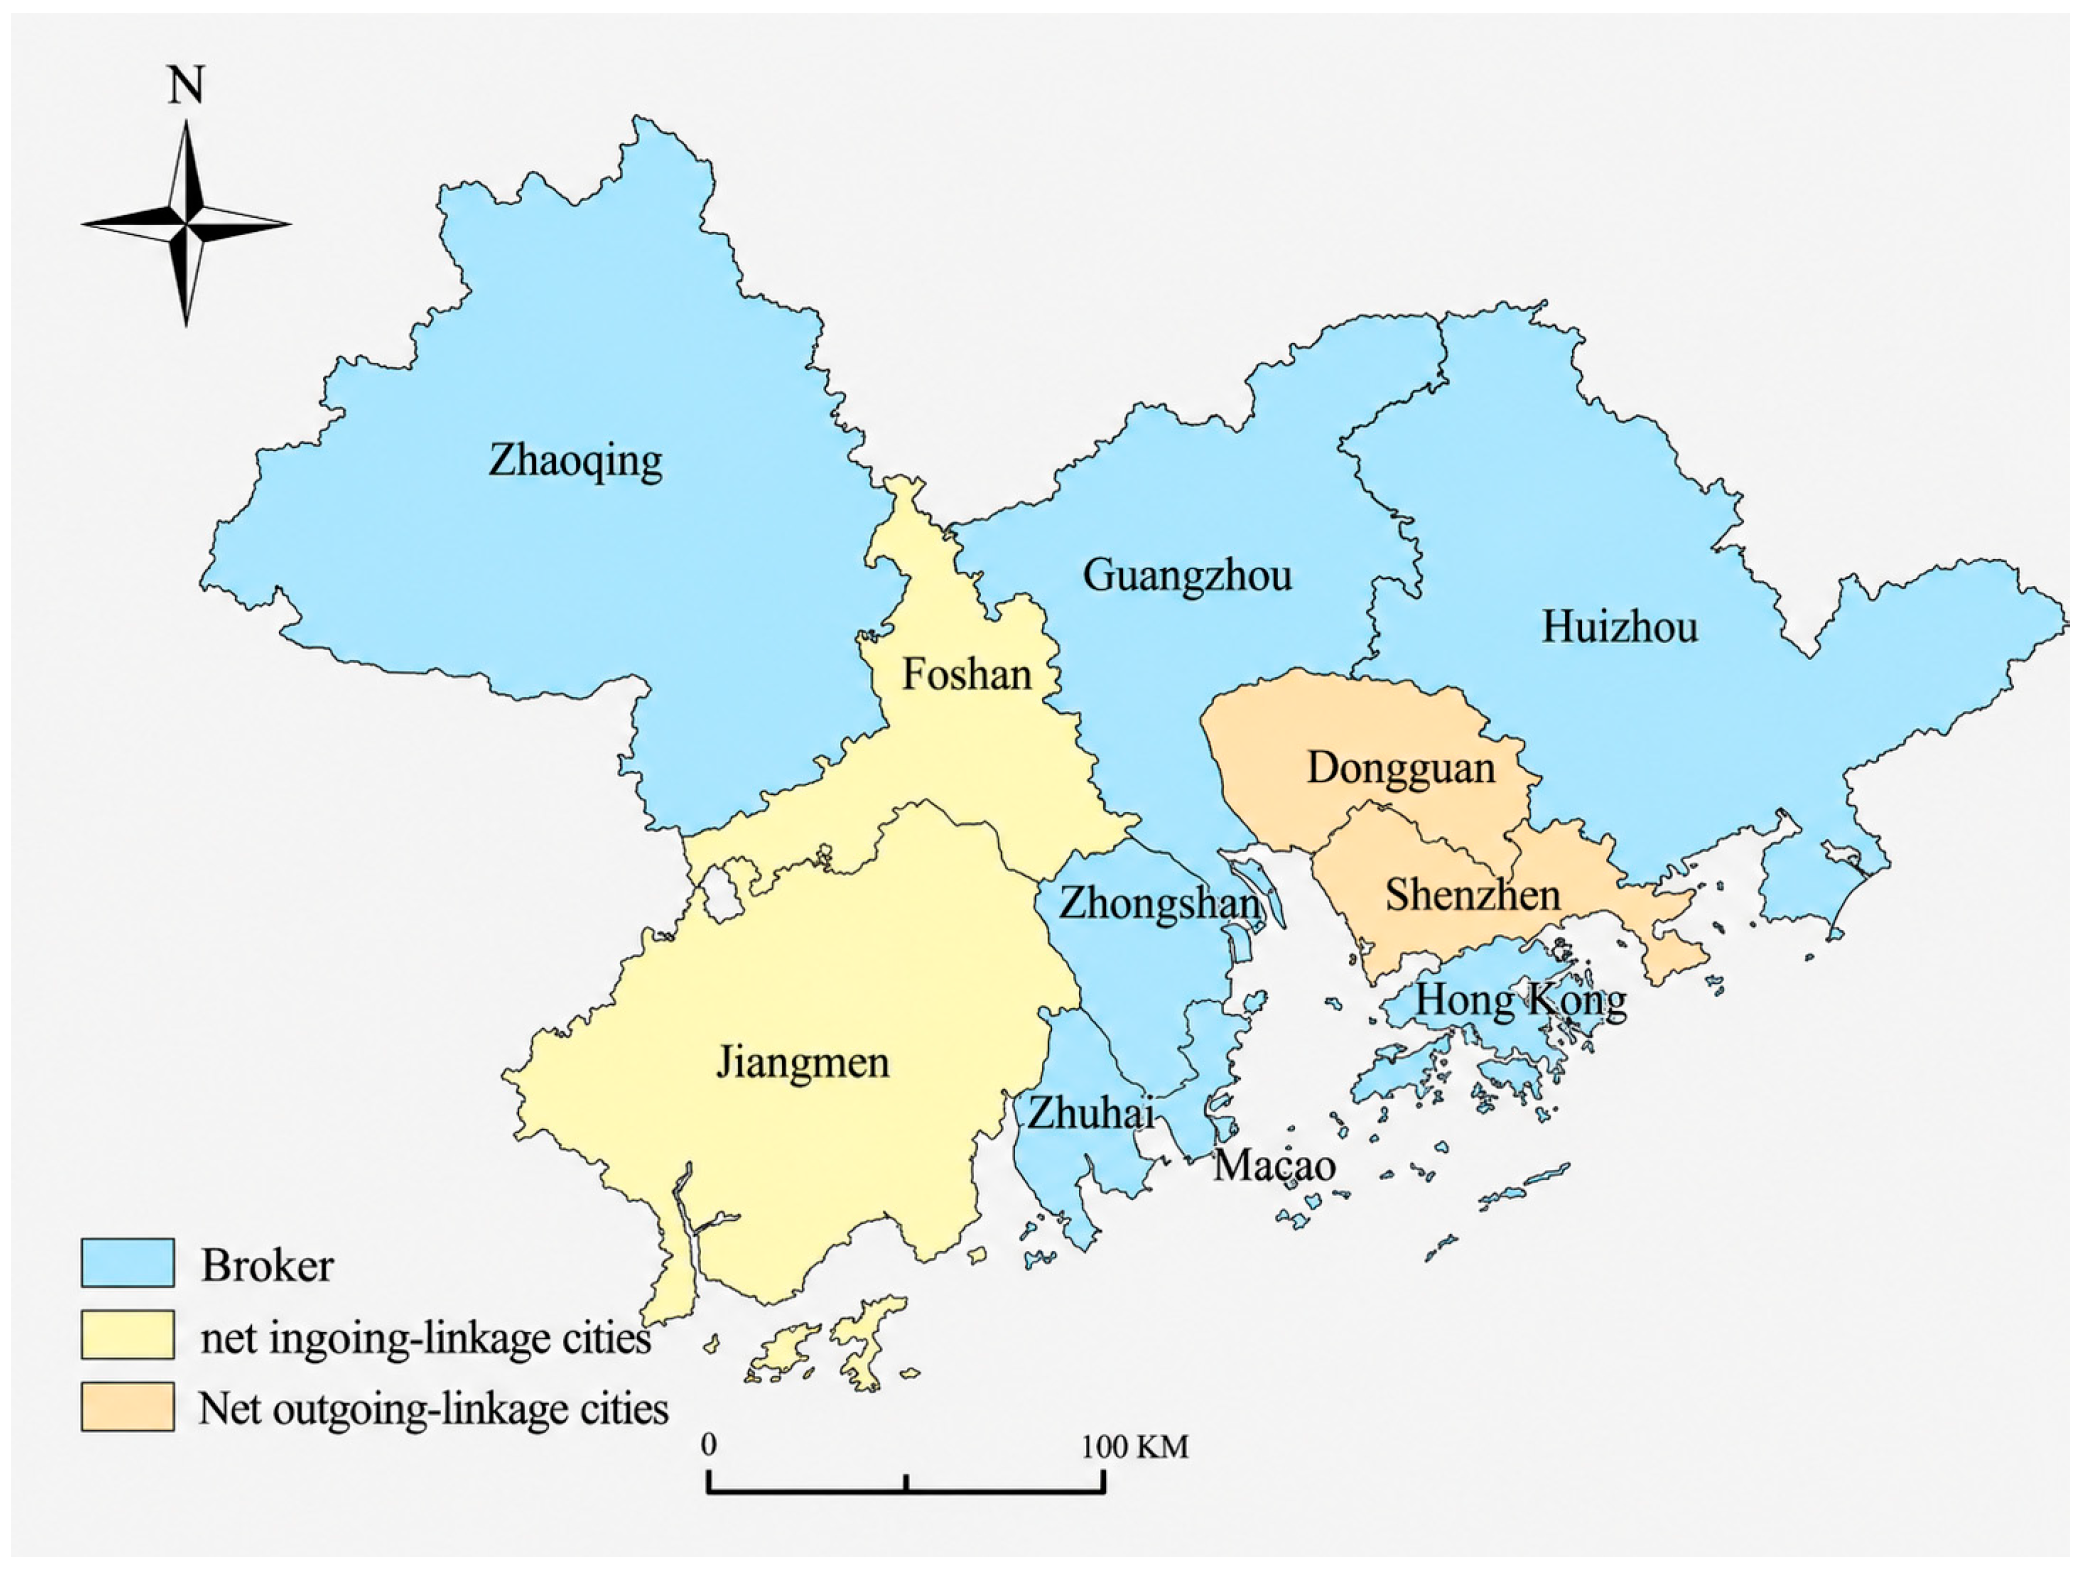
Degree centrality can be decomposed into outdegree and indegree. Cities with higher outdegree than indegree were classified as net outgoing-linkage cities, whereas those with higher indegree than outdegree were classified as net incoming-linkage cities. Cities with equal outdegree and indegree were regarded as broker-type cities. As shown in Figure 6, Dongguan and Shenzhen are net outgoing-linkage cities, Foshan and Jiangmen are net incoming-linkage cities, and the remaining cities and SARs are broker-type cities. This pattern suggests an east–west cross-regional linkage structure in the GBA.
The average betweenness centrality of the 11 cities and SARs is 0.067, indicating close intercity dependence in the PM2.5 pollution network. Zhongshan has the highest betweenness centrality, with a value of 0.083, suggesting that it occupies an important intermediary position in the GBA network. Among the 11 cities and special administrative regions, six cities have betweenness centrality values above the average, indicating that they are relatively close to the network center and may play leading or coordinating roles in the relational structure. Zhaoqing has a betweenness centrality value notably lower than the average. Since Zhaoqing is located at the northwestern periphery of the GBA, it shows weaker intermediary involvement in the PM2.5 linkage network and occupies a relatively peripheral position in the network structure.
The average closeness centrality is 5.727, and five cities have values above the average. Dongguan has the highest closeness centrality, indicating that it can reach other nodes more effectively through directed paths in the pollution network. In contrast, Guangzhou and Zhuhai have relatively low closeness centrality values, suggesting weaker directed reachability. The closeness centrality values of Zhaoqing and Hong Kong SAR are 0.000. This result does not contradict the network connectedness value of 1 reported above. Network connectedness indicates that all cities belong to the same overall connected structure, whereas closeness centrality was calculated based on directed reachability. Therefore, the zero values indicate that Zhaoqing and Hong Kong SAR could not reach other nodes through complete directed paths under the directed-network calculation, although they still belonged to the overall connected pollution network.

3.3.3. Motif Analysis of the Pollution Network

Motif analysis was used to further examine the local structure of the GBA PM2.5 pollution network. As shown in Table 4, F8X, GCX, FMF, JQF, and GDF are statistically significant and have positive Z-scores, indicating that these local configurations are overrepresented in the observed network. In contrast, F8R, GQX, IMF, F7F, FKX, GOX, K4F, and GCR are not statistically significant.
The significant motifs mainly reflect one-way linkages, partial reciprocal structures, and intermediary configurations. F8X and GCX suggest that some cities serve as intermediate nodes with both incoming and outgoing PM2.5-related linkages, while FMF, JQF, and GDF indicate strengthened local interconnections among selected nodes. Overall, the motif results suggest that intercity PM2.5 linkages in the GBA are not dominated by fully integrated or highly reciprocal local structures. Instead, the network is mainly organized through intermediary linkage patterns. The non-significance of K4F, which represents a more integrated structure in which all nodes maintain both sending and receiving relationships, further indicates that fully connected local diffusion is not the dominant pattern of PM2.5 linkage organization in the GBA.

3.4. Factors Associated with the Formation of Intercity PM2.5 Pollution Linkages

To examine the formation of intercity PM2.5 pollution linkages, ERGM was estimated for the GBA PM2.5 pollution network by incorporating self-organization terms, city-level attributes, and exogenous network covariates, as reported in Table 5.
Models (1) and (2) examine the effects of PM2.5 pollution categories after controlling for edges and mutuality. The mutuality coefficients are positive and significant, indicating strong reciprocal dependence in the GBA PM2.5 pollution network. The pollution-category effects are also significant, suggesting that cities with higher pollution levels and cities with similar pollution levels are more likely to form PM2.5-related linkages.
Model (3) incorporates natural and socioeconomic node covariates. Temperature, economic development, and population density are positively associated with linkage formation, whereas precipitation is negatively associated with linkage formation. The share of secondary industry is not significant. Model (4) further includes dyadic covariates, and the results remain broadly consistent. Among the dyadic covariates, geographical proximity shows the strongest positive association, followed by meteorological association and economic association. These results indicate that the formation of intercity PM2.5 linkages is jointly shaped by local city attributes and pairwise intercity relationships.

3.5. Trajectory-Based Consistency Check for CCM-Based Linkages

To provide a trajectory-based consistency check for selected CCM-based directional linkages, HYSPLIT backward trajectory analysis was conducted for selected relatively strong and weak statistically significant mainland city-to-city linkages according to their CCM coefficients. This analysis was not intended to validate the full PM2.5 pollution network or to quantify source contributions. Instead, it was used to examine whether relatively strong CCM-based linkages showed higher source-side trajectory consistency than relatively weak linkages during high-PM2.5 episodes.
As shown in Table 6, the selected strong CCM-based linkages had source-side consistency ratios of 1.00, 0.85, and 0.67. Dongguan → Guangzhou showed full source-side consistency because the source-side trajectory cluster was also the largest trajectory cluster for Guangzhou. Shenzhen → Zhuhai and Foshan → Dongguan showed substantial, although not dominant, source-side trajectory consistency. In comparison, the selected weak CCM-based linkages had lower consistency ratios of 0.47, 0.17, and 0.00. Zhaoqing → Zhongshan showed some source-side consistency but remained clearly below the largest trajectory cluster, while Zhuhai → Zhaoqing and Zhaoqing → Shenzhen showed limited or absent source-side consistency.
Overall, the selected relatively strong CCM-based linkages exhibited clearer source-side trajectory consistency than the selected relatively weak linkages. This result indicates that selected strong CCM-based linkages were more consistent with air-mass pathways during high-PM2.5 episodes than selected weak linkages.

4. Discussion

4.1. Interpretation of Main Findings

4.1.1. Nonlinear Intercity Interaction Effects of PM2.5 Pollution

The CCM results show that PM2.5-related linkages among GBA cities are not merely synchronous concentration changes, but involve nonlinear directional associations. This finding is consistent with previous studies showing that particulate pollution in the Pearl River Delta is affected by regional transport, secondary transformation, atmospheric circulation, and local emissions [20,21,22,23]. Recent evidence also suggests that PM2.5 nitrate transport in this region may occur through both direct particle movement and precursor transport followed by local chemical formation [52]. However, CCM does not directly simulate physical transport or source contribution; therefore, the identified linkages should be interpreted as data-driven directional associations rather than evidence of emission-to-receptor causality. Stronger central-city linkages may reflect closer spatial and functional embedding, whereas weaker peripheral linkages may reflect spatial separation and weaker coupling.
The HYSPLIT-based consistency check provides limited auxiliary support for interpreting selected CCM-based directional linkages. The fact that the selected relatively strong CCM-based linkages showed higher source-side trajectory consistency than the selected relatively weak linkages suggests that some strong directional associations are broadly consistent with air-mass movement during high-PM2.5 episodes. However, this analysis should be understood as a diagnostic consistency check rather than source-apportionment or chemical-transport validation, and it should not be interpreted as evidence that all CCM-based linkages represent physically verified pollutant-transport pathways.

4.1.2. Network Structure and Motif Patterns of PM2.5 Pollution Interactions

The network and motif results indicate that intercity PM2.5 linkages in the GBA are highly connected but weakly hierarchical. This structure suggests that PM2.5-related interactions are distributed across multiple cities rather than organized around a single dominant center. Such a pattern is consistent with complex-network studies showing that network approaches can reveal clustered regions and cooperative control areas that are difficult to identify through single-city or attribute-based methods [53].
The centrality and motif findings further suggest that several cities function as bridge nodes in the regional PM2.5 pollution network. This is consistent with governance network studies showing that bridging actors can facilitate information exchange, coordination, and collective action across otherwise separated groups [54]. Therefore, collaborative PM2.5 governance should consider not only cities with high pollution levels, but also cities occupying key intermediary positions in the network.

4.1.3. Factors Associated with Intercity PM2.5 Pollution Linkages

The ERGM results indicate that intercity PM2.5 linkages are shaped by both environmental conditions and socioeconomic connections. Meteorological factors may affect the accumulation, dispersion, and removal of fine particles, while economic development and population density may intensify commuting, freight movement, energy consumption, and other cross-city activities. The positive effects of geographical proximity, meteorological association, and economic association further suggest that the GBA PM2.5 pollution network cannot be explained by distance alone.
The insignificant effect of the secondary-industry share does not imply that industrial emissions are unimportant. Rather, it suggests that this broad sectoral indicator may not fully capture differences in emission intensity, industrial composition, pollution-control performance, and cross-city industrial organization within the GBA. More detailed emission inventories and industrial source data would be needed to further examine the role of industrial activities in PM2.5 linkage formation.

4.2. Policy Implications

First, source-oriented emission reduction should be strengthened in the GBA. The unified classification results indicate that PM2.5 levels declined substantially across the region during the study period, while some central and western mainland cities, such as Foshan, Zhaoqing, Jiangmen, Guangzhou, and Zhongshan, still showed relatively higher residual PM2.5 levels in 2022. Therefore, emission-reduction efforts should continue to focus on areas with relatively higher residual PM2.5 concentrations. Meanwhile, transport-related emissions should be treated as an important control priority in densely populated and highly mobile areas. Local governments should further promote new-energy vehicles, improve low-carbon public transport systems, optimize traffic management, and encourage residents and visitors to adopt greener travel modes. These measures can help reduce local emission pressure while improving the effectiveness of regional PM2.5 pollution control.
Second, network-based linkage management should be emphasized. The network and motif results show that intercity pollution interactions in the GBA are organized through multiple direct and indirect linkage structures, with several cities serving as intermediary or bridge nodes. Therefore, PM2.5 pollution governance should not focus only on emission sources or highly polluted cities, but should also target structurally important intercity linkage structures and intermediary cities. Collaborative governance should pay particular attention to linkages between cities with stronger outgoing linkage activity and those with stronger incoming linkage activity. Along these routes, coordinated monitoring zones, emission-control corridors, and joint emergency-response mechanisms should be established to improve real-time tracking, early warning, and cross-city intervention capacity.
Third, cross-jurisdictional coordination and multi-actor participation should be improved. The ERGM results suggest that economic development, population density, geographical proximity, meteorological association, and economic association all contribute to the formation of intercity pollution linkages. This implies that regional PM2.5 pollution governance in the GBA should be integrated with broader socioeconomic coordination. Mainland cities, Hong Kong SAR, and Macao SAR should strengthen data sharing, joint monitoring, policy communication, and coordinated implementation of pollution-control measures. At the same time, market-based incentives, environmental regulation, and public participation should be combined to encourage enterprises and residents to participate in emission reduction. A governance framework involving governments, enterprises, and the public can support more effective and sustainable air quality improvement across the GBA.

4.3. Limitations and Future Research

This study has several limitations. First, the analysis focused only on PM2.5. Other pollutants, such as O3, NO2, SO2, CO, and PM10, may have different sources, chemical processes, atmospheric lifetimes, and meteorological sensitivities. Future research should construct pollutant-specific or multi-pollutant networks to compare intercity linkage patterns across pollutants.
Second, this study used city-level daily PM2.5 averages as the basic observational unit. Although this scale is suitable for examining intercity linkages, it may smooth intra-city spatial heterogeneity and obscure local hotspots. Differences in monitoring-station numbers, spatial placement, and data coverage across mainland GBA cities, Hong Kong SAR, and Macao SAR may also introduce measurement inconsistency. Future studies should use station-level observations, remote-sensing products, or high-resolution gridded datasets to construct finer-scale pollution networks.
Third, some potentially important explanatory factors were not fully included in the ERGM analysis, such as traffic flow, port emissions, industrial point sources, energy-consumption structure, land-use intensity, and cross-boundary policy coordination. Incorporating these variables would help further explain the formation mechanisms of intercity PM2.5 linkages in the GBA.
Fourth, the HYSPLIT analysis provides a limited trajectory-based consistency check for selected CCM-based linkages. However, it was not designed to quantify source contributions or distinguish direct PM2.5 transport from precursor transport followed by secondary formation. Future research should combine CCM-based network analysis with emission inventories, source apportionment, wind-field diagnostics, boundary-layer analysis, and chemical transport models to more directly evaluate atmospheric transport mechanisms.

5. Conclusions

This study examined intercity PM2.5 pollution interactions and their associated factors in the GBA using an integrated framework combining CCM, SNA, motif analysis, and ERGM.
First, PM2.5 pollution among GBA cities exhibits nonlinear directional associations. Among all estimated city pairs, the strongest CCM-based directional association was observed from Foshan to Guangzhou, whereas the weakest CCM-based directional association was observed from Macao SAR to Zhaoqing. This indicates that intercity PM2.5 pollution linkages in the GBA are not merely spatial correlations, but involve nonlinear directional dependence among cities.
Second, the GBA PM2.5 pollution network is highly connected but weakly hierarchical. The network analysis shows that intercity PM2.5 pollution interactions are distributed across multiple cities rather than dominated by a single core city. The centrality and motif results further indicate that many cities serve as intermediary or bridge nodes, and that pollution interactions are mainly organized through intermediary linkage patterns rather than fully reciprocal local linkage structures.
Third, the formation of intercity pollution linkages is jointly influenced by natural conditions, socioeconomic characteristics, and dyadic relationships. Temperature, precipitation, economic development, population density, geographical proximity, meteorological association, and economic association all affect linkage formation, whereas the share of secondary industry does not show a significant effect. This may be because this broad industrial-structure indicator cannot fully reflect differences in emission intensity, industrial composition, pollution-control performance, and cross-city industrial organization within the GBA.
Overall, this study provides a CCM-based directional-network perspective for understanding regional PM2.5 pollution interactions in the GBA. The findings suggest that collaborative PM2.5 pollution governance should combine source-oriented emission reduction, network-based linkage management, and cross-jurisdictional coordination.

Author Contributions

Conceptualization, Z.H. and J.H.; methodology, Z.H. and J.H.; software, Z.H. and R.W.; investigation, J.H. and Z.H.; resources, Z.H. and R.W.; writing—original draft preparation, Z.H. and R.W.; writing—review and editing, J.H.; visualization, Z.H.; funding acquisition, J.H. All authors have read and agreed to the published version of the manuscript.

Funding

This research was funded by the National Natural Science Foundation of China (Grant No. 72203197) and the Key Project of Philosophy and Social Science Research in Colleges and Universities in Henan Province (No. 2026–YYZD-23).

Data Availability Statement

Data supporting the conclusions are available from the corresponding author upon reasonable request.

Conflicts of Interest

The authors declare no conflicts of interest.

References

  1. Pope, C.A., III; Dockery, D.W. Health effects of fine particulate air pollution: Lines that connect. J. Air Waste Manag. Assoc. 2006, 56, 709–742. [Google Scholar] [CrossRef] [PubMed]
  2. Cohen, A.J.; Brauer, M.; Burnett, R.; Anderson, H.R.; Frostad, J.; Estep, K.; Balakrishnan, K.; Brunekreef, B.; Dandona, L.; Dandona, R.; et al. Estimates and 25-year trends of the global burden of disease attributable to ambient air pollution: An analysis of data from the Global Burden of Diseases Study 2015. Lancet 2017, 389, 1907–1918. [Google Scholar] [CrossRef]
  3. GBD 2019 Risk Factors Collaborators. Global burden of 87 risk factors in 204 countries and territories, 1990–2019: A systematic analysis for the Global Burden of Disease Study 2019. Lancet 2020, 396, 1223–1249. [Google Scholar] [CrossRef] [PubMed]
  4. Burnett, R.; Chen, H.; Szyszkowicz, M.; Fann, N.; Hubbell, B.; Pope, C.A., III; Apte, J.S.; Brauer, M.; Cohen, A.; Weichenthal, S.; et al. Global estimates of mortality associated with long-term exposure to outdoor fine particulate matter. Proc. Natl. Acad. Sci. USA 2018, 115, 9592–9597. [Google Scholar] [CrossRef] [PubMed]
  5. Lelieveld, J.; Evans, J.S.; Fnais, M.; Giannadaki, D.; Pozzer, A. The contribution of outdoor air pollution sources to premature mortality on a global scale. Nature 2015, 525, 367–371. [Google Scholar] [CrossRef] [PubMed]
  6. Liu, C.; Chen, R.; Sera, F.; Vicedo-Cabrera, A.M.; Guo, Y.; Tong, S.; Coelho, M.S.Z.S.; Saldiva, P.H.N.; Lavigne, E.; Matus, P.; et al. Ambient particulate air pollution and daily mortality in 652 cities. N. Engl. J. Med. 2019, 381, 705–715. [Google Scholar] [CrossRef] [PubMed]
  7. Chan, C.K.; Yao, X. Air pollution in mega cities in China. Atmos. Environ. 2008, 42, 1–42. [Google Scholar] [CrossRef]
  8. Huang, J.; Pan, X.; Guo, X.; Li, G. Health impact of China’s Air Pollution Prevention and Control Action Plan: An analysis of national air quality monitoring and mortality data. Lancet Planet. Health 2018, 2, e313–e323. [Google Scholar] [CrossRef] [PubMed]
  9. Zhang, Q.; Zheng, Y.; Tong, D.; Shao, M.; Wang, S.; Zhang, Y.; Xu, X.; Wang, J.; He, H.; Liu, W.; et al. Drivers of improved PM2.5 air quality in China from 2013 to 2017. Proc. Natl. Acad. Sci. USA 2019, 116, 24463–24469. [Google Scholar] [CrossRef] [PubMed]
  10. Xiao, Q.; Geng, G.; Xue, T.; Liu, S.; Cai, C.; He, K.; Zhang, Q. Tracking PM2.5 and O3 pollution and the related health burden in China 2013–2020. Environ. Sci. Technol. 2022, 56, 6922–6932. [Google Scholar] [CrossRef] [PubMed]
  11. Li, K.; Jacob, D.J.; Liao, H.; Shen, L.; Zhang, Q.; Bates, K.H. Anthropogenic drivers of 2013–2017 trends in summer surface ozone in China. Proc. Natl. Acad. Sci. USA 2019, 116, 422–427. [Google Scholar] [CrossRef] [PubMed]
  12. Lu, X.; Zhang, L.; Wang, X.; Gao, M.; Li, K.; Zhang, Y.; Yue, X.; Zhang, Y. Rapid increases in warm-season surface ozone and resulting health impact in China since 2013. Environ. Sci. Technol. Lett. 2020, 7, 240–247. [Google Scholar] [CrossRef]
  13. Feng, T.; Du, H.; Lin, Z.; Zuo, J. Spatial spillover effects of environmental regulations on air pollution: Evidence from urban agglomerations in China. J. Environ. Manag. 2020, 272, 110998. [Google Scholar] [CrossRef] [PubMed]
  14. State Council of the People’s Republic of China. Notice of the State Council on Issuing the Action Plan for Continuous Improvement of Air Quality. Available online: https://www.mee.gov.cn/zcwj/gwywj/202312/t20231208_1058492.shtml (accessed on 18 June 2026).
  15. Li, X.; Xue, W.; Wang, K.; Che, Y.; Wei, J. Environmental regulation and synergistic effects of PM2.5 control in China. J. Clean. Prod. 2022, 337, 130438. [Google Scholar] [CrossRef]
  16. Zheng, J.; Zhang, L.; Che, W.; Zheng, Z.; Yin, S. A highly resolved temporal and spatial air pollutant emission inventory for the Pearl River Delta region, China and its uncertainty assessment. Atmos. Environ. 2009, 43, 5112–5122. [Google Scholar] [CrossRef]
  17. Xie, X.; Liu, X.; McNay, I. One country with two systems: The characteristics and development of higher education in the Guangdong–Hong Kong–Macau Greater Bay Area. Humanit. Soc. Sci. Commun. 2023, 10, 1. [Google Scholar] [CrossRef]
  18. Zhong, L.; Louie, P.K.K.; Zheng, J.; Yuan, Z.; Yue, D.; Ho, J.W.K.; Lau, A.K.H. Science–policy interplay: Air quality management in the Pearl River Delta region and Hong Kong. Atmos. Environ. 2013, 76, 3–10. [Google Scholar] [CrossRef]
  19. Zhong, L.; Louie, P.K.K.; Zheng, J.; Wai, K.M.; Ho, J.W.K.; Yuan, Z.; Lau, A.K.H.; Yue, D.; Zhou, Y. The Pearl River Delta regional air quality monitoring network—Regional collaborative efforts on joint air quality management. Aerosol Air Qual. Res. 2013, 13, 1582–1597. [Google Scholar] [CrossRef]
  20. Lin, C.; Li, Y.; Lau, A.K.H.; Li, C.; Fung, J.C.H. 15-Year PM2.5 trends in the Pearl River Delta region and Hong Kong from satellite observation. Aerosol Air Qual. Res. 2018, 18, 2355–2362. [Google Scholar] [CrossRef]
  21. Huang, X.F.; Zou, B.B.; He, L.Y.; Hu, M.; Prévôt, A.S.H.; Zhang, Y.H. Exploration of PM2.5 sources on the regional scale in the Pearl River Delta based on ME-2 modeling. Atmos. Chem. Phys. 2018, 18, 11563–11580. [Google Scholar] [CrossRef]
  22. Chen, Q.; Sheng, L.; Gao, Y.; Miao, Y.; Hai, S.; Gao, S.; Gao, Y. The effects of the trans-regional transport of PM2.5 on a heavy haze event in the Pearl River Delta in January 2015. Atmosphere 2019, 10, 237. [Google Scholar] [CrossRef]
  23. Zhao, H.; Chen, Z.; Li, C. Changes of PM2.5 and O3 and their impact on human health in the Guangdong–Hong Kong–Macao Greater Bay Area. Sci. Rep. 2024, 14, 11190. [Google Scholar] [CrossRef] [PubMed]
  24. Berkowicz, R.; Palmgren, F.; Hertel, O.; Vignati, E. Using measurements of air pollution in streets for evaluation of urban air quality—Meteorological analysis and model calculations. Sci. Total Environ. 1996, 189–190, 259–265. [Google Scholar] [CrossRef]
  25. Zhang, H.; Wang, X.; Shen, X.; Li, X.; Wu, B.; Chen, W.; Yao, Z. Analysis of air pollution characteristics, transport pathways and potential source areas identification in Beijing before, during and after the COVID-19 outbreak. Front. Environ. Sci. 2022, 10, 982566. [Google Scholar] [CrossRef]
  26. Ning, W.; Xing, Z.; Wei, M.; Li, M.; Zhang, M.; Liu, H. Study on the influence of regional transportation on PM2.5 based on the RAMS-CMAQ model in Weihai, a typical coastal city of northern China. Aerosol Air Qual. Res. 2021, 21, 200266. [Google Scholar] [CrossRef]
  27. Chang, J.C.; Hanna, S.R. Air quality model performance evaluation. Meteorol. Atmos. Phys. 2004, 87, 167–196. [Google Scholar] [CrossRef]
  28. Shaddick, G.; Thomas, M.L.; Green, A.; Brauer, M.; van Donkelaar, A.; Burnett, R.; Chang, H.H.; Cohen, A.; Van Dingenen, R.; Dora, C.; et al. Data integration model for air quality: A hierarchical approach to the global estimation of exposures to ambient air pollution. J. R. Stat. Soc. Ser. C Appl. Stat. 2018, 67, 231–253. [Google Scholar] [CrossRef]
  29. Vallero, D.A. Fundamentals of Air Pollution, 5th ed.; Academic Press: Cambridge, MA, USA, 2014. [Google Scholar]
  30. Granger, C.W.J. Investigating causal relations by econometric models and cross-spectral methods. Econometrica 1969, 37, 424–438. [Google Scholar] [CrossRef]
  31. Sugihara, G.; May, R.; Ye, H.; Hsieh, C.H.; Deyle, E.R.; Fogarty, M.; Munch, S.B. Detecting causality in complex ecosystems. Science 2012, 338, 496–500. [Google Scholar] [CrossRef] [PubMed]
  32. Wasserman, S.; Faust, K. Social Network Analysis: Methods and Applications; Cambridge University Press: Cambridge, UK, 1994. [Google Scholar]
  33. Freeman, L.C. Centrality in social networks conceptual clarification. Soc. Netw. 1978, 1, 215–239. [Google Scholar] [CrossRef]
  34. Borgatti, S.P. Centrality and network flow. Soc. Netw. 2005, 27, 55–71. [Google Scholar] [CrossRef]
  35. Milo, R.; Shen-Orr, S.; Itzkovitz, S.; Kashtan, N.; Chklovskii, D.; Alon, U. Network motifs: Simple building blocks of complex networks. Science 2002, 298, 824–827. [Google Scholar] [CrossRef] [PubMed]
  36. Alon, U. Network motifs: Theory and experimental approaches. Nat. Rev. Genet. 2007, 8, 450–461. [Google Scholar] [CrossRef] [PubMed]
  37. Robins, G.; Pattison, P.; Kalish, Y.; Lusher, D. An introduction to exponential random graph models for social networks. Soc. Netw. 2007, 29, 173–191. [Google Scholar] [CrossRef]
  38. Lusher, D.; Koskinen, J.; Robins, G. (Eds.) Exponential Random Graph Models for Social Networks: Theory, Methods, and Applications; Cambridge University Press: Cambridge, UK, 2013. [Google Scholar]
  39. Emerson, K.; Nabatchi, T.; Balogh, S. An integrative framework for collaborative governance. J. Public Adm. Res. Theory 2012, 22, 1–29. [Google Scholar] [CrossRef]
  40. Ansell, C.; Gash, A. Collaborative governance in theory and practice. J. Public Adm. Res. Theory 2008, 18, 543–571. [Google Scholar] [CrossRef]
  41. Feiock, R.C. The institutional collective action framework. Policy Stud. J. 2013, 41, 397–425. [Google Scholar] [CrossRef]
  42. Yi, H.; Suo, L.; Shen, R.; Zhang, J.; Ramaswami, A.; Feiock, R.C. Regional governance and institutional collective action for environmental sustainability in China. Public Adm. Rev. 2018, 78, 556–566. [Google Scholar] [CrossRef]
  43. Provan, K.G.; Kenis, P. Modes of network governance: Structure, management, and effectiveness. J. Public Adm. Res. Theory 2008, 18, 229–252. [Google Scholar] [CrossRef]
  44. Bodin, Ö. Collaborative environmental governance: Achieving collective action in social-ecological systems. Science 2017, 357, eaan1114. [Google Scholar] [CrossRef] [PubMed]
  45. Li, J. Structural characteristics and evolution trend of collaborative governance of air pollution in “2 + 26” cities from the perspective of social network analysis. Sustainability 2023, 15, 5943. [Google Scholar] [CrossRef]
  46. Ding, A.; Wang, T.; Zhao, M.; Wang, T.; Li, Z. Simulation of sea-land breezes and a discussion of their implications on the transport of air pollution during a multi-day ozone episode in the Pearl River Delta of China. Atmos. Environ. 2004, 38, 6737–6750. [Google Scholar] [CrossRef]
  47. Lu, X.; Chow, K.C.; Yao, T.; Fung, J.C.H.; Lau, A.K.H. Seasonal variation of the land–sea breeze circulation in the Pearl River Delta region. J. Geophys. Res. Atmos. 2009, 114, D17112. [Google Scholar] [CrossRef]
  48. He, G.; Yuan, G.; Liu, Y.; Jiang, Y.; Liu, Y.; Shu, Z.; Ma, X.; Li, Y.; Huo, Z. The effects of topography and urban agglomeration on the sea breeze evolution over the Pearl River Delta region. Atmosphere 2022, 13, 39. [Google Scholar] [CrossRef]
  49. Tao, J.; Huang, J.; Bian, G.; Zhang, L.; Zhou, Z.; Zhang, Z.; Li, J.; Miao, Y.; Yuan, Z.; Sha, Q.; et al. Fine particulate pollution driven by nitrate in the moisture urban atmospheric environment in the Pearl River Delta region of south China. J. Environ. Manag. 2023, 326, 116704. [Google Scholar] [CrossRef] [PubMed]
  50. Wasserman, S.; Pattison, P. Logit models and logistic regressions for social networks: I. An introduction to Markov graphs and p. Psychometrika 1996, 61, 401–425. [Google Scholar] [CrossRef]
  51. Sugihara, G.; May, R.M. Nonlinear forecasting as a way of distinguishing chaos from measurement error in time series. Nature 1990, 344, 734–741. [Google Scholar] [CrossRef] [PubMed]
  52. Qu, K.; Wang, X.; Xiao, T.; Shen, J.; Lin, T.; Chen, D.; He, L.Y.; Huang, X.F.; Zeng, L.; Lu, K.; et al. Cross-regional transport of PM2.5 nitrate in the Pearl River Delta, China: Contributions and mechanisms. Sci. Total Environ. 2021, 753, 142439. [Google Scholar] [CrossRef] [PubMed]
  53. Ying, N.; Duan, W.; Zhao, Z.; Fan, J. Complex network analysis of fine particulate matter (PM2.5): Transport and clustering. Earth Syst. Dyn. 2022, 13, 1029–1039. [Google Scholar] [CrossRef]
  54. Bodin, Ö.; Crona, B.I. The role of social networks in natural resource governance: What relational patterns make a difference? Glob. Environ. Change 2009, 19, 366–374. [Google Scholar] [CrossRef]
Figure 1. Study area. Administrative boundary data were obtained from the National Geomatics Center of China. The map was produced using ArcGIS 10.8 and the WGS 1984 geographic coordinate system.
Atmosphere 17 00676 g001
Figure 2. PM2.5 distribution.
Atmosphere 17 00676 g002
Figure 3. CCM curves for representative city pairs. Solid and dotted lines represent the two opposite cross-mapping directions within each city pair.
Atmosphere 17 00676 g003
Figure 4. Intercity CCM coefficients.
Atmosphere 17 00676 g004
Figure 5. Intercity pollution network.
Atmosphere 17 00676 g005
Figure 6. City roles in the pollution network.
Atmosphere 17 00676 g006
Table 1. Descriptive statistics of continuous nodal covariates used in the ERGM.
VariableUnitMeanSDMinMax
Temperature°C23.160.3922.223.5
Precipitationmm1600.37101.891457.21826.4
GDP per capita104 yuan/person15.8611.725.440.8
Population densitypersons/km244195949.527420,705
Secondary industry share%39.0517.726.756.9
Table 2. Optimal embedding dimensions.
City (SAR)Optimal Embedding
Dimension
City (SAR)Optimal Embedding Dimension
Guangzhou5Zhongshan5
Shenzhen5Jiangmen5
Zhuhai3Zhaoqing5
Foshan3Hong Kong3
Huizhou4Macao4
Dongguan5
Table 3. Nodal centrality indicators.
City (SAR)OutdegreeIndegreeDegreeBetweennessCloseness
Guangzhou4480.0560.976
Shenzhen76130.0779.262
Zhuhai55100.0591.042
Foshan56110.0719.912
Huizhou66120.07110.432
Dongguan75120.07712.383
Zhongshan77140.0839.637
Jiangmen46100.0715.613
Zhaoqing3360.0500.000
Hong Kong 4480.0560.000
Macao66120.0673.743
Table 4. Motif analysis results.
CodeMotifFrequencyPZCodeMotifFrequencyPZ
F8RAtmosphere 17 00676 i00134881−2.309FMFAtmosphere 17 00676 i002152301.722
F8XAtmosphere 17 00676 i003327101.333JQFAtmosphere 17 00676 i004145401.854
GQXAtmosphere 17 00676 i005274110.73GOXAtmosphere 17 00676 i00610311−2
IMFAtmosphere 17 00676 i007291010.762K4FAtmosphere 17 00676 i00843110.218
F7FAtmosphere 17 00676 i009182910.000GDFAtmosphere 17 00676 i010145901.315
GCXAtmosphere 17 00676 i011311201.241GCRAtmosphere 17 00676 i012173710.000
FKXAtmosphere 17 00676 i013323611.142
Table 5. ERGM estimation results.
Base ModelNode CovariateNetwork Covariate
(1)(2)(3)(4)
Network Self-organization Effects
Edges−1.8721 ***
(0.0267)
−1.6179 ***
(0.0315)
−2.8713 ***
(0.0779)
−3.0473 ***
(0.1512)
Mutual1.3674 ***
(0.0427)
1.8020 ***
(0.0640)
1.0388 ***
(0.0641)
0.8716 ***
(0.0422)
Individual Attribute Effects
Mid AP0.3319 ***
(0.0214)
0.1843 ***
(0.0201)
0.2249 ***
(0.0431)
0.1623 ***
(0.0244)
High AP0.5871 ***
(0.0201)
0.5179 ***
(0.0369)
0.3601 ***
(0.0503)
0.2513 ***
(0.0307)
Rain −0.0206 **
(0.0102)
−0.0196
(0.0133)
Temp 0.0461 ***
(0.0154)
0.0529 ***
(0.0149)
Rgdp 0.2243 ***
(0.0843)
0.2843 **
(0.1406)
Pop 0.1246 ***
(0.0441)
0.1202 ***
(0.0401)
Ind 0.0313
(0.0201)
0.0165
(0.0284)
Exogenous Network
Effects
Geographical Proximity 1.1216 ***
(0.3197)
Meteorological Association 0.6943 ***
(0.0557)
Economic Association 0.2167 **
(0.1015)
Note: Standard errors are reported in parentheses. ** p < 0.05, *** p < 0.01.
Table 6. HYSPLIT trajectory consistency for selected CCM-based linkages.
Linkage CategoryCCM-Based Directional LinkageCCM Coef.Receptor CitySource-Side Trajectory Cluster (%)Largest Trajectory Cluster (%)Source-Side Consistency Ratio
Strong1Dongguan → Guangzhou0.8816Guangzhou29.729.71
Strong2Shenzhen → Zhuhai0.8798Zhuhai28.934.20.85
Strong3Foshan → Dongguan0.8791Dongguan25.137.50.67
Weak1Zhaoqing → Zhongshan0.5995Zhongshan18.439.40.47
Weak2Zhuhai → Zhaoqing0.5217Zhaoqing5300.17
Weak3Zhaoqing → Shenzhen0.5892Shenzhen043.40
Note: The source-side consistency ratio was calculated by dividing the source-side trajectory-cluster percentage by the largest trajectory-cluster percentage for the receptor city. It indicates trajectory consistency, not source contribution.
Disclaimer/Publisher’s Note: The statements, opinions and data contained in all publications are solely those of the individual author(s) and contributor(s) and not of MDPI and/or the editor(s). MDPI and/or the editor(s) disclaim responsibility for any injury to people or property resulting from any ideas, methods, instructions or products referred to in the content.