Article

Synergistic Evolution of Reservoir Pore Structure and Wettability During Carbonated Water Injection: Implications for CO2 Utilization and Oil Recovery

1
School of Petroleum Engineering, Xi’an Shiyou University, Xi’an 710065, China
2
Shaanxi Key Laboratory of Advanced Stimulation Technology for Oil & Gas Reservoirs, Xi’an 710065, China
3
College of New Energy, Xi’an Shiyou University, Xi’an 710065, China
4
State Key Laboratory of Petroleum Resources and Engineering, China University of Petroleum (Beijing), Beijing 102249, China
5
College of Energy, Chengdu University of Technology, Chengdu 610059, China
6
School of Petroleum and Natural Gas Engineering, Changzhou University, Changzhou 213164, China
7
School of Petroleum Engineering, Southwest Petroleum University, Chengdu 610500, China
*
Authors to whom correspondence should be addressed.
Atmosphere 2026, 17(7), 673; https://doi.org/10.3390/atmos17070673
Submission received: 9 May 2026 / Revised: 29 June 2026 / Accepted: 4 July 2026 / Published: 7 July 2026
(This article belongs to the Special Issue Advances in CO2 Geological Storage and Utilization)

Abstract

Carbonated water flooding can enhance oil recovery from low-permeability sandstone reservoirs while supporting CO2 geological sequestration; however, the coupled effects of carbonated water–rock interactions on pore-scale fluid redistribution remain unclear. This study used online nuclear magnetic resonance (NMR), magnetic resonance imaging (MRI), and mineralogical analysis to evaluate wettability-related water redistribution, mineralogical alteration, and oil mobilization in low-permeability sandstone cores exposed to carbonated water for 0, 5, 10, and 15 days, followed by immiscible CO2 flooding. With increasing exposure duration, NMR-derived water saturation increased from 0.490 to 0.571, indicating an apparent increase in pore-scale water affinity under the same saturation protocol. XRD results showed carbonate and clay/zeolite-related mineral alteration, including calcite falling below the detection or quantification limit and marked decreases in chlorite and laumontite, which were associated with modified pore-wall properties and improved water-phase access. During subsequent immiscible CO2 flooding, oil was preferentially mobilized from well-connected migration pores, while carbonated water treatment enhanced oil recovery from capillary-controlled percolation pores. The overall recovery factor increased by 2.8 percentage points, reaching 53.8% after 15 days of treatment. These results indicate that carbonated water improves CO2 flooding performance through coupled mineral alteration, pore-connectivity modification, wettability-related water redistribution, and multi-scale oil mobilization. The study provides NMR-based pore-scale evidence for interpreting carbonated water-assisted CO2 utilization and enhanced oil recovery.

1. Introduction

In the context of the global energy transition and the continued advancement of CCUS objectives, improving oil recovery from low-permeability sandstone reservoirs remains important for stable energy supply [1]. These reservoirs commonly contain relatively small pore throats, strong capillary resistance, complex pore networks, and heterogeneity. During conventional waterflooding, injected water tends to migrate through preferential flow pathways, which restricts sweep volume and leads to low recovery efficiency [2,3,4]. CO2 flooding has been widely investigated as a promising enhanced oil recovery technique because it can reduce crude oil viscosity, improve mobility ratios, and increase displacement efficiency [5]. However, under reservoir conditions, CO2 injection is susceptible to gas channeling, early breakthrough, and non-uniform sweep, resulting in a trade-off between displacement efficiency and sweep efficiency. Therefore, improving fluid sweep characteristics while maintaining displacement efficiency remains a key challenge for low-permeability sandstone reservoirs [6]. Within the CCUS framework, integrating CO2-based enhanced oil recovery with geological CO2 storage further requires a clearer understanding of flooding mechanisms and fluid migration behavior. Although various methods, such as gel injection, foam injection, gas–water co-injection, and gas–water sequential injection [7,8,9], have been proposed, their effectiveness may still be constrained by water-lock effects and incomplete sweep improvement. To overcome these limitations, carbonated water flooding has attracted increasing attention. Following carbonated water injection into the reservoir, CO2 gradually partitions from the aqueous phase into the oil phase owing to its higher solubility in oil. This process results in crude oil swelling, alleviation of the water-lock effect, wettability alteration, and enhanced sweep efficiency via the water phase [10]. Furthermore, carbonated water flooding can be integrated with CO2 sequestration within the CCUS framework, providing a potential pathway for both geological CO2 storage and enhanced oil recovery [11]. Previous studies have attributed the enhanced oil recovery performance of carbonated water injection to several coupled mechanisms, including CO2 transfer from the aqueous phase to the oil phase, crude oil swelling, interfacial tension variation, pH-controlled interfacial charge modification, wettability alteration, and mineral dissolution induced by carbonic acid [12]. Microfluidic experiments, contact-angle measurements, pore-network modeling, and coreflooding studies have further shown that carbonated brine can modify local flow paths, relative permeability behavior, and oil mobilization efficiency [13]. These studies provide important mechanistic foundations for carbonated water injection. However, direct dynamic evidence linking carbonated water–rock interaction, NMR-derived water occupancy, and crude oil mobilization across different pore-size domains in low-permeability sandstone remains limited.
Under CO2 fluid–rock interactions, reservoir wettability is widely recognized as a key parameter governing oil–water distribution, fluid migration pathways, and microscale oil recovery efficiency [14,15,16]. Previous studies have shown that carbonated water can modify the chemical composition of rock surfaces through the dissolution of carbonate and aluminosilicate minerals, thereby partially restructuring the pore system [17,18]. This process induces a shift in wettability from neutral or weakly oil-wetting towards water-wetting [19]. However, current understanding remains largely confined to observations of wettability alteration and pore-scale dissolution phenomena. Systematic and direct evidence is still lacking to elucidate how such wettability changes reshape fluid distribution patterns and migration pathways at the pore scale, thereby controlling the mobilization mechanisms of crude oil across different pore-size domains. On the one hand, most studies focus on static wettability characterization of cores before and after carbonated water treatment, typically using sessile drop methods or imbibition experiments, which are insufficient to capture the dynamic evolution of wettability during actual displacement processes. On the other hand, conventional macroscale displacement evaluation metrics fail to resolve the differential contributions of pores across different scales to oil recovery efficiency and, further, cannot adequately characterize variations in crude oil mobilization and its spatio-temporal evolution within pores of distinct sizes. It is noteworthy that carbonated water treatment of rock is not an instantaneous process but a progressive one evolving over time [13]. Under such fluid–rock interactions, changes in mineral composition, enhanced pore connectivity, and fluid redistribution across multi-scale pore systems may synergistically influence fluid transport pathways and sweep efficiency within reservoirs [20]. However, both this process and its impact on crude oil mobilization across different pore-size ranges still lack experimental approaches capable of providing in situ, quantitative, and visual characterization during displacement.
To address these gaps, this study employs online NMR technology to investigate the pore-scale coupling among mineral alteration, wettability-related water redistribution, and crude oil mobilization during subsequent CO2 flooding. It systematically investigates pore-scale fluid distribution, wettability evolution, and crude oil mobilization behavior in cores subjected to varying carbonated water exposure durations. By integrating online NMR T2 spectroscopy with MRI, this approach enables dynamic characterization of fluid occurrence states and spatial distribution at the pore scale, thereby facilitating in situ tracking and quantitative analysis of crude oil mobilization pathways across different pore-size ranges. Unlike conventional studies that focus solely on wettability alterations or pore dissolution, this study systematically investigates the effects of varying carbonated water exposure durations on both processes. From a pore-scale perspective of fluid distribution reconstruction, it elucidates how carbonated water reshapes fluid migration pathways and connectivity, as well as crude oil mobilization within the same core, thereby enabling synergistic mobilization across multiple pore scales and establishing a conceptual framework for understanding the mechanism of enhanced oil recovery during carbonated water flooding.

2. Experiments

2.1. Materials

Four adjacent cylindrical core plugs, denoted as W1–W4, were selected from the same parent core block to minimize geological heterogeneity and were used for the main NMR-based wettability and CO2 flooding experiments, corresponding to carbonated water exposure durations of 0, 5, 10, and 15 days, respectively. Details of the sample preparation and core plug selection are provided in Appendix A (Method A1). The samples exhibit permeabilities ranging from 0.419 mD to 0.501 mD and porosities from 10.33% to 11.03% (Table 1). The core plugs used in this study were natural low-permeability sandstone reservoir rocks rather than purified single-mineral specimens; therefore, a single mineral purity value is not applicable. The mineralogical composition of the unreacted parent core material was determined by XRD using representative crushed subsamples or offcuts from the same adjacent parent core material, with detailed procedures and uncertainty described in Section 2.3.2. The unreacted rock consisted of quartz (Qz, 15.8%), plagioclase (Pl, 24.8%), K-feldspar (Kfs, 11.1%), calcite (Cal, 2.6%), illite (Ilt, 1.4%), chlorite (Chl, 33.9%), and laumontite (Lmt, 10.4%). The samples are described in this study as low-permeability sandstone cores from the target reservoir; the results are interpreted within this reservoir type rather than generalized to all unconventional formations. For each exposure duration, the same intact core plug was sequentially used for carbonated water exposure, non-destructive NMR-based wettability evaluation, and online NMR-monitored CO2 flooding. No slicing or grinding was performed on these intact plugs before the wettability or flooding tests. Conventional contact-angle measurements were not used because they generally require thin sections or polished surfaces, which may alter the integrity and surface properties of the intact core plugs. Core heterogeneity was reduced by selecting adjacent plugs with similar porosity and permeability and was further evaluated through the consistency of the initial NMR T2 spectra. Because each carbonated water exposure duration was represented by one adjacent core plug, the calculated water saturation and recovery factor values should be interpreted as single-core NMR-derived trends. For simplicity, mineral phases are denoted using abbreviations: Qz (quartz), Pl (plagioclase), Kfs (K-feldspar), Cal (calcite), Ilt (illite), Chl (chlorite), Fsp (feldspar), and Lmt (laumontite) [21].
Crude oil was collected from the Chang 6 reservoir in the Ordos Basin, with a viscosity of 3.6 mPa·s at 47 °C. The minimum miscible pressure (MMP) of CO2 flooding in the target region is 12.4 MPa, as determined by a slim-tube experiment. To conduct the experiments under immiscible CO2 flooding conditions and to represent the low-pressure operating condition of the target reservoir, the CO2 displacement pressure and back pressure were set to 8 MPa and 7.5 MPa, respectively. The pressure of 8 MPa refers to the laboratory displacement pressure used in this study and should not be interpreted as the average formation pressure. The produced formation water used in this study was collected from the target reservoir and had a total salinity of 41.67 g/L. Its chemical composition was dominated by Cl− (25,409.75 mg/L), K+ + Na+ (7921.86 mg/L), and Ca2+ (7381.92 mg/L), with lower concentrations of Mg2+ (117.66 mg/L), SO42− (681.60 mg/L), and HCO3− + CO32− + OH− (154.99 mg/L). The detailed ionic composition is provided in Appendix A, Table A1. The nominal CO2 concentration used for preparing carbonated brine was set to 3 mol/L, based on preliminary screening experiments. This value was calculated from the theoretical amount of CO2 introduced into a given volume of formation water, namely nCO2/Vbrine, and corresponds to approximately 132 g CO2 per liter of brine if all introduced CO2 is dissolved. Therefore, the value of 3 mol/L represents the target preparation concentration rather than a directly measured equilibrium dissolved CO2 concentration. The actual dissolved CO2 content may vary with temperature, pressure, brine salinity, and gas–liquid equilibrium during preparation. High brine salinity may reduce CO2 solubility through the salting-out effect.

2.2. Experiment Apparatus

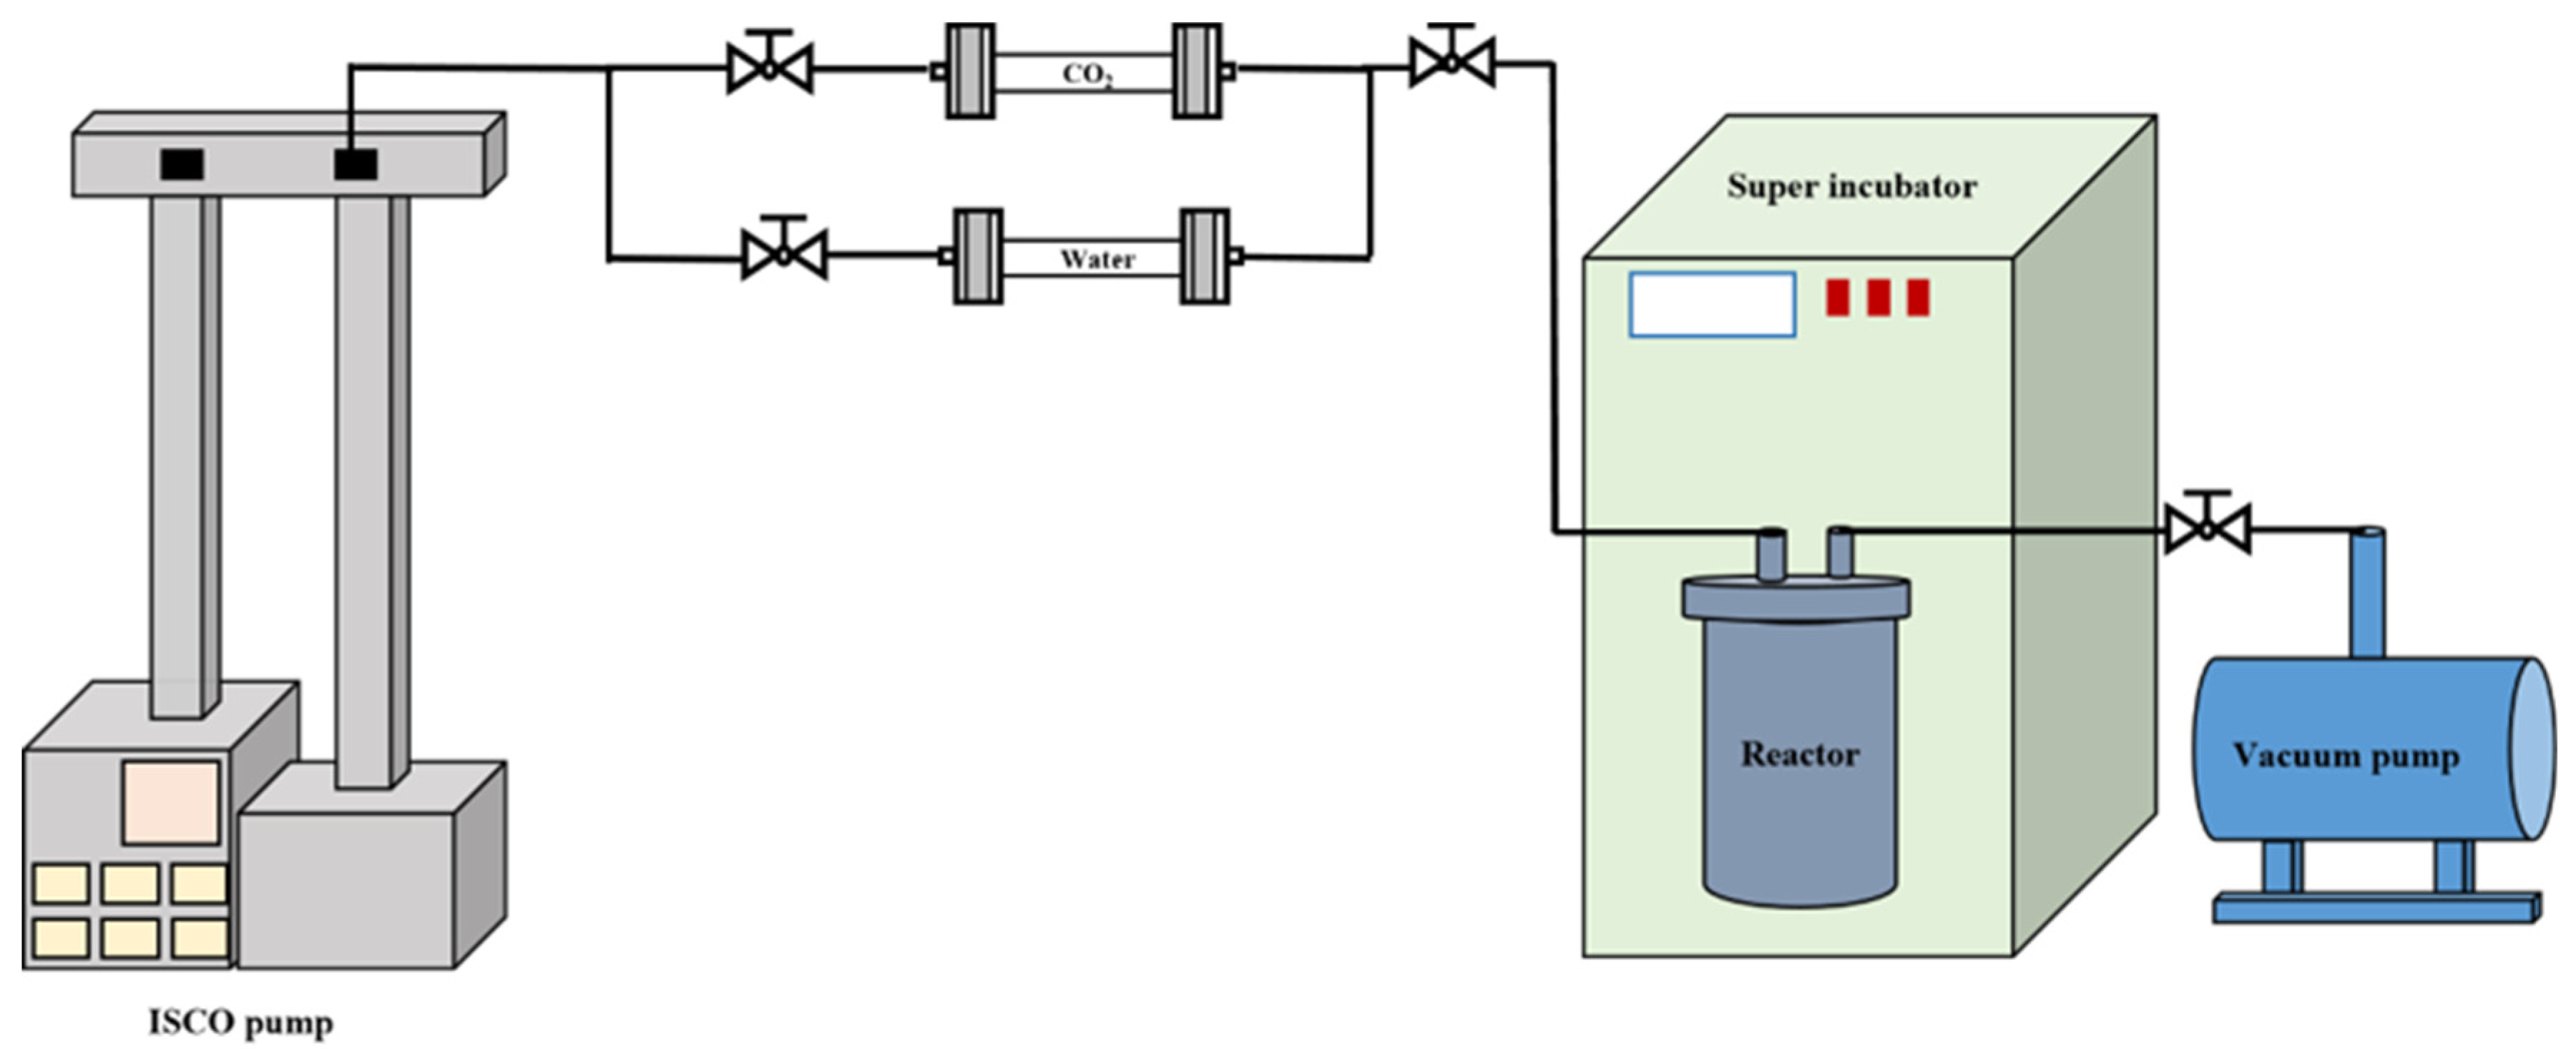
Throughout the experiments, two experimental setups were employed. The first was a core reaction system used for carbonated water–rock interaction experiments, as shown in Appendix A, Figure A1. The system comprised a CO2 cylinder, a displacement pump, a thermostatic chamber, a vacuum pump, and a reactor. During operation, CO2 was supplied from the cylinder and injected into the reactor by the displacement pump, where it dissolved into formation water to prepare carbonated water. The resulting carbonated water contained dissolved CO2 and its hydrated carbonate species, including H2CO3, HCO3−, and CO32−, under the experimental temperature and pressure conditions. A vacuum pump was used to evacuate air from the rock samples, while the thermostatic chamber maintained the temperature at 47 °C.
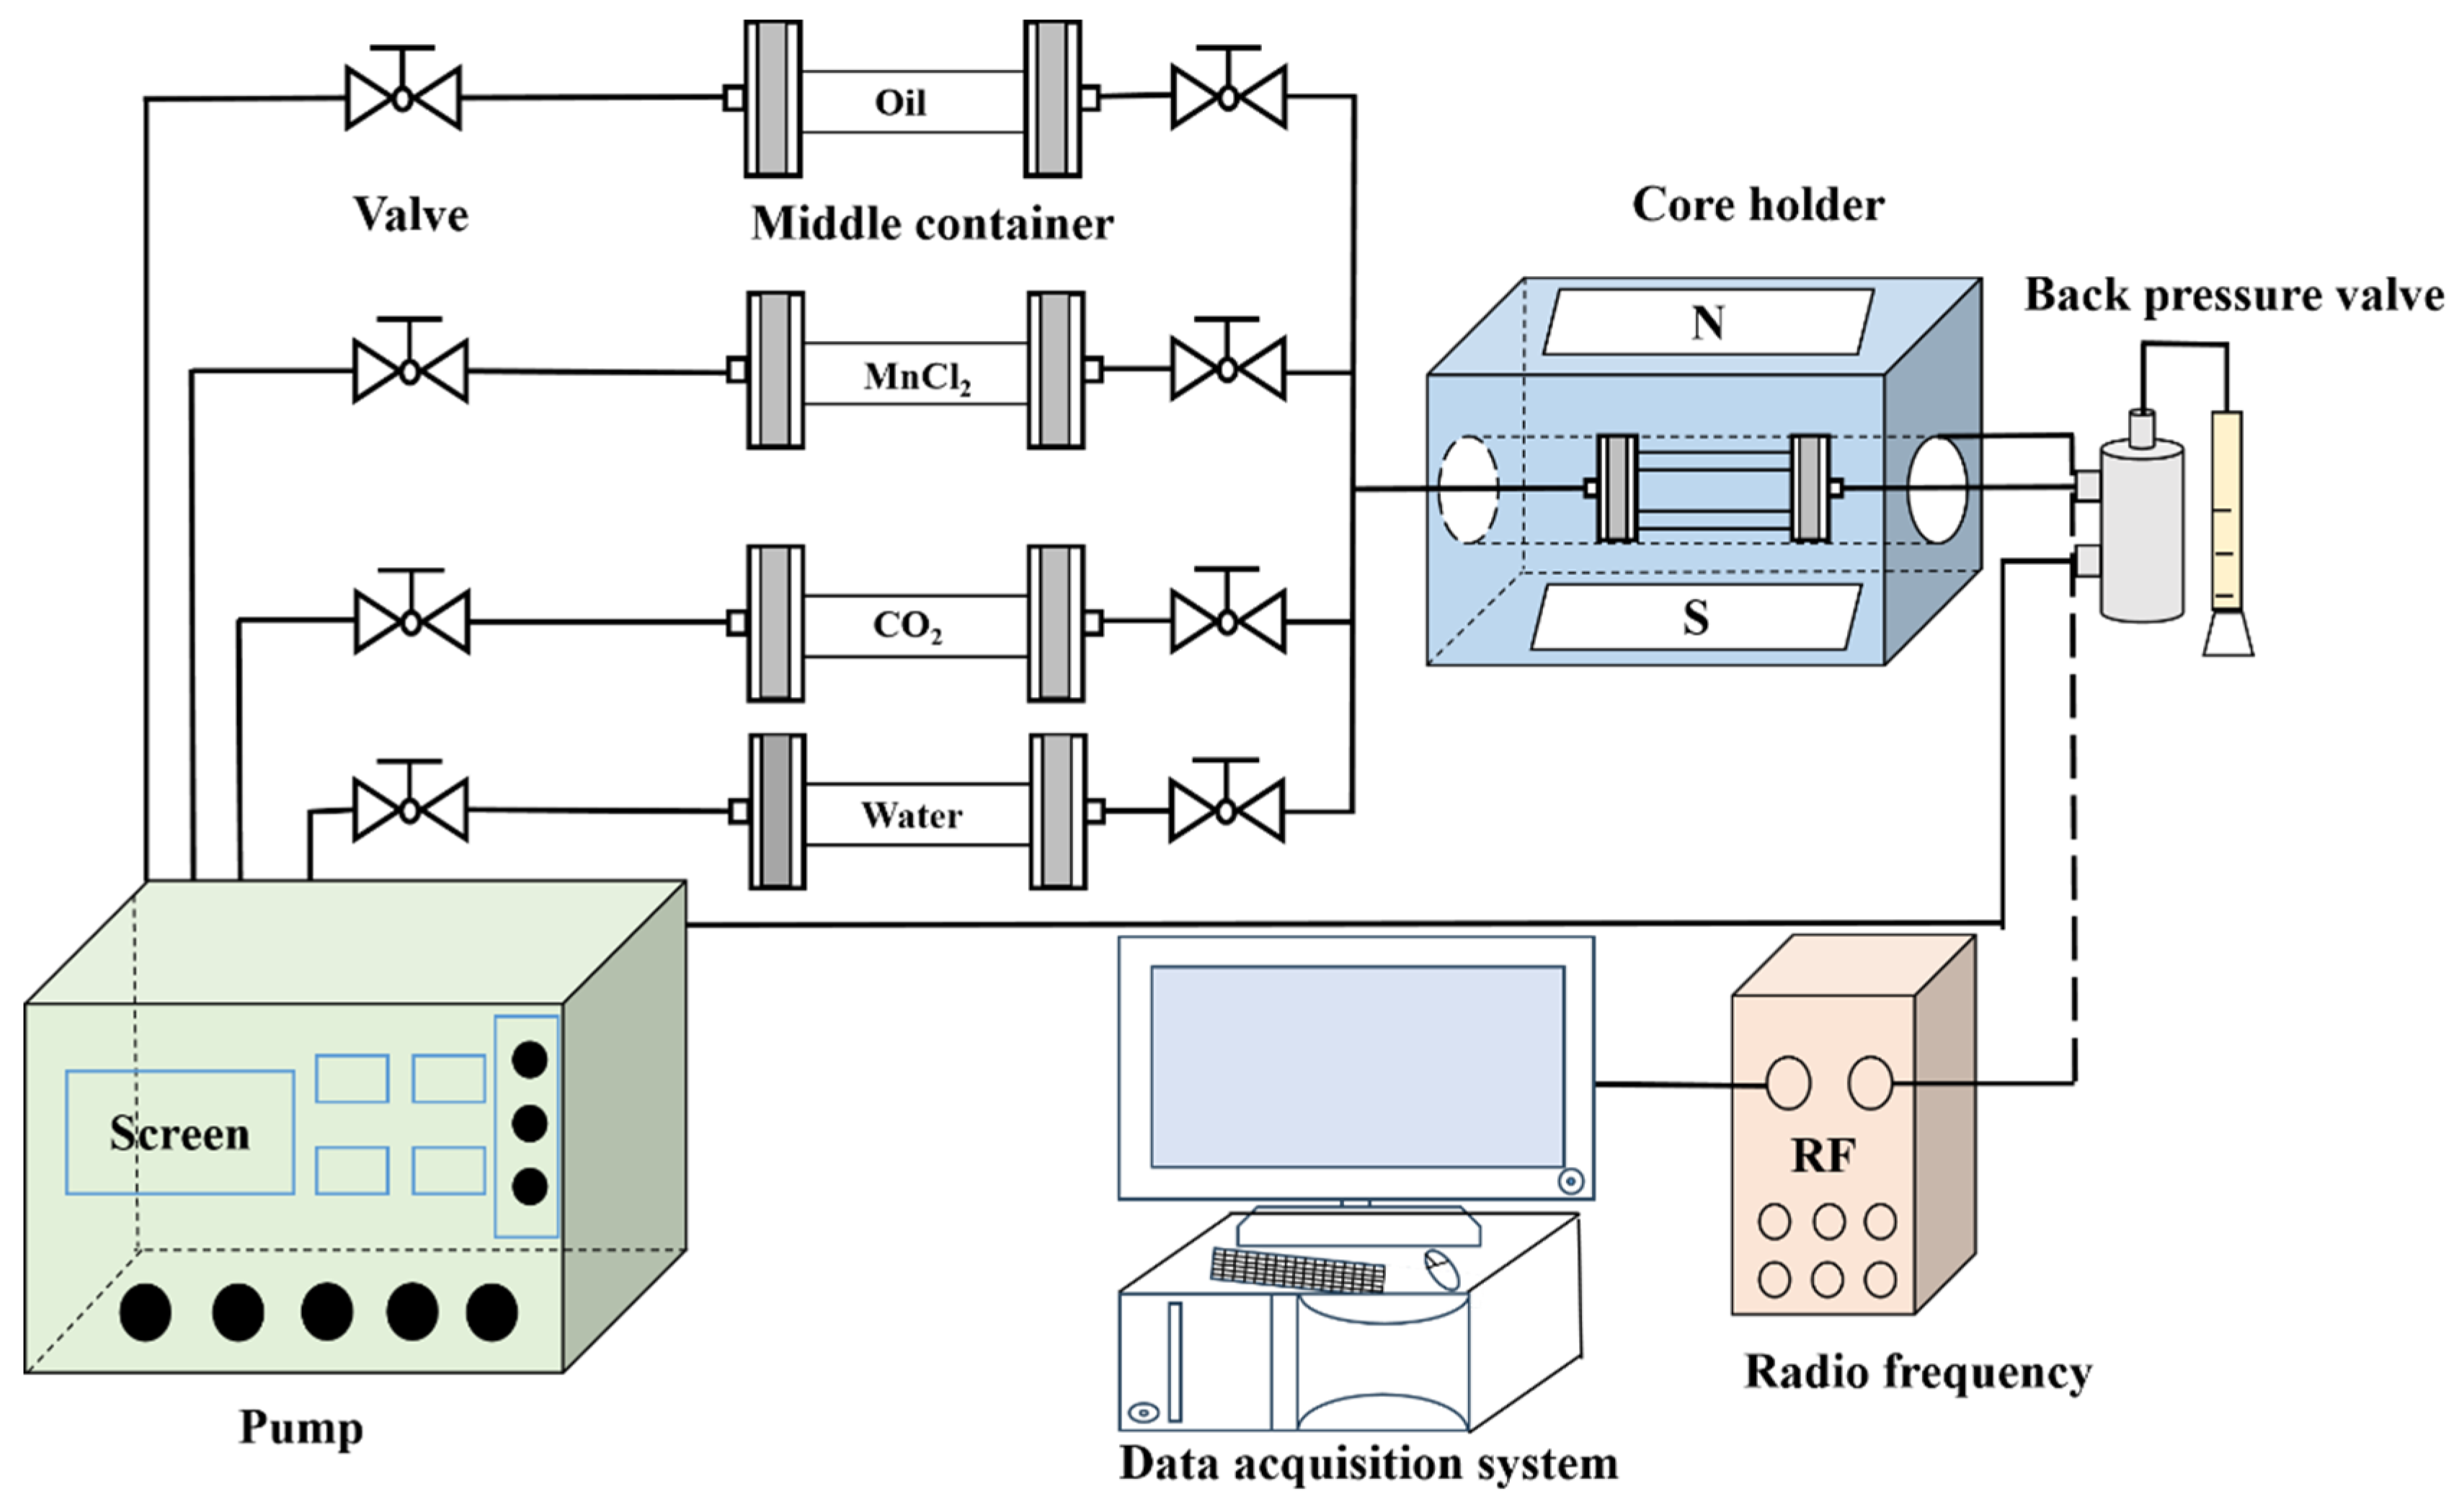
The second setup was an online NMR displacement system used to monitor dynamic oil distribution during CO2 flooding, as shown in Figure 1. A MecroMR12-150H-VTHP instrument (Suzhou Niumag Instrument Co., Suzhou, China) was employed. The system comprised a displacement pump, intermediate fluid containers, a core holder, a back-pressure valve, and a data acquisition system. The intermediate containers supplied crude oil, formation water, and CO2 during the experimental sequence. After carbonated water exposure, the samples were first subjected to NMR-based wettability testing and then placed in the core holder for CO2 flooding. The back-pressure valve controlled the pressure required for fluid flow, and the data acquisition system collected NMR signals to obtain T2 spectra and generate MRI images. Detailed NMR scanning parameters are provided in Appendix A, Table A2.

2.3. Experiment Procedures

2.3.1. Rock Samples Treatment with Carbonated Water

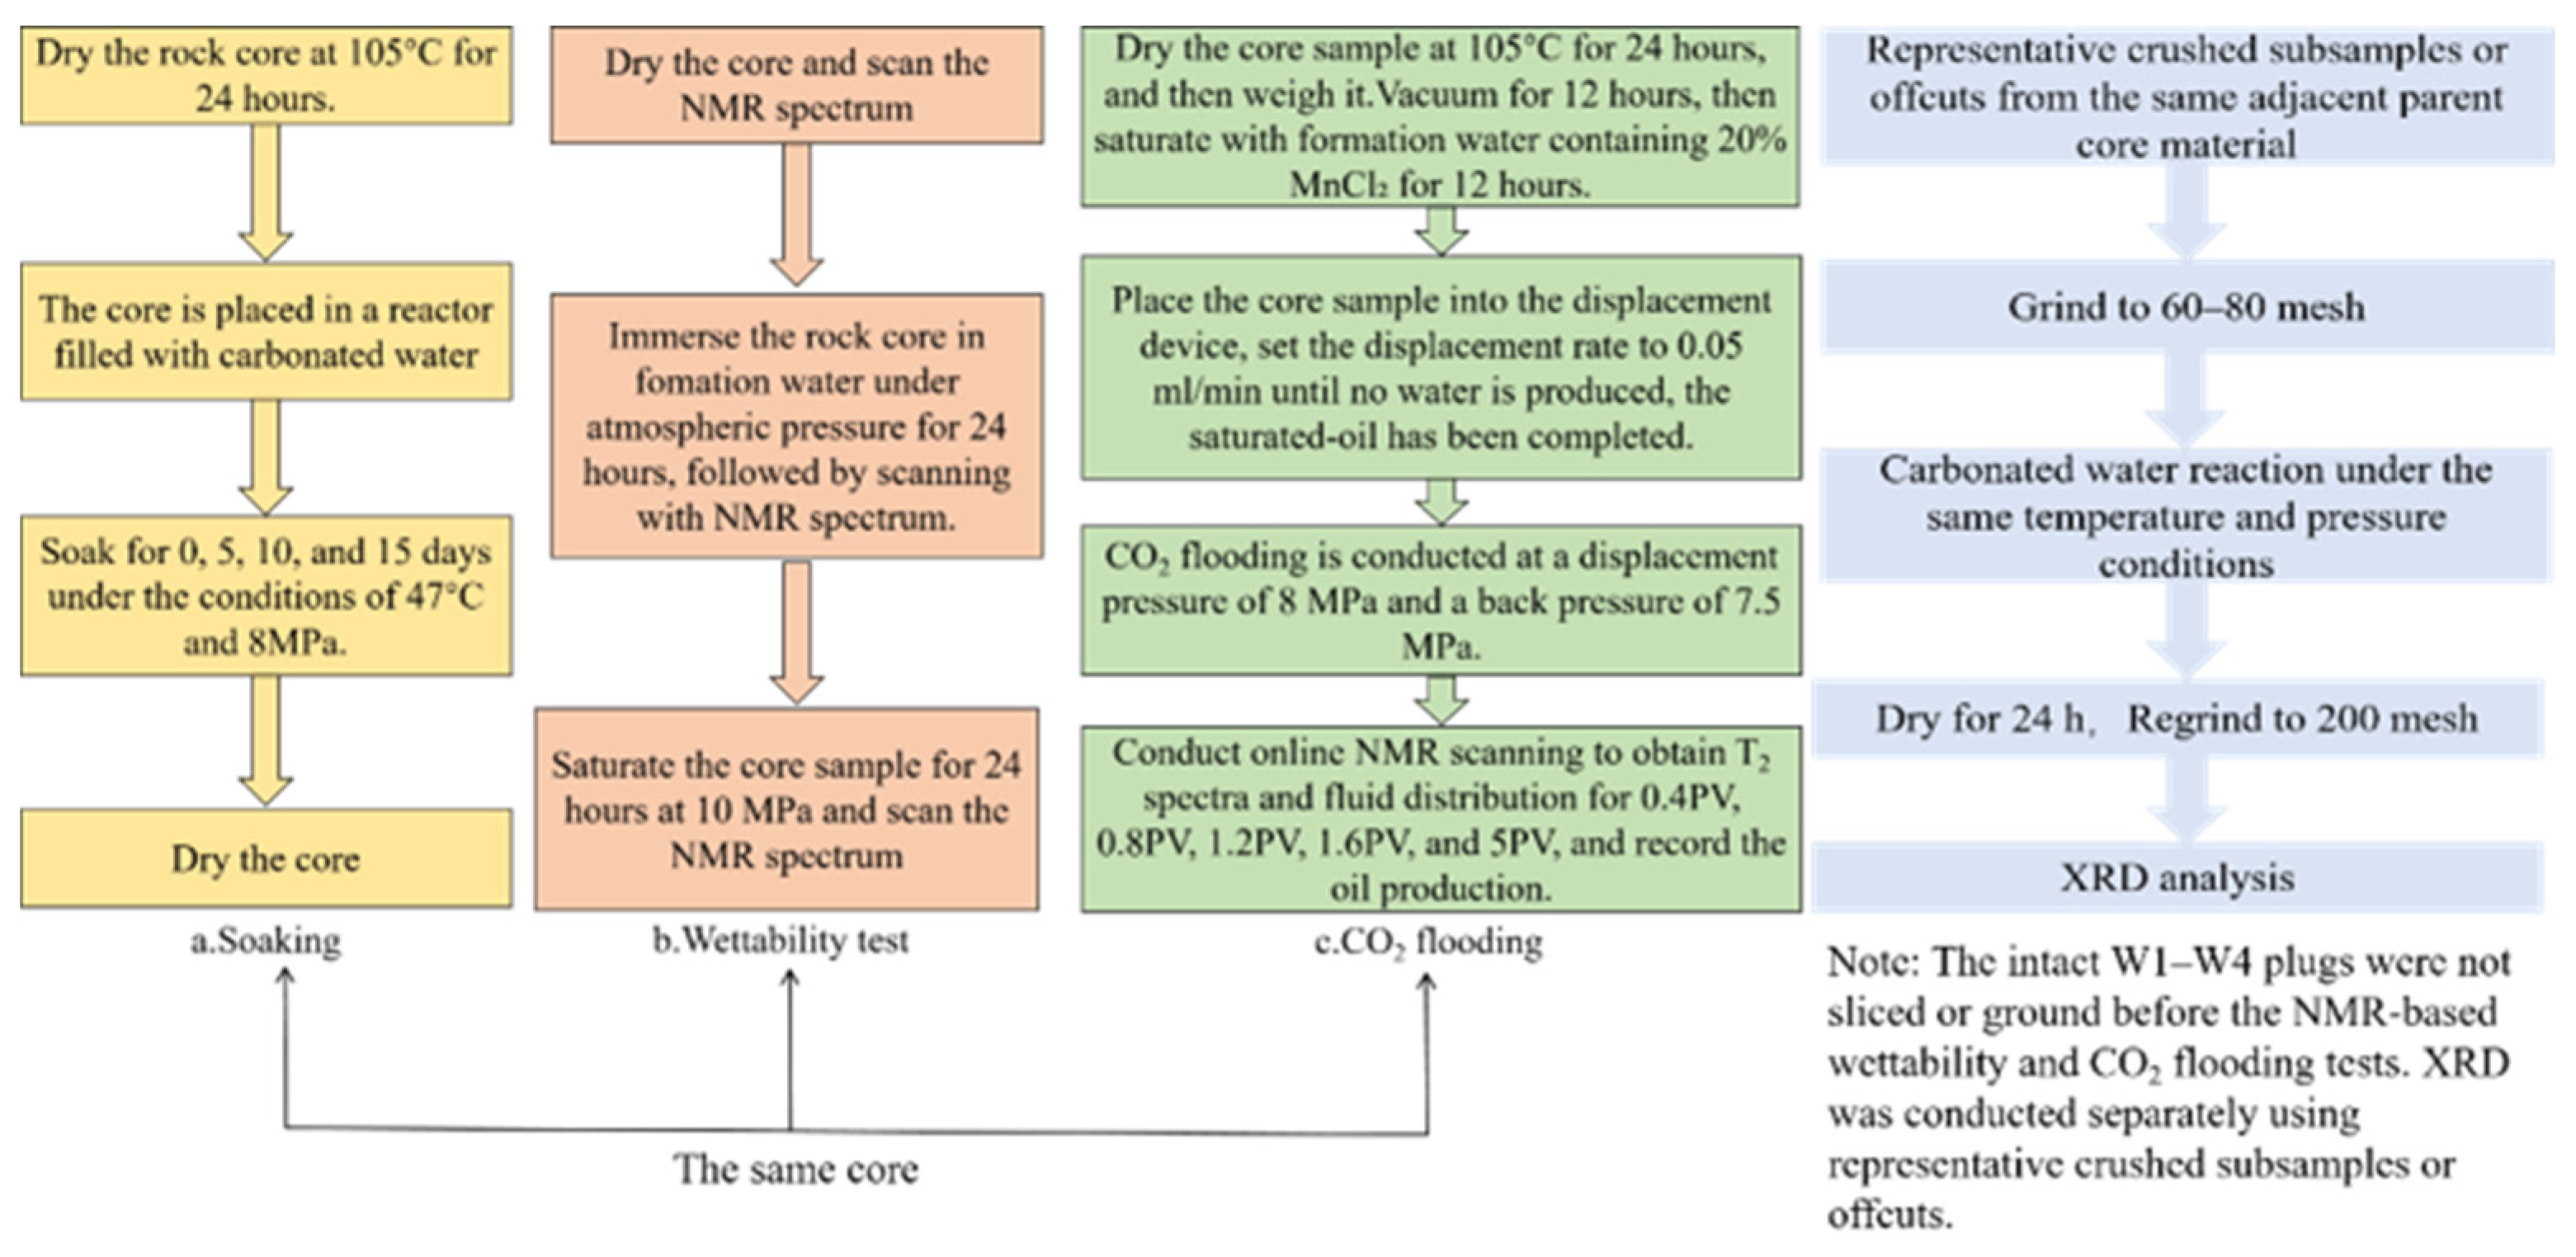
The four rock samples were dried at 105 °C for 24 h to remove moisture and then placed in a reactor filled with carbonated water. Before carbonated water exposure, all core plugs were in a dry state and were not pre-saturated with crude oil or formation water. This pretreatment step was designed to evaluate the effect of carbonated water–rock interactions on the rock matrix, pore structure, and subsequent wettability-related fluid redistribution. To simulate carbonated water–rock interactions and their effects on wettability and oil recovery, carbonated water exposure durations of 0, 5, 10, and 15 days were selected, with one adjacent core plug assigned to each exposure duration. The selected exposure durations were intended to capture short-term to intermediate carbonated water–rock interactions under the present temperature, pressure, and brine conditions. Previous studies have shown that carbonated water can modify pore-surface chemistry and fluid occupancy through carbonate dissolution, aluminosilicate alteration, and wettability-related fluid redistribution. Therefore, 5 to 15 days was considered a reasonable exposure window for detecting measurable changes in NMR-derived water occupancy and mineralogical response under the accelerated laboratory conditions used in this study [22,23,24]. During the interaction process, temperature and pressure were maintained at 47 °C and 8 MPa, respectively. The pressure of 8 MPa was selected to match the subsequent CO2 displacement pressure and to maintain consistency among the carbonated water–rock interaction and flooding experiments. After each carbonated water exposure duration, the saturated rock samples were removed and re-dried, ensuring systematic exposure to carbonated water treatment. The experimental workflow is presented in Appendix A (Figure A2). It should be noted that the 0 d sample was used as an untreated baseline, while a water-treated control without dissolved CO2 under identical temperature and pressure conditions was not included in the present experimental design. Therefore, the observed changes are interpreted as effects associated with carbonated water treatment; the relative contribution of CO2-specific reactions and general aqueous water–rock interactions cannot be fully separated in this study.

2.3.2. Wettability Tests

After different carbonated water exposure durations, the rock samples were first dried at 105 °C until a constant mass was reached; NMR signals were measured to obtain V1, representing the dry-core baseline signal. The samples were then immersed in formation water at atmospheric pressure for 24 h; NMR signals were recorded to determine the pore fluid volume V2 under the partially saturated state. Subsequently, the partially saturated cores were fully immersed in formation water in a high-pressure saturation vessel. The vessel was pressurized to 10 MPa and maintained for 24 h to promote pressure-driven water entry into the pore system. After high-pressure saturation, the cores were removed, surface water was carefully wiped off, and NMR signals were measured immediately to obtain V3. In this study, V3 is referred to as the fully saturated state under the applied high-pressure saturation protocol. This term represents the maximum water-occupied pore state achieved under the present experimental conditions, rather than an assumption that all isolated pores or trapped air were completely eliminated. Because the wettability test was conducted before oil saturation and CO2 flooding, no irreducible oil was present during this water saturation procedure. Based on the pore parameters (V1, V2, V3) obtained under dry, partially saturated, and high-pressure saturated conditions, water saturation (Sw) was calculated from the NMR spectral peak areas and used as a pore-scale averaged indicator of wettability alteration in the rock samples [25]. The corresponding calculation procedure is provided in Equations (1)–(3):
S w = ∆ V w V
V = V 3 − V 1
∆ V w = V 2 − V 1
In general, higher NMR-derived Sw indicates a stronger tendency of water to enter and occupy the pore space under the specified saturation conditions, which is interpreted as an apparent shift toward stronger water-wet behavior. Formation water was used during wettability measurements to maintain consistency with the reservoir brine condition used for carbonated water preparation. The same water type and saturation protocol were applied to all core samples; therefore, the calculated Sw values were used to compare relative wettability evolution among different carbonated water exposure durations. The NMR-based wettability measurement method is non-destructive; measurements were repeated until stable signals were obtained to ensure reliability. NMR-derived Sw was used as a relative proxy for apparent pore-scale water affinity under the same saturation protocol, rather than as an absolute wettability parameter equivalent to contact angle, Amott–Harvey index, or USBM index. Because NMR relaxation behavior may also be affected by pore-size distribution, mineral composition, surface relaxivity, paramagnetic components, and fluid properties, the Sw results were interpreted together with T2 spectra, MRI visualization, and XRD results. Therefore, the term “wettability alteration” in this study refers to NMR-derived apparent wettability-related water redistribution under the same experimental protocol.
To investigate the mineralogical basis for wettability-related water redistribution, XRD analysis was performed using representative crushed subsamples or offcuts obtained from the same adjacent parent core material as the intact core plugs. These subsamples were first ground to 60–80 mesh and then reacted with carbonated water under the same temperature and pressure conditions. After completion of the reaction, the subsamples were dried for 24 h and reground to 200 mesh for XRD analysis. The post-reaction results were compared with those of an unreacted subsample prepared using the same grinding procedure. This XRD test was used as supporting mineralogical evidence and was not performed on the intact W1–W4 plugs used for the NMR-based wettability and CO2 flooding experiments. XRD was applied as a semi-quantitative method; mineral contents were calculated based on reference intensity ratios (RIR). Repeated measurements performed in accordance with relevant standards indicated an uncertainty of approximately ±10% [26]. Because XRD provides semi-quantitative mineral contents, changes in low-abundance phases close to the uncertainty range were interpreted qualitatively. The individual post-reaction XRD results are provided in Appendix A, Table A4. Calcite was, therefore, described as being below the detection or quantification limit after reaction, rather than as a precisely quantified 2.6 percentage-point loss. The XRD measurements at different exposure durations were used to evaluate time-dependent mineralogical alteration during carbonated water–rock interaction. However, because the aqueous phase was not sampled continuously for ion concentration, pH, alkalinity, or dissolved inorganic carbon analysis, the present experiments did not provide dissolution rate constants or a complete mineral dissolution kinetic model.

2.3.3. Co2 Flooding Using Online NMR

After wettability measurements, the cores were dried at 105 °C for 24 h and repeatedly weighed until a constant mass was reached. The cores were then evacuated for 12 h and saturated with formation water containing 20 wt% MnCl2 for another 12 h. MnCl2 was used as a paramagnetic dopant to reduce the transverse relaxation time (T2) of the water phase, thereby suppressing the NMR signal from water and enhancing the identification of the oil signal during online NMR-monitored CO2 flooding. It should be noted that MnCl2 was introduced only before the CO2 flooding experiment and was not used during carbonated water treatment or NMR-based wettability evaluation. Therefore, the NMR-derived Sw values were obtained before MnCl2 saturation. Although the high salinity of 20 wt% MnCl2 may potentially influence mineral surfaces during the subsequent flooding stage, the same MnCl2 saturation protocol was applied to all cores. Thus, its possible influence was treated as a controlled background factor when comparing the relative recovery behavior among cores with different carbonated water exposure durations [27,28]. The cores were placed in an online NMR displacement system, where oil was injected at a constant rate of 0.05 mL/min until no further water production was observed, indicating complete oil saturation. CO2 flooding was then conducted under immiscible conditions. During the displacement process, the upstream pressure was maintained at 8 MPa, while the back pressure was maintained at 7.5 MPa, resulting in an approximately 0.5 MPa pressure difference across the core. Online NMR monitoring continued until no additional oil was produced, at which point oil production was recorded and the experiment was terminated. During CO2 flooding, T2 spectra and fluid distribution images were sequentially acquired at injected pore volumes of 0.4, 0.8, 1.2, 1.6, and 5 PV. The experimental design involved two different time scales. The carbonated water exposure durations of 0, 5, 10, and 15 days refer to the static carbonated water–rock interaction stage before oil saturation and CO2 flooding, whereas the subsequent online NMR acquisition points were defined by injected pore volume. The corresponding injection time was estimated as t = nPV × Vp/q, where Vp is the pore volume, nPV is the injected pore-volume multiple, and q is the injection rate. For W4, Vp calculated from π × (D/2)2 × L × φ was approximately 2.53 mL. Thus, injection of 1.6 PV required approximately 81 min, or 1.35 h, at 0.05 mL/min, and injection of 5 PV required approximately 4.22 h. Therefore, the 1.6 PV and 5 PV points represent PV-normalized CO2 flooding stages after different carbonated water pretreatments. The scanning intervals were selected to capture both the rapid early-stage oil mobilization and the final residual-oil state. Based on preliminary displacement observations, most of the NMR signal variation occurred during the early injection stage; therefore, relatively dense intervals of 0.4 PV were used from 0.4 to 1.6 PV. The 5 PV point was selected as the endpoint because oil production had become negligible and the displacement process had reached the final residual-oil state. We acknowledge that an intermediate scan between 1.6 and 5 PV, such as 3 PV, would provide a more detailed description of the stabilization process.
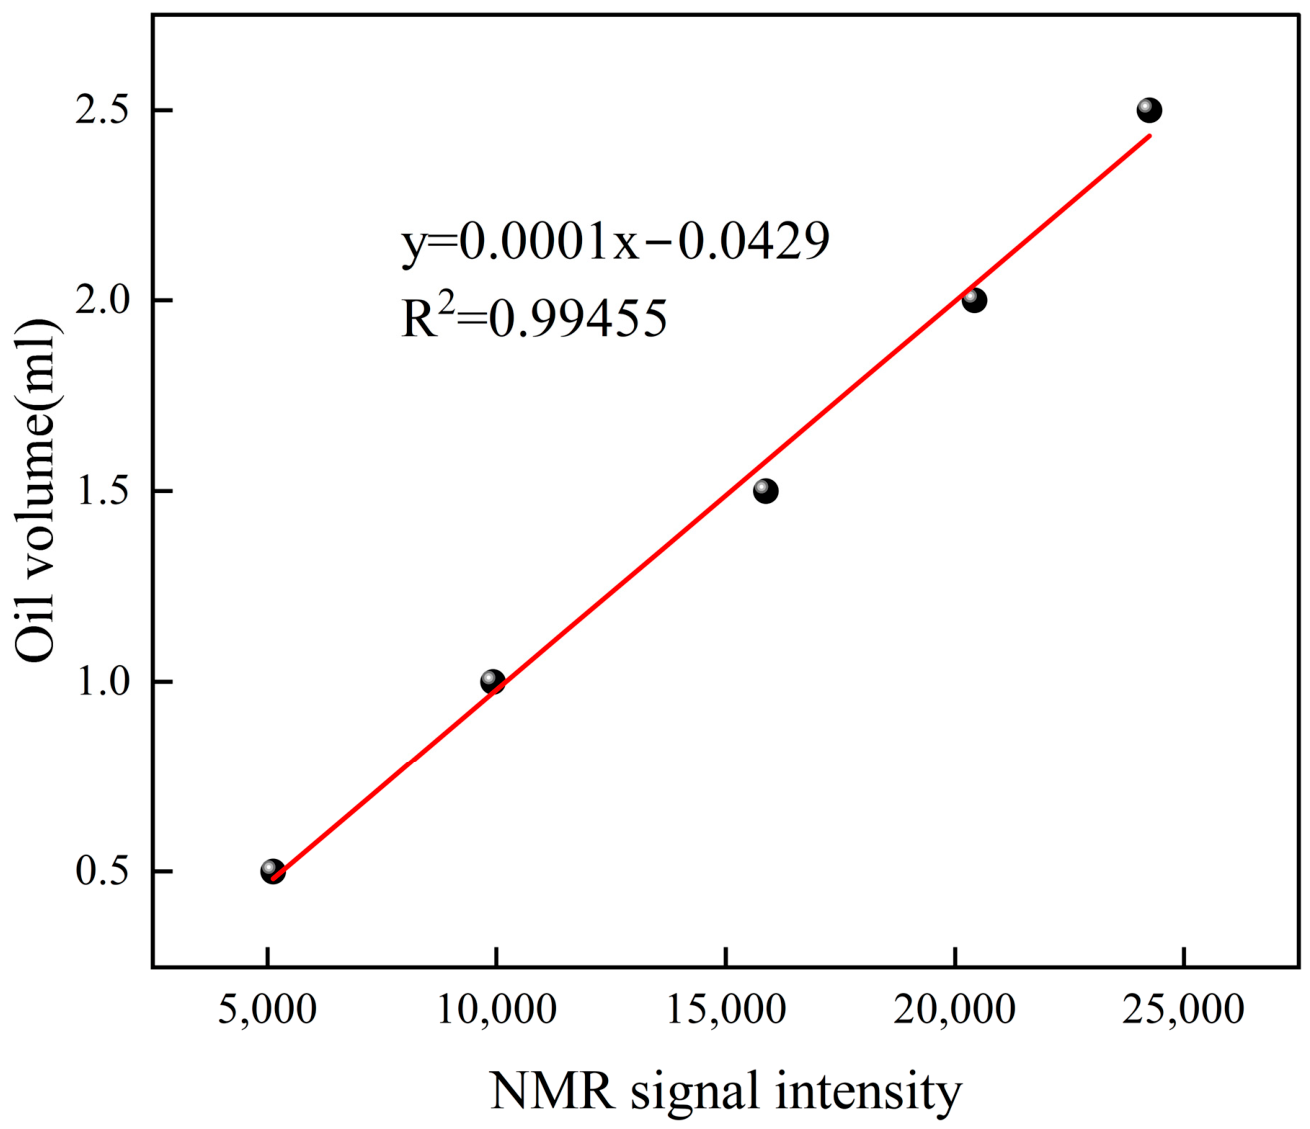
NMR technology provides an effective approach for quantifying oil recovery. Based on NMR principles, relaxation signals are used to characterize fluid distribution at the pore scale. Fluid content is positively correlated with NMR signal intensity [22]. For pore-scale interpretation, the T2 spectrum was divided into three operational relaxation-time domains according to previously validated NMR pore-size calibration for low-permeability sandstone reservoirs and the observed spectral distribution in this study: adsorption-dominated pores (T2 < 1 ms), capillary-controlled percolation pores (1 ms ≤ T2 ≤ 10 ms), and well-connected migration pores (T2 > 10 ms) [29,30,31]. These thresholds were used to compare relative fluid occurrence and mobilization behavior among samples under the same NMR acquisition conditions. Therefore, the variation in pore-size-domain distribution during CO2 injection was evaluated from the PV-dependent oil-phase T2 signal distribution within these operational pore-size domains. They should be interpreted as operational T2 domains rather than absolute pore-radius boundaries, because the T2 response is also affected by surface relaxivity, mineral composition, and fluid properties. Focusing on the oil phase; the residual oil volume in the rock cores corresponds to the peak area of the T2 spectrum, representing the total NMR signal intensity. To establish the relationship between NMR signal intensity and oil content, NMR signals were first measured in oil samples with volumes ranging from 0.5 to 2.5 mL (Figure 2). The detailed data are provided in Appendix A, Table A3. The results showed a strong linear correlation (R2 = 0.99455), demonstrating that NMR signal intensity can reliably quantify oil content within the core.
The relationship between NMR signal intensity and oil content is described by Equation (4):
V o i l = 0.0001 Q − 0.0429
where Voil denotes the oil volume in the rock core (mL), and Q represents the NMR signal intensity. For residual oil quantification, the oil-related T2 signal was integrated within the defined relaxation-time domains. The integrated NMR signal intensity was converted into oil volume using the calibration relationship established from standard oil samples, as shown in Equation (4) and Appendix A, Table A3. For each pore-size domain, the mobilized oil volume during CO2 flooding was calculated as the difference between the oil volume before CO2 injection and the residual oil volume after a given injected pore volume. The final residual oil volumes after 5 PV of CO2 injection are summarized in Appendix A, Table A6.
Oil recovery was first defined as the fraction of oil removed from the core during CO2 flooding:
R = 1 − V r V o
where Vo represents the initial oil volume in the oil-saturated core before CO2 flooding and Vr represents the residual oil volume after CO2 flooding. According to the calibration relationship between oil volume and NMR signal intensity in Equation (4), Vo and Vr can be expressed as 0.0001Qo − 0.0429 and 0.0001Qr − 0.0429, respectively. Substituting these two terms into the recovery definition gives Equation (5):
R = 1 − V r V O = 1 − 0.0001 Q r − 0.0429 0.0001 Q o − 0.0429
where Vr represents the residual oil volume in the core after displacement, and Vo represents the saturated oil volume in the core prior to displacement; Qr represents the NMR signal intensity of the residual oil after displacement; and Qo represents the NMR signal intensity of the saturated oil prior to displacement.
Because each carbonated water exposure duration was represented by one adjacent core sample, the present study does not provide independent replicate cores for each treatment condition. To reduce sample-to-sample variability, four adjacent plugs from the same parent core block with similar porosity and permeability were used; the initial NMR T2 spectra were compared to evaluate the consistency of pore-size distribution among samples. During recovery calculation, the oil production was normalized to the initial oil volume of each individual core; the injected volume was normalized by the pore volume of each core. These procedures reduced the influence of differences in pore volume and initial oil saturation. However, they do not provide a statistical quantification of core-to-core variability. Therefore, the reported recovery factors should be interpreted as single-core NMR-derived trends rather than statistically averaged recovery values from independent replicate cores. Future studies should include replicate cores for each exposure duration to further quantify sample-to-sample variability.

3. Results and Discussion

3.1. The Effect of Carbonated Water on Reservoir Wettability

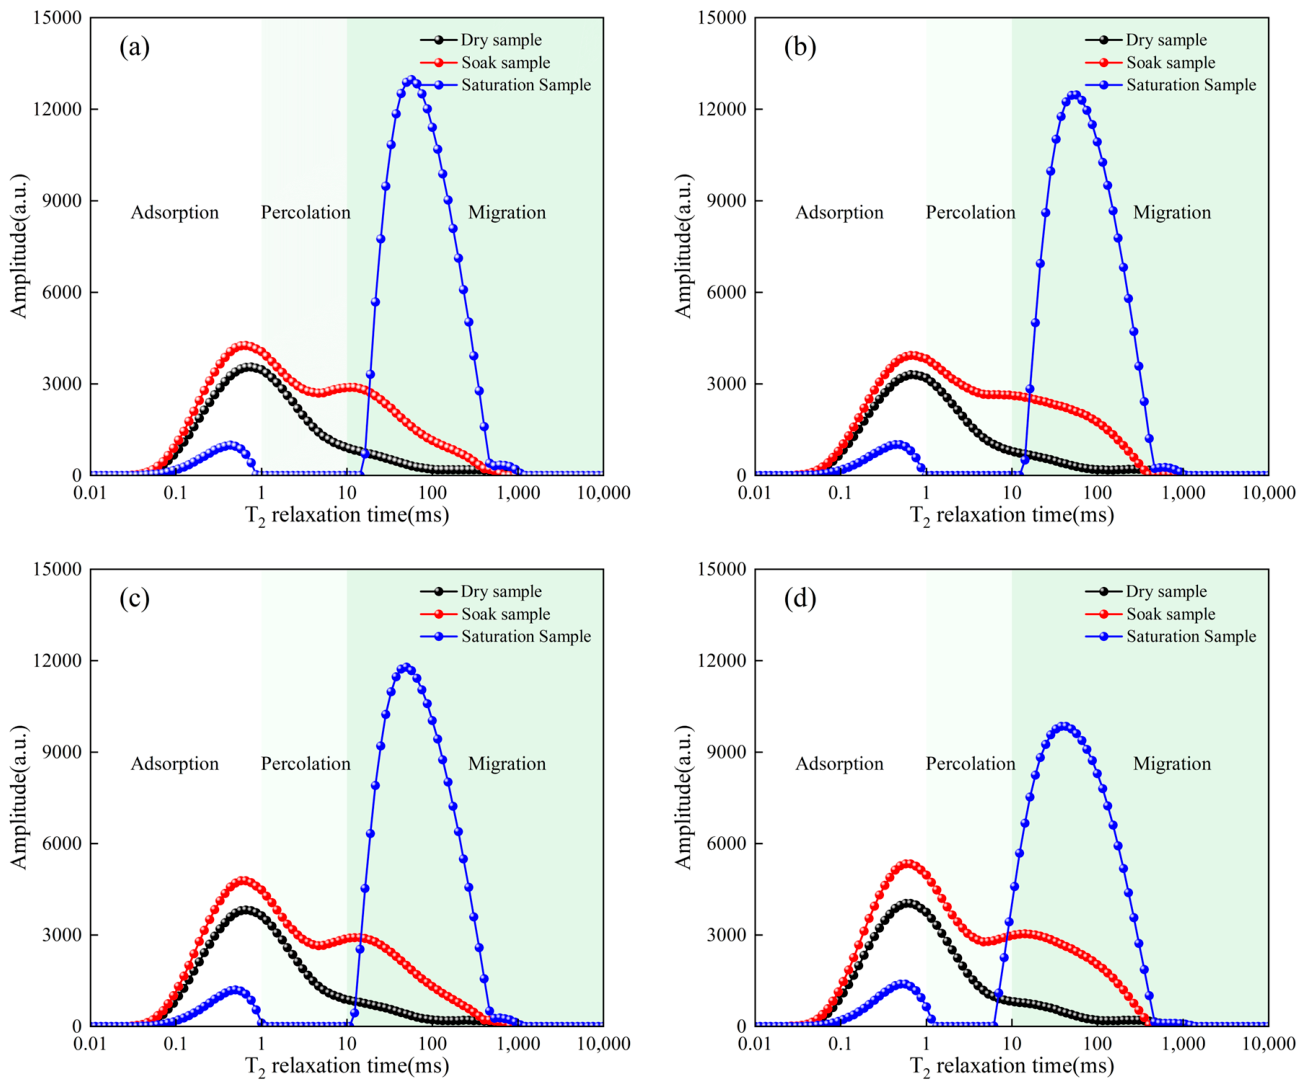
During carbonated water flooding, continuous exposure to carbonated water subjects reservoir rocks to prolonged aqueous fluid rock interactions in the presence of dissolved CO2, inducing changes in mineral composition and pore structure that may contribute to wettability alteration. This wettability alteration is not controlled by a single interfacial process but results from the coupled effects of multiple mechanisms, including mineral dissolution–reprecipitation, modifications in pore connectivity, and reconfiguration of fluid distribution [23,24]. It is worth noting that traditional droplet methods primarily characterize localized and static interfacial wettability, limiting their ability to capture bulk wettability behavior at the pore scale. Moreover, these methods typically require cutting and processing of core samples, which may alter the original pore structure and surface properties, thereby restricting their applicability in complex porous media [32,33,34,35]. To elucidate the evolution of rock wettability induced by carbonated water–rock interactions, NMR techniques were employed to systematically characterize pore fluid distribution in four core samples with similar physical properties under varying carbonated water exposure durations and saturation conditions. Changes in the morphology and peak area of T2 spectra under dry, partially saturated, and fully saturated conditions were analyzed to quantify water ingress across different pore scales, thereby revealing the mechanisms by which carbonated water alters reservoir wettability. Figure 3 should be interpreted as NMR T2 spectral evidence for wettability-related water redistribution rather than as a direct visualization of wetting behavior. The wettability-related interpretation is based on NMR-derived Sw and T2 signal distribution, which serve as relative indicators of pore-scale water affinity under the same experimental protocol.
As shown in Figure 3a–d, the NMR T2 spectra of cores subjected to different carbonated water exposure durations exhibit a high degree of consistency in both peak position and distribution range. This suggests minimal heterogeneity among the selected core samples, indicating that the observed spectral variations are primarily governed by carbonated water–rock interactions rather than inherent sample differences. To enable quantitative comparison of pore-scale fluid distribution under different treatment conditions, the T2 spectra were segmented using the operational relaxation-time domains defined in Section 2.3.3. This classification was used to describe relative fluid occurrence and mobilization behavior within different T2 domains, rather than to define absolute pore-size boundaries.
From a spectral perspective, a distinct single-peak distribution is observed in the dry state, with NMR signals mainly concentrated in the adsorption and percolation pore regions, indicating that fluids are confined within micropores. After 24 h of formation water immersion, a new peak emerges in the T2 spectrum, leading to a transition from single-peak to dual-peak morphology. Meanwhile, increased peak amplitudes in both pore regions suggest progressive fluid invasion into previously restricted micropores. After an additional 24 h of pressurized saturation, T2 signals in the adsorption and percolation pore ranges decreased markedly, while a dominant peak emerged in the migration pore range. This suggests that pressure-driven displacement overcame capillary resistance in percolation pores, expelling trapped fluids, whereas fluids in well-connected migration pores were largely retained. Consequently, NMR signals from migration pores increased significantly, while those from percolation pores decreased [36].
Despite carbonated water treatment durations ranging from 0 to 15 days, the NMR T2 spectra in Figure 3 do not show a monotonic increase in peak amplitude. Instead, progressive peak broadening and extension into the short T2 range are observed. Wang et al. also reported this phenomenon, suggesting the favorable connectivity of migration pores. Carbonated water can rapidly penetrate these pores, promoting mineral dissolution and the formation of new mineral phases, thereby inducing significant alterations in pore-scale morphology. Its impact on migration pores is more pronounced than that on adsorption and percolation pores [37].
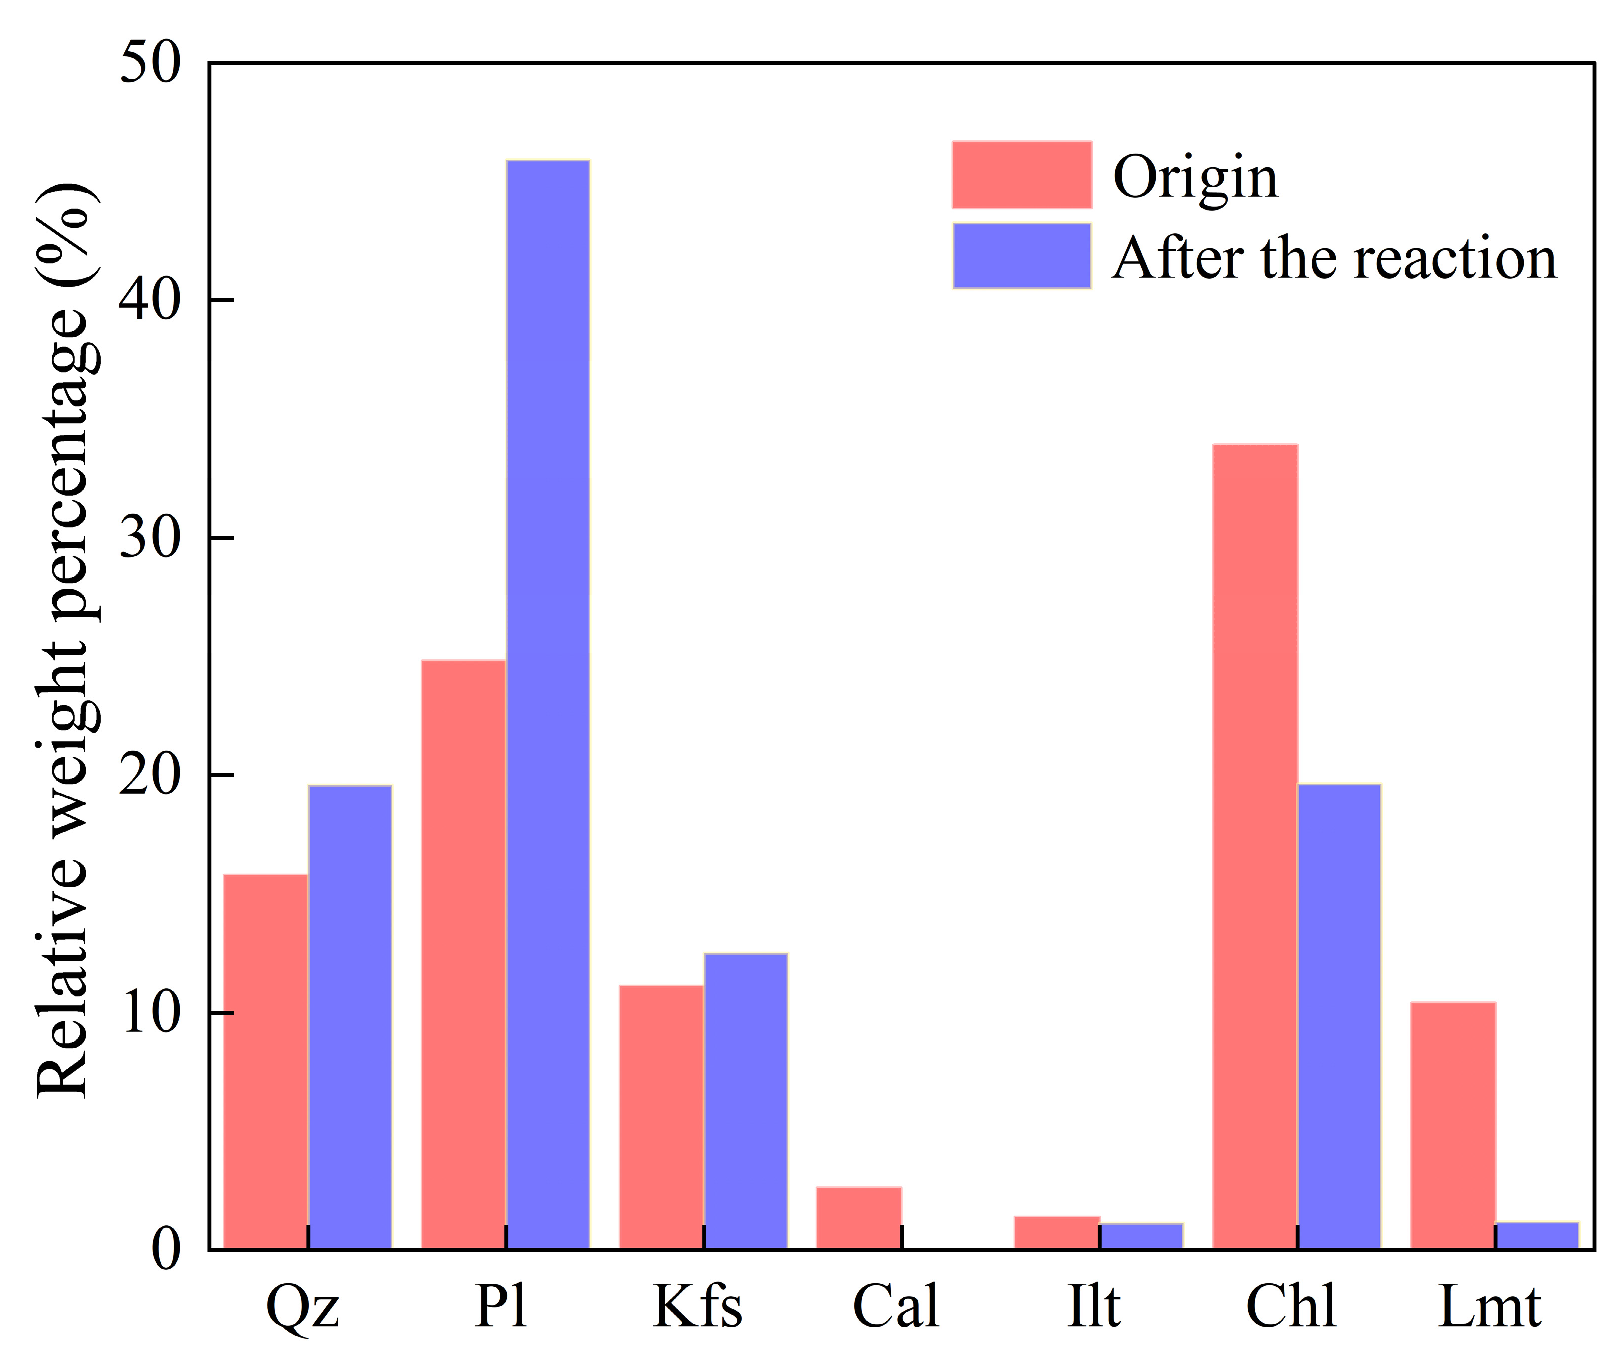
In addition to the NMR-derived pore-fluid redistribution, XRD analysis was used to provide independent mineralogical evidence for carbonated water–rock interactions. Using the unreacted parent-rock composition reported in Section 2.1 as the mineralogical baseline, the reacted samples exhibited clear changes in mineral composition after carbonated water exposure. As shown in Figure 4 and Appendix A, Table A4, the reacted samples exhibited relative increases in Qz, Pl, and Kfs contents, with average values of 19.6 ± 1.7%, 45.9 ± 0.3%, and 12.5 ± 3.6%, respectively. In contrast, Chl and Lmt decreased markedly from 33.9% and 10.4% in the original sample to 19.7 ± 1.8% and 1.2 ± 0.4% after reaction, respectively. Calcite was detected in the original sample at 2.6%, but it was not detected or was below the XRD quantification limit in all post-reaction measurements. Considering the semi-quantitative nature of XRD and the uncertainty associated with low-abundance phases, the calcite result was interpreted qualitatively as supporting evidence for possible carbonate dissolution. The mineralogical interpretation was therefore based mainly on the broader and more robust trend of mineral alteration, including the marked decreases in Chl and Lmt, the relative enrichment of Qz, Pl, and Kfs, and the accompanying NMR-derived changes in pore-scale water distribution. These time-dependent mineralogical changes indicate that carbonated water–rock interaction progressively altered the carbonate and clay or zeolite related mineral assemblage.
From a wettability perspective, variations in mineral composition and pore structure evolution jointly control reservoir wettability. Compared with clay minerals, Qz and Fsp exhibit higher intrinsic hydrophilicity; therefore, increasing their relative content enhances the overall hydrophilic of the rock [38]. Meanwhile, possible carbonate dissolution and the alteration of clay and zeolite-related minerals may expose fresh mineral surfaces, promoting water spreading along pore walls [39]. In addition, mineral dissolution and transformation can enhance pore connectivity and modify surface properties, facilitating water invasion into larger pores and ultimately driving a progressive shift toward more hydrophilic wettability [40,41,42].
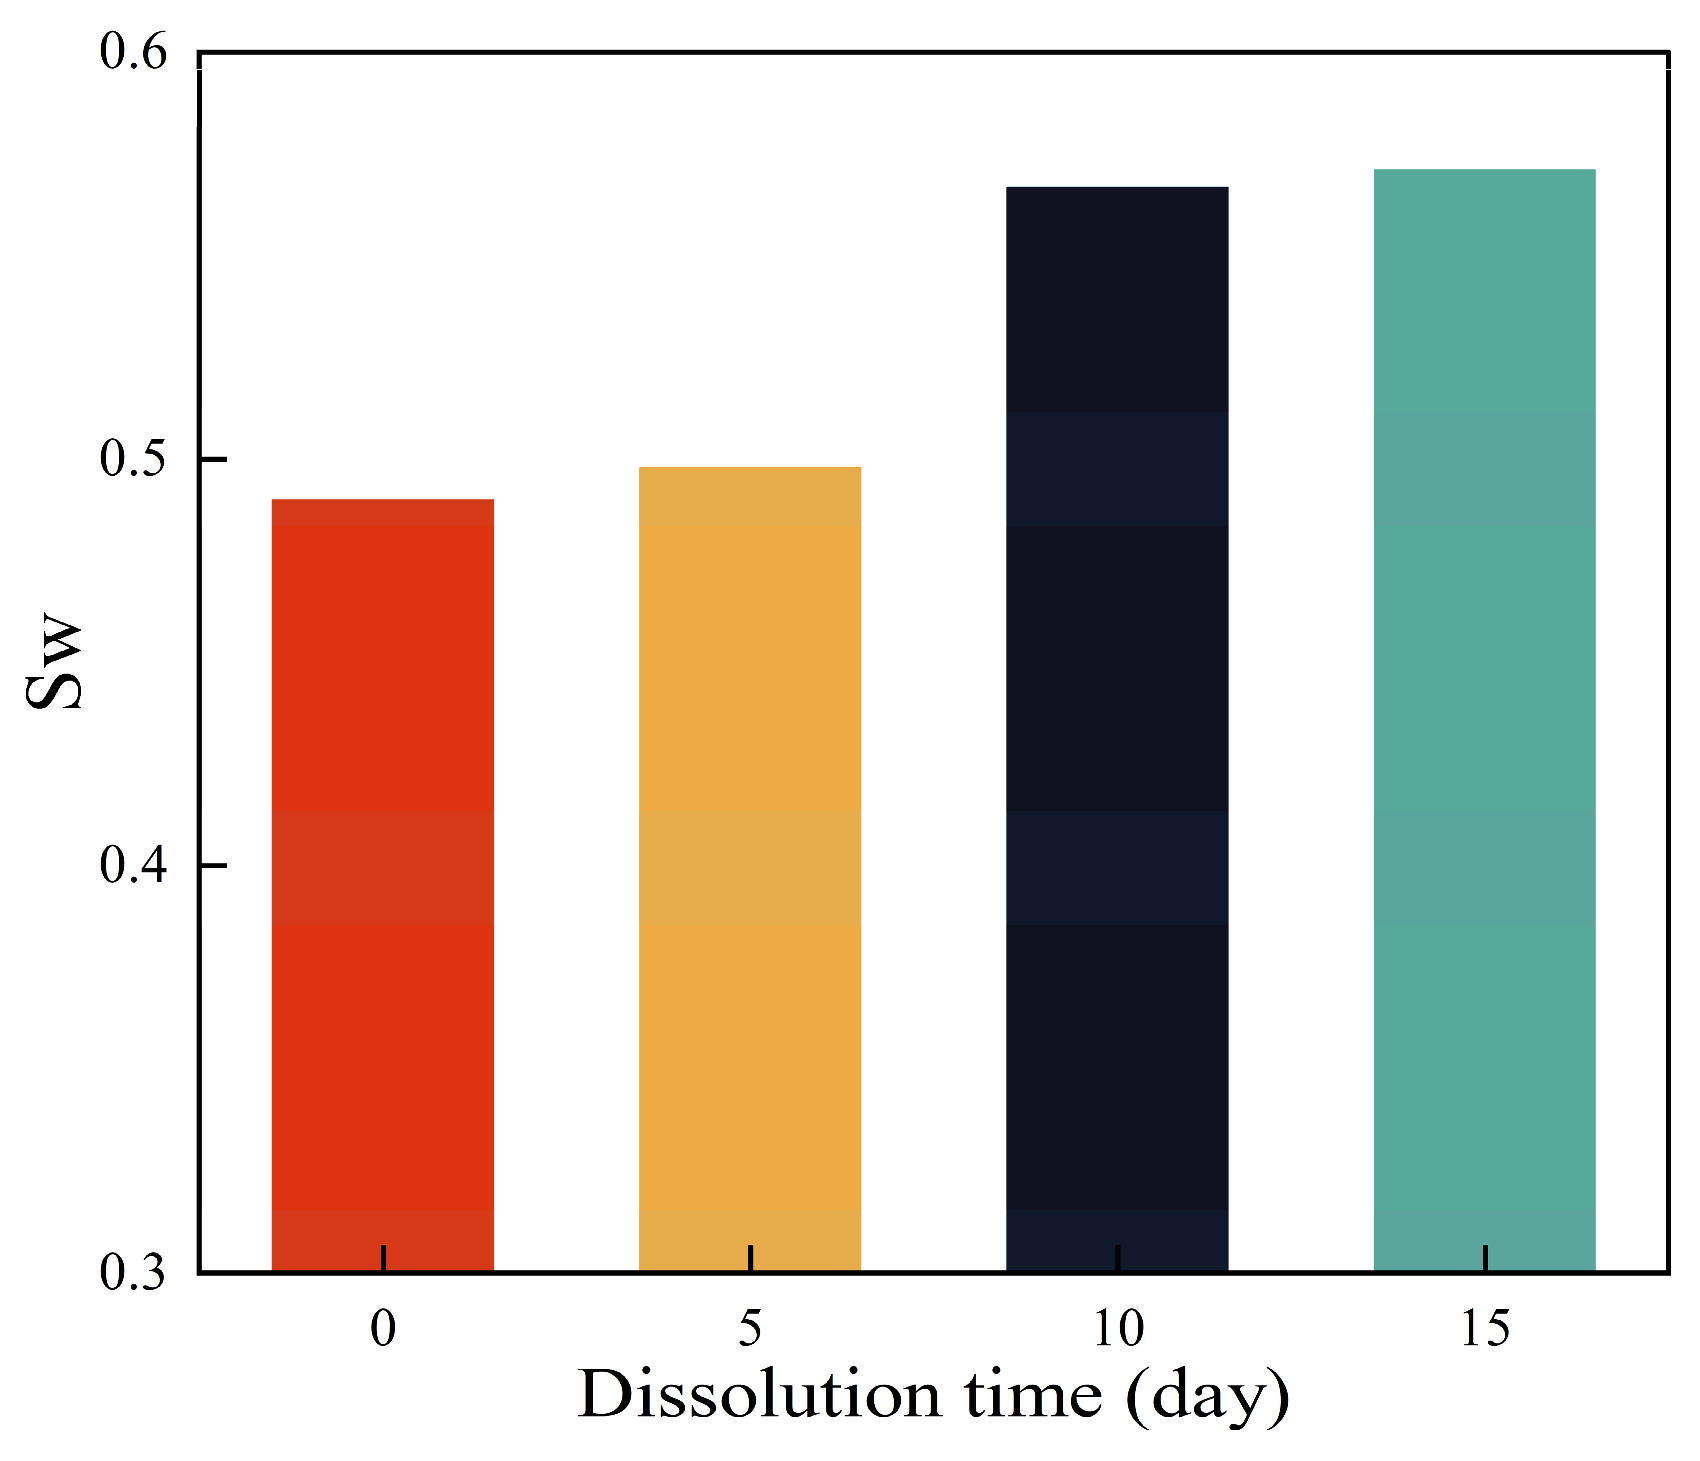
Based on the peak area statistics across different pore size ranges, NMR-derived Sw was used to infer the relative evolution of bulk pore-scale wettability under different experimental conditions. The results are shown in Figure 5, with detailed data provided in Appendix A, Table A5. The cores exhibited apparent wettability differences with treatment duration under the present single-core experimental design. The untreated core shows a water saturation (Sw) of 0.490, which slightly increases to 0.498 after 5 days of carbonated water treatment. With increasing carbonated water exposure duration, Sw rises to 0.567 at 10 days and further to 0.571 at 15 days. According to research by Yang kang et al., wettability variations can be inferred from water saturation, with higher SW indicating stronger water-wet characteristics [26].
Overall, under carbonated water treatment, NMR-derived Sw increased from 0.490 to 0.571, indicating that water occupied a larger proportion of the accessible pore space under the same saturation protocol. The slight increase after 5 days, followed by more pronounced increases after 10 and 15 days, suggests that the measurable wettability-related response mainly developed after extended carbonated water–rock interaction. Combined with the XRD evidence for calcite falling below the detection or quantification limit and marked decreases in chlorite and laumontite, this trend indicates that carbonate and clay/zeolite-related mineral alteration provided a mineralogical basis for the apparent increase in pore-scale water affinity [22,24]. This interpretation is consistent with previously reported carbonated water injection mechanisms, in which dissolved CO2 can reduce brine pH, modify oil–brine–rock interfacial interactions [43], and promote wettability-related water redistribution.

3.2. Crude Oil Mobilization Pattern During Co2 Flooding After Different Carbonated Water Exposure Durations

Wettability is a key factor controlling oil–water distribution and fluid migration processes in reservoirs [44]. Under carbonated water conditions, wettability evolution alters the occurrence and spatial distribution of crude oil within the pore system, thereby affecting both microscale displacement mechanisms and macroscale recovery efficiency during CO2 flooding. Based on the established patterns of carbonated water-induced wettability evolution, this study investigates its impact on CO2 flooding performance. Four low-permeability sandstone cores, oil-saturated after different carbonated water treatment durations, were subjected to online NMR-monitored CO2 displacement experiments.
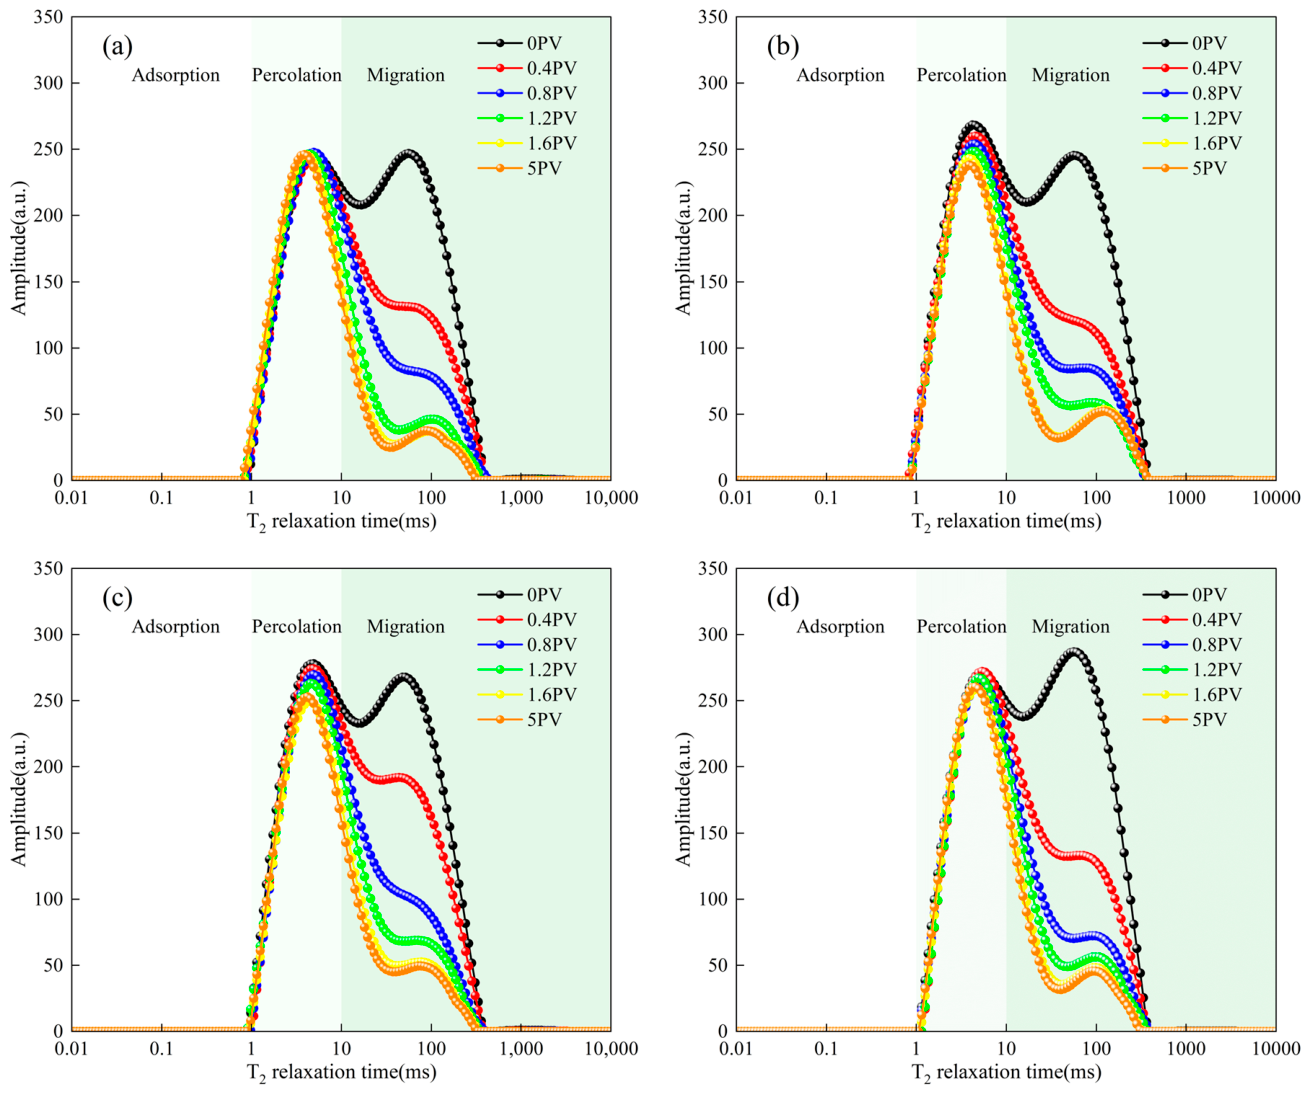
As shown in Figure 6, the NMR T2 spectra of cores treated for different carbonated water exposure durations exhibit a high degree of consistency during CO2 displacement. Similar peak distributions and morphological evolution indicate minimal sample heterogeneity among cores of the same type. Prior to CO2 injection (0 PV), the T2 spectra display a bimodal distribution, with crude oil primarily residing in the 1–10 ms and 30–400 ms, corresponding to percolation and migration pores, respectively. As CO2 injection increased to 0.4 PV, peak intensities decreased, with more pronounced attenuation in the migration pore range than in the percolation pore range, indicating preferential mobilization of crude oil from migration pores during the early displacement stage. When CO2 injection increased to 0.8 PV, crude oil signals in the migration pore range continued to decrease significantly, while those in the percolation pore range exhibited only minor attenuation, suggesting that crude oil migration was still dominated by highly connected pore spaces. As CO2 injection increased to 1.2 PV, crude oil content in the migration pore range continued to decline, with a reduced rate, indicating progressive depletion. Meanwhile, the percolation pore range showed a gradual decrease. At 1.6 PV, changes in crude oil signals in the migration pore range further slowed, while the percolation pore range approached stabilization. At 5 PV of CO2 injection, spectral variations across relaxation time intervals became small relative to the 1.6 PV stage, indicating that the displacement had approached the final residual-oil state. However, because no intermediate NMR scan was conducted between 1.6 and 5 PV, the exact stabilization trajectory within this interval cannot be fully resolved. These PV-dependent T2 spectral changes present the variation in oil-bearing pore-size-domain distribution across the injection process. The rapid decrease in the long T2 signal indicates preferential oil mobilization from well-connected migration pores during the early stage of CO2 injection, whereas the gradual attenuation in the 1 to 10 ms domain reflects subsequent oil removal from capillary-controlled percolation pores. By 5 PV, the T2-domain distribution approached a residual-oil state, indicating that further oil mobilization from the dominant oil-bearing pore domains became limited.
To quantitatively evaluate crude oil mobilization during CO2 flooding, variations in crude oil volume in cores treated for different carbonated water exposure durations were quantified based on the established relationship between NMR signal intensity and oil content. This method allows for the differentiation of mobilization behavior between migration and percolation pores.
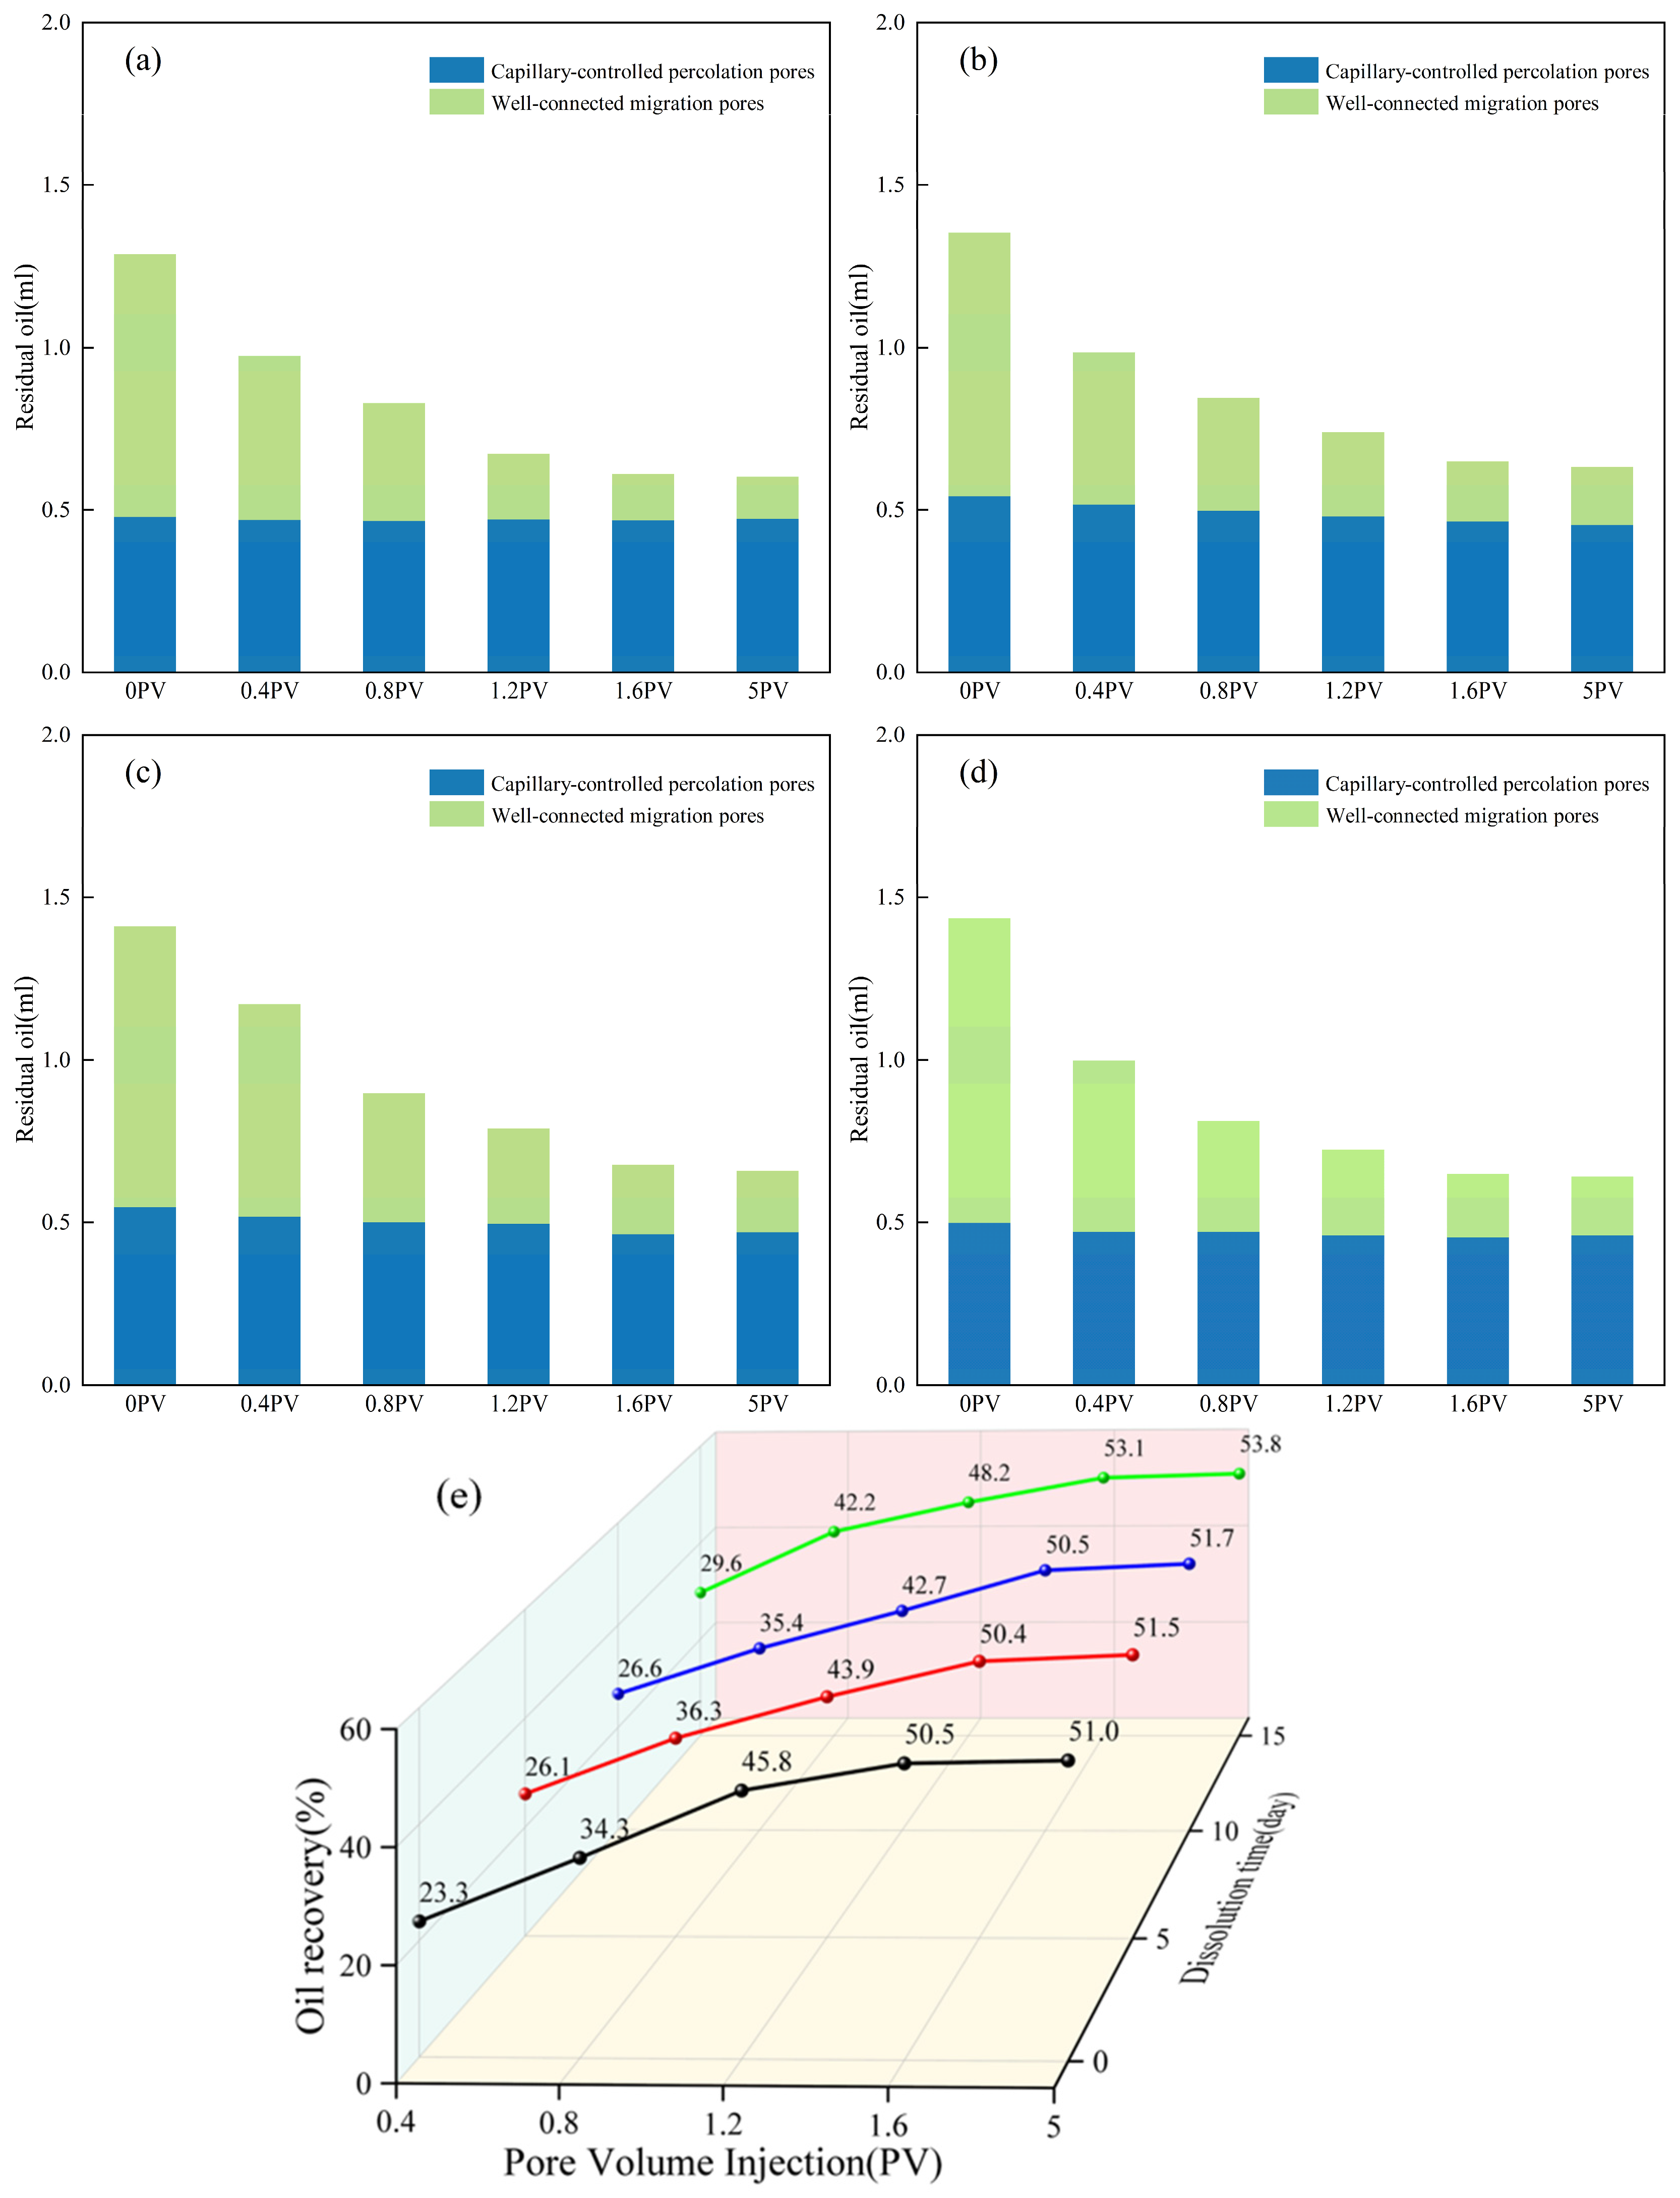
As shown in Figure 7a–d, the residual oil volume in percolation pores of untreated cores exhibits minimal change with increasing injected pore volumes (PV) during CO2 flooding, resulting in an overall recovery of approximately 0.01 mL. This suggests that under weakly water-saturated conditions, capillary forces strongly restrict CO2-driven oil mobilization in this pore range [45]. In contrast, after carbonated water treatment, residual oil in percolation pores decreases more significantly with increasing PV, with mobilization intensity initially increasing before gradually declining with prolonged treatment. Quantitative analysis of NMR signals from percolation pores (Figure 7a–d) shows that the core treated for 5 days achieved the highest recovery (approximately 0.09 mL), whereas those treated for 10 and 15 days yielded approximately 0.08 mL and 0.04 mL, respectively. The calculation method and detailed data are provided in Appendix A, Table A6. These results suggest that moderate carbonated water treatment effectively reduces crude oil confinement in percolation pores, while excessive treatment diminishes this enhancement. Within migration pores, CO2 displacement exhibits clear stage-dependent mobilization behavior. NMR-based results (Figure 7a–d) show that untreated cores produced approximately 0.68 mL of crude oil from migration pores by the end of flooding, which decreased to approximately 0.63 mL after 5 days of carbonated water treatment. This suggests that during the initial wettability adjustment stage, CO2-driven oil mobilization in macropores weakened, with a partial shift in displacement contribution toward micropores. With further increases in treatment duration, oil recovery from migration pores gradually rebounded. NMR-based calculations (Figure 7a–d) indicate that samples treated for 10 and 15 days yielded approximately 0.68 mL and 0.76 mL, respectively, with the 15-day sample significantly exceeding the untreated core. With increasing carbonated water treatment duration, cores approached higher oil saturation, accompanied by increased NMR signal intensity, indicating an expansion of pore volume available for oil occupancy. These results suggest that carbonated water treatment promotes pore structure development and increases the number of effective pores, thereby enhancing initial oil saturation.
Based on this analysis, initial oil saturation and post-displacement residual oil content were quantified using the relationship between NMR signals and crude oil volume, enabling evaluation of CO2 flooding recovery rates for different treatments (Figure 7e). Overall, recovery increased rapidly before 1.6 PV and then approached a final residual-oil state by 5 PV. Under the present single-core experimental design, longer carbonated water treatment showed an apparent enhancement in recovery performance. The 15-day treated core achieved the highest recovery factor of 53.8% at 5 PV CO2 injection, corresponding to a 1.1 to 2.8 percentage-point increase compared with the other treatments. Because this increase was relatively small and each treatment was represented by one adjacent core plug, this recovery enhancement is interpreted as an apparent single-core trend supported by core-specific normalization and by the consistency among NMR-derived residual oil variation, MRI-based oil distribution, NMR-derived water redistribution, and mineralogical variation. More importantly, the NMR results indicate a redistribution of oil mobilization among different T2 domains. Untreated cores mainly produced oil from well-connected migration pores, whereas carbonated water treatment enhanced the contribution of capillary-controlled percolation pores. This redistribution suggests that the recovery response was controlled by coupled mineral alteration, pore-connectivity modification, wettability-related water redistribution, and changes in pore-scale oil accessibility. Thus, the present results link NMR-derived residual oil variation with existing carbonated water injection mechanisms and highlight the value of online NMR and MRI monitoring for resolving pore domain-dependent oil mobilization.
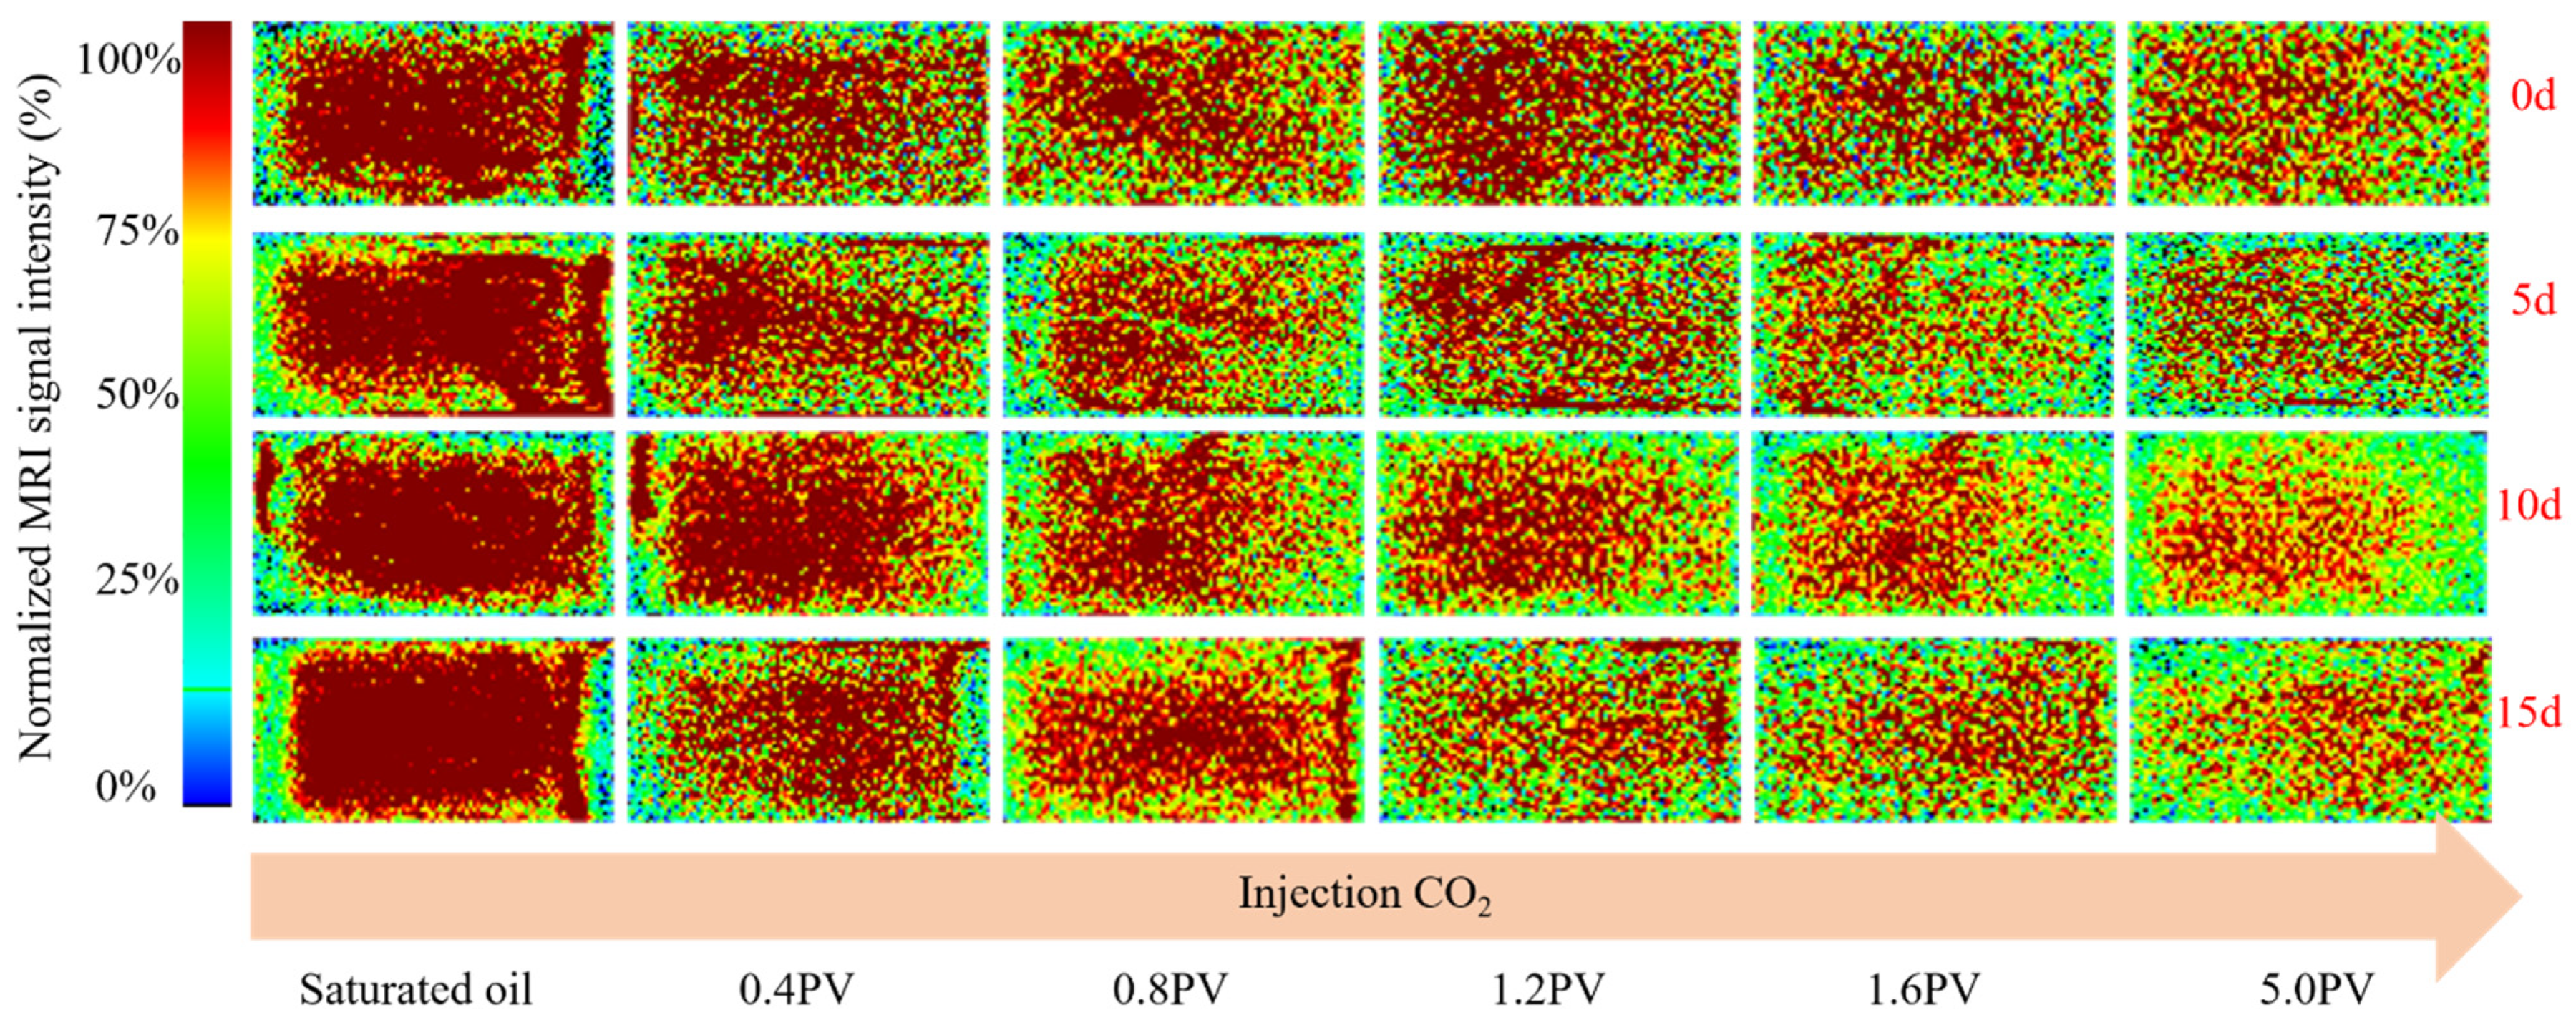
Based on quantitative analysis of NMR signals and crude oil volume, this study elucidates the spatial distribution of residual oil and CO2 recovery under different carbonated water treatment conditions. MRI analysis was further integrated into the same online NMR system. Notably, MRI characterization does not require a separate experiment but is achieved through spatial reconstruction of NMR signals under identical experimental conditions, injection procedures, and CPMG acquisition settings. As shown in Figure 8, this approach enables direct visualization of oil saturation evolution and provides an intuitive spatial representation of crude oil migration and mobilization within the core. In Figure 8, the MRI images are presented as color maps rather than grayscale images. All maps are displayed using the same normalized color scale from 0% to 100%, where the color intensity represents normalized MRI oil signal intensity and serves as a relative indicator of local oil saturation. Warmer colors indicate higher residual oil signal intensity, whereas cooler colors indicate lower residual oil signal intensity after CO2 displacement. Therefore, the spatial color variation reflects the redistribution and mobilization of residual oil under identical imaging and normalization conditions. With increasing injected PV during CO2 flooding under different carbonated water treatment conditions, it offers dynamic validation of macroscopic recovery variations [46].
In untreated cores, crude oil was primarily concentrated in localized high-saturation zones. During the early stage of CO2 injection, mobilization was restricted to limited flow pathways, with low-saturation regions showing pronounced spatial heterogeneity. As injected PV increased, overall oil saturation decreased; however, numerous high-saturation residual zones persisted, indicating that oil mobilization remained strongly constrained by pore connectivity and wettability. In contrast, with increasing carbonated water treatment duration, oil saturation became more uniformly distributed within the core. During CO2 injection, low-saturation regions expanded in both axial and radial directions, reflecting a substantial increase in the extent of oil mobilization. Notably, after 15 days of treatment, CO2 injection at 0.4 PV was sufficient to initiate a decline in oil saturation. As injected PV increased, high-saturation zones progressively diminished, consistent with quantitative results showing that recovery increases with PV and stabilizes beyond 1.6 PV. These observations provide direct spatiotemporal evidence for the evolution of oil saturation during injection, supporting enhanced CO2 recovery under carbonated water treatment.

3.3. Mechanism of Enhanced Co2 Flooding Efficiency Induced by Carbonated Water

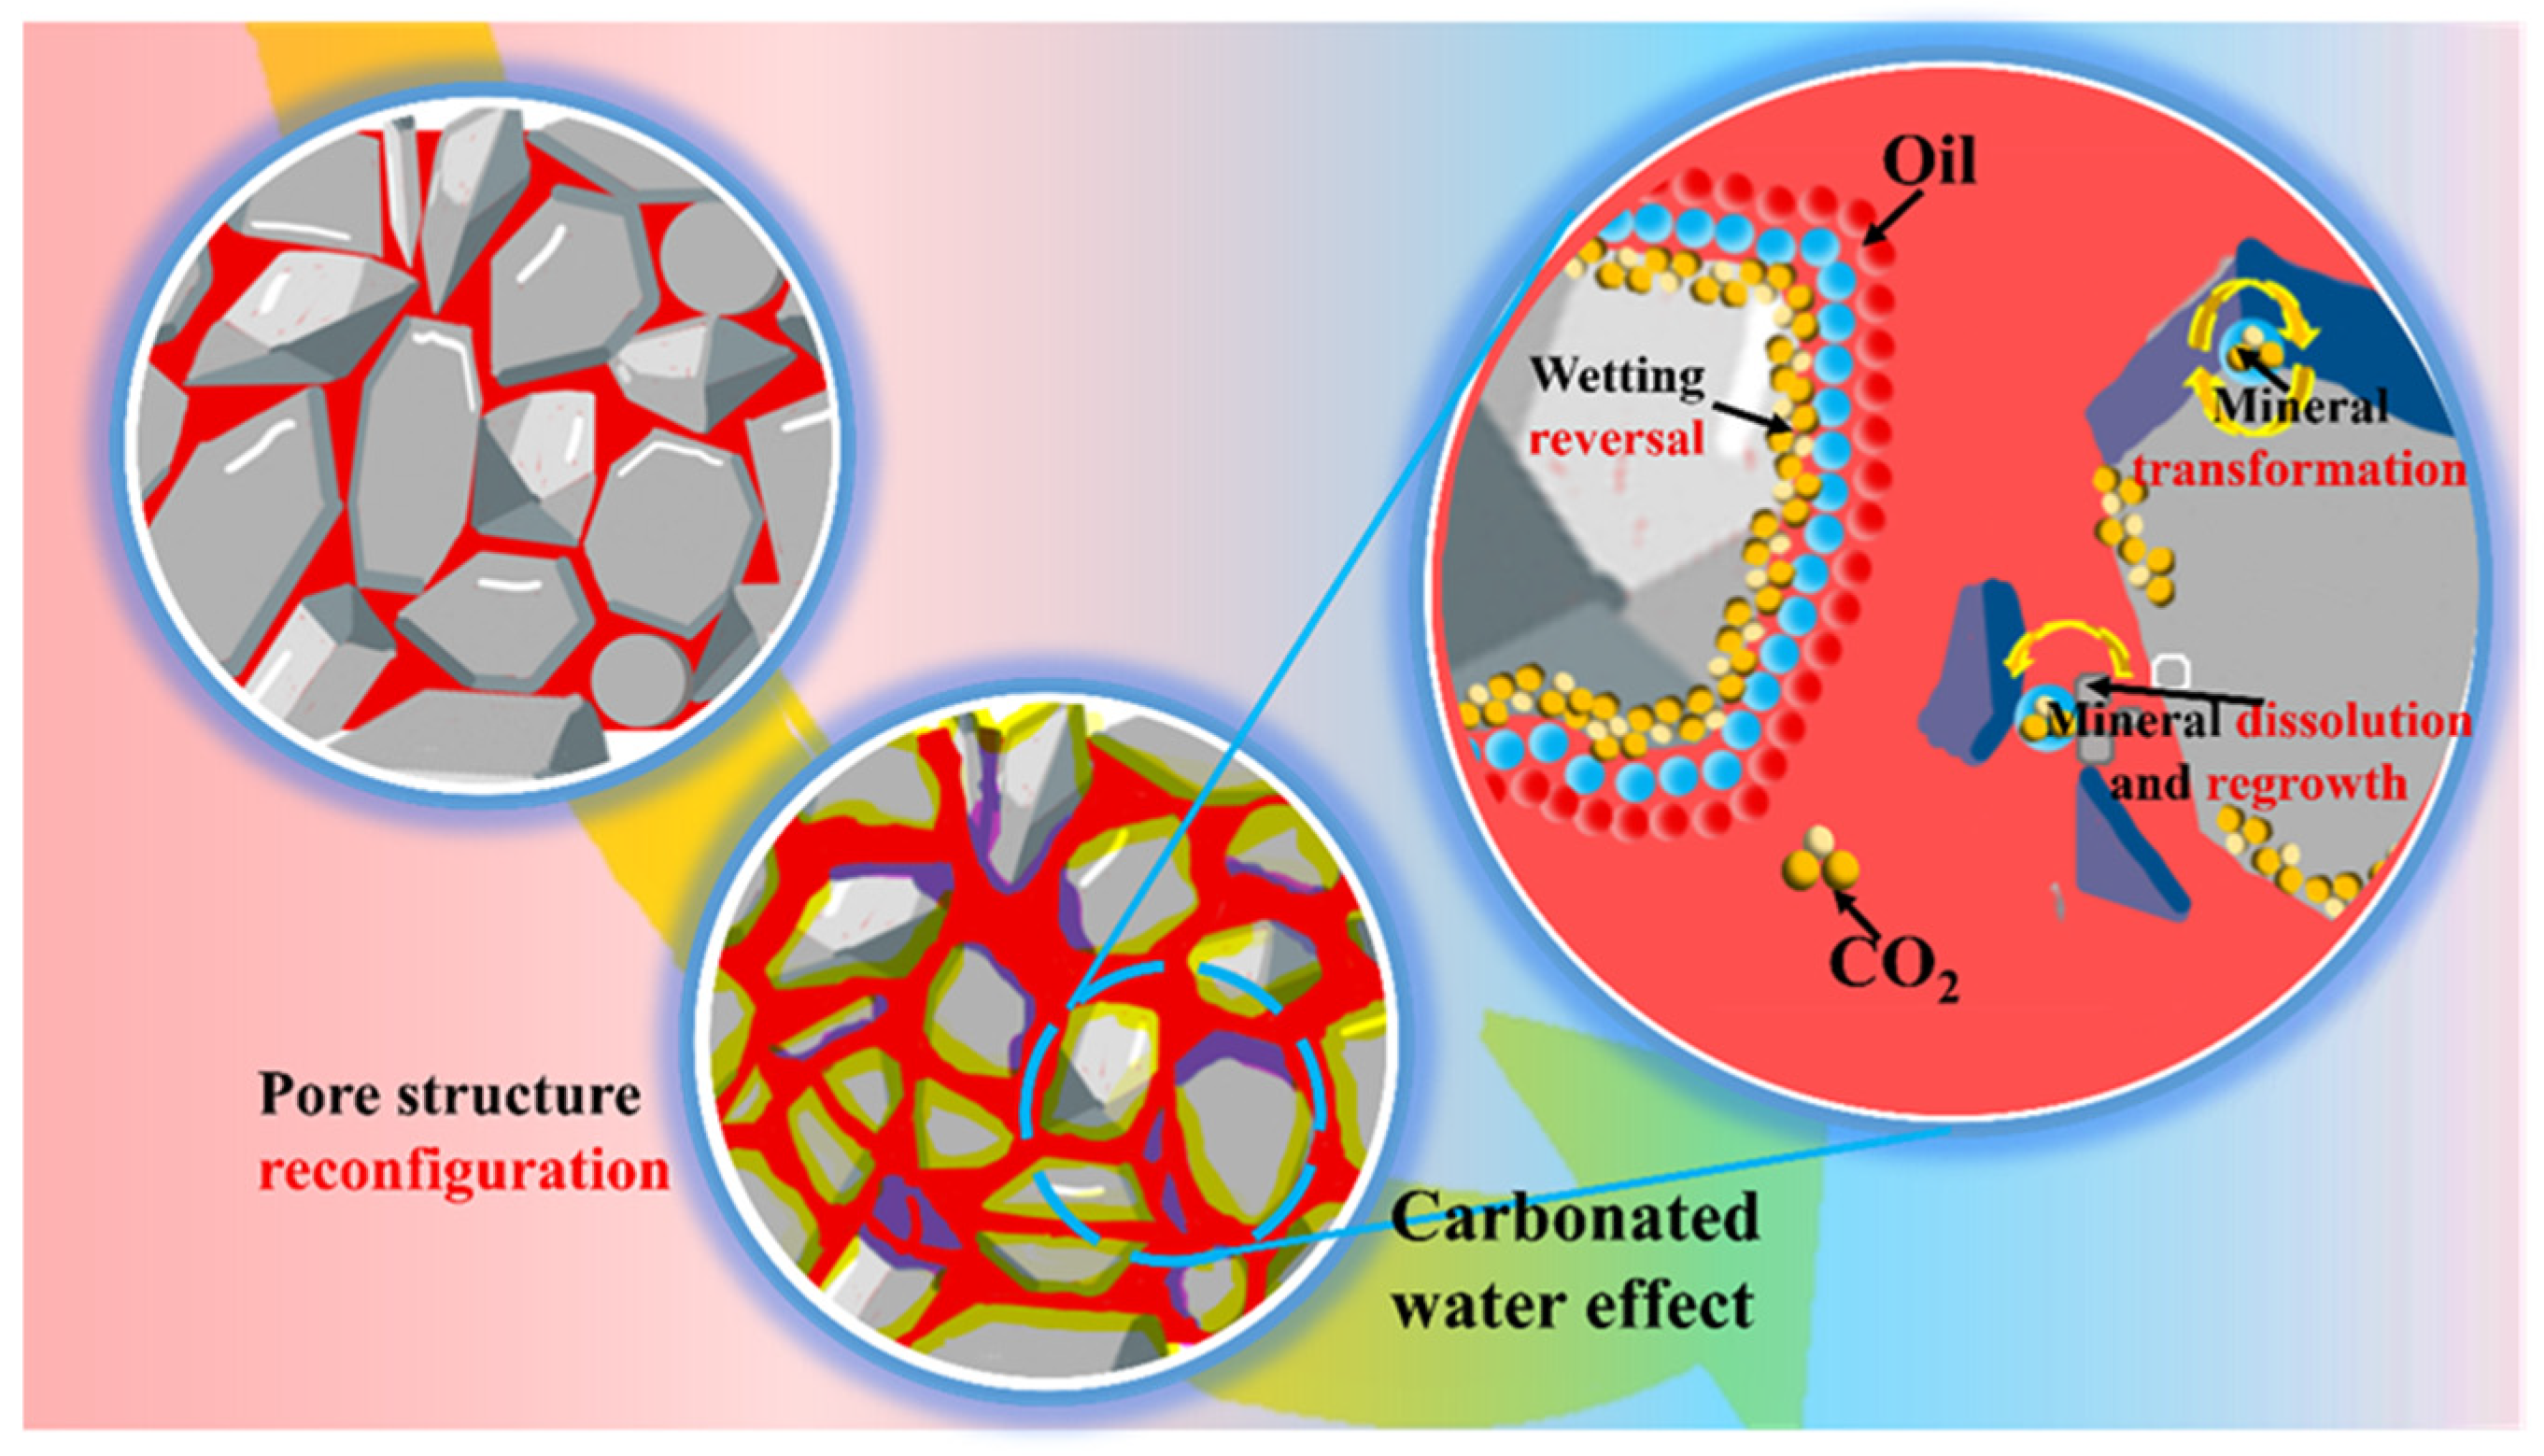
Experimental results show that carbonated water treatment promotes the coupled evolution of mineral alteration, pore connectivity, wettability-related water redistribution, and crude oil mobilization across different T2 domains. These processes are consistent with previous studies showing that carbonated water can modify mineral composition, pore structure, and wettability. The contribution of this study lies in providing online NMR and MRI evidence that connects these effects to the redistribution of crude oil during displacement. Therefore, the term “multi-scale pore mobilization” is used here as an integrated interpretation of the observed displacement behavior, rather than as a uniquely proven mechanism independent of previously reported wettability-coupled dissolution effects. Under carbonated water treatment, oil mobilization gradually changes from a migration pore-dominated response to a broader contribution from both percolation and migration pore domains, resulting in improved sweep efficiency and higher final recovery [47,48]. As illustrated in Figure 9, continued carbonated water–rock interactions progressively reconstruct reservoir connectivity through selective mineral dissolution and pore structure remodeling, enhancing effective connectivity between percolation and migration pores [49]. This structural evolution provides the foundation for expanded fluid-accessible space and enhanced flow connectivity. Simultaneously, mineralogical evolution coupled with pore-scale fluid redistribution may increase apparent pore-scale water affinity under the same saturation protocol [50]. At the pore scale, the apparent wettability-related reversal shown in Figure 9 should be understood as a shift in fluid affinity and water occupancy under the same saturation protocol, rather than as a direct contact angle-based quantification of wettability reversal. After CO2 dissolves in formation water, the carbonic-acid buffer system can reduce the local pH and modify the oil–brine–rock interfacial environment. This chemical environment may weaken oil–wet surface interactions and promote water spreading along mineral surfaces. Meanwhile, carbonated water–rock interaction can dissolve or alter carbonate, clay, and zeolite-related minerals, exposing fresh mineral surfaces and modifying pore-wall properties. These changes may increase the accessibility of water to pore surfaces and promote the formation of more continuous water-wet pathways in originally capillary-controlled percolation pores. As a result, crude oil adhesion and capillary retention in these pores may be weakened, allowing oil that was previously difficult to mobilize to participate in the subsequent CO2 flooding process. Therefore, the wettability-related response in Figure 9 is interpreted as the coupled result of chemical-environment evolution, mineral alteration, pore-connectivity modification, and NMR-derived water redistribution, which together enhance oil mobilization from percolation pores while maintaining oil production from well-connected migration pores. Spatially, this evolution is reflected by the synchronous expansion of low oil-saturation regions and, macroscopically, by sustained enhancement and stabilization of recovery efficiency.
Previous studies have identified CO2 transfer into oil, oil swelling, interfacial tension modification, pH-dependent interfacial charge changes, mineral dissolution, pore-connectivity evolution, and wettability alteration as key mechanisms of carbonated water flooding [51,52,53,54,55]. Compared with studies reporting larger recovery enhancement, the final recovery increment in this work was modest, which is reasonable because the experiments were conducted under immiscible CO2 flooding in low-permeability sandstone after static carbonated water exposure. The present results are consistent with these mechanisms, as shown by carbonate and clay/zeolite-related mineral alteration, increased NMR-derived Sw, and the MRI-observed expansion of low oil-saturation regions during CO2 flooding. The main contribution of this study is to integrate these responses within the same experimental sequence and provide pore-scale NMR and MRI evidence showing how carbonated water treatment redistributes oil mobilization among adsorption-dominated, capillary-controlled percolation, and well-connected migration pore domains.
In summary, this study supports the widely accepted view that the effectiveness of carbonated water flooding is closely associated with mineral alteration, pore connectivity evolution, and wettability modification [24,56]. Building on these established mechanisms, the present work provides online NMR and MRI evidence showing how these coupled processes influence crude oil redistribution across different T2 domains during displacement. The proposed framework should therefore be regarded as an integrated pore-scale interpretation of carbonated water flooding behavior, with emphasis on the coupling among mineral evolution, wettability-related water redistribution, and multi-domain oil mobilization.

3.4. Limitations and Future Work

Although the present study provides pore-scale evidence for carbonated water-assisted CO2 flooding, its field-scale translation should be further evaluated under more representative reservoir conditions. The short cylindrical core plugs mainly reflect controlled one-dimensional displacement, whereas field performance may be influenced by three-dimensional flow patterns and multi-scale heterogeneity, including fractures, laminae, permeability streaks, facies architecture, and injection-production configuration. Because each exposure duration was represented by one adjacent core plug, the observed wettability-related response and recovery variation are interpreted as mechanistic trends supported by NMR, MRI, and XRD evidence. Future studies should include replicate cores, long-core or heterogeneous-core tests, water and salinity controls, and independent wettability measurements to validate the NMR-derived response. In addition, MnCl2-free control tests or lower-concentration paramagnetic agents should be tested to evaluate possible salinity-induced surface effects during NMR-monitored flooding, while coupled time-resolved aqueous chemistry and mineralogical characterization should be used to quantify mineral dissolution rates and improve field-scale prediction.

4. Conclusions

This study investigates carbonated water–induced wettability evolution and its impact on CO2-enhanced oil recovery in low-permeability sandstone reservoirs, using an integrated approach that combines quantitative NMR T2 analysis with in situ MRI. The main conclusions are summarized as follows:
(1)
Carbonated water treatment promoted coupled mineral alteration, pore-connectivity modification, and wettability-related water redistribution. These coupled changes reshaped oil mobilization across T2-defined pore domains, shifting displacement from migration-pore-dominated production toward broader participation of capillary-controlled percolation pores and well-connected migration pores. Therefore, the incremental recovery is attributed to coupled carbonated water–rock interaction rather than to wettability alteration alone;
(2)
MRI results show that, as carbonated water treatment duration increases, low oil-saturation regions evolve from localized expansion to widespread spatial development during displacement. This suggests that CO2 migration became less localized and involved broader pore-scale participation after carbonated water treatment. Macroscopically, this is reflected in an enlarged sweep volume and improved recovery rate;
(3)
Compared with direct CO2 injection, carbonated water provides an aqueous pathway for dissolved CO2 and carbonic acid to contact pore surfaces, thereby reducing the dependence of CO2 transport on localized dominant gas-flow channels. This pathway explains its role as an intermediate medium linking CO2 utilization, wettability-related water redistribution, and improved pore-scale oil mobilization.

Author Contributions

Conceptualization, W.Z. and H.H.; methodology, J.Z.; software, W.Z.; validation, J.Z. and L.H.; formal analysis, J.Z., W.Z., H.H., L.H., X.W., T.Z., T.X. and Y.W.; investigation, J.Z.; resources, W.Z. and H.H.; data curation, J.Z.; writing—original draft preparation, J.Z.; writing—review and editing, J.Z., W.Z., H.H., L.H., X.W., T.Z., T.X. and Y.W.; visualization, W.Z.; supervision, W.Z., H.H., L.H., X.W., T.Z., T.X. and Y.W.; project administration, H.H.; funding acquisition, W.Z. All authors have read and agreed to the published version of the manuscript.

Funding

This research was funded by National Natural Science Foundation of China, grant number 52474043. This research was funded by Innovation Capability Support Program of Shaanxi, grant number 2023-CX-TD-31. This research was funded by Shaanxi Province key research and development plan, grant number 2024GX-YBXM-505. This research was funded by State Key Laboratory of Petroleum Resources and Engineering, China University of Petroleum (Beijing), grant number No.PRE/open 2510. This research was funded by Science Foundation of China University of Petroleum, Beijing, grant number 2462025YJRC010. This research was funded by The Young Talent Fund of Xi’an Association for Science and Technology, grant number No.0959202513151.

Data Availability Statement

The data supporting the reported results can be found in the Appendix A.

Acknowledgments

The authors gratefully acknowledge financial support from the Youth Innovation Team of Shaanxi Universities. Science Foundation of China University of Petroleum, Beijing (2462025YJRC010). The Young Talent Fund of Xi’an Association for Science and Technology (NO. 0959202513151). The authors also thank the anonymous reviewers for their constructive suggestions and valuable feedback.

Conflicts of Interest

The authors declare no competing financial interests.

Appendix A

  • Method A1. Preparation of experimental samples
Appendix A, Figure A1 shows only the four selected plugs used in the main experiments.
Atmosphere 17 00673 i001
Figure A1. Core reaction apparatus.
Atmosphere 17 00673 g0a1
Figure A2. Experimental workflow.
Atmosphere 17 00673 g0a2
The four intact core plugs W1–W4 were sequentially subjected to carbonated water exposure, non-destructive NMR-based wettability evaluation, and online NMR-monitored CO2 flooding. XRD analysis was conducted separately using representative crushed subsamples or offcuts from the same adjacent parent core material; this destructive preparation was not performed on the intact plugs used for NMR and flooding tests.
Table A1. Chemical composition of the produced formation water used in this study.
Different Types of IonsContent (mg/L)
K+ + Na+7921.86
Ca2+7381.92
Mg2+117.66
Cl−25,409.75
SO42−681.60
HCO3− + CO32− + OH−154.99
Note: The total salinity of the produced formation water was 41.67 g/L.
Table A2. The NMR scan specific parameters.
Magnet—Probe OptionMesoMR23-060H-I-25mm
Magnetic Field Strength0.5T
Sequence NameCPMG
SF (MHz)23
O1 (Hz)58,021.69
P1 (us)7.00
TD720,010
PRG3
TW (ms)6000.000
SW (KHz)250
RFD (ms)0.002
RG1 (db)20.0
DRG13
DR1
NS64
P2 (us)15.04
TE (ms)0.200
NE CH18,000
Table A3. Prescribed standard data.
NMR Signal IntensityOil Volume (mL)
5133.2000.500
9922.0501.000
15,878.4501.500
20,422.9002.000
24,251.1002.500
Table A4. Mineral composition.
MineralOrigin (%)Post-Reaction1 (%)Post-Reaction2 (%)Post-Reaction3 (%)Post-Reaction4 (%)Mean ± SD (%)
Qz15.821.317.920.718.519.6 ± 1.7
Pl24.846.145.746.245.645.9 ± 0.3
Kfs11.18.416.614.210.812.5 ± 3.6
Cal2.6NDNDNDNDND
Ilt1.411.30.91.41.2 ± 0.3 *
Chl33.921.817.519.32019.7 ± 1.8
Lmt10.41.411.60.81.2 ± 0.4
ND, not detected or below the XRD quantification limit. * For Ilt, the mean and standard deviation were calculated only from detected values.
Table A5. Calculation SW.
051015
V 1 89,25281,86493,49484,413
V 2 149,994147,360161,867156,696
V 3 213,267213,334213,992210,994
∆ V w 60,74265,49668,37372,283
V 124,015131,4701204,98126,581
S w 0.4900.4980.5670.571
Table A6. Residual oil volume.
(1) 0 Day
Pore Volume InjectionPercolation PoreMigration Pore
0 PV0.47830.80836
0.4 PV0.468880.50578
0.8 PV0.46630.36329
1.2 PV0.469770.20329
1.6 PV0.466830.1448
5 PV0.471130.13075
(2) 5 Day
Pore Volume InjectionPercolation PoreMigration Pore
0 PV0.54110.81247
0.4 PV0.516480.46957
0.8 PV0.496150.34824
1.2 PV0.47940.25968
1.6 PV0.463570.18553
5 PV0.452750.18039
(3) 10 Day
Pore Volume InjectionPercolation PoreMigration Pore
0 PV0.54550.86519
0.4 PV0.516140.65502
0.8 PV0.498930.39775
1.2 PV0.495570.29372
1.6 PV0.462240.21472
5 PV0.469150.19052
(4) 15 Day
Pore Volume InjectionPercolation PoreMigration Pore
0 PV0.498240.93706
0.4 PV0.47060.52647
0.8 PV0.470180.34146
1.2 PV0.459650.26373
1.6 PV0.452960.19746
5 PV0.45970.18028

References

  1. Hu, X.; Zhang, W.; Zhang, S.; Hao, Y.; Cong, J. The Impacts of the Global Energy Transition on China’s Energy Security in the Long-Term: Heterogeneous Evidence from the Supply and Consumption Sides. Renew. Energy 2025, 255, 123784. [Google Scholar] [CrossRef] [Scilit]
  2. Hu, W.; Wei, Y.; Bao, J. Development of the Theory and Technology for Low Permeability Reservoirs in China. Pet. Explor. Dev. 2018, 45, 685–697. [Google Scholar] [CrossRef] [Scilit]
  3. Zhang, H.; Guo, L.; Wu, Z.; Ma, J. Pore-Throat Structure, Fractal Characteristics and Permeability Prediction of Tight Sandstone: The Yanchang Formation, Southeast Ordos Basin. Sci. Rep. 2024, 14, 27913. [Google Scholar] [CrossRef] [Scilit] [PubMed]
  4. Tong, Q.; He, D.; Xia, Z.; Huang, J.; Di, K.; Xu, F.; Guo, S. Influence of Reservoir Pore-Throat Structure Heterogeneity on Water-Flooding Seepage: A Case Study of Yanchang Formation in Ordos Basin. Minerals 2022, 12, 1243. [Google Scholar] [CrossRef] [Scilit]
  5. Zhang, Z.; Bai, M.; Yang, E.; Zhu, G.; Bai, J. Enhanced Oil Recovery of Low-Permeable, Tight, and Shale Reservoirs by CO2 Injection: A Minireview. Energy Fuels 2025, 39, 13134–13150. [Google Scholar] [CrossRef] [Scilit]
  6. Shen, H.; Yang, Z.; Li, X.; Peng, Y.; Lin, M.; Zhang, J.; Dong, Z. CO2-Responsive Agent for Restraining Gas Channeling during CO2 Flooding in Low Permeability Reservoirs. Fuel 2021, 292, 120306. [Google Scholar] [CrossRef] [Scilit]
  7. Wang, J.; Liu, H.; Ning, Z.; Zhang, H. Experimental Research and Quantitative Characterization of Nitrogen Foam Blocking Characteristics. Energy Fuels 2012, 26, 5152–5163. [Google Scholar] [CrossRef] [Scilit]
  8. Zhang, Y.; Wang, Y.; Xue, F.; Wang, Y.; Ren, B.; Zhang, L.; Ren, S. CO2 Foam Flooding for Improved Oil Recovery: Reservoir Simulation Models and Influencing Factors. J. Pet. Sci. Eng. 2015, 133, 838–850. [Google Scholar] [CrossRef] [Scilit]
  9. Han, L.; Gu, Y. Optimization of Miscible CO2 Water-Alternating-Gas Injection in the Bakken Formation. Energy Fuels 2014, 28, 6811–6819. [Google Scholar] [CrossRef] [Scilit]
  10. Riazi, M.; Jamiolahmady, M.; Sohrabi, M. Theoretical Investigation of Pore-Scale Mechanisms of Carbonated Water Injection. J. Pet. Sci. Eng. 2011, 75, 312–326. [Google Scholar] [CrossRef] [Scilit]
  11. Fani, M.; Strand, S.; Puntervold, T.; Mamonov, A.; Torrijos, I.D.P.; Khan, M.A.I. Geochemical Effects of Carbonated Water on Reservoir and Caprock Minerals for Carbon Capture and Storage. Gas Sci. Eng. 2024, 124, 205246. [Google Scholar] [CrossRef] [Scilit]
  12. Isfehani, Z.D.; Fahimpour, J.; Sharifi, M.; Khalili, H.; Tayebi, M.S. Wettability Alteration and IFT Reduction during Carbonated Water Injection; a Critical Investigation into the Role of pH. J. Pet. Explor. Prod. Technol. 2024, 14, 3295–3310. [Google Scholar] [CrossRef] [Scilit]
  13. Abbaszadeh, M.; Nasiri, M.; Riazi, M. Experimental Investigation of the Impact of Rock Dissolution on Carbonate Rock Properties in the Presence of Carbonated Water. Environ. Earth Sci. 2016, 75, 791. [Google Scholar] [CrossRef] [Scilit]
  14. Fang, H.; Yue, X.; Wang, L.; Liu, S.; Zhang, H.; Feng, F.; Gao, X.; Wang, Z.; Wei, S.; Lu, X.; et al. Molecular Dynamics Simulation of the Effect of Shale Wettability on CO2 Enhanced Oil Recovery. Langmuir 2024, 40, 27645–27658. [Google Scholar] [CrossRef] [Scilit] [PubMed]
  15. Tian, H.; Wang, X.; Wang, X.; Meng, M.; Kong, X.; Zhang, S. Wettability of Shale/Oil/Brine and Shale/Oil/CO2-Enriched Brine Systems: Insights for CO2 Huff-and-Puff Enhanced Shale Oil Recovery and Geological Storage. Adv. Colloid Interface Sci. 2026, 348, 103730. [Google Scholar] [CrossRef] [Scilit] [PubMed]
  16. Elkhatib, O.; Tetteh, J.; Ali, R.; Mohamed, A.I.A.; Bai, S.; Kubelka, J.; Piri, M.; Goual, L. Wettability of Rock Minerals and the Underlying Surface Forces: A Review of the Implications for Oil Recovery and Geological Storage of CO2. Adv. Colloid Interface Sci. 2024, 333, 103283. [Google Scholar] [CrossRef] [Scilit] [PubMed]
  17. He, Y.; Liu, Y.; Li, J.; Fan, P.; Liu, X.; Chai, R.; Xue, L. Experimental Study on the Effect of CO2 Dynamic Sequestration on Sandstone Pore Structure and Physical Properties. Fuel 2024, 375, 132622. [Google Scholar] [CrossRef] [Scilit]
  18. Zhao, Y.; Wang, Y.; Wen, S.; Zhang, L.; Cao, Z.; Zhao, Z.; Xiong, W.; Cao, C.; Tang, R.; Fan, Y.; et al. In-Situ Experiments of Dynamic Microscopic Reaction for CO2-Brine-Carbonate System. Chem. Eng. J. 2025, 506, 160251. [Google Scholar] [CrossRef] [Scilit]
  19. Elyaderani, S.M.G.; Dehaghani, A.H.S.; Nasab, F.M. Effects of Acidic Low-Salinity Brines on Micro-Dispersion Formation, Wettability Alteration, and Polar Oil Component Dissociation in Carbonate Reservoirs. J. Mol. Liq. 2025, 424, 127022. [Google Scholar] [CrossRef] [Scilit]
  20. Yang, C.; Yang, E. Mineral Composition and Pore Structure on Spontaneous Imbibition in Tight Sandstone Reservoirs. Sci. Rep. 2025, 15, 7504. [Google Scholar] [CrossRef] [Scilit] [PubMed]
  21. Warr, L.N. IMA–CNMNC Approved Mineral Symbols. Mineral. Mag. 2021, 85, 291–320. [Google Scholar] [CrossRef] [Scilit]
  22. Liu, J.; Li, H.; Liu, S.; Xu, J.; Wang, X.; Tan, Q. Investigating the Impact of Aqueous Phase on CO2 Huff ‘n’ Puff in Tight Oil Reservoirs Using Nuclear Magnetic Resonance Technology: Stimulation Measures and Mechanisms. SPE J. 2023, 28, 3324–3340. [Google Scholar] [CrossRef] [Scilit]
  23. Noruzi, Y.; Sharifi, M.; Fahimpour, J.; Sabet, M.; Akbari, M.; Hosseini, S. The State-of-the-Art of Wettability Alteration in Sandstones and Carbonates: A Mechanistic Review. Fuel 2024, 356, 129570. [Google Scholar] [CrossRef] [Scilit]
  24. Esene, C.; Rezaei, N.; Aborig, A.; Zendehboudi, S. Comprehensive Review of Carbonated Water Injection for Enhanced Oil Recovery. Fuel 2019, 237, 1086–1107. [Google Scholar] [CrossRef] [Scilit]
  25. Su, S.; Jiang, Z.; Shan, X.; Zhu, Y.; Wang, P.; Luo, X.; Li, Z.; Zhu, R.; Wang, X. The Wettability of Shale by NMR Measurements and Its Controlling Factors. J. Pet. Sci. Eng. 2018, 169, 309–316. [Google Scholar] [CrossRef] [Scilit]
  26. Yang, K.; Zhou, J.; Xian, X.; Zhou, L.; Zhang, C.; Lu, Z.; Yin, H. Changes of Wettability of Shale Exposed to Supercritical CO2-Water and Its Alteration Mechanism: Implication for CO2 Geo-Sequestration. Fuel 2024, 357, 129942. [Google Scholar] [CrossRef] [Scilit]
  27. Cheng, Z.; Luo, K.; Tong, S.; Zhang, S.; Li, G.; Gao, H. Unraveling the Mechanisms of High-Concentration MnCl2 on Imbibition Behavior in Tight Oil Reservoirs. Colloids Surf. Physicochem. Eng. Asp. 2026, 738, 139967. [Google Scholar] [CrossRef] [Scilit]
  28. Cheng, Z.; Tong, S.; Zhang, S.; Jia, Z.; Lyu, F.; Zhang, W.; Gao, H. Effects of High Concentration of Mn2+ on Wettability of Tight Sandstones: Experimental and Molecular Insights. SPE J. 2025, 30, 7690–7702. [Google Scholar] [CrossRef] [Scilit]
  29. Zhong, J.; Yan, R.; Zhang, H.; Feng, Y.; Li, N.; Liu, X. A Decomposition Method of Nuclear Magnetic Resonance T2 Spectrum for Identifying Fluid Properties. Pet. Explor. Dev. 2020, 47, 740–752. [Google Scholar] [CrossRef] [Scilit]
  30. Ge, X.; Myers, M.T.; Liu, J.; Fan, Y.; Zahid, M.A.; Zhao, J.; Hathon, L. Determining the Transverse Surface Relaxivity of Reservoir Rocks: A Critical Review and Perspective. Mar. Pet. Geol. 2021, 126, 104934. [Google Scholar] [CrossRef] [Scilit]
  31. Zhang, T.; Tang, M.; Ma, Y.; Zhu, G.; Zhang, Q.; Wu, J.; Xie, Z. Experimental Study on CO2/Water Flooding Mechanism and Oil Recovery in Ultralow—Permeability Sandstone with Online LF-NMR. Energy 2022, 252, 123948. [Google Scholar] [CrossRef] [Scilit]
  32. Yu, C.; Wang, M.; Chen, J.; Li, J.; Tang, Y.; Wu, Y.; Jia, Y.; Li, T. Quantitative Assessment of Pore-Scale Wettability: An Approach Combining Alternating Oil/Water Spontaneous Imbibition and NMR. Eng. Geol. 2025, 358, 108434. [Google Scholar] [CrossRef] [Scilit]
  33. Sun, X.; Yao, Y.; Liu, D.; Zhou, Y. Investigations of CO2-Water Wettability of Coal: NMR Relaxation Method. Int. J. Coal Geol. 2018, 188, 38–50. [Google Scholar] [CrossRef] [Scilit]
  34. Wang, J.; Xiao, L.; Liao, G.; Zhang, Y.; Guo, L.; Arns, C.H.; Sun, Z. Theoretical Investigation of Heterogeneous Wettability in Porous Media Using NMR. Sci. Rep. 2018, 8, 13450. [Google Scholar] [CrossRef] [Scilit] [PubMed]
  35. Newgord, C.; Tandon, S.; Heidari, Z. Simultaneous Assessment of Wettability and Water Saturation Using 2D NMR Measurements. Fuel 2020, 270, 117431. [Google Scholar] [CrossRef] [Scilit]
  36. Lyu, C.; Ning, Z.; Wang, Q.; Chen, M. Application of NMR T2 to Pore Size Distribution and Movable Fluid Distribution in Tight Sandstones. Energy Fuels 2018, 32, 1395–1405. [Google Scholar] [CrossRef] [Scilit]
  37. Wang, W.; Li, X.; Wei, Z.; Xin, Y.; Xiao, R.; Yang, H.; Chen, X. Effect of CO2–Brine–Rock Interactions on the Pore Structure of the Tight Sandstone during CO2 Flooding: A Case Study of Chang 7 Member of the Triassic Yanchang Formation in the Ordos Basin, China. ACS Omega 2023, 8, 3998–4009. [Google Scholar] [CrossRef] [Scilit] [PubMed]
  38. Wang, X.; Zeng, J.; Liu, B.; Zhao, W.; Shi, K.; Jia, K. Insights into the Wetting Mechanisms in Low-Permeability Sandstone Reservoirs and Its Evolution Processes: The Shahejie Formation in the Dongying Depression, Bohai Bay Basin. Mar. Pet. Geol. 2025, 171, 107179. [Google Scholar] [CrossRef] [Scilit]
  39. Al-Anssari, S.; Arif, M.; Wang, S.; Barifcani, A.; Lebedev, M.; Iglauer, S. Wettability of Nanofluid-Modified Oil-Wet Calcite at Reservoir Conditions. Fuel 2018, 211, 405–414. [Google Scholar] [CrossRef] [Scilit]
  40. Yuan, G.; Cao, Y.; Schulz, H.-M.; Hao, F.; Gluyas, J.; Liu, K.; Yang, T.; Wang, Y.; Xi, K.; Li, F. A Review of Feldspar Alteration and Its Geological Significance in Sedimentary Basins: From Shallow Aquifers to Deep Hydrocarbon Reservoirs. Earth-Sci. Rev. 2019, 191, 114–140. [Google Scholar] [CrossRef] [Scilit]
  41. Chen, K.; Liu, X.; Nie, B.; Zhang, C.; Song, D.; Wang, L.; Yang, T. Mineral Dissolution and Pore Alteration of Coal Induced by Interactions with Supercritical CO2. Energy 2022, 248, 123627. [Google Scholar] [CrossRef] [Scilit]
  42. Gao, H.; Luo, K.-Q.; Wang, C.; Li, T.; Cheng, Z.-L.; Dou, L.-B.; Zhao, K.; Zhang, N.; Liu, Y.-L. Impact of Dissolution and Precipitation on Pore Structure in CO2 Sequestration within Tight Sandstone Reservoirs. Pet. Sci. 2025, 22, 868–883. [Google Scholar] [CrossRef] [Scilit]
  43. Manshad, A.K.; Nowrouzi, I.; Mohammadi, A.H. Effects of Water Soluble Ions on Wettability Alteration and Contact Angle in Smart and Carbonated Smart Water Injection Process in Oil Reservoirs. J. Mol. Liq. 2017, 244, 440–452. [Google Scholar] [CrossRef] [Scilit]
  44. Liu, G.; Wang, H.; Tang, J.; Liu, Z.; Yang, D. Effect of Wettability on Oil and Water Distribution and Production Performance in a Tight Sandstone Reservoir. Fuel 2023, 341, 127680. [Google Scholar] [CrossRef] [Scilit]
  45. Cai, J.-C.; Chen, Y.; Qiao, J.-C.; Yang, L.; Zeng, J.-H.; Sun, C.-H. Determination of Dynamic Capillary Effect on Two-Phase Flow in Porous Media: A Perspective from Various Methods. Pet. Sci. 2022, 19, 1641–1652. [Google Scholar] [CrossRef] [Scilit]
  46. Zhao, Y.; Zhang, Y.; Lei, X.; Zhang, Y.; Song, Y. CO2 Flooding Enhanced Oil Recovery Evaluated Using Magnetic Resonance Imaging Technique. Energy 2020, 203, 117878. [Google Scholar] [CrossRef] [Scilit]
  47. Dang, F.; Li, S.; Dong, H.; Wang, Z.; Zhu, J. Experimental Study on the Oil Recovery Characteristics of CO2 Energetic Fracturing in Ultralow-Permeability Sandstone Reservoirs Utilizing Nuclear Magnetic Resonance. Fuel 2024, 366, 131370. [Google Scholar] [CrossRef] [Scilit]
  48. Burrows, L.C.; Haeri, F.; Tapriyal, D.; Sanguinito, S.; Shah, P.G.; Lemaire, P.; Crandall, D.; Enick, R.M.; Goodman, A. Dissolving Nonionic Surfactants in CO2 to Improve Oil Recovery in Unconventional Reservoirs via Wettability Alteration. Energy Fuels 2022, 36, 11913–11929. [Google Scholar] [CrossRef] [Scilit]
  49. Hou, Y.; Jia, Y.; Ge, Z.; Zhou, Z.; Zhang, D.; Fu, W.; Zhang, X.; Lu, Y. Mineralogical Control on the Dissolution Induced Microscopic Pore Alternations of High-Rank Coal during CO2 Sequestration. Geoenergy Sci. Eng. 2024, 234, 212614. [Google Scholar] [CrossRef] [Scilit]
  50. Zhang, Y.; Feng, Q.; Wang, S. Reaction Mechanisms and Evolution of Pore Structure and Wettability in the CO2-Shale System: A Systematic Review. Earth-Sci. Rev. 2025, 271, 105262. [Google Scholar] [CrossRef] [Scilit]
  51. Jamshidi, T.; Zeng, F.; Tontiwachwuthikul, P.; Torabi, F. Viability of Carbonated Water Injection (CWI) as a Means of Secondary Oil Recovery in Heavy Oil Systems in Presence and Absence of Wormholes: Microfluidic Experiments. Fuel 2019, 249, 286–293. [Google Scholar] [CrossRef] [Scilit]
  52. Mahzari, P.; Tsolis, P.; Sohrabi, M.; Enezi, S.; Yousef, A.A.; Eidan, A.A. Carbonated Water Injection under Reservoir Conditions; in-Situ WAG-Type EOR. Fuel 2018, 217, 285–296. [Google Scholar] [CrossRef] [Scilit]
  53. Akindipe, D.; Saraji, S.; Piri, M. Pore Matrix Dissolution in Carbonates: An in-Situ Experimental Investigation of Carbonated Water Injection. Appl. Geochem. 2022, 147, 105483. [Google Scholar] [CrossRef] [Scilit]
  54. Jia, B. Carbonated Water Injection (CWI) for Improved Oil Recovery and Carbon Storage in High-Salinity Carbonate Reservoir. J. Taiwan Inst. Chem. Eng. 2019, 104, 82–93. [Google Scholar] [CrossRef] [Scilit]
  55. Cheng, Q.; Tang, J.; Liu, Y.; Jia, Y.; Lu, Y.; Sun, X.; Zhao, G.; Liu, Y. Pore Alteration of Yanchang Shale after CO2-Brine-Rock Interaction: Influence on the Integrity of Caprock in CO2 Geological Sequestration. Fuel 2024, 363, 130952. [Google Scholar] [CrossRef] [Scilit]
  56. Nowrouzi, I.; Manshad, A.K.; Mohammadi, A.H. Evaluation of Interfacial Tension (IFT), Oil Swelling and Oil Production under Imbibition of Carbonated Water in Carbonate Oil Reservoirs. J. Mol. Liq. 2020, 312, 113455. [Google Scholar] [CrossRef] [Scilit]
Figure 1. Online NMR experiment apparatus.
Atmosphere 17 00673 g001
Figure 2. Relationship between NMR signal and oil volume.
Atmosphere 17 00673 g002
Figure 3. NMR T2 relaxation spectra for wettability-related water redistribution in cores subjected to different carbonated water exposure durations: (a) untreated sample; (b) 5 days; (c) 10 days; and (d) 15 days.
Atmosphere 17 00673 g003
Figure 4. Changes in mineral composition before and after carbonated water reaction.
Atmosphere 17 00673 g004
Figure 5. NMR-derived Sw under different carbonated water exposure durations.
Atmosphere 17 00673 g005
Figure 6. Online NMR T2 spectra showing oil-bearing pore-size-domain distribution at different injected pore volumes during CO2 flooding: (a) untreated sample; (b) 5 days; (c) 10 days; and (d) 15 days.
Atmosphere 17 00673 g006
Figure 7. Residual oil volume in the measurable T2-defined pore-size domains and oil recovery during CO2 flooding: (a) untreated sample; (b) 5 days; (c) 10 days; (d) 15 days; and (e) oil recovery.
Atmosphere 17 00673 g007
Figure 8. Color MRI maps of normalized oil signal intensity during CO2 flooding after different carbonated water treatment durations.
Atmosphere 17 00673 g008
Figure 9. Conceptual mechanism of carbonated water-induced mineral alteration, apparent wettability-related water redistribution, and pore domain-dependent oil mobilization during subsequent CO2 flooding.
Atmosphere 17 00673 g009
Table 1. Basic physical properties and treatment conditions of core samples.
No.Lengths/cmDiameter/cmPorosity
/%
Permeability/mDCarbonated Water
Exposure Duration/Days
Flooding Fluid During Online NMR Displacement
W14.9622.48210.330.4190CO2
W24.8642.48010.480.4525CO2
W34.8242.49410.600.43410CO2
W44.7302.48611.030.50115CO2
Note: Carbonated water exposure duration denotes the pretreatment time of each core plug in carbonated water before subsequent CO2 flooding. The flooding fluid during online NMR displacement was CO2 for all cores.
Disclaimer/Publisher’s Note: The statements, opinions and data contained in all publications are solely those of the individual author(s) and contributor(s) and not of MDPI and/or the editor(s). MDPI and/or the editor(s) disclaim responsibility for any injury to people or property resulting from any ideas, methods, instructions or products referred to in the content.