Article

Effects of Air Pollution Exposure on Hospital Admissions: A Time Series Study in Sivas, Türkiye

1
Climate and Marine Sciences, Eurasia Institute of Earth Sciences, Istanbul Technical University, 34469 İstanbul, Türkiye
2
Sivas Directorate, Republic of Türkiye Ministry of Environment, Urbanization and Climate Change, 58080 Sivas, Türkiye
3
Department of Civil Engineering, Faculty of Engineering and Architecture, Central Campus, Kafkas University, 36100 Kars, Türkiye
4
Vocational College of Technical Sciences, Kirklareli University, 39100 Kırklareli, Türkiye
5
Department of Emergency Aid and Disaster Management, Hamidiye Faculty of Health Sciences, University of Health Sciences, 34668 İstanbul, Türkiye
6
Department of Climate Science and Meteorological Engineering, Faculty of Aeronautics and Astronautics, Istanbul Technical University, 34469 İstanbul, Türkiye
*
Author to whom correspondence should be addressed.
Atmosphere 2026, 17(6), 611; https://doi.org/10.3390/atmos17060611
Submission received: 27 April 2026 / Revised: 11 June 2026 / Accepted: 12 June 2026 / Published: 16 June 2026
(This article belongs to the Section Air Quality and Health)

Abstract

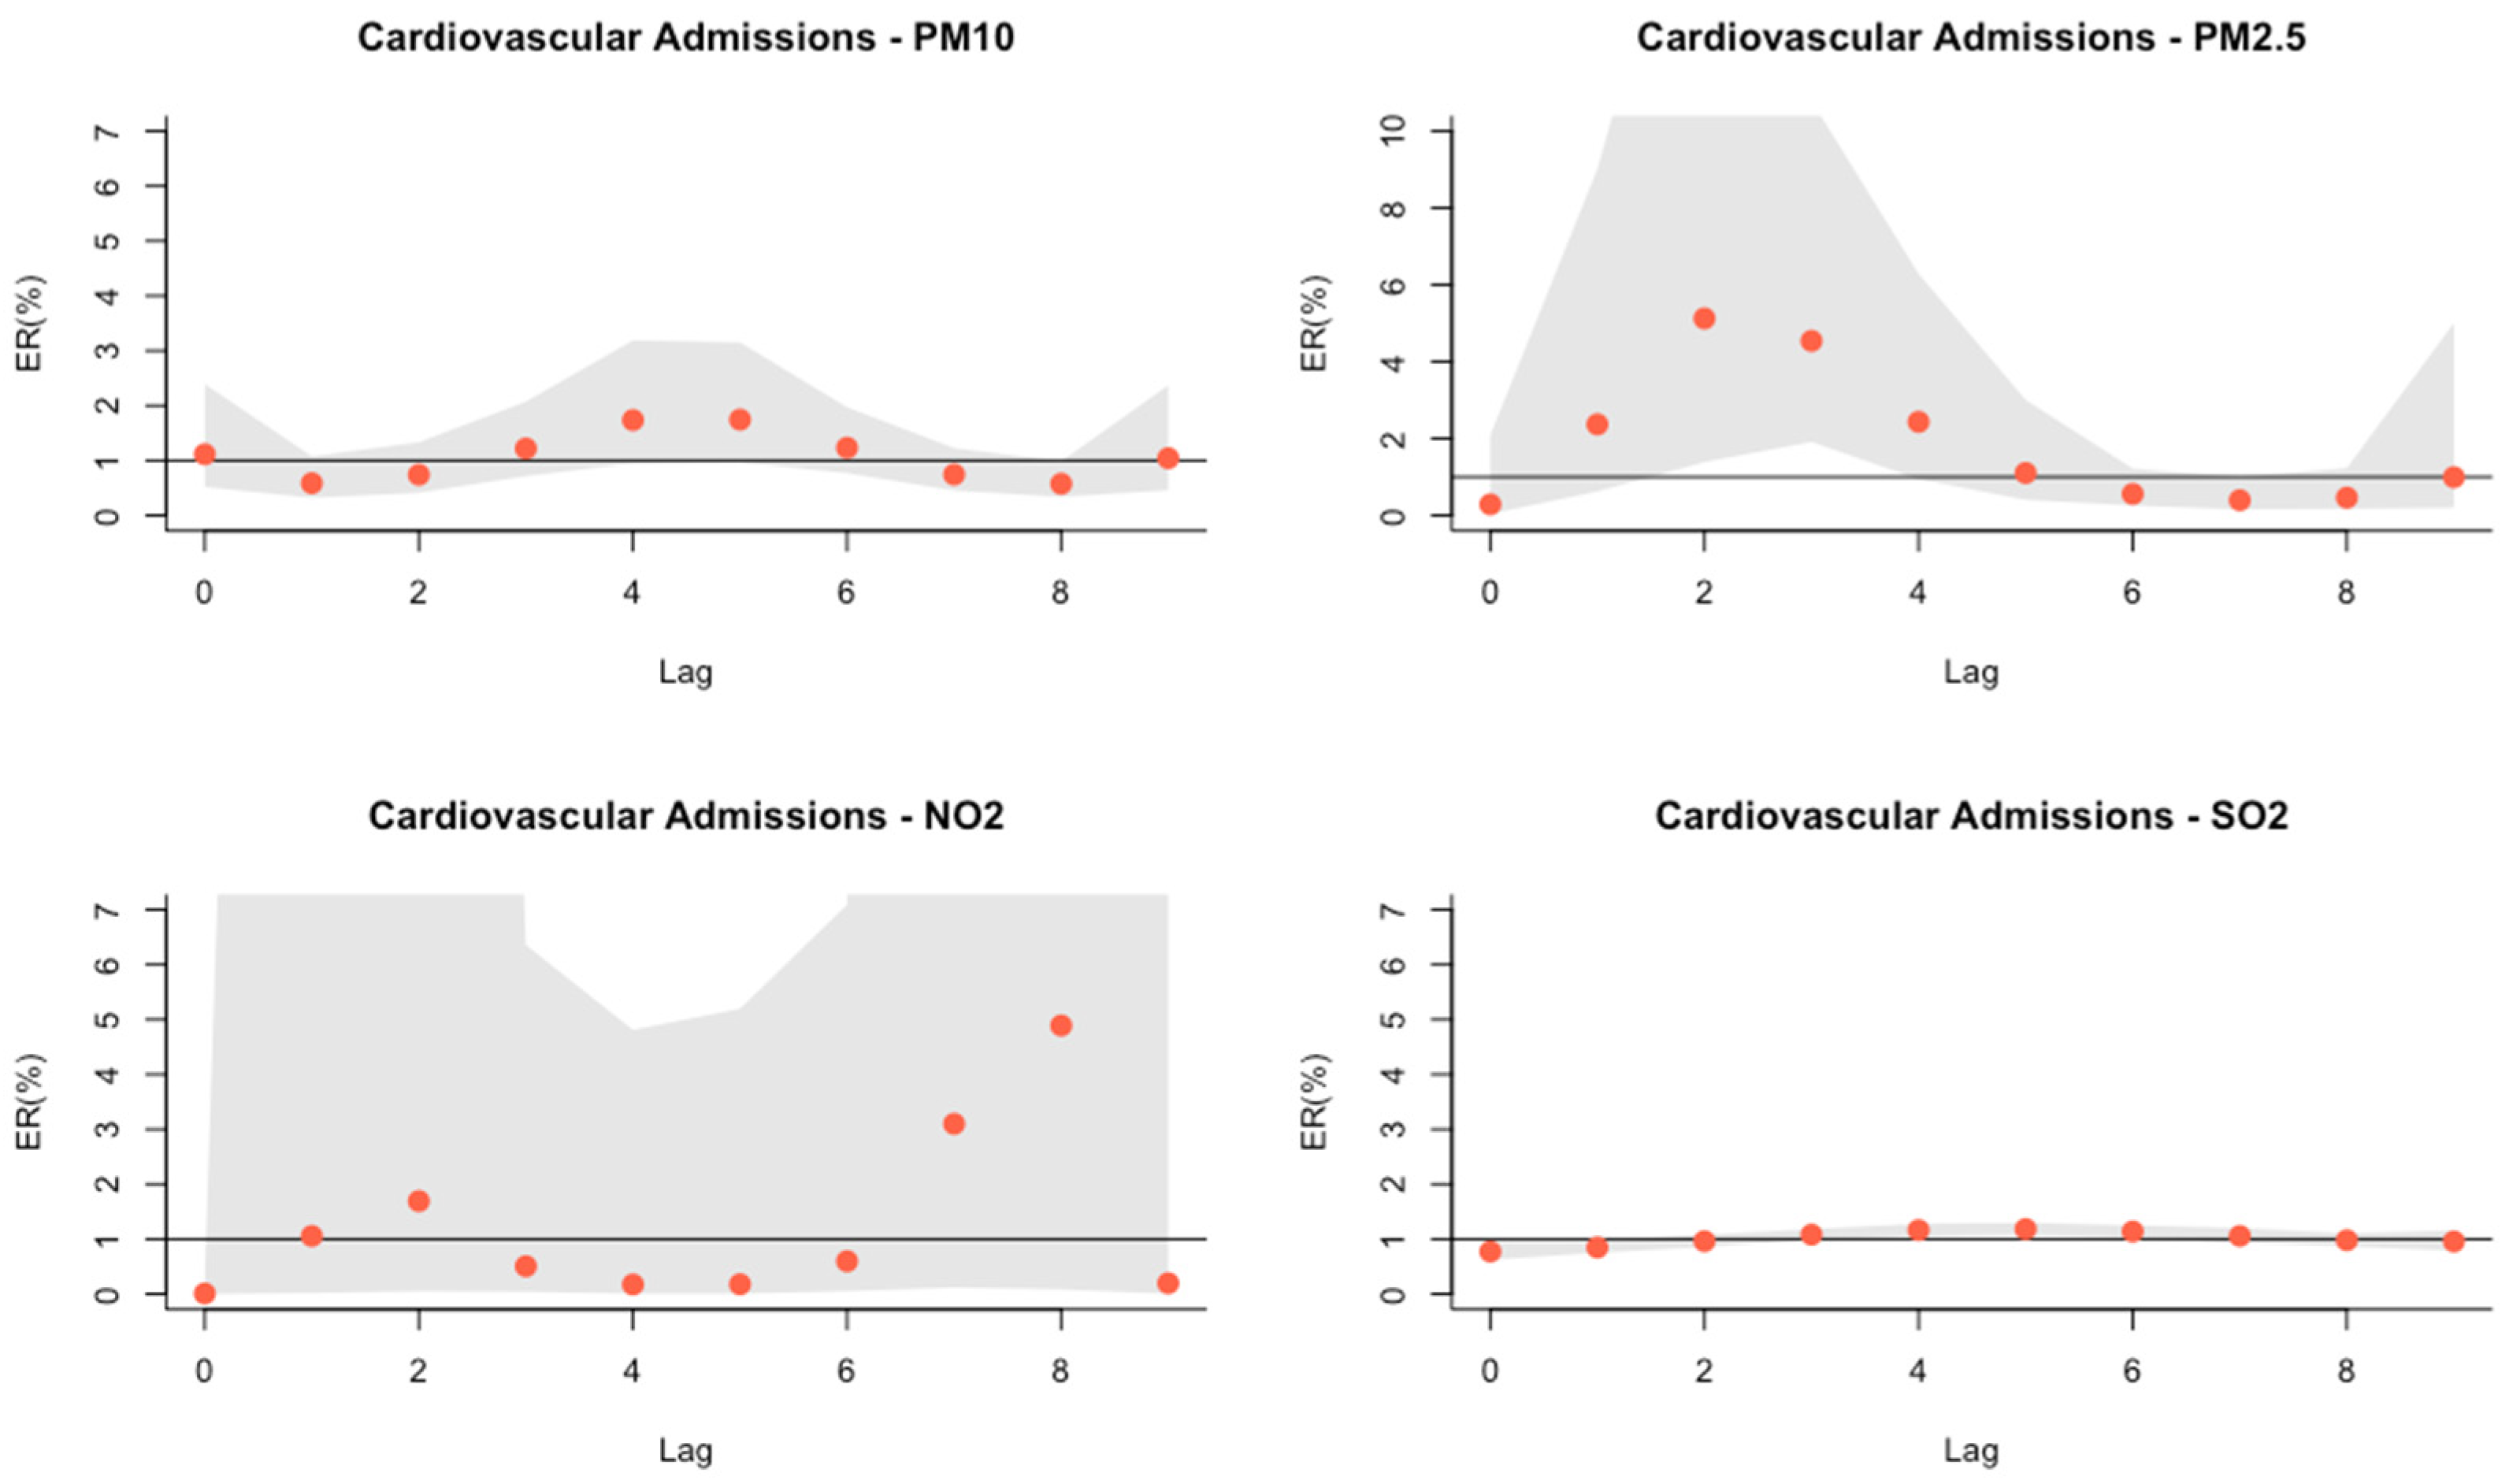
The impact of air pollution on human health has been widely studied in recent decades. Recent findings show that even low levels of air pollution can be harmful to our health, causing disease and early death. However, these studies are very limited in the central region of Türkiye. Therefore, this study focused on the association between the daily variations in air pollutants (PM10, PM2.5, SO2, and NO2) and hospital admissions due to respiratory, cardiovascular, and total (non-accidental) causes in the Sivas province. Daily average concentrations of air pollutants were obtained from two air quality (AQ) monitoring stations, and daily meteorological (air temperature and relative humidity) data were obtained from one meteorological station in Sivas province to determine the effects of air pollution on hospital admissions. It was found to be a significant relationship between air pollution and respiratory hospital admissions in the province. The results of the study showed the relative magnitudes of the risks of cardiovascular diseases and hospital admissions related to air pollutants were as follows: The highest association of each pollutant with cardiovascular diseases was observed for PM10 at lag 4 (ER = 1.74%; 95% CI = 0.95–3.19%), PM2.5 at lag 2 (ER = 5.12%; 95% CI = 1.39–19.0%), NO2 at lag 8 (ER = 4.89%; 95% CI = 0.08–288.8%) and SO2 at lag 5 (ER = 1.21%; 95% CI = 1.10–1.32%). It was seen that short-term exposure to air pollution in Sivas between 2016 and 2019 was positively associated with increasing respiratory hospital admissions. As the first air pollution study to use the generalized linear model (GLM) method in hospital admissions in Sivas, these findings may have implications for local environmental policies and help to combat air pollution.

1. Introduction

Air pollution is defined as the presence of physical, chemical, or biological agents in the atmosphere that degrade its natural composition and adversely affect environmental and human health [1,2]. Although it is an inevitable byproduct of modern urban life, air pollution can induce both regional and global environmental changes if its sources remain unaddressed. These transboundary challenges pose significant threats to the future sustainability of the planet [3]. Urban warming, traffic congestion, rapid population growth in cities, declining urban green spaces, and increasing vehicular emissions are all inversely correlated with air quality (AQ) and are major contributors to atmospheric pollution [4,5].
Urban areas are influenced by both natural and anthropogenic sources of pollution [6,7,8]. Air pollution, a particularly pressing issue in densely populated regions, is closely linked to human health and originates from diverse and complex emission sources within intricate urban environments [9]. In response to the rapidly increasing global population, industrial facilities have increasingly been established in close proximity to urban centers to meet rising demands. Consequently, the emission of pollutants from these urban-based industrial facilities has raised serious concerns regarding their adverse effects on public health [10]. Particulate Matter (PM), in particular, is a major air pollutant that poses significant health risks in crowded urban areas due to its ability to penetrate deep into the respiratory system [11]. It is estimated that nearly 50% of the world’s population resides in urban areas, and PM is recognized as one of the most critical air pollutants impacting human health [12].
Both gaseous and particulate air pollutants are known to have detrimental effects on human health [6]. Seasonal variability influences the concentration of PM10 [13,14]. PM2.5, which poses disproportionately severe health risks even with relatively short-term exposure—such as during daily commuting—is a harmful urban pollutant predominantly emitted from vehicular traffic and biomass combustion [15]. In residential areas, vehicular emissions significantly contribute to elevated PM concentrations [16]. Exposure to air pollution has been linked to a wide range of health issues, including respiratory conditions such as asthma and lung cancer, as well as disorders of the digestive and urinary systems [17,18,19,20]. As the global population continues to rise, the resulting increase in air pollution in urbanizing and industrializing regions continues to harm both the environment and public health. In particular, vulnerable groups such as children, the elderly, and individuals with chronic illnesses are disproportionately affected by worsening air quality [21,22].
Recent epidemiological studies have continued to strengthen the evidence linking short-term air pollution exposure to adverse health outcomes. A multi-city study covering 652 cities worldwide reported significant increases in daily mortality associated with PM2.5 and PM10 exposure [23]. More recently, ref. [24], in a systematic review and meta-analysis, demonstrated significant short-term effects of PM2.5, PM10, and SO2 on cardiorespiratory morbidity. Likewise, ref. [25] reported positive associations between ambient PM10 and NO2 concentrations and respiratory healthcare utilization in South London. These findings support the growing scientific agreement that even relatively short-term exposure to air pollutants can contribute substantially to adverse health outcomes.
Numerous air pollution studies have been conducted in Türkiye, utilizing data primarily collected during the 1990s and 2000s [26,27,28,29]. Various studies conducted have consistently demonstrated the detrimental impact of air pollution on urban public health [21,29]. A substantial portion of air quality (AQ) research has focused on Istanbul—the most populous city in Türkiye—while relatively fewer studies have addressed other provinces [30,31,32,33,34,35]. Several health-focused studies have reported that even when air pollution levels remain below the legally defined AQ thresholds, they can still pose health risks [36,37,38]. Increases in daily mortality have been consistently associated with elevated concentrations of air pollutants, particularly PM [23]. High concentrations of air pollution are often closely linked to local meteorological conditions and the regional transport of pollutants. The relationship between respiratory health and short-term exposure to ambient air pollution has been extensively examined in many studies. Furthermore, it is commonly acknowledged that extreme weather events intrinsically exacerbate the impacts of air pollution. Especially during periods of extreme temperatures, heat waves, and hot weather, human health is adversely affected, contributing to an increase in respiratory morbidity and mortality rates [39]. Numerous studies conducted worldwide have demonstrated a strong and consistent relationship between PM concentrations and morbidity or mortality rates [40].
Growing evidence of adverse health effects at relatively low pollutant concentrations has led to major regulatory developments in recent years. In 2021, the World Health Organization (WHO) revised its Air Quality Guidelines and substantially lowered the recommended limit values for PM2.5, PM10, NO2, and SO2 [41]. More recently, the European Union adopted the revised Ambient Air Quality Directive (EU) 2024/2881, introducing stricter air quality standards and aligning future air quality targets more closely with WHO recommendations [42]. These developments reflect the increasing scientific consensus that measurable health effects may occur even at concentrations previously considered acceptable.
The Central Anatolia Region, including Sivas, is among the areas experiencing significant air pollution. Sivas Province, the second largest in both Türkiye and the Central Anatolia Region, is particularly affected due to its developmental status and expanding urbanization [43]. Assessing the air quality (AQ) in Sivas is especially important, as the province is geographically positioned near the Eastern Anatolia, Black Sea, and Mediterranean regions, making it susceptible to cross-regional pollutant transport [38]. This study aims to investigate the associations between daily ambient air pollutant concentrations and hospital admissions in Sivas Province, focusing on cardiovascular, respiratory, and total non-accidental admissions.

2. Methodology

2.1. Study Area

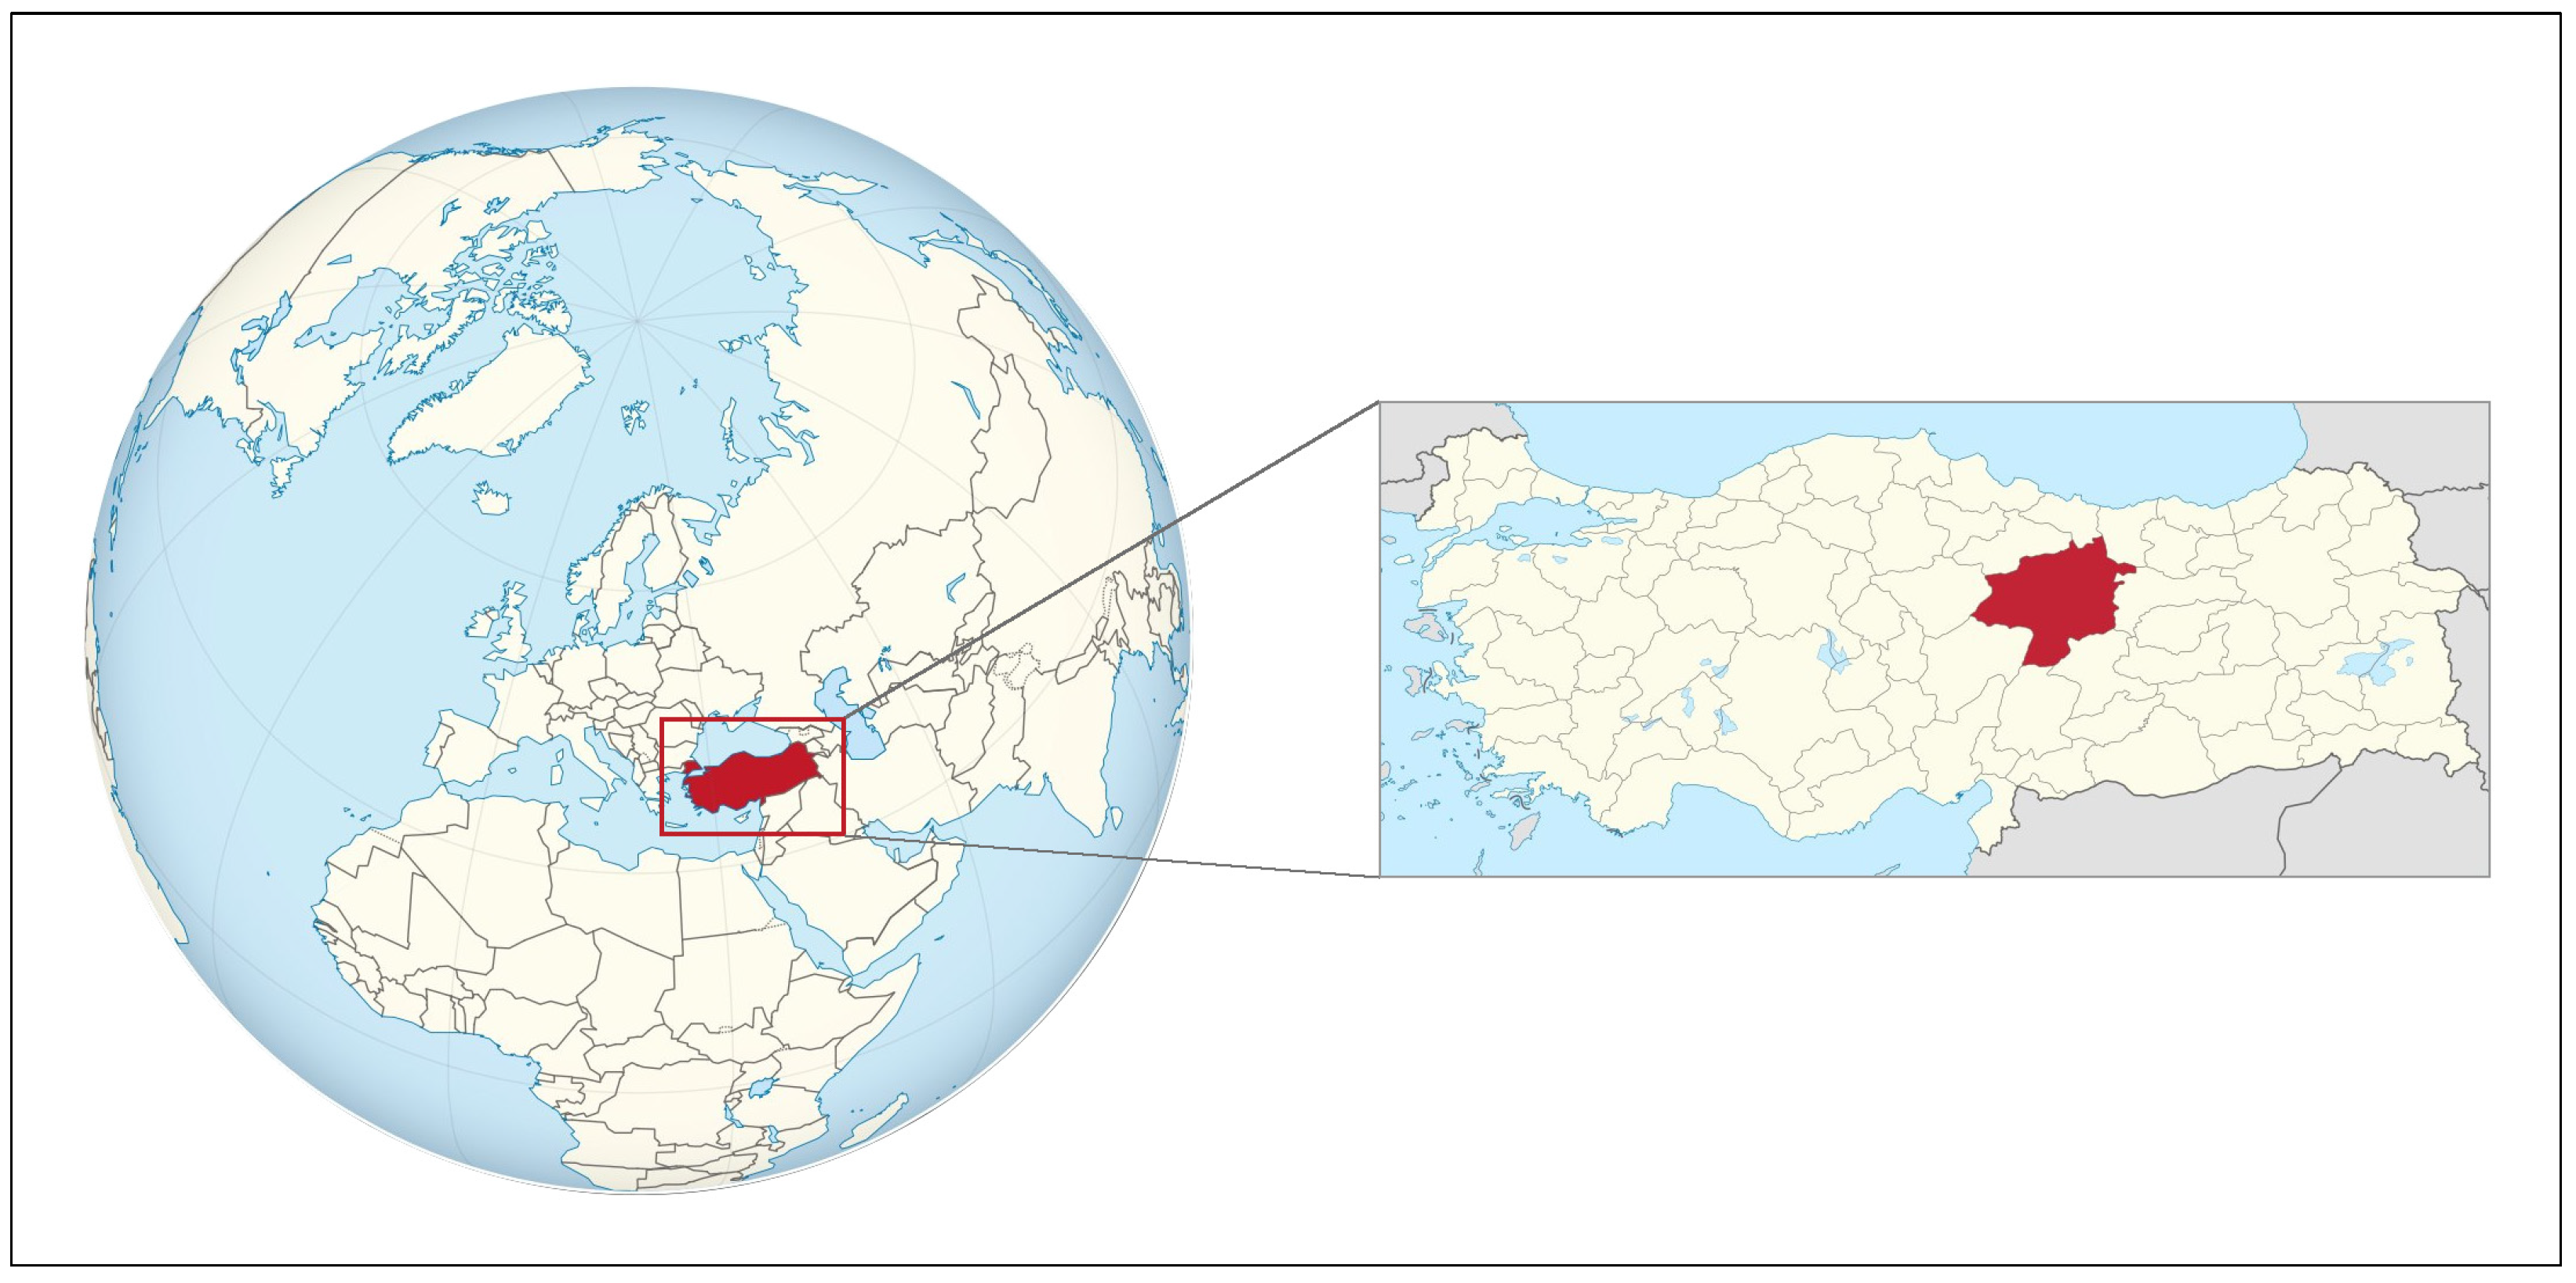
Covering an area of 28,619 km2, Sivas ranks first in Türkiye in terms of the number of villages and second in total land area (Figure 1) [43]. The province experiences a continental climate characterized by cold, harsh winters with substantial snowfall, and hot, dry summers. Spring and autumn are relatively rainy. Over the past 50 years, the lowest recorded temperature was −34.6 °C in January, while the highest was 38.3 °C in July. The wettest month was May, with an average precipitation of 60.4 mm, whereas August was the driest, receiving only 6.8 mm of rainfall [44]. According to the Address-Based Population Registration System (ABPRS), 390,318 residents (approximately 61% of the provincial population) lived in the central district (Merkez District) of Sivas in 2024 [45]. The central district of Sivas is situated at an elevation of 1285 m above sea level and is built on relatively flat terrain.
İstasyon Street is one of the major transportation corridors located in the urban center of Sivas and is characterized by intensive pedestrian and vehicular traffic due to its commercial, residential, and institutional land-use functions [46,47]. The street hosts a concentration of commercial, recreational, and governmental institutions, making it an important focal point for daily urban activities in Sivas [46]. For residents of Sivas, İstasyon Street functions as both a commercial attraction and a commonly used social meeting area. Owing to its multifunctional land-use structure and high mobility demand, the street is exposed to considerable vehicular traffic density and periodic congestion throughout the day [46,47,48]. For residents of Sivas, İstasyon Street serves as both a shopping destination and a common meeting point. Due to its multifunctional use, it experiences significant traffic congestion throughout the day. In addition to İstasyon Street, several other major streets in the city also experience heavy traffic, contributing substantially to vehicle exhaust emissions. The second major source of air pollution in the province is residential heating, particularly in densely populated urban areas, where increased fossil fuel consumption during the winter season contributes significantly to particulate matter and gaseous pollutant emissions [49].
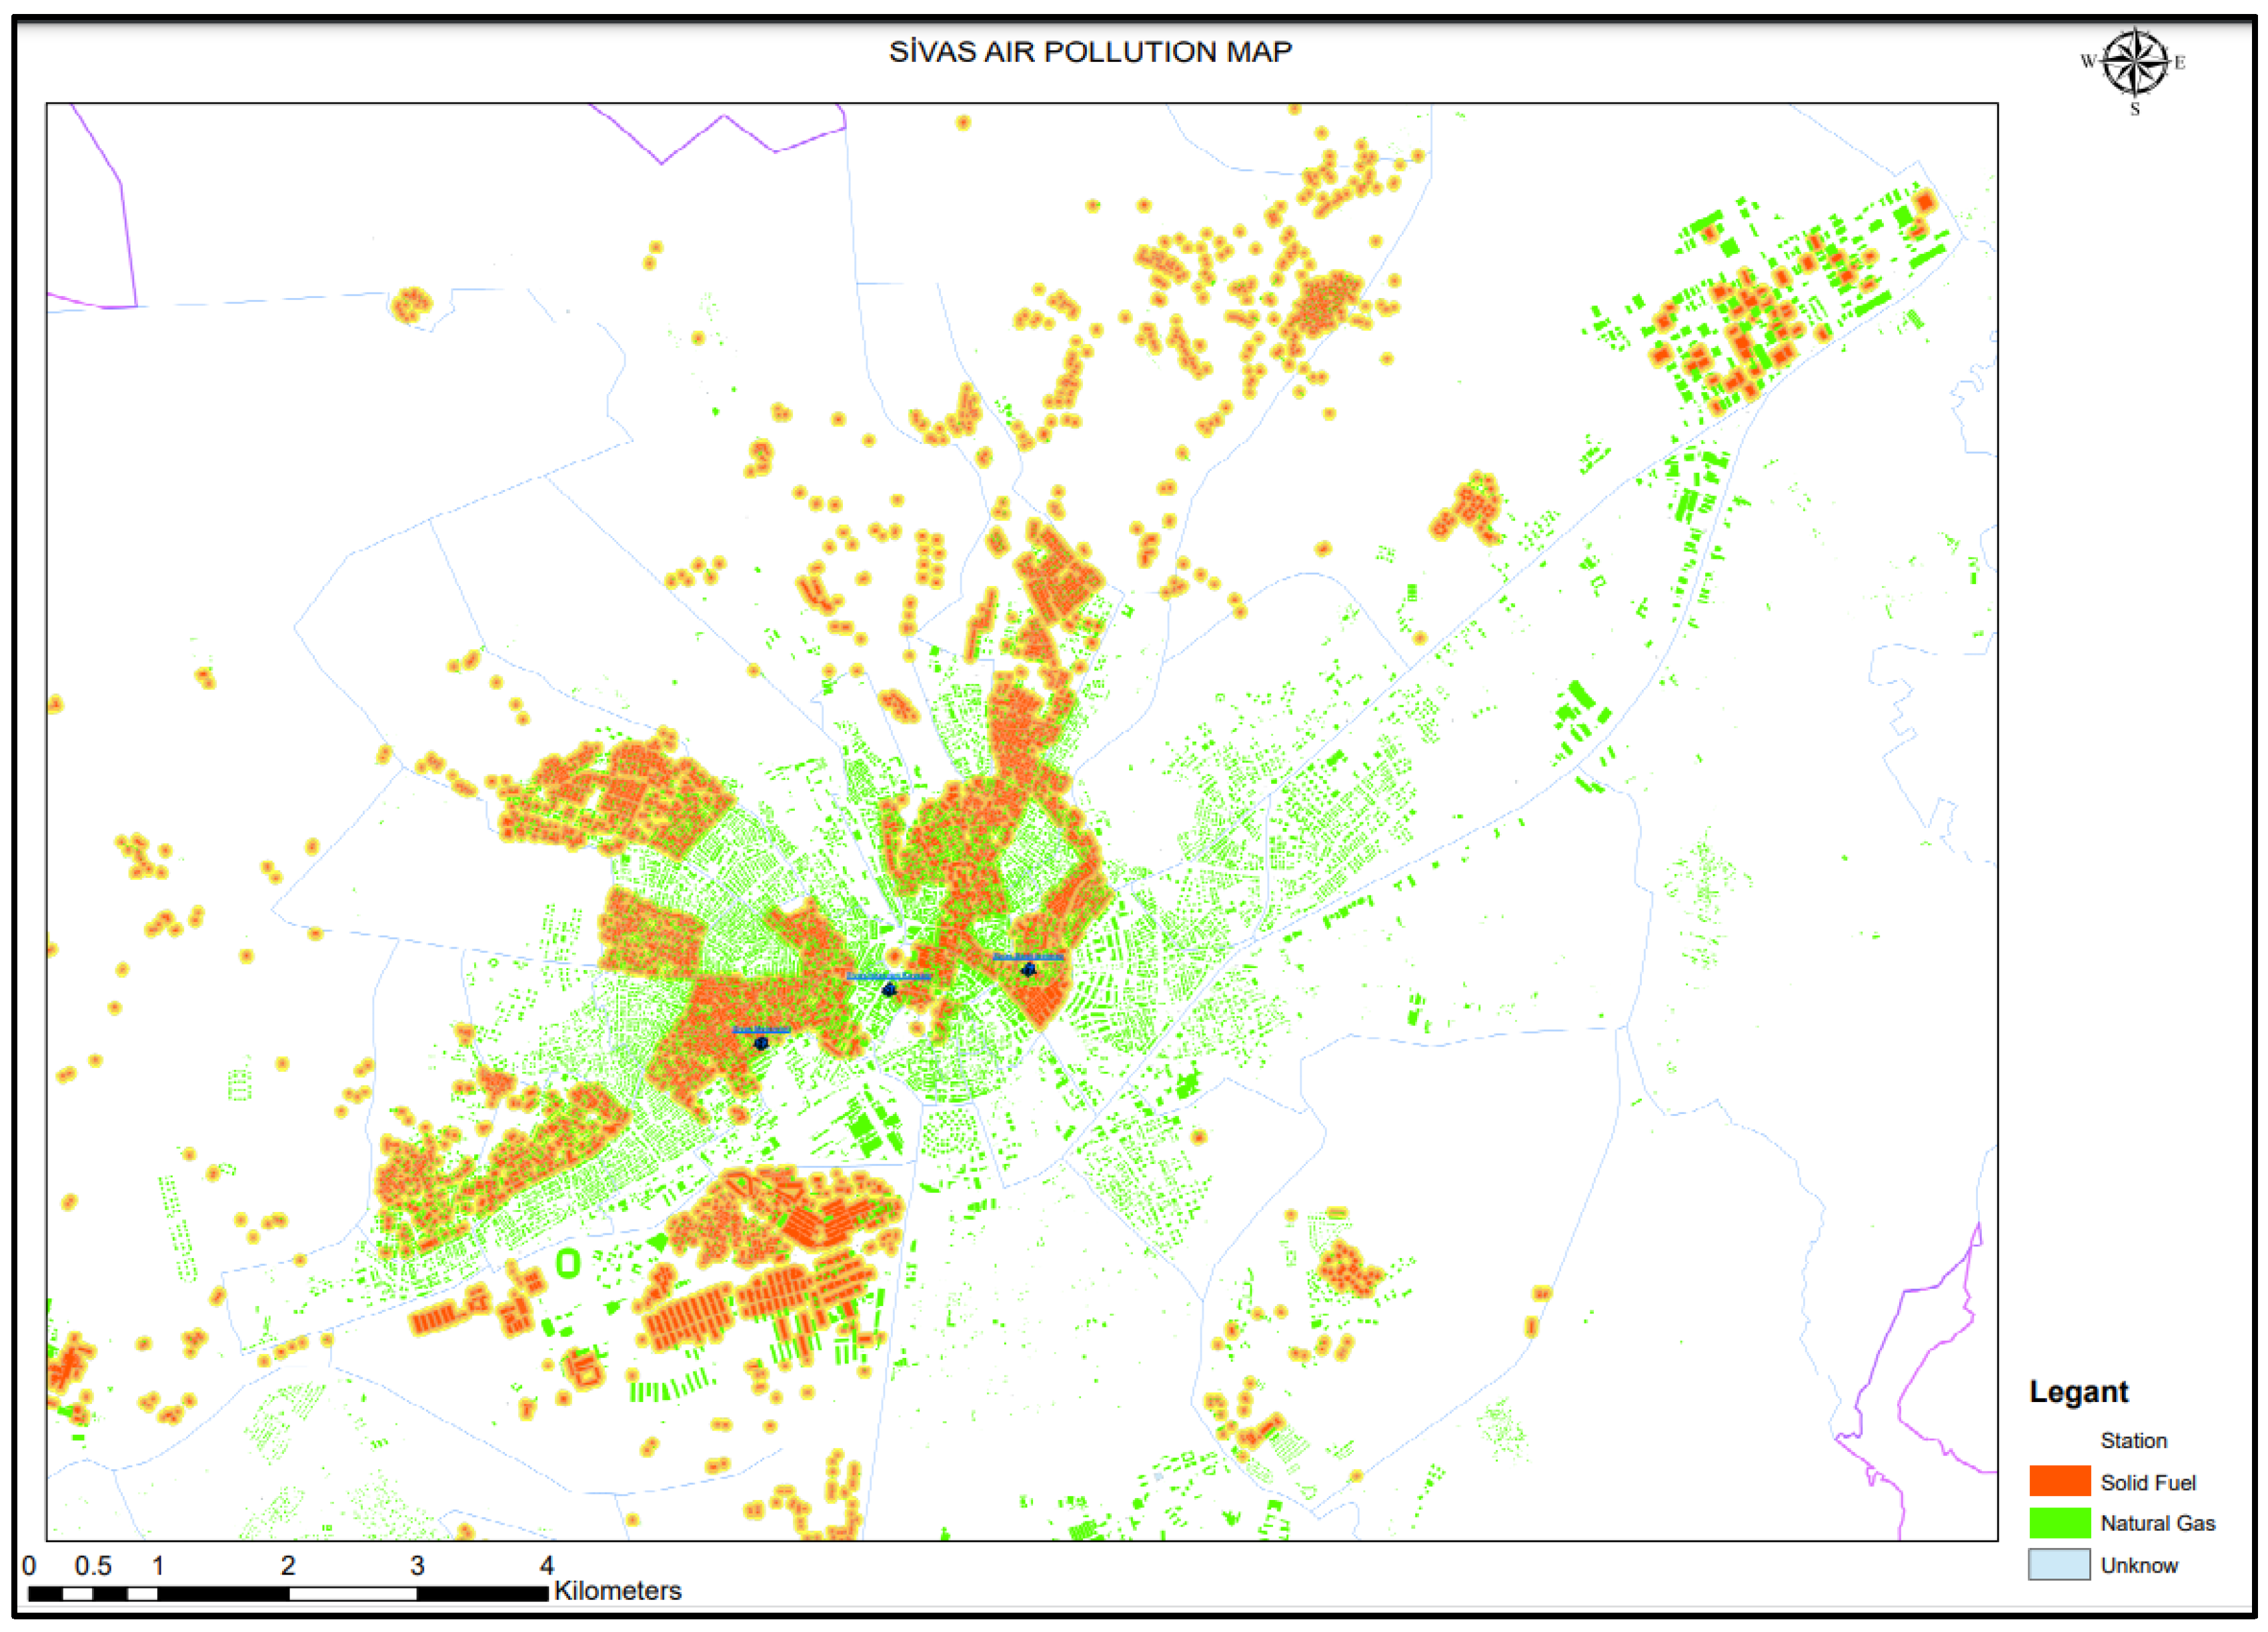
The distribution of fuel types used for heating in households within “the central district (Merkez District)” district of Sivas is presented in Figure 2.
According to data from Sivas Municipality, the number of independent housing units in the Sivas “the central district (Merkez District)” was 151,917 in 2022. Of these, 72% (108,666 units) were heated using natural gas, 27% (41,236 units) used coal, and 1% (2015 units) had undefined fuel types in municipal records [50]. In the same year, natural gas consumption in Sivas Province was reported as 129,134,260 cm3 for residential heating, 11,809,941 cm3 for industrial use, and 72,385,858 cm3 for public institutions and organizations [51]. Additionally, 82,472 tons of coal were consumed for heating purposes [44]. The number of registered vehicles in Sivas increased from 148,758 in 2016 to 160,963 in 2019, reflecting a 7.6% rise [47].

2.2. Data Collection

2.2.1. Air Quality and Weather Data

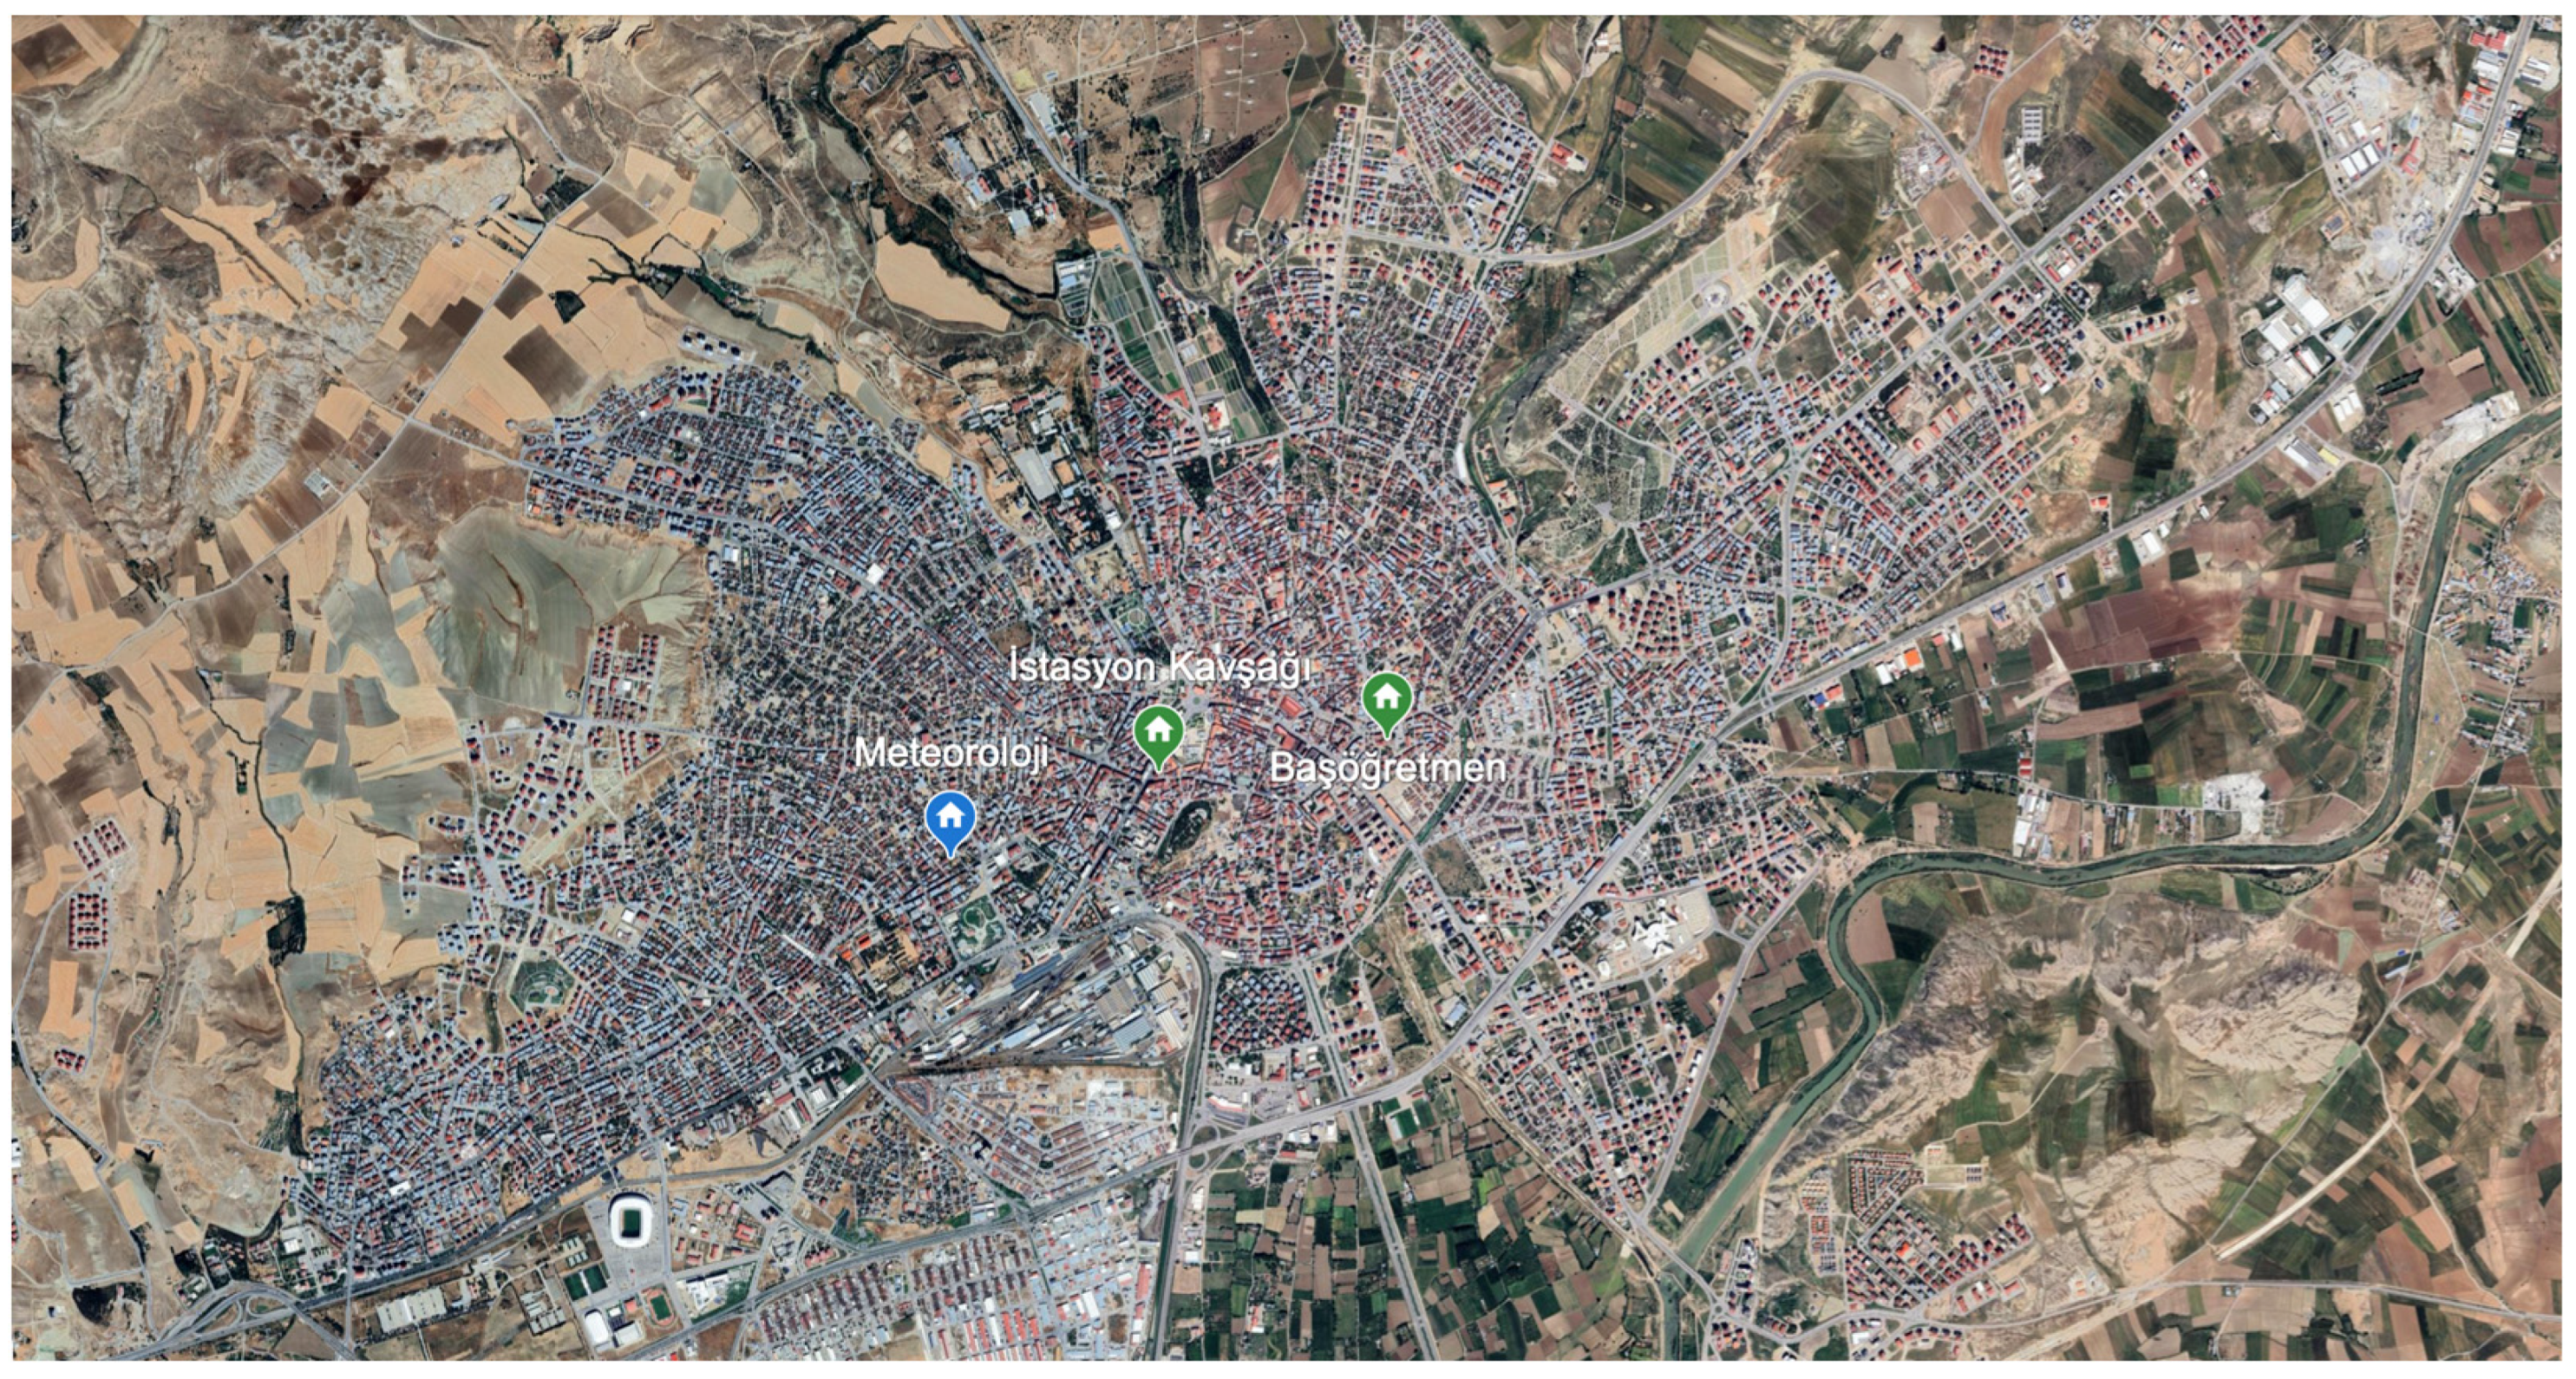
Hourly air pollution data—specifically PM10, PM2.5, SO2, and NO2—were obtained from the database of the Republic of Türkiye Ministry of Environment, Urbanization and Climate Change, the official governmental body responsible for monitoring air quality in Türkiye. Daily average concentrations for each pollutant except SO2 were calculated based on measurements from two air quality monitoring stations: İstasyon Kavşağı and Başöğretmen. SO2 data were obtained from the Başöğretmen station, which is monitored there. Meteorological data (air temperature and humidity) were obtained from the Meteoroloji meteorological station of the General Directorate of Meteorology. Geographic view of the three monitoring stations is presented in Figure 3. The geographic locations and monitored parameters of these stations are detailed in Table 1.

2.2.2. Health Data

Daily hospital admission data from twenty-one public hospitals in Sivas between 2016 and 2019 (a total of 1461 days) were obtained from hospital databases coordinated by the Republic of Türkiye Ministry of Health [52]. Sivas Province comprises 17 districts, including the Central District. Hospital admission data were collected from 21 hospitals across the province, including 16 district hospitals, 2 state hospitals, 1 university hospital, and 2 private hospitals. The 16 district hospitals are located in districts where no air quality monitoring stations are available. The air quality monitoring stations used in this study are located within the Sivas Central District. Among the major healthcare facilities in the Central District, one state hospital is located approximately 100 m from the İstasyon Kavşağı monitoring station, while the second state hospital, Sivas Cumhuriyet University Faculty of Medicine Research and Application Hospital, and the two private hospitals are located approximately 6 km, 4 km, 2 km, and 3 km from the station, respectively. Approximately 61% of the population of Sivas resides in the central district (Merkez District) of the province [47]. In addition, individuals living in rural areas and surrounding districts frequently prefer healthcare services located in the city center due to the concentration of advanced medical facilities and specialized hospital services. It is reported that nearly 90% of hospital admissions within the province are made to healthcare institutions located in the central district of Sivas [52]. This concentration increases daily population mobility and traffic density in the urban center. The hospital admission records were categorized according to the International Classification of Diseases, Tenth Revision (ICD-10), developed by the World Health Organization [2]. This study considered admissions for all non-accidental causes (ICD-10: A00–R99), cardiovascular diseases (ICD-10: I00–I99), and respiratory diseases (ICD-10: J00–J98).

2.3. Data Analysis

The statistical analysis was conducted using Poisson regression DLNM framework through the use of natural cubic splines within a generalized linear model (GLM), which is well-suited for modeling count data such as daily hospital admissions. Poisson regression is particularly appropriate for analyzing rate-based outcomes, where event counts are adjusted for exposure over time. Mortality and morbidity data commonly follow a Poisson distribution, making this approach widely applicable in air pollution epidemiology [21].
Daily citywide average concentrations of PM10, PM2.5, NO2, and SO2 were incorporated into the models as continuous indicators of air pollution exposure. To control for potential confounding influences, the associations between air pollution and hospital admissions were adjusted for long-term and seasonal trends, as well as meteorological conditions, including air temperature and relative humidity, using natural cubic spline functions. A spline with 7 degrees of freedom per year was applied for seasonal and long-term temporal trends, while 5 degrees of freedom were assigned to temperature. In addition, day-of-week effects and public holidays were included in the models as dummy variables.
The relationship between air pollution and hospital admissions was analyzed using a Poisson regression model within a generalized linear modeling (GLM) framework, expressed as:
Log[E(y)] = β0 + β1Z1 + β2Z2 + β3AP + ΣS(γi, dfi)
where (E(y)) represents the expected number of daily hospital admissions; (β) denotes regression coefficients; (AP) refers to daily mean air pollutant concentration; (Z1) and (Z2) indicate dummy variables for weekdays and holidays, respectively; and (S) represents smoothing functions based on natural cubic splines applied to covariates such as time, temperature, and humidity. Degrees of freedom were set at 5 for temperature and 7 per year for temporal trends.
The models were implemented using R version 2.15.0, with the support of the dlnm and splines packages. Results are expressed in terms of relative risk (RR) and excess risk (ER). RR was computed as exp(β), where β represents the estimated regression coefficient for each pollutant. ER, indicating the percentage increase in mortality per 10 μg/m3 increase in pollutant concentration, was calculated as (RR − 1) × 100%. Lagged effects of air pollutants were also assessed using distributed lag models, examining lags from 0 to 10 days to capture both immediate and delayed health outcomes [21].
Pearson correlation coefficients were also used to evaluate linear relationships among air pollutants and meteorological variables. Given the relatively large daily time-series dataset (n = 1461), Pearson correlation was considered appropriate and robust to moderate deviations from normality.
Furthermore, potential overdispersion was assessed using a dispersion parameter based on Pearson residuals, and evidence of overdispersion was identified in the daily hospital admission data. Additional quasi-Poisson GLM analyses were subsequently performed.

3. Results

3.1. Descriptive Analysis

Cardiovascular hospital admissions (n = 222,775) accounted for 38.4% of total non-accidental admissions, while respiratory hospital admissions (n = 212,161) represented 36.6% of the total (n = 580,027). During the study period, the annual mean concentrations were 58.6 µg/m3 for PM10, 27.4 µg/m3 for PM2.5, 15.4 µg/m3 for SO2, and 58.6 µg/m3 for NO2. On average, there were approximately 329 hospital admissions per day (Table 2). The annual mean concentrations were 58.6 µg/m3 for PM10, 27.4 µg/m3 for PM2.5, 58.6 µg/m3 for NO2, and 15.4 µg/m3 for SO2. PM10, PM2.5, and NO2 data were obtained from the İstasyon Kavşağı Air Quality Monitoring Station, which was selected because it is located in the area with the highest traffic and pedestrian density in Sivas city center. Since SO2 measurements were not available at the İstasyon Kavşağı station, SO2 data were obtained from the Başöğretmen Meteorological Air Quality Monitoring Station operated by the Republic of Türkiye Ministry of Environment, Urbanization and Climate Change. Therefore, the annual mean concentrations reported for PM10, PM2.5, and NO2 represent measurements from the İstasyon Kavşağı station, whereas the SO2 concentration represents measurements from the Başöğretmen station. PM10, PM2.5, and NO2 concentrations were obtained from the İstasyon Kavşağı air quality (AQ) monitoring station, established by the Republic of Türkiye Ministry of Environment, Urbanization and Climate Change in Sivas. SO2 data were collected from the Başöğretmen Meteoroloji AQ monitoring station [44].
The annual mean concentrations of PM10, SO2, and NO2 exceeded the threshold values specified by the Turkish air quality (AQ) guidelines, except for PM2.5, for which no national threshold was defined during the study period. According to the Turkish standards in effect by 2019, the annual mean limits were <60 μg/m3 for both PM10 and NO2. In contrast, annual mean concentrations of PM10, PM2.5, and NO2 all exceeded the corresponding limit values established by the European Union AQ Directive, which defines thresholds of <40 μg/m3 for PM10, <25 μg/m3 for PM2.5, and <40 μg/m3 for NO2 (as of 2019). Among the pollutants, PM2.5 exhibited the highest temporal variability, with a coefficient of variation (CV) of 0.63, followed by PM10 (CV = 0.62) and NO2 (CV = 0.32). The average daily temperature and relative humidity (RH) in Sivas during the study period were 10.7 °C and 59.9%, respectively (Table 2).
Table 3 presents the Pearson correlation coefficients between air pollutant concentrations, temperature, and humidity. PM2.5 exhibited strong positive correlations with all other pollutants, with correlation coefficients ranging from 0.57 to 0.75. The strongest correlation was observed between SO2 and PM2.5 (r = 0.75), followed by PM10 and PM2.5 (r = 0.67). Additionally, air pollutant concentrations showed negative correlations with ambient temperature, indicating that pollutant levels tended to be higher during colder periods.

3.2. Model Results of Hospital Admissions for Cardiovascular, Respiratory, and Total Diseases

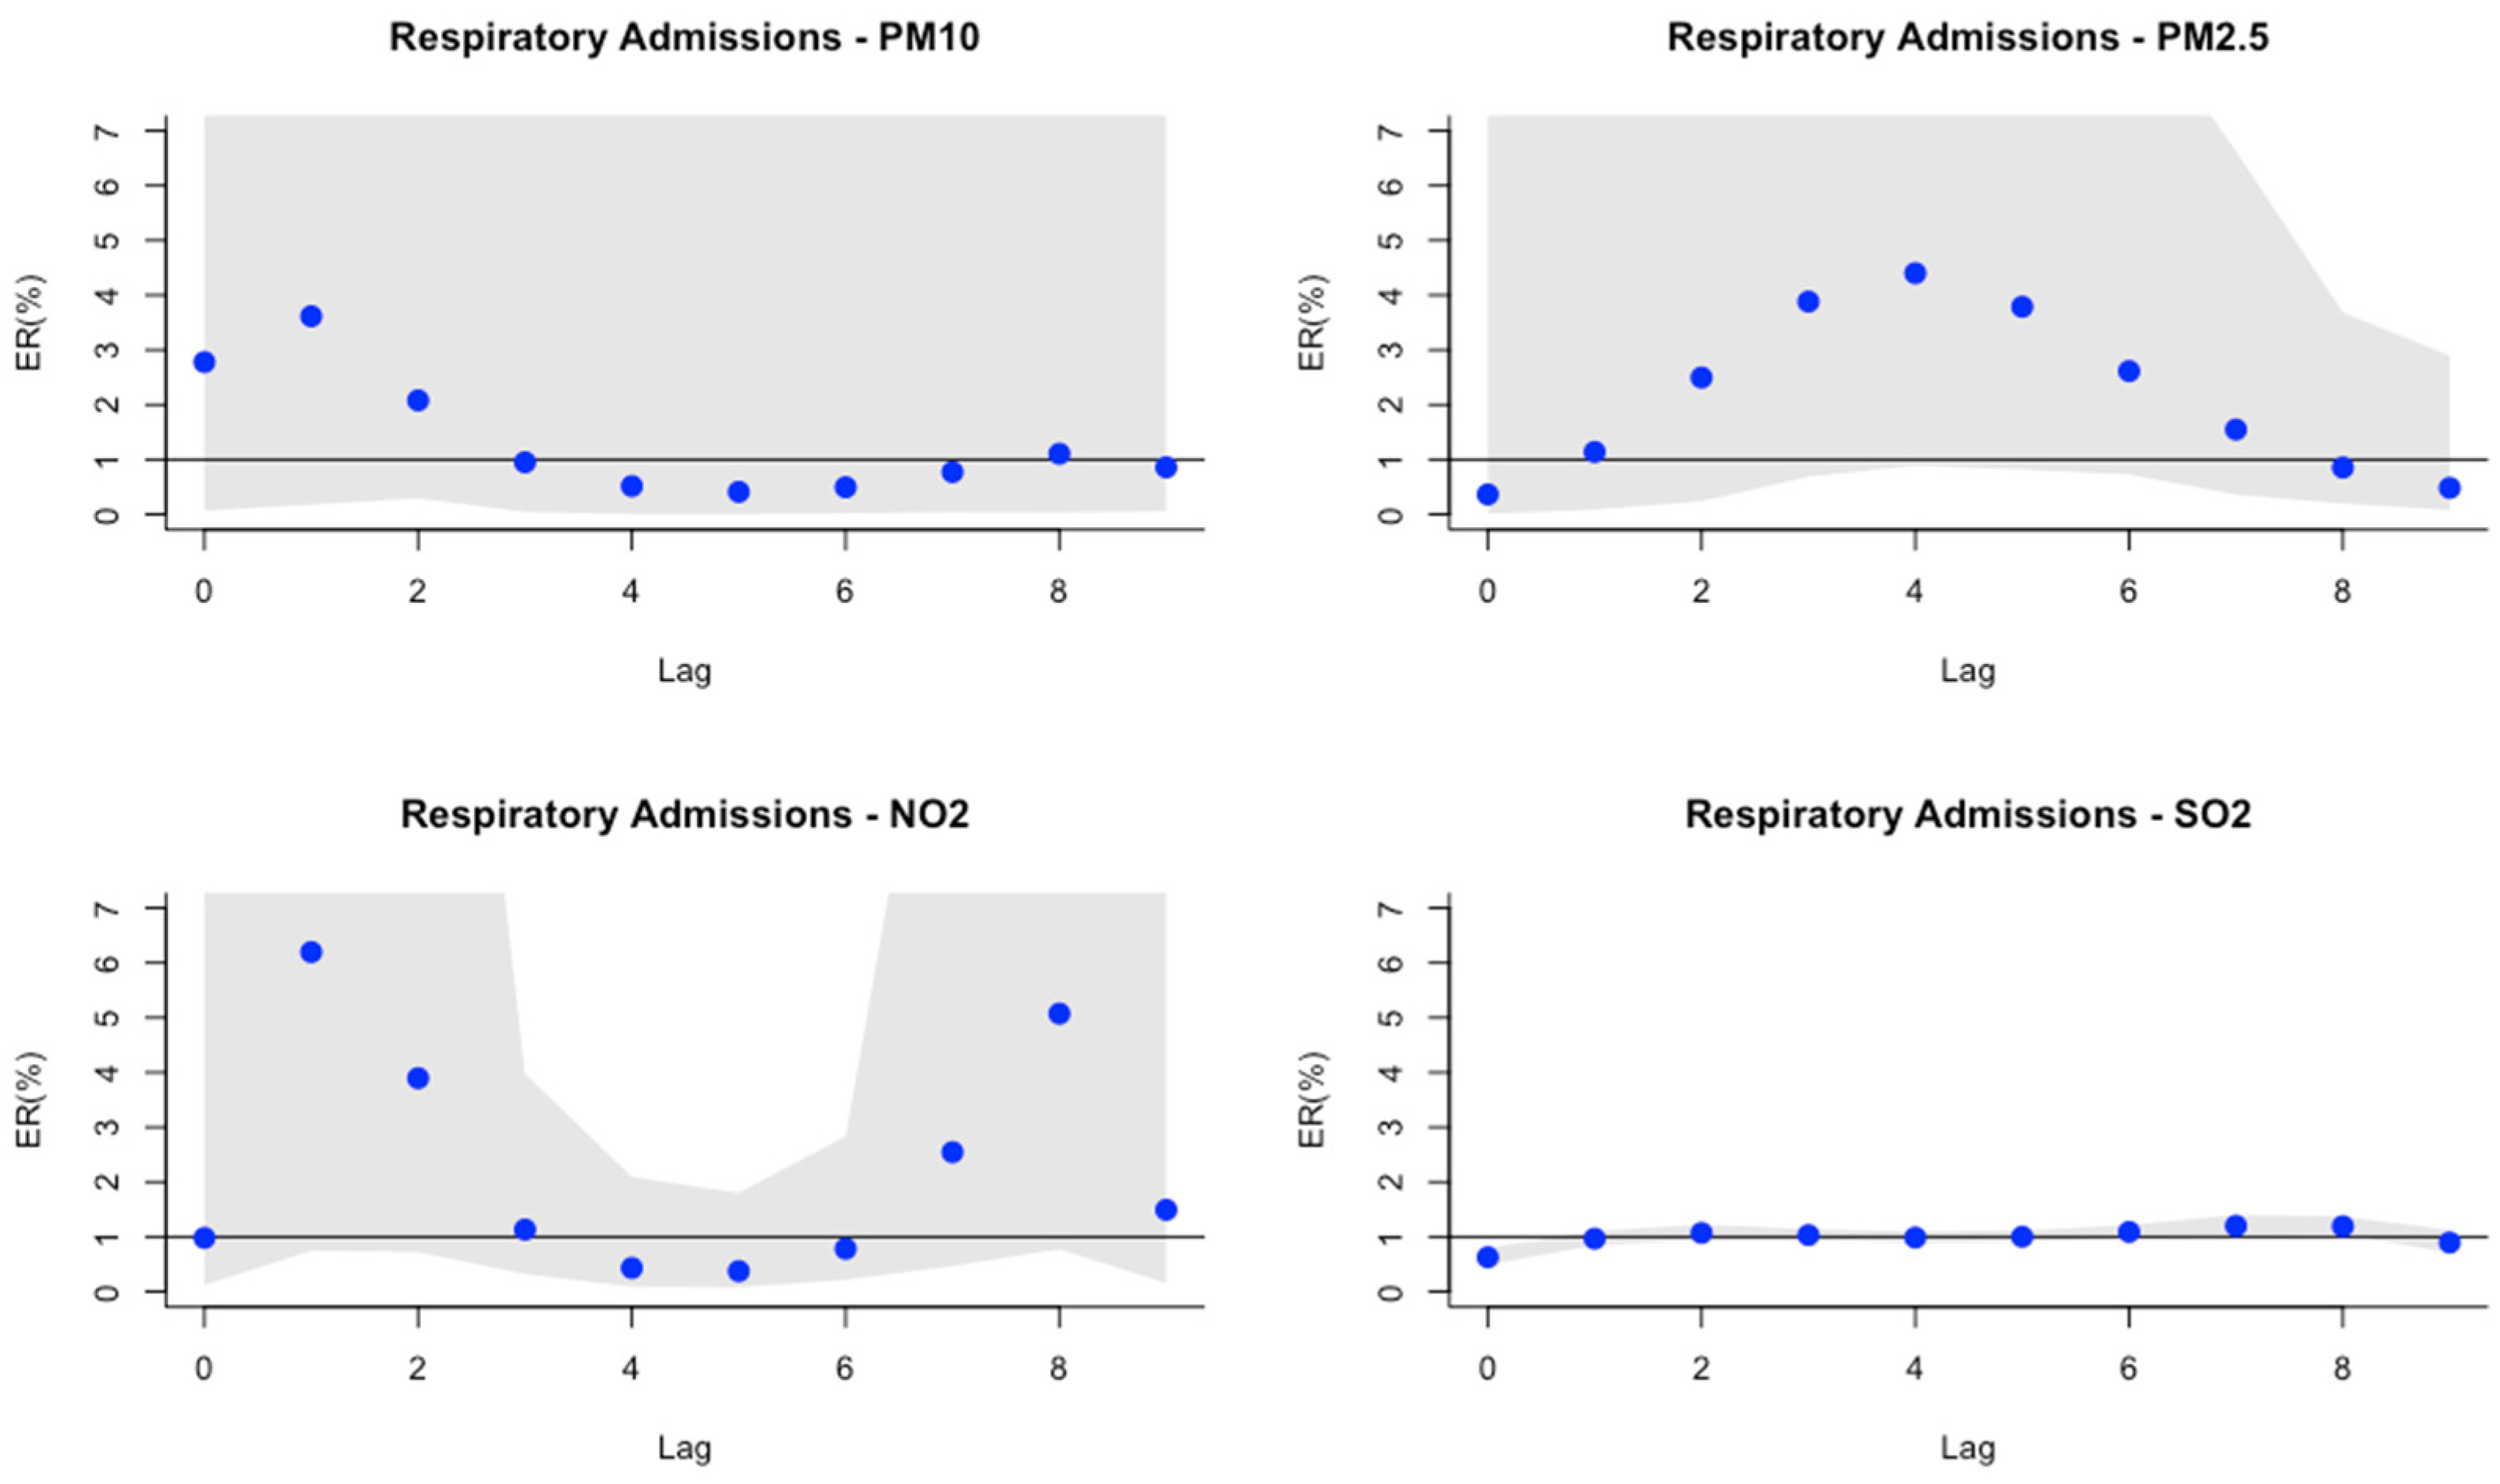
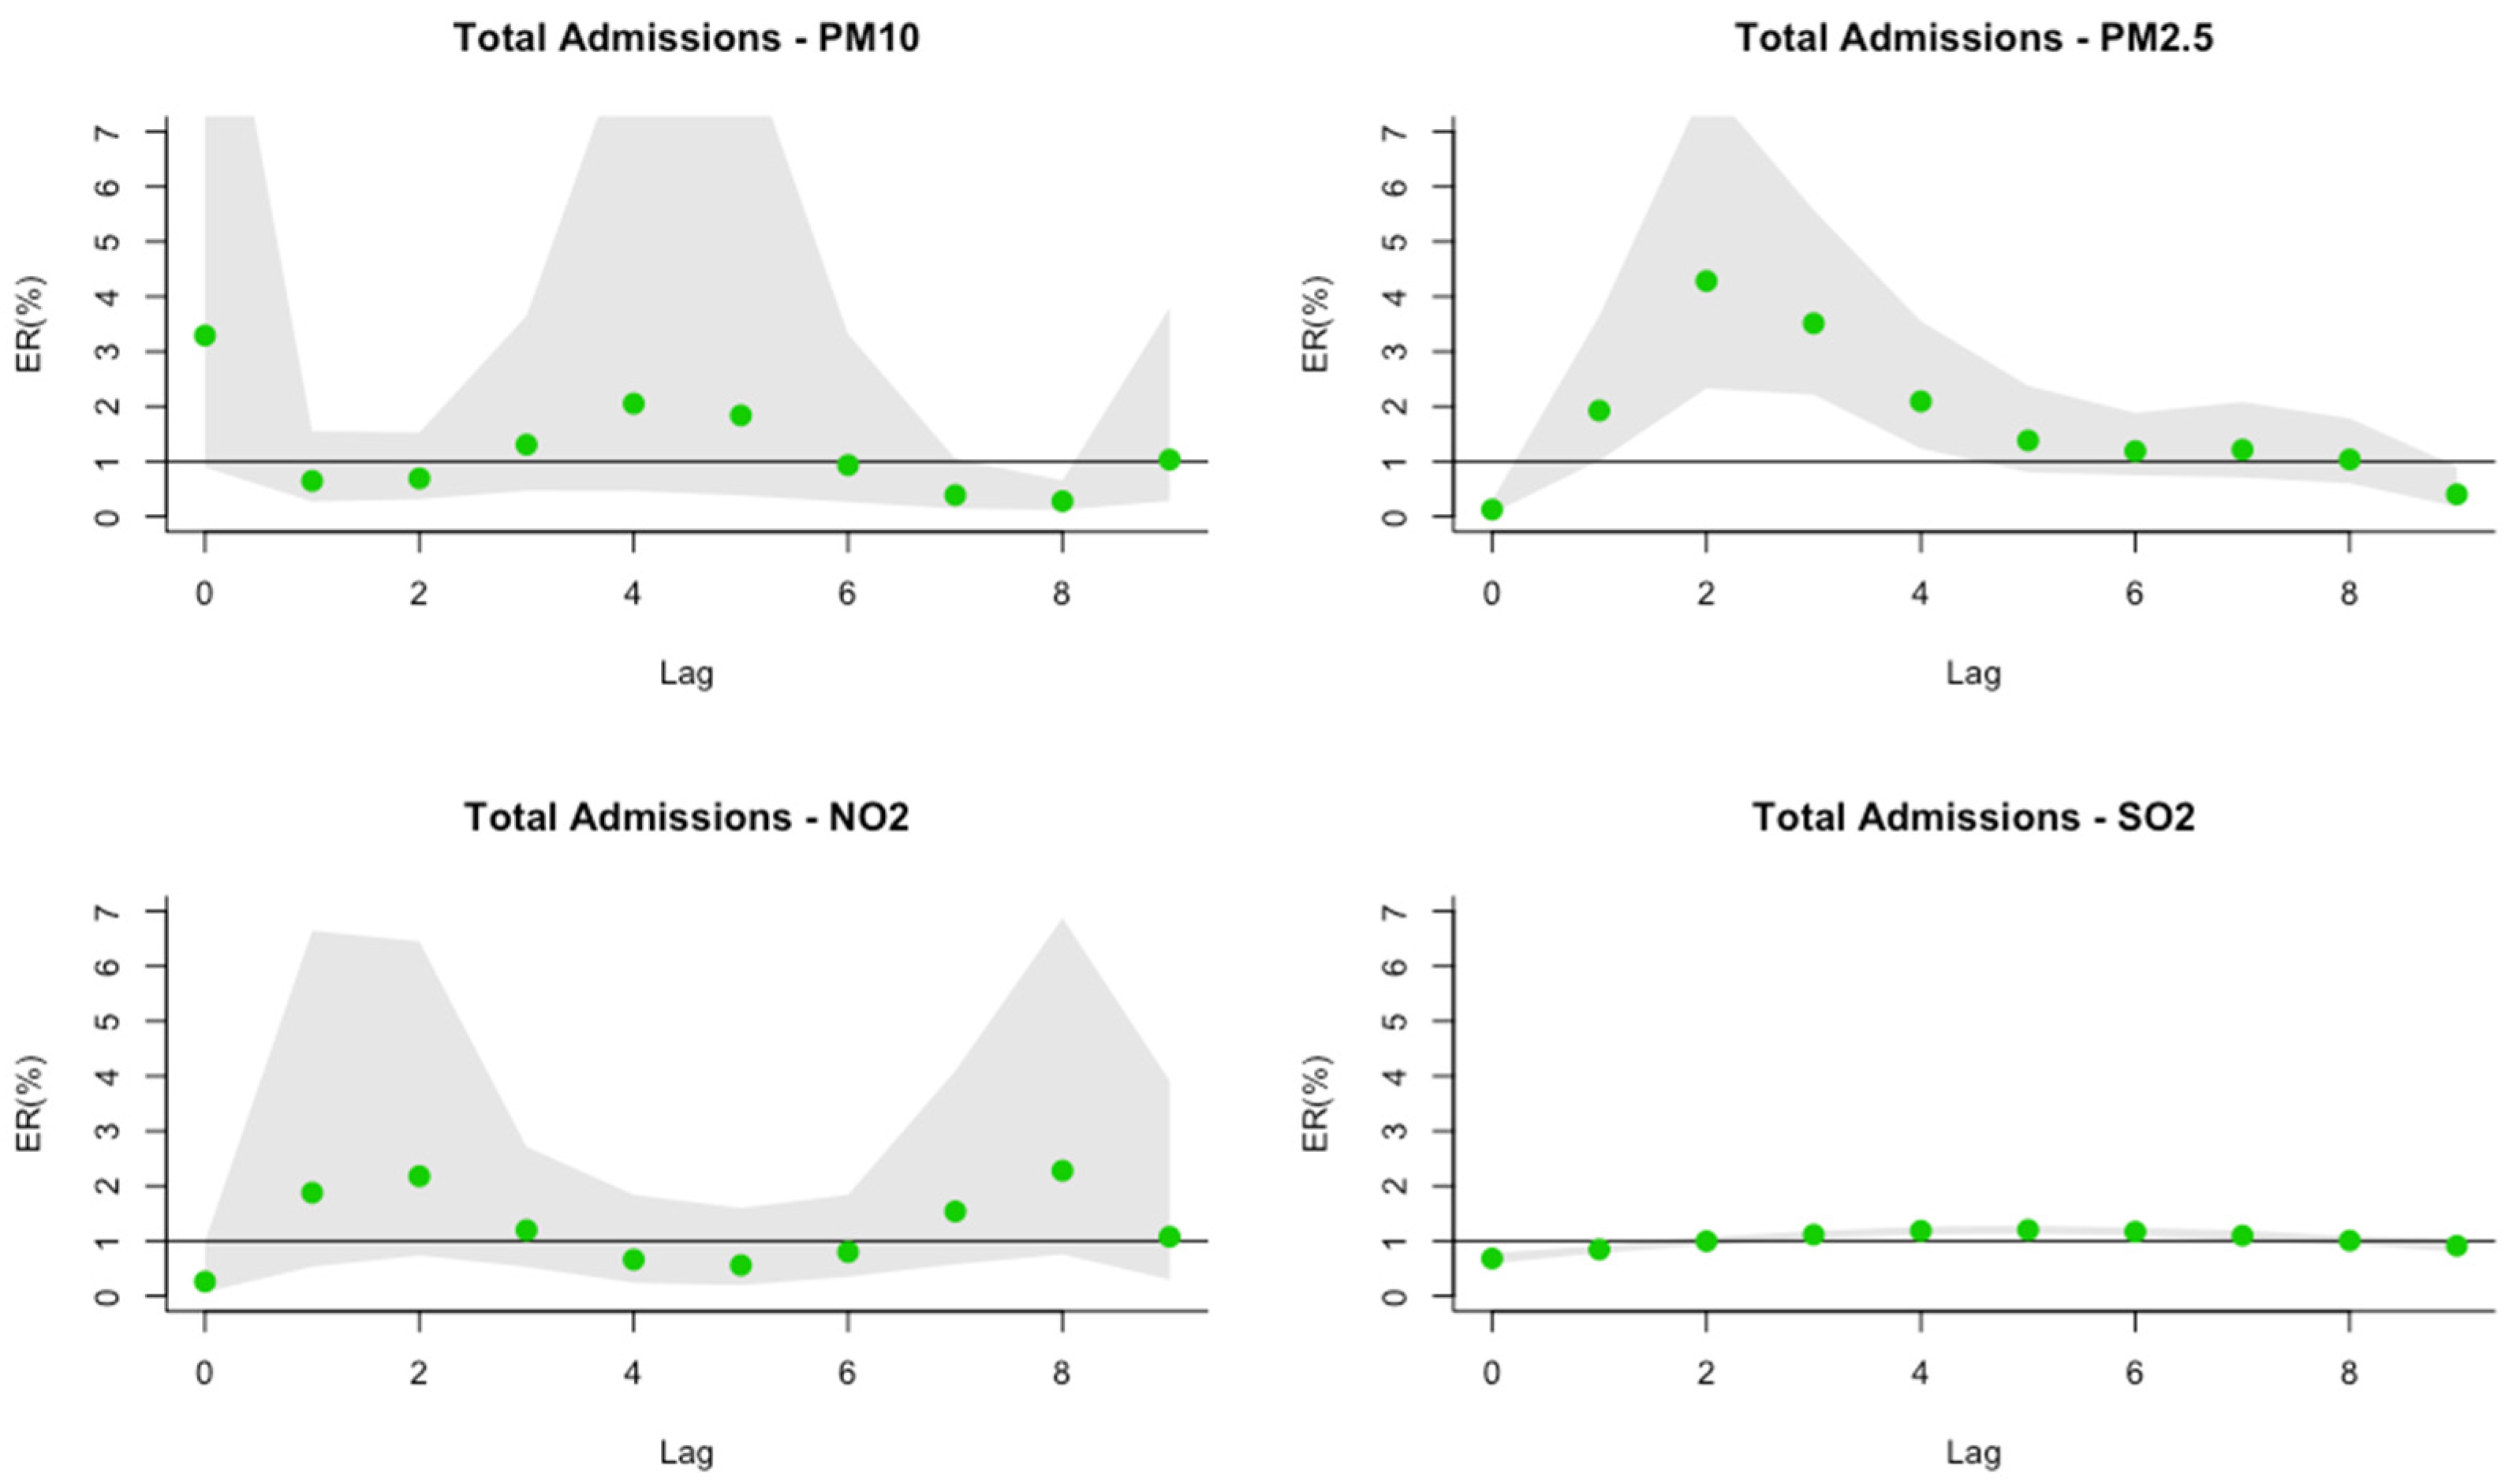
Excess risk (ER) estimates and their corresponding 95% confidence intervals (CIs) associated with a 10 μg/m3 increase in pollutant concentrations were calculated for each air pollutant (PM10, PM2.5, NO2, and SO2) over the period 2016–2019 in Sivas. Distributed lag models were applied to assess the effects over 10 days (lags 0–9). The ER values represent the percentage increase in respiratory hospital admissions per 10 μg/m3 increase in pollutant concentration. Statistically significant associations were identified between day-to-day fluctuations in air pollutant levels and hospital admissions at various lag days. Figure 4, Figure 5 and Figure 6 illustrate the estimated lag-specific effects of each pollutant on cardiovascular, respiratory, and total (non-accidental) hospital admissions, along with 95% confidence intervals.
222,775 people applied to the hospitals due to cardiovascular diseases during the study period. According to our results, NO2 is the pollutant with the biggest impact on cardiovascular diseases. It shows its highest effect on the 9th day (lag 8) after exposure (ER = 4.89%; 95% CI = 0.08–288.8%), which indicates the long-term effects of the pollutant on cardiovascular diseases. PM2.5 takes second place in this study in terms of health effects on cardiovascular diseases, and it is the pollutant with the longest-lasting effect on cardiovascular diseases. Its effect starts at lag 1 and continues until lag 8. It shows its highest effect on the 3rd day (lag 2) after exposure (ER = 5.12%; 95% CI = 1.39–19.0%). PM10 takes third place in this study in terms of health effects on cardiovascular diseases. It shows its highest effect on the 5th day (lag 4) after exposure (ER = 1.74%; 95% CI = 0.95–3.19%). SO2 has the least effect on cardiovascular diseases. It shows its highest impact on the 6th day (lag 5) after exposure (ER = 1.21%; 95% CI = 1.10–1.32%).
During the study period, 212,161 people applied to the hospitals due to respiratory diseases. According to our results, NO2 is the pollutant with the biggest impact on respiratory diseases. It shows its highest effect on the 2nd day (lag 1) after exposure (ER = 6.20%; 95% CI = 0.74–51.51%), which shows the acute effects of NO2 on respiratory diseases. PM10 takes second place in this study in terms of health effects on cardiovascular diseases. It shows its highest effect on the 2nd day (lag 1) after exposure (ER = 3.62%; 95% CI = 0.18–73.1%). PM2.5 is the pollutant with the longest-lasting effect on cardiovascular diseases. Its effect starts at lag 1 and continues until lag 6. It shows its highest effect on the 5th day (lag 4) after exposure (ER = 4.40%; 95% CI = 0.90–21.8%). SO2 has the least effect on cardiovascular diseases. It shows its highest impact on the 8th day (lag 7) after exposure (ER = 1.19%; 95% CI = 1.04–1.37%).
580,027 people applied to the hospitals due to total diseases during the study period. According to our results, PM2.5 is the pollutant with the biggest impact on total hospital admissions. It shows its highest effect on the 3rd day (lag 2) after exposure (ER = 4.28%; 95% CI = 2.33–7.88%), which shows the negative health impacts of PM2.5 on human health. PM10 takes second place in this study in terms of health impacts on total hospital admissions. It shows its highest impact on the first day (lag 0) of exposure (ER = 3.29%; 95% CI = 0.89–12.2%). NO2 takes third place in this study in terms of health effects on total hospital admissions. It shows its highest effect on the 9th day (lag 8) after exposure (ER = 2.28%; 95% CI = 0.75–6.88%). SO2 has the least effect on total hospital admissions. It shows its highest effect on the 6th day (lag 5) after exposure (ER = 1.20%; 95% CI = 1.13–1.28%).
As a sensitivity analysis, the Quasi-Poisson model was fitted. Overdispersion was assessed using both Pearson and quasi-Poisson residual diagnostics. The quasi-Poisson model yielded identical effect estimates as the Poisson model: Pearson dispersion parameters were 2.24 for both models, indicating moderate overdispersion. Quasi-Poisson lag-response patterns were also compared with the Poisson model, and the main results were also identical. Only confidence intervals became wider. Thus, the overall interpretation of the findings remained unchanged.

4. Discussion

The results of this study revealed that ambient air pollutant concentrations were positively associated with hospital admissions in Sivas. Among the evaluated pollutants, NO2 showed the strongest associations with cardiovascular, respiratory, and total (non-accidental) hospital admissions in the single-pollutant models. As a traffic-related pollutant, NO2 is primarily emitted from fuel combustion in the transportation and, to a lesser extent, industrial sectors. However, because the analyses were based on single-pollutant models and several pollutants were moderately to strongly correlated, the observed associations may partly reflect co-pollutant confounding. Therefore, the findings should be interpreted cautiously, and no inference regarding dominant pollutant contributors can be made.
The adverse health effects of NO2 are well documented in the literature. Short-term exposure to elevated NO2 levels has been linked to the exacerbation of respiratory diseases, particularly asthma, often leading to symptoms such as coughing, wheezing, or shortness of breath, as well as increased hospital visits and emergency room admissions. Prolonged exposure may also contribute to the onset of asthma and heightened susceptibility to respiratory infections. Vulnerable populations—such as individuals with pre-existing respiratory conditions, children, and the elderly—are particularly at risk [53].
Advanced statistical approaches, including quasi-Poisson regression and distributed lag nonlinear models (DLNMs), have been emphasized in recent studies for their effectiveness in capturing the temporal dynamics of air pollution exposure and health outcomes [54].
In the current study, PM10, PM2.5, and SO2 followed NO2 in terms of their health impact. The relative risk (RR) values for PM10 displayed a hill-shaped lag structure, with peak effects observed around lag days 4 and 5 across all disease categories. In contrast, PM2.5 exhibited an M-shaped lag pattern, with the highest risks occurring at lags 7 and 8. A similar M-shaped pattern was also seen for NO2, particularly with peak risk for cardiovascular and total admissions, and a secondary peak for respiratory morbidity at lag 8.
SO2 was consistently associated with the lowest risk estimates among all pollutants examined. This is consistent with national and international literature. For example, ref. [55] reported that chemical air pollutants were associated with 33,063 (95% CI: 13,536–55,404) respiratory-related hospital admissions, while 5754 (95% CI: 2506–8611) admissions were attributed to temperature extremes (e.g., heat and cold waves). Their findings emphasized that the health impact of PM was less pronounced than that of NO2 and ozone (O3).
Similarly, a systematic review conducted by [56] evaluated the association between air pollutant exposure and hospital admissions for cardiovascular and respiratory diseases. They reported effect size ranges as follows: for cardiovascular admissions, PM10 was associated with a 1.007–2.7% increase, PM2.5 with a 1.5–2.0% increase, NO2 with a 1.04–1.17% increase, and SO2 with a 1.007% increase. For respiratory admissions, PM10 was linked to a 1.007–2.7% increase, PM2.5 to a 1.1–1.8% increase, NO2 to a 1.08–1.94% increase, and SO2 to a 1.02% increase. Compared with the findings reported by [56], the effect estimates observed in Sivas were generally higher. For cardiovascular admissions, PM10 was associated with a 1.55% increase in Sivas, which falls within the 1.01–2.70% range reported in the review. However, PM2.5 showed a 5.12% increase, exceeding the previously reported range of 1.5–2.0%. Similarly, NO2 was associated with a 4.89% increase in cardiovascular admissions, compared with 1.04–1.17% reported in earlier studies. For respiratory admissions, PM10 (3.62%), PM2.5 (4.4%), and NO2 (6.2%) all exceeded the ranges summarized by [54], suggesting stronger short-term pollutant-health associations in Sivas.
In a study by [57], source apportionment of PM2.5 was performed using Positive Matrix Factorization, and a generalized additive model was applied to estimate the association between source-specific PM2.5 and respiratory emergency department visits. The study reported that PM2.5 concentrations were significantly associated with an increase in total respiratory emergency visits at lag 4 (RR = 1.011; 95% CI: 1.002–1.020) within a quartile concentration range of 76 μg/m3. More specifically, the strongest effects were observed for asthma at lag 5 (RR = 1.072; 95% CI: 1.024–1.119), bronchitis at lag 4 (RR = 1.104; 95% CI: 1.032–1.176), and COPD at lag 3 (RR = 1.091; 95% CI: 1.047–1.135). The results reported by [57] are broadly consistent with the present findings regarding the delayed effects of PM2.5 exposure. While Chi et al. observed the strongest respiratory impacts between lag 3 and lag 5, the highest PM2.5-related respiratory excess risk in Sivas occurred at lag 4 (4.4%), indicating a similar temporal pattern despite differences in study design and pollutant sources.
Ref. [24] conducted a systematic review and meta-analysis of 33 studies across North America, Europe, Oceania, and Asia, examining the short-term effects of air pollution on cardiorespiratory morbidity. They found a 2.65% (95% CI: 1.00–4.34%) increase in total cardiovascular morbidity within three hours of PM2.5 exposure. In addition, respiratory morbidity was found to rise between 7 and 12 h after exposure to PM2.5 (0.69%; 95% CI: 0.14–1.24%) and PM10 (0.38%; 95% CI: 0.02–0.73%), and between 12 and 24 h after SO2 exposure (2.68%; 95% CI: 0.94–4.44%). Quantitatively, the cardiovascular effect estimate associated with PM2.5 exposure in Sivas (5.12%) was higher than the pooled estimate of 2.65% reported by [24]. Likewise, the respiratory effect estimates observed in the present study for PM2.5 (4.4%) and PM10 (3.62%) exceeded the corresponding estimates reported in the meta-analysis. These differences may reflect higher ambient pollutant concentrations, regional differences in population vulnerability, and methodological variations among studies.
In another study, ref. [25] investigated the effects of ambient air pollution on COPD-related hospital visits in South London. Their findings revealed that general practitioner (GP) respiratory consultations increased across all age groups. Specifically, a one-quartile increase in daily PM10 was associated with a 2% rise in daily respiratory consultations and a 1% increase in inhaler prescriptions. Likewise, a one-quartile increase in daily NO2 was linked to a 1% rise in respiratory consultations. The mean concentrations reported in their study were 21.2 μg/m3 for PM10, 15.6 μg/m3 for PM2.5, and 50.7 μg/m3 for NO2. Compared with the South London study conducted by [57], the observed associations in Sivas were stronger. While [25] reported approximately 2% increases in respiratory consultations associated with PM10 and 1% increases associated with NO2, the corresponding respiratory excess risks in Sivas reached 3.62% for PM10 and 6.20% for NO2. These differences may be related to the substantially higher PM10 concentrations observed in Sivas (58.6 µg/m3) compared with those reported in South London (21.2 µg/m3).
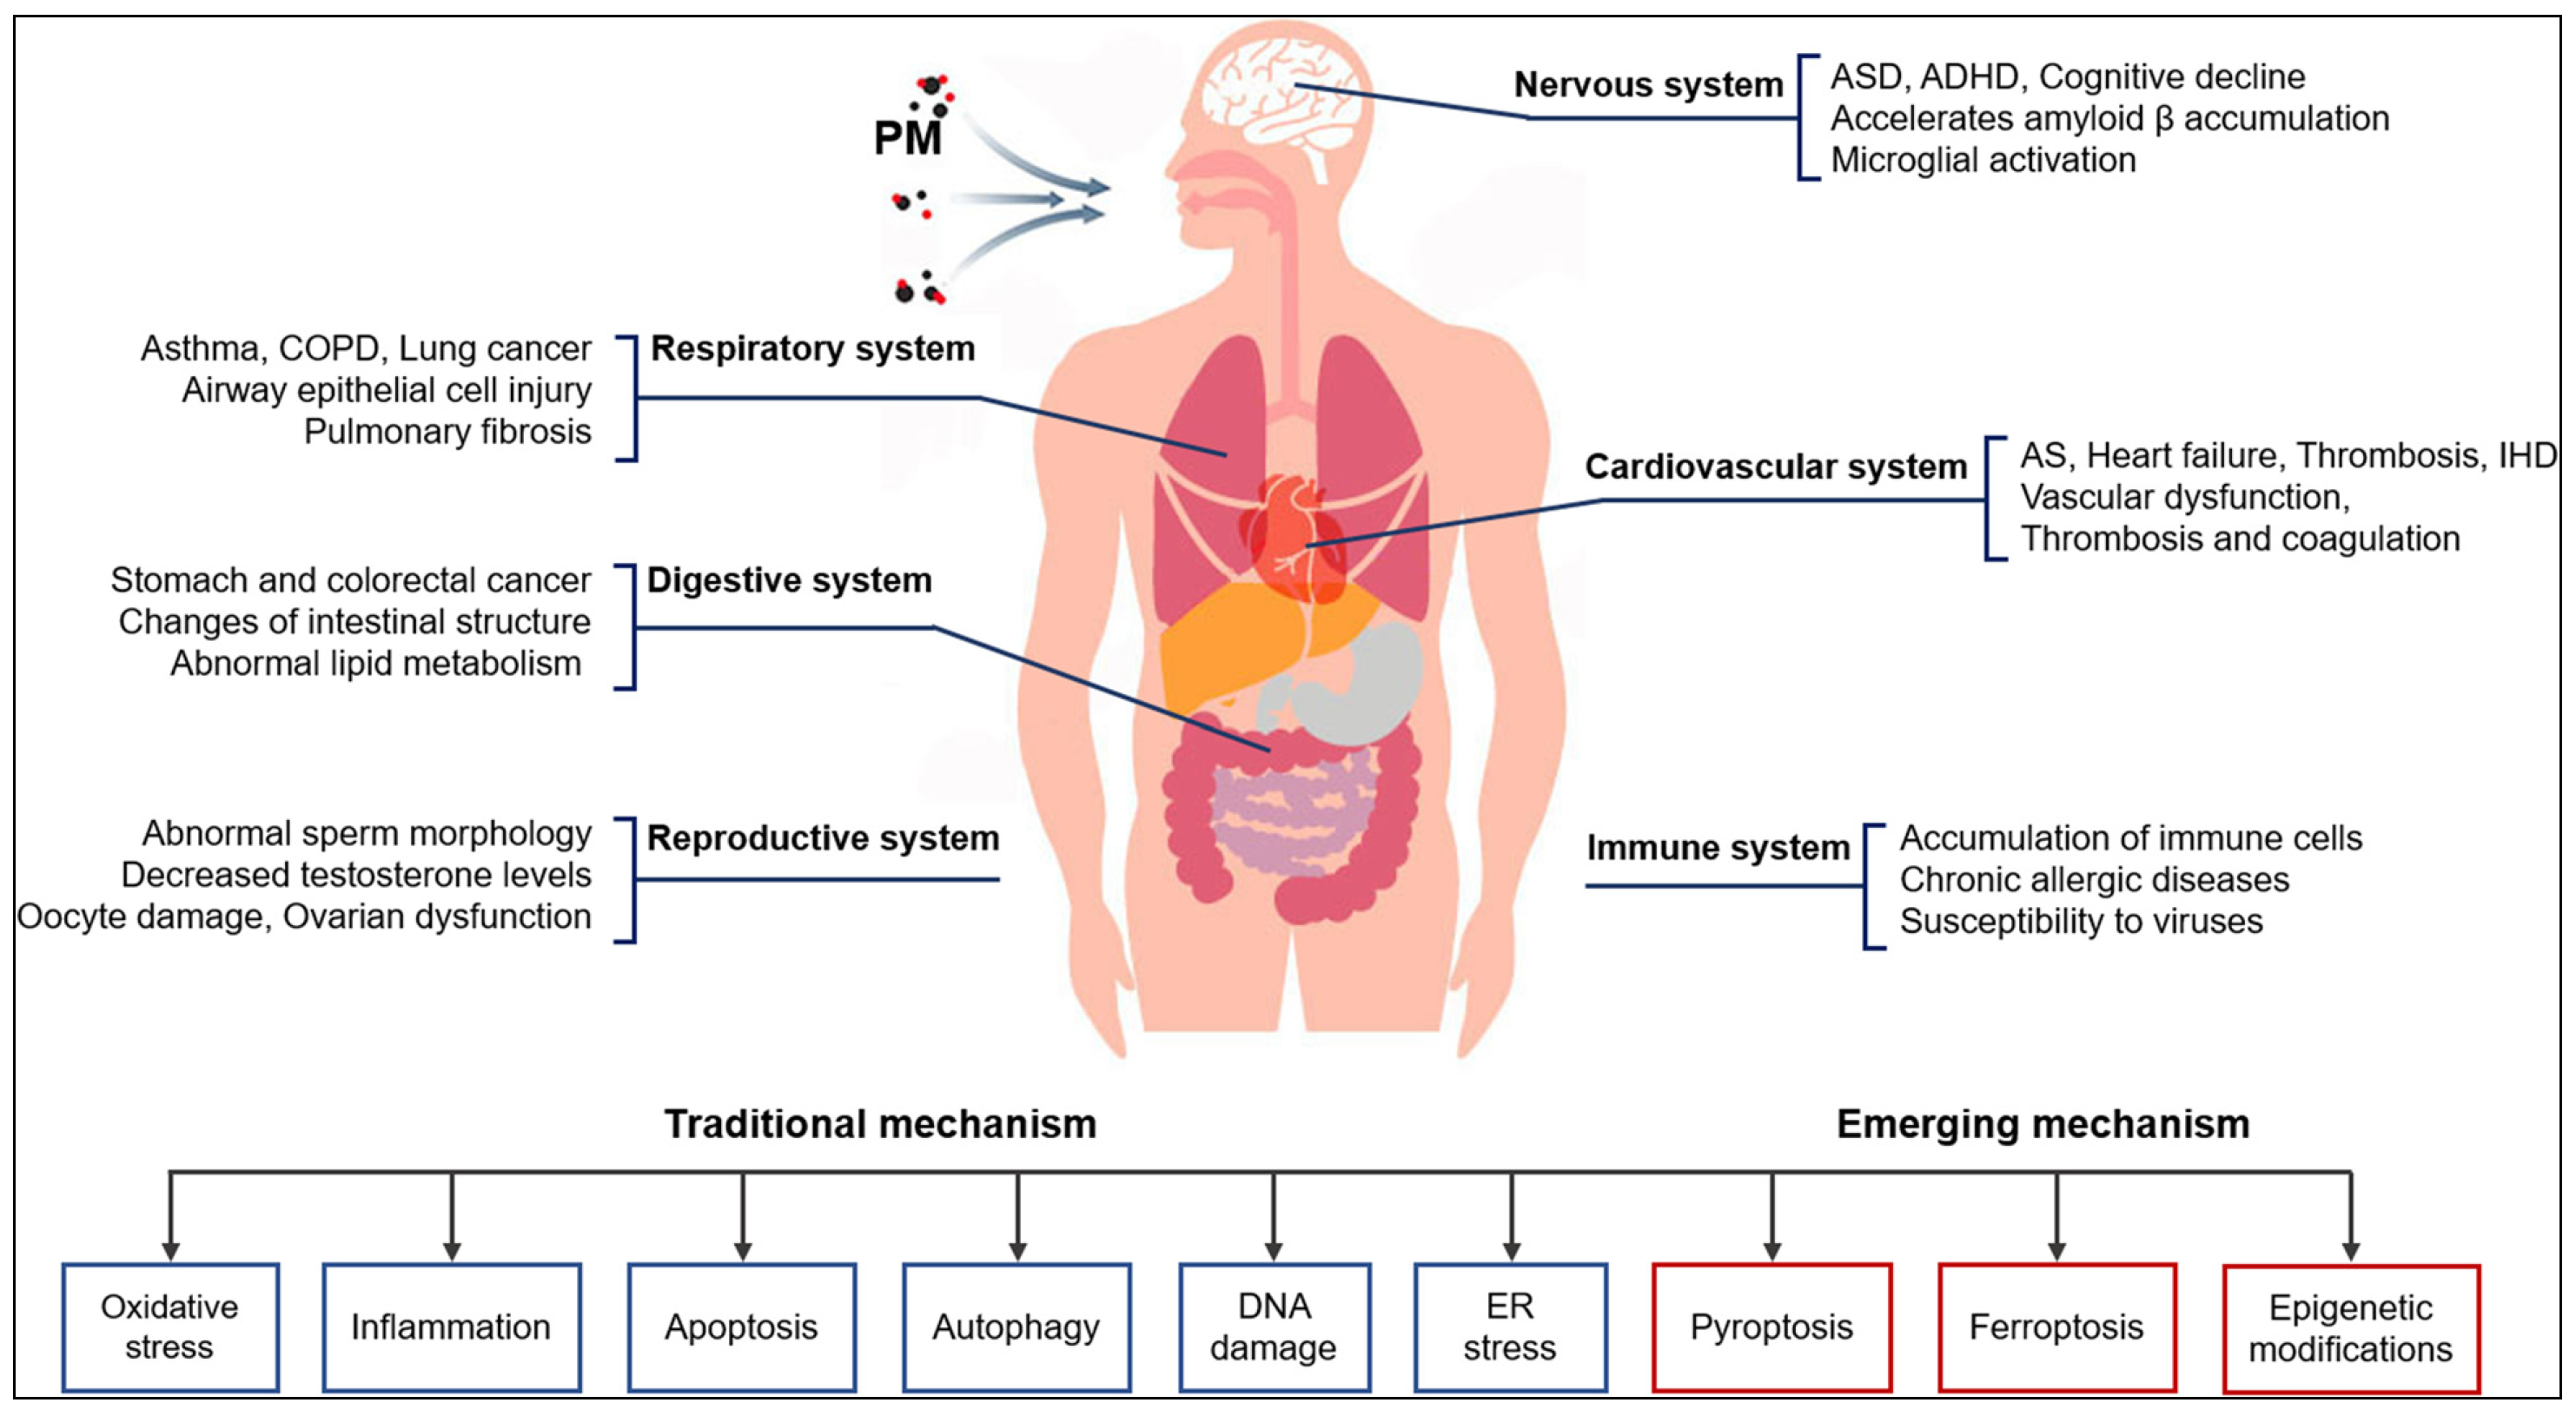
Overall, although the magnitude of the observed associations varied across studies, the present findings are consistent with the broader epidemiological literature in demonstrating significant adverse effects of short-term exposure to PM10, PM2.5, NO2, and SO2 on hospital admissions. Notably, several effect estimates observed in Sivas were at the upper end of, or exceeded, previously reported ranges, particularly for NO2 and PM2.5, highlighting the potential public health significance of air pollution in the study area. These findings reinforce the growing body of evidence indicating that short-term exposure to air pollutants contributes to increased risks of cardiovascular and respiratory morbidity. Particulate matter and its adverse health effects on humans are depicted in Figure 7 [57].
The results underline the need for targeted public health interventions and stricter air quality management policies in Sivas. Given that several observed effect estimates were higher than those reported in previous studies, local authorities should be informed of these outcomes and take proactive Measures to reduce pollutant emissions, particularly from traffic and residential heating sources. Moreover, similar epidemiological studies should be conducted in other provinces to identify region-specific pollutant effects and support the development of localized mitigation strategies.

Limitations of the Study

The findings should be interpreted in light of several methodological considerations. Exposure assessment was based on measurements from fixed-site air quality monitoring stations and may not fully capture individual-level variations in exposure. In addition, although the models were adjusted for meteorological conditions, long-term temporal trends, and day-of-week effects, residual confounding from unmeasured factors cannot be completely excluded. Furthermore, the analyses were based on single-pollutant models, and therefore, some degree of co-pollutant confounding may remain. Despite these considerations, the study was based on four years of continuous air quality and hospital admission data and provides the first epidemiological evidence on the association between short-term air pollution exposure and hospital admissions in Sivas Province.

5. Conclusions

This study is the first to examine the relationship between air pollution and hospital admissions in Sivas Province, the second-largest province in Türkiye by land area. As of the most recent census, approximately 61% (390,318 individuals) of the total population (637,040) reside in the provincial center, where urban activity and population density are highest. Following the adoption of natural gas in Sivas in 2006, and with residential usage rates now approaching 80%, sulfur dioxide (SO2) levels have remained relatively low, as has its observed impact on hospital admissions. In contrast, nitrogen dioxide NO2 a pollutant commonly associated with traffic-related emissions in urban environments, showed the strongest associations with hospital admissions in the present study. NO2 showed the highest relative risk values for hospital admissions, followed by PM10 and PM2.5. Recent studies have also identified long-range dust transport as a significant source of particulate matter pollution in the region [43]. Given that NO2 is the most critical pollutant impacting public health in Sivas, urgent measures should be implemented to mitigate its emissions, particularly those originating from urban traffic. Sustainable urban transport strategies should be prioritized, such as promoting the use of bicycles, consistent with the goals of the Paris Climate Agreement. Increasing the availability and safety of bicycle lanes, expanding the use of electric vehicles, and implementing traffic flow improvements—such as constructing underpasses, overpasses, and traffic-calming measures—could collectively help reduce stop-and-go traffic, a key contributor to NO2 emissions. Additionally, restricting the entry of heavy-duty vehicles such as trucks and buses into the city center may further improve air quality and reduce health burdens on the population.

Author Contributions

İ.K., H.Ö., Ö.Ç., H.Ç. and I.O. wrote the main manuscript sections, Ö.Ç. prepared modelling applications, H.H.D. and A.D. prepared statistical analysis. All authors have read and agreed to the published version of the manuscript.

Funding

This research received no external funding.

Institutional Review Board Statement

Ethics approval and participation approval were obtained. Required permissions are available.

Informed Consent Statement

Not applicable.

Data Availability Statement

The original contributions presented in this study are included in the article. Further inquiries can be directed to the corresponding author.

Acknowledgments

The authors would like to thank the Republic of Türkiye Ministry of Environment, Urbanization and Climate Change for providing AQ and weather data, the Ministry of Health for health data, Sivas Natural Gas Distribution Company (SİDAŞ) for natural gas data.

Conflicts of Interest

The authors declare no conflicts of interest. Mr. İbrahim Kaya is an employee Sivas Provincial Directorate of Ministry of Environment, Urbanization and Climate Change. The paper reflects the views of the scientists and not the institution.

References

  1. Manisalidis, I.; Stavropoulou, E.; Stavropoulos, A.; Bezirtzoglou, E. Environmental and health impacts of air pollution: A review. Front. Public Health 2020, 8, 14. [Google Scholar] [CrossRef] [PubMed]
  2. World Health Organization. Air Pollution. 2022. Available online: https://www.who.int/health-topics/air-pollution (accessed on 1 June 2025).
  3. Özkan, E.; Özdemir, H.; Şakar, C.O.; Demir, G.; Ünal, A.; Kindap, T. Online Detection and Analysis System for Air Pollution Hot Spots in Turkey. In Proceedings of the 2nd International Conference on Biotechnology and Environment Management; IPCBEE: Singapore, 2012. [Google Scholar] [CrossRef]
  4. Yılmaz, Z.; Karagӧzoğlu, M.B. Statistical analysis of the temporal change of PM10 levels in the city of Sivas (Turkey). Air Qual. Atmos. Health 2022, 15, 1635–1646. [Google Scholar] [CrossRef] [PubMed]
  5. Yavuz, E.; Kuzu, S.L. Performance comparison of dispersion and computational fluid dynamics models in the dispersion of gaseous stack emissions. Int. J. Environ. Sci. Technol. 2025, 22, 9581–9594. [Google Scholar] [CrossRef]
  6. Kuzu, S.L.; Saral, A. The effect of meteorological conditions on aerosol size distribution in Istanbul. Air Qual. Atmos. Health 2017, 10, 1029–1038. [Google Scholar] [CrossRef]
  7. Oruc, I.; Georgieva, E.; Hristova, E.; Velchev, K.; Demir, G.; Akkoyunlu, B.O. Wet Deposition in the Cross-Border Region Between Turkey and Bulgaria: Chemical Analysis in View of Cyclone Paths. Bull. Environ. Contam. Toxicol. 2021, 106, 812–818. [Google Scholar] [CrossRef] [PubMed]
  8. Turhan, S.B.; Oruc, I.; Ozdemir, H. Impact of heating season on the soil pollution in Kirklareli province of Turkey. Environ. Monit. Assess. 2021, 193, 209. [Google Scholar] [CrossRef] [PubMed]
  9. Kuzu, S.L. Source identification of combustion-related air pollution during an episode and afterwards in winter-time in Istanbul. Environ. Sci. Pollut. Res. 2019, 26, 16815–16824. [Google Scholar] [CrossRef]
  10. Pope, C.A., III; Burnett, R.T.; Thun, M.J.; Calle, E.E.; Krewski, D.; Ito, K.; Thurston, G.D. Lung cancer, cardiopulmonary mortality, and long-term exposure to fine particulate air pollution. J. Am. Med. Assoc. 2002, 287, 1132–1141. [Google Scholar] [CrossRef] [PubMed]
  11. Unal, Y.S.; Toros, H.; Deniz, A.; Incecik, S. Influence of meteorological factors and emission sources on spatial and temporal variations of PM10 concentrations in Istanbul metropolitan area. Atmos. Environ. 2011, 45, 5504–5513. [Google Scholar] [CrossRef]
  12. Ozdemir, H.; Mertoglu, B.; Demir, G.; Deniz, A.; Toros, H. Case study of PM pollution in playgrounds in Istanbul. Theor. Appl. Climatol. 2012, 108, 553–562. [Google Scholar] [CrossRef]
  13. Tecer, L.H.; Süren, P.; Alagha, O.; Karaca, F.; Tuncel, G. Effect of meteorological parameters on fine and coarse particulate matter mass concentration in a coal-mining area in Zonguldak, Turkey. J. Air Waste Manag. Assoc. 2008, 58, 543–552. [Google Scholar] [CrossRef] [PubMed]
  14. Oruc, I. Transport routes and potential source areas of PM10 in Kirklareli, Turkey. Environ. Monit. Assess. 2022, 194, 104. [Google Scholar] [CrossRef] [PubMed]
  15. Ilenič, A.; Pranjić, A.M.; Zupančič, N.; Milačič, R.; Ščančar, J. Fine particulate matter (PM2.5) exposure assessment among active daily commuters to induce behaviour change to reduce air pollution. Sci. Total Environ. 2024, 912, 169117. [Google Scholar] [CrossRef] [PubMed]
  16. Huang, X.; Tang, G.; Zhang, J.; Liu, B.; Liu, C.; Zhang, J.; Cong, L.; Cheng, M.; Yan, G.; Gao, W.; et al. Characteristics of PM2.5 pollution in Beijing after the improvement of air quality. J. Environ. Sci. 2021, 100, 1–10. [Google Scholar] [CrossRef] [PubMed]
  17. Craig, L.; Brook, J.R.; Chiotti, Q.; Croes, B.; Gower, S.; Hedley, A.; Krewski, D.; Krupnick, A.; Krzyzanowski, M.; Moran, M.D.; et al. Air pollution and public health: A guidance document for risk managers. J. Toxicol. Environ. Health Part A 2008, 71, 588–698. [Google Scholar] [CrossRef] [PubMed]
  18. Oberdörster, G.; Elder, A.; Rinderknecht, A. Nanoparticles and the brain: Cause for concern? J. Nanosci. Nanotechnol. 2009, 9, 4996–5007. [Google Scholar] [CrossRef] [PubMed]
  19. Kaplan, G.G.; Tanyingoh, D.; Dixon, E.; Johnson, M.; Wheeler, A.J.; Myers, R.P.; Bertazzon, S.; Saini, V.; Madesn, K.; Ghosh, S.; et al. Ambient ozone concentrations and the risk of perforated and nonperforated appendicitis: A multiprovince case-crossover study. Environ. Health Perspect. 2013, 121, 939–943. [Google Scholar] [CrossRef] [PubMed]
  20. Gold, D.R.; Samet, J.M. Air pollution, climate, and heart disease. Circulation 2013, 128, e411–e414. [Google Scholar] [CrossRef] [PubMed]
  21. Çapraz, Ö.; Efe, B.; Deniz, A. Study on the association between air pollution and mortality in İstanbul, 2007–2012. Atmos. Pollut. Res. 2016, 7, 147–154. [Google Scholar] [CrossRef]
  22. Ghorani-Azam, A.; Riahi-Zanjani, B.; Balali-Mood, M. Effects of air pollution on human health and practical measures for prevention in Iran. J. Res. Med. 2016, 21, 65. [Google Scholar] [CrossRef] [PubMed]
  23. Liu, C.; Chen, R.; Sera, F. Particulate Air Pollution and Daily Mortality in 652 Cities. N. Engl. J. Med. 2019, 19, 8. [Google Scholar] [CrossRef]
  24. Wu, K.; Ho, H.C.; Su, H.; Huang, C.; Zheng, H.; Zhang, W.; Tao, J.; Hossain, M.Z.; Zhang, Y.; Hu, K.; et al. A systematic review and meta-analysis of intraday effects of ambient air pollution and temperature on cardiorespiratory morbidities: First few hours of exposure matters to life. eBioMedicine 2022, 86, 104327. [Google Scholar] [CrossRef] [PubMed]
  25. Ashworth, M.; Analitis, A.; Whitney, D.; Samoli, E.; Zafeiratou, S.; Atkinson, R.; Dimakopoulou, K.; Beavers, S.; Schwartz, J.; Katsouyanni, K. Spatio-temporal associations of air pollutant concentrations, GP respiratory consultations and respiratory inhaler prescriptions: A 5-year study of primary care in the borough of Lambeth, South London. Environ. Health 2021, 20, 54. [Google Scholar] [CrossRef] [PubMed]
  26. Kunt, F.; Ayturan, Z.C.; Yümün, F.; Karagönen, İ.; Semerci, M.; Akgün, M. Measurement and evaluation of particulate matter and atmospheric heavy metal pollution in Konya Province, Turkey. Environ. Monit. Assess. 2021, 193, 637. [Google Scholar] [CrossRef] [PubMed]
  27. Sulhan, O.F.; Sevik, H.; Isinkaralar, K. Assessment of Cr and Zn deposition on Picea pungens Engelm. in urban air of Ankara, Türkiye. Environ. Dev. Sustain. 2023, 25, 4365–4384. [Google Scholar] [CrossRef]
  28. Isinkaralar, O.; Świsłowski, P.; Isinkaralar, K.; Rajfur, M. Moss as a passive biomonitoring tool for the atmospheric deposition and spatial distribution pattern of toxic metals in an industrial city. Environ. Monit. Assess. 2024, 196, 513. [Google Scholar] [CrossRef] [PubMed]
  29. Kilic, M. Identification and characterization of the source water-insoluble single particulate matter in rain events in the province of Isparta. Atmos. Pollut. Res. 2025, 16, 102427. [Google Scholar] [CrossRef]
  30. Acarer Arat, S. Temporal Variation of Particulate and Gaseous Air Pollutants in the Industrialized Region of Kocaeli: Long-term Air Pollution Trend (2019–2023). Water Air Soil Pollut. 2025, 236, 19. [Google Scholar] [CrossRef]
  31. Tırınk, S.; Öztürk, B. Evaluation of PM10 concentration by using Mars and XGBOOST algorithms in Iğdır Province of Türkiye. Int. J. Environ. Sci. Technol. 2023, 20, 5349–5358. [Google Scholar] [CrossRef]
  32. Şahin, Ü.A.; Kaynak, B. Questioning whether there was a short-term interaction between the 6 February 2023 earthquakes and air quality parameters in Türkiye. Chemosphere 2024, 347, 140616. [Google Scholar] [CrossRef] [PubMed]
  33. Koçak, T.K.; Günal, A.Ç. Assessment of atmospheric volatile organic compounds at two crude oil production plants in Southeastern Türkiye. Environ. Monit. Assess. 2025, 197, 88. [Google Scholar]
  34. Birinci, E.; Ekmekcioğlu, Ö.; Ozdemir, H.; Deniz, A. Interpretable machine learning framework for air quality prediction in Istanbul using Shapley additive explanations (SHAP). Stoch. Environ. Res. Risk Assess. 2026, 40, 37. [Google Scholar] [CrossRef]
  35. Birinci, E.; Özdemir, E.T.; Deniz, A.; Plocoste, T. Assessment of chaotic features for PM10 concentrations in İstanbul. Nonlinear Dyn. 2025, 113, 23577–23594. [Google Scholar] [CrossRef]
  36. Peters, A.; Dockery, D.W.; Muller, J.E.; Mittleman, M.A. Increased particulate air pollution and the triggering of myocardial infarction. Circulation 2001, 103, 2810–2815. [Google Scholar] [CrossRef] [PubMed]
  37. Pope, C.A., III. Mortality effects of longer term exposures to fine particulate air pollution: Review of recent epidemiological evidence. Inhal. Toxicol. 2007, 19, 33–38. [Google Scholar] [CrossRef] [PubMed]
  38. Çapraz, Ö.; Deniz, A.; Doğan, N. Effects of air pollution on respiratory hospital admissions in İstanbul, Turkey, 2013 to 2015. Chemosphere 2017, 181, 544–550. [Google Scholar] [CrossRef] [PubMed]
  39. Grigorieva, E.; Lukyanets, A. Combined effect of hot weather and outdoor air pollution on respiratory health: Literature review. Atmosphere 2021, 12, 790. [Google Scholar] [CrossRef]
  40. Adamkiewicz, Ł.; Maciejewska, K.; Rabczenko, D.; Drzeniecka-Osiadacz, A. Ambient particulate air pollution and daily hospital admissions in 31 cities in Poland. Atmosphere 2022, 13, 345. [Google Scholar] [CrossRef]
  41. World Health Organization. WHO Global Air Quality Guidelines: Particulate Matter (PM2.5 and PM10), Ozone, Nitrogen Dioxide, Sulfur Dioxide and Carbon Monoxide; World Health Organization: Geneva, Switzerland, 2021; Available online: https://www.who.int/publications/i/item/9789240034228 (accessed on 11 June 2026).
  42. European Union. Directive (EU) 2024/2881 of the European Parliament and of the Council of 23 October 2024 on Ambient Air Quality and Cleaner Air for Europe (Recast); European Union: Brussel, Belgium, 2024; Available online: https://eur-lex.europa.eu (accessed on 11 June 2026).
  43. Kaya, İ.; Özdemir, H.; Çapraz, Ö.; Atmaca, E.; Türkel, V.; Deniz, A.; Demir, G.; Ünal, A. An Urban Air Quality Assessment Based on a Meteorological Perspective. Environ. Monit. Assess. 2023, 195, 1021. [Google Scholar] [CrossRef] [PubMed]
  44. Sivas Provincial Directorate of Environment, Urban Planning and Climate Change. Sivas Province 2024 Environmental Status Report; Sivas Provincial Directorate of Environment, Urban Planning and Climate Change: Sivas, Türkiye, 2024. Available online: https://webdosya.csb.gov.tr/db/ced/icerikler/sivas-ilcdr-2024-20251014124703.pdf (accessed on 10 April 2024).
  45. TURKSTAT. Turkish Statistical Institute. 2023. Available online: https://www.tuik.gov.tr/ (accessed on 17 January 2023).
  46. Sivas Municipality. Urban Transportation and Traffic Management Reports. 2024. Available online: https://ulasim.sivas.bel.tr/apir/counter/listemiz/ (accessed on 12 August 2024).
  47. Turkish Statistical Institute (TÜİK). Address Based Population Registration System Results; Turkish Statistical Institute: Ankara, Türkiye, 2024. [Google Scholar]
  48. Karakuş, C.B.; Yıldız, S. Evaluation of noise pollution level from traffic for Sivas city using GIS-based noise indexes. Cumhur. Sci. J. 2020, 41, 176–184. [Google Scholar] [CrossRef]
  49. Sivas Municipality. Housing and Fuel Use Records of Sivas Central District (2022 Data); Sivas Municipality, Directorate of Environmental Protection and Control: Sivas, Türkiye, 2022. [Google Scholar]
  50. SİDAŞ. Natural Gas Consumption Statistics of Sivas Province for 2020–2021 [Unpublished İnstitutional Report]; Sivas Doğalgaz Dağıtım A.Ş.: Sivas, Türkiye, 2022. [Google Scholar]
  51. Sivas Provincial Health Directorate. Daily Hospital Admission Data from Twenty-One Public Hospitals in Sivas Between 2016 and 2019 [Unpublished Administrative Health Records]; Sivas Provincial Health Directorate: Sivas, Türkiye, 2024. [Google Scholar]
  52. EPA. U.S. Environmental Protection Agency; EPA: Washington, DC, USA, 2023. [Google Scholar]
  53. Rahim, N.N.A.; Zaki, R.A.; Yahya, A.; Wan Mahiyuddin, W.R. Acute Effects of Nitrogen Dioxide Exposure and Risk of Cardiorespiratory Hospital Admissions in Peninsular Malaysia: A Time-Series Study. Malays. J. Med. Health Sci. 2025, 21, 100–108. [Google Scholar] [CrossRef]
  54. Linares, C.; Díaz, J.; Navas, M.A.; Ruiz-Páez, R.; Saez, M.; Barceló, M.A.; López-Bueno, J.A. How air pollution and extreme temperatures affect emergency hospital admissions due to various respiratory causes in Spain, by age group: A nationwide study. Int. J. Hyg. Environ. Health 2025, 266, 114570. [Google Scholar] [CrossRef] [PubMed]
  55. Ab Manan, N.; Aizuddin, A.N.; Hod, R. Effect of air pollution and hospital admission: A systematic review. Ann. Glob. Health 2018, 84, 670–678. [Google Scholar] [CrossRef]
  56. Chi, R.; Li, H.; Wang, Q.; Zhai, Q.; Wang, D.; Wu, M.; Liu, Q.; Wu, S.; Ma, Q.; Deng, F.; et al. Association of emergency room visits for respiratory diseases with sources of ambient PM2.5. J. Environ. Sci. 2019, 86, 154–163. [Google Scholar] [CrossRef] [PubMed]
  57. Li, T.; Yu, Y.; Sun, Z.; Duan, J. A comprehensive understanding of ambient particulate matter and its components on the adverse health effects based from epidemiological and laboratory evidence. Part. Fibre Toxicol. 2022, 19, 67. [Google Scholar] [CrossRef] [PubMed]
Figure 1. Location of Sivas province in Türkiye.
Atmosphere 17 00611 g001
Figure 2. Fuel characteristics of each house in the central district (Merkez District) of Sivas.
Atmosphere 17 00611 g002
Figure 3. Geographic view of the three monitoring stations. From right to left: Başöğretmen, İstasyon Kavşağı and Meteoroloji. Air quality stations are shown with green signs, and the meteorological station is shown with blue sign.
Atmosphere 17 00611 g003
Figure 4. ER (%) and 95% CI of daily hospital admissions for cardiovascular diseases associated with a 10 μg/m3 increase in air pollutant concentrations over 10 days (lags 0–9).
Atmosphere 17 00611 g004
Figure 5. ER (%) and 95% CI of daily hospital admissions for respiratory diseases associated with a 10 μg/m3 increase in air pollutant concentrations over 10 days (lags 0–9).
Atmosphere 17 00611 g005
Figure 6. ER (%) and 95% CI of daily hospital admissions for total diseases associated with a 10 μg/m3 increase in air pollutant concentrations over 10 days (lags 0–9).
Atmosphere 17 00611 g006
Figure 7. Particulate matter and its adverse health effects on humans.
Atmosphere 17 00611 g007
Table 1. Locations of Sivas air quality stations and meteorological monitoring stations [44].
Station NameCoordinateTypePM10 & PM2.5NO2SO2Temp. and RH
Meteoroloji39°44′37″37°00′06″Weather
Başöğretmen39°44′50″37°00′47″Urban
İstasyon Kavşağı39°44′55″37°01′32″Traffic
Table 2. Summary statistics of the number of daily hospital admissions, air pollutant concentrations, and weather conditions in Sivas (2016–2019).
Mean + SDCoef. of Var. (CV)MinP (25)P (50)P (75)Max
Number of daily admissions
Total (n = 580,027)399 ± 288.20.721144826241002
Cardiovascular (n = 222,775)156 ± 115.20.7418170251439
Respiratory (n = 212,161)152 ± 107.20.7116176224462
Air pollutants (μg/m3)
PM1058.6 ± 36.40.6215.337.849.669.5672.1
PM2.527.4 ± 17.40.644.715.621.534.2127.2
NO258.6 ± 18.80.3219.244.556.370.1132.3
SO215.4 ± 18.41.200.85.289.019.1233.2
Weather
Temperature (°C)10.7 ± 8.80.83-16.83.810.918.027.8
Humidity (%)59.9 ± 14.60.2417.049.759.071.796.4
Table 3. Pearson correlation coefficients between daily air pollutant concentrations and weather conditions in Sivas (2016–2019).
PM10PM2.5NO2SO2TemperatureHumidity
PM101
PM2.50.671
NO20.290.571
SO20.500.750.351
Temperature−0.16−0.58−0.44−0.471
Humidity−0.070.300.200.16−0.691
Disclaimer/Publisher’s Note: The statements, opinions and data contained in all publications are solely those of the individual author(s) and contributor(s) and not of MDPI and/or the editor(s). MDPI and/or the editor(s) disclaim responsibility for any injury to people or property resulting from any ideas, methods, instructions or products referred to in the content.