Article

Numerical Analysis on Shading-Based Pedestrian Environment Optimization for HOD: A UTCI-Based Comparison at Macau LRT Union Hospital Station


by
Zekai Guo
1,
Qingnian Deng
1,
Jingwei Liang
1,
Lina Yan
2,
Wei Liu
1,
Yufei Zhu
1,
Liang Zheng
1,* and
Yile Chen
1,*
1
Faculty of Humanities and Arts, Macau University of Science and Technology, Avenida Wai Long N°S 100-460, Taipa, Macau 999078, China
2
College of Arts, Shanghai Zhongqiao Vocational and Technical University, No. 3888 Caolang Road, Jinshan District, Shanghai 201514, China
*
Authors to whom correspondence should be addressed.
Atmosphere 2026, 17(6), 603; https://doi.org/10.3390/atmos17060603
Submission received: 11 May 2026 / Revised: 9 June 2026 / Accepted: 10 June 2026 / Published: 12 June 2026
(This article belongs to the Special Issue Modelling of Indoor Air Quality and Thermal Comfort)

Abstract

In the context of subtropical cities, the slow-moving environment of HOD (Hospital-Oriented Development) faces the dual challenges of spatial fragmentation and an extreme hot and humid climate, which also restricts the outdoor space’s thermal environment performance. Taking the Macau Light Rapid Transit (LRT) Union Hospital Station as an example, this study constructs a “topology-climate” dual quantitative assessment framework that integrates space syntax and parametric universal thermal climate index (UTCI) simulation. In response to the current problems of mixed pedestrian and vehicular traffic and high-intensity heat radiation, a comprehensive intervention strategy combining three-dimensional stitching and spatial optimization is proposed. The results show that: (1) The implantation of three-dimensional corridors improved the spatial integration of the core area of the site by 67.0%, significantly optimizing network connectivity. (2) During the extreme high-temperature period of daytime (9:00–18:00) in summer and autumn, the intervention strategy precisely opened up a continuous low-heat-stress linear shade zone through the synergistic mechanism of building projection shadows, physical shading of connecting corridors, (landscape shading effect, original evaporation removed). (3) The study confirms that landscape-coupled shading layout is the most effective method, reducing potential pedestrian heat exposure across the entire area, while the three-dimensional connecting corridors precisely control the thermal environment of core walkways. Together, these two elements construct a “topology-climate” optimization framework, achieving a synergistic improvement in spatial accessibility and simulated thermal comfort performance under standard meteorological input and quantitatively verifying the optimization effectiveness of the tiered intervention scheme. This study provides a data-driven decision-making basis for optimizing potential walking thermal conditions for vulnerable groups and reshaping the space’s potential to improve microclimate via shading design of medical hub areas and also provides a scientific paradigm for TOD microclimate planning focused on shading-based thermal environment optimization.

1. Introduction

1.1. Research Background

With the acceleration of urbanization and the deepening of the Transit-Oriented Development (TOD) concept, the site selection and construction of large-scale integrated medical institutions are increasingly deeply integrated with urban rail transit networks, forming a composite spatial model of “medical hub TOD” [1]. Based on these developments, the HOD model—integrated hospital (or medical facility)-oriented development—has also emerged [2]. This model uses medical facilities as the core element, extending outwards to form functional clusters and a comprehensive business layout. In this model, light rail stations serve as basic transportation hubs and act as key catalysts connecting core medical resources and stimulating the vitality of surrounding urban areas [3,4]. Due to the special service attributes of medical hubs, their catchment areas bear the high-frequency commuting needs of a large number of patients, their families, medical staff, and surrounding residents. In the “last mile” from transportation stations to hospital outpatient clinics and surrounding businesses, walking is the most crucial and fundamental micro-mode of transportation [5]. Therefore, the environmental quality of the pedestrian and cycling spaces around light rail stations directly determines the overall service efficiency of medical hubs and the primary medical experience of the population. Different from conventional TOD that emphasizes travel efficiency and fast transfer, Hospital-Oriented Development (HOD) targets climate-sensitive users including patients, the elderly, and pregnant women. Its pedestrian planning prioritizes continuous thermal comfort, shaded walking pathways, and low-stress spatial experience rather than traffic speed. This health-sensitive mobility logic differentiates HOD from general urban TOD and forms the core theoretical basis of this study.
Meanwhile, modern medical concepts have gradually shifted from treating single diseases to holistic healing of mind and body [6]. Classic theories in environmental psychology, such as Stress Reduction Theory (SRT) [7] and Attention Restoration Theory (ART) [8], both indicate that contact with nature and high-quality outdoor public spaces creates a comfortable microclimate (such as suitable temperature and humidity, good ventilation and thermal environment), which can effectively reduce cortisol levels, alleviate anxiety, and promote the recovery of physiological indicators. For medical hubs, the health-supportive experience should not be limited to outpatient clinics or courtyards inside hospital walls but should be extended to the patient’s walking commute after exiting the station. It is worth noting that vulnerable groups such as patients, the elderly, and pregnant women are much more sensitive to changes in the external environment, especially thermal and wind environments, than the general population. This makes the physical environmental attributes of outdoor spaces (including microclimate comfort) have a decisive influence on their “healing perception” [9].
Among numerous physical environmental factors, outdoor walking thermal comfort is the primary factor influencing people’s spatial experience and willingness to use space [10,11]. Especially in subtropical high-density cities like Macau, the urban heat island effect and prolonged periods of high temperature and humidity in summer make outdoor spaces highly susceptible to heat stress, directly reducing the acceptability of the walking environment [12,13]. Harsh thermal environments not only cause physical discomfort such as heatstroke and fatigue but also exacerbate patients’ psychological distress and anxiety about seeking medical care, significantly diminishing the therapeutic function that outdoor spaces should possess [14]. Therefore, in the design context of HODs, how to reduce simulated pedestrian heat stress via shading-oriented spatial optimization under standard meteorological conditions has become a key consideration in current interdisciplinary research on urban thermal environment design.

1.2. Literature Review

1.2.1. Pain Points of Pedestrian Spaces in Urban Light Rail TOD Areas

In the context of the current integrated development of urban transportation and land use, the TOD (Transit-Oriented Development) model has been widely adopted [15,16]. However, numerous empirical studies have indicated that pedestrian spaces in light rail and urban rail transit TOD areas generally face many practical pain points in actual construction and operation.
Firstly, at the planning concept level, the construction of pedestrian environments is often placed in a secondary position in TOD [17,18]. Pan (2012) [17] pointed out in his research on high-density cities that current urban planning practices generally give the highest priority to motor vehicle-oriented development, with serious, insufficient consideration for pedestrian and bicycle transportation systems, especially neglecting the creation of microclimate comfort in pedestrian spaces. This planning inertia directly causes deviations in the implementation of TOD. As Yao et al. (2024) [18] emphasized, the key link of “creating a pedestrian-friendly environment” in TOD development is often overlooked, resulting in low pedestrian advantages around stations. In some areas heavily reliant on cars (such as Doha, Qatar), extreme situations have arisen where pedestrian accessibility is severely limited, making it difficult to effectively encourage the public to abandon private cars and adopt green transportation methods [19].
Secondly, in terms of spatial connectivity and system integration, the slow-moving network has failed to seamlessly connect with public transport hubs, leading to a severe last-mile challenge [20]. Nafi and Ouahrani (2025) found that due to the lack of deep integration between public transport hubs and surrounding land use, residents often face difficulties walking from transport stations to their final destinations, and connecting routes often lack basic microclimate regulation facilities, further reducing the slow-moving experience [19]. Regarding the integration of multimodal green transportation, Rogers et al. (2023) pointed out that multi-purpose routes (MUPs) generally lack physical connections and availability with shared bicycles and public transport stations [20]. This isolated state of facilities constitutes the greatest obstacle to the public combining slow-moving networks with rail transit. Pan (2012) further confirmed that the inadequacy of the pedestrian connection network leads to longer station-out-of-station times, which not only significantly reduces the actual door-to-door travel speed of the subway but also severely restricts the overall efficiency and attractiveness of the rail transit system [17].
Finally, at the level of micro-space quality and pedestrian experience, the environmental creation of current TOD areas still has significant shortcomings [21]. Ha et al. (2011) proposed that pedestrian spaces should not only be physical corridors for passage but also important places for urban residents to travel comfortably and rest [22], and microclimate comfort is one of the core micro-indicators affecting the pedestrian experience. However, Yao et al. (2024) found in their quantitative study that many stations performed poorly in terms of intersection connectivity [18], pedestrian path straightness, and pedestrian road density, resulting in fragmented spatial characteristics. Serra-Coch et al. (2018) showed that pedestrians’ willingness to walk is highly dependent on the environment, and the characteristics of the surroundings are key to the success of a pedestrian system [21]. However, existing pedestrian spaces generally lack convenience, safety, enjoyment, and aesthetic design. Furthermore, there is a lack of effective quantitative assessment and optimization methods for micro-experience indicators such as microclimate comfort, which ultimately greatly affects the overall pedestrian friendliness of TOD areas [22].

1.2.2. Methods for Analyzing Pedestrian Accessibility of Urban Slow-Moving Spaces

Pedestrian accessibility, as a core quantitative indicator for urban slow-moving space planning, directly determines pedestrian travel efficiency and the quality of space use. Space syntax, due to its ability to analyze the relationship between spatial configuration and walking behavior, has become the mainstream quantitative analysis tool in this field [23,24,25,26,27,28,29,30,31,32] (Chu et al., 2025; Fan et al., 2022; Hillier et al., 1976; Kang, 2015; Marinelli et al., 2023; Öztürk et al., 2018; Şahin Körmeçli, 2023; Sajan et al., 2024; Xu et al., 2024). Chu et al. (2025) used the Qingdao Textile Valley Creative Industry Park in China as a case study, combining spatial syntax Depthmap software and AnyLogic simulation to analyze the pedestrian density and spatial accessibility of the park’s streets and proposed a vitality optimization scheme to densify the pedestrian network and improve connectivity [23]. Fan et al. (2022), based on space syntax theory, took the blue-green space in Guangzhou, China, as a case study, built a three-dimensional evaluation framework of accessibility, visibility, and comprehensibility [24], and used spatial design network analysis and principal component analysis to find that the blue-green space in the urban center has the best accessibility and visibility and the lowest comprehensibility. Öztürk et al. (2018) used space syntax and GIS methods to analyze the pedestrian accessibility of the Davutpasa campus of Yildiz Technical University in Türkiye [25]. Based on open street maps, axis maps are generated, and DepthMapX is used to complete axis and line segment analysis. The accessibility of pedestrian networks is interpreted by combining spatial cognition and campus morphological characteristics. Kang (2015) used Seoul, South Korea, as the research area, constructed four new accessibility indices [26], and explored the impact of spatial accessibility and centrality of different land use types on pedestrian flow, while controlling for variables such as street characteristics, location traffic, and neighborhood land use attributes. Marinelli et al. (2023) selected two suburban university campuses in Parma and Cagliari-Moncelato, Italy, and used space syntax to measure the accessibility and spatial polarity of pedestrian networks to identify the advantages and disadvantages of pedestrian infrastructure [27]. Şahin Körmeçli (2023) integrated spatial syntax and GIS technologies to conduct accessibility analysis on the pedestrian street network of Çankırı, Turkey, incorporating topographic slope factors to identify the pedestrian accessibility advantages of streets with low slope and high integration [28]. Sajan et al. (2024) used Kochi, India, as a case study and found through spatial syntax analysis that the pedestrian connectivity in some areas of the city was relatively strong, but the overall integration and accessibility were low [29]. They proposed infrastructure optimization strategies based on a pedestrian satisfaction survey. Xu et al. (2024) used Wuhan, China, as a study area, combining space syntax, street view images, and pedestrian accessibility to achieve a quantitative assessment of pedestrian heat exposure at a human scale and accurately identify priority areas for heat exposure remediation [30].

1.2.3. Outdoor Thermal Comfort Based on Parametric Simulation

With the intensification of global warming and the urban heat island effect, outdoor thermal comfort has become a core indicator for measuring the quality of urban public spaces and the experience of slow walking. It is also a key factor influencing the quality of the microclimate environment and people’s perception of health [31]. Traditional thermal comfort assessments rely heavily on on-site surveys and static subjective questionnaires. Recently, however, digital simulation technologies based on parametric platforms, such as Rhino-Grasshopper and its environmental performance plugin, have become the mainstream paradigm in this field due to their ability to achieve dynamic response and multivariate interaction of climate data, accurately capturing the dynamic changes of microclimate parameters [33,34]. Zhang and Liu (2021) pointed out that embedding physiologically equivalent models such as the Universal Thermal Climate Index (UTCI) [34] into a parametric workflow can accurately capture the dynamic impact of urban street microclimate on the outdoor environment of buildings and human behavior. This approach allows planners to quickly assess the impact of different spatial forms on pedestrian thermal perception in the early design stages, providing scientific support for microclimate optimization.
In the evaluation of pedestrian spaces in urban streets and transportation hubs, parametric simulation offers significant advantages. Streets, as the backbone of urban slow-traffic systems, directly influence pedestrian willingness to walk due to their thermal environment. Microclimate conditions are a core factor influencing the street’s thermal environment [35,36]. Zheng et al. (2023) constructed a parametric simulation framework for early-stage urban street design [36], demonstrating that optimizing street morphology and shading strategies can improve summer outdoor thermal comfort while reducing cooling energy consumption of surrounding buildings, achieving the dual goals of microclimate improvement and energy conservation. Addressing the common low-wind environment in high-density cities, Chen and Mak (2021) used parametric fluid dynamics simulation to quantify the comprehensive impact mechanism of building height and upstream building layout on wind speed and thermal comfort at pedestrian height [35]. This work has significant implications for urban nodes in hot and humid climates with dense buildings, such as Macau, revealing the crucial role of ventilation corridors and elevated ground-floor designs in improving the microclimate around hubs and enhancing pedestrian thermal comfort.
With the deepening of the healthy city concept, parametric thermal comfort simulation is evolving towards enhancing the potential restorative value of outdoor spaces and multi-objective optimization. Certain populations (such as patients seeking medical care and the elderly) are more vulnerable to extreme thermal environments and have more stringent needs for therapeutic lighting and microclimate [37]. Wang et al. (2026) [37] proposed a decision support system for multi-objective optimization that combines machine learning and parametric simulation, specifically for age-friendly outdoor activity spaces. They precisely controlled the spatial form to balance thermal comfort and sufficient sunlight exposure, thereby maintaining the physical and mental health of vulnerable groups and aligning with the needs of creating a therapeutic microclimate. Furthermore, to overcome the time-consuming nature of traditional parametric simulations, deep learning algorithms have begun to be introduced. For example, by using the Pix2Pix image translation algorithm to assist in parameterization models, rapid and intelligent calculation and spatial optimization of the UTCI (Universal Thermal Climate Index) and thermal pressure ventilation performance of traditional urban blocks were achieved. This method provides an efficient technical approach for microclimate-oriented spatial design [38].

1.3. Problem Statement and Objectives

Urban HOD areas generally face the dilemma of fragmented pedestrian spaces and notable simulated heat exposure under hot-humid climatic settings. Uneven shaded conditions and poor spatial connectivity restrict the space’s simulated thermal improvement potential. Currently, the synergistic relationship between spatial layout and modelled heat stress reduction remains unclear, and the contribution of distinct spatial components lacks systematic quantitative evaluation.
This study takes the Macau LRT Union Hospital Station as a specific research object, focusing on optimizing simulated shaded thermal performance of pedestrian spaces in medical hub HOD areas. It explores the coordination between spatial layout and modelled heat mitigation effects, and puts forward targeted spatial intervention strategies. Quantitative analysis is implemented via space syntax and Ladybug parametric simulation based on standard EPW meteorological data, to compare changes in spatial accessibility and simulated UTCI values pre- and post-design adjustment. Ultimately, this provides a data-driven evaluation paradigm and scientific reference for shading-focused thermal optimization of pedestrian surroundings in medical hub districts.

2. Study Area and Methods

2.1. Study Area and Problem Identification

This study focuses on the Macau LRT Union Hospital Station in the Macau Special Administrative Region, China. This station is a core elevated interchange hub where the Taipa Line and Seac Pai Van Line of the Macau LRT System intersect (Figure 1) [39]. Located at the Rotunda Flor de Lótus, where Estrada Flor de Lótus and the Estrada do Istmo meet in the Cotai reclamation area, the station is adjacent to the outlying island medical complex, namely the Macau Medical Center of Peking Union Medical College Hospital (MCU) [40]. Utilizing a multi-level pedestrian bridge system, it achieves efficient and seamless connections between the light rail transit and large public medical buildings. The Macau Union Hospital Station integrates multiple functions, including daily commuting, medical treatment, and line transfers. It effectively alleviates traffic pressure between the Seac Pai Van public housing area and the Cotai area and is a typical example of Macau’s LRT + medical TOD model. It has now become a representative station in Macau’s LRT network that combines public service value with regional hub radiation effects.
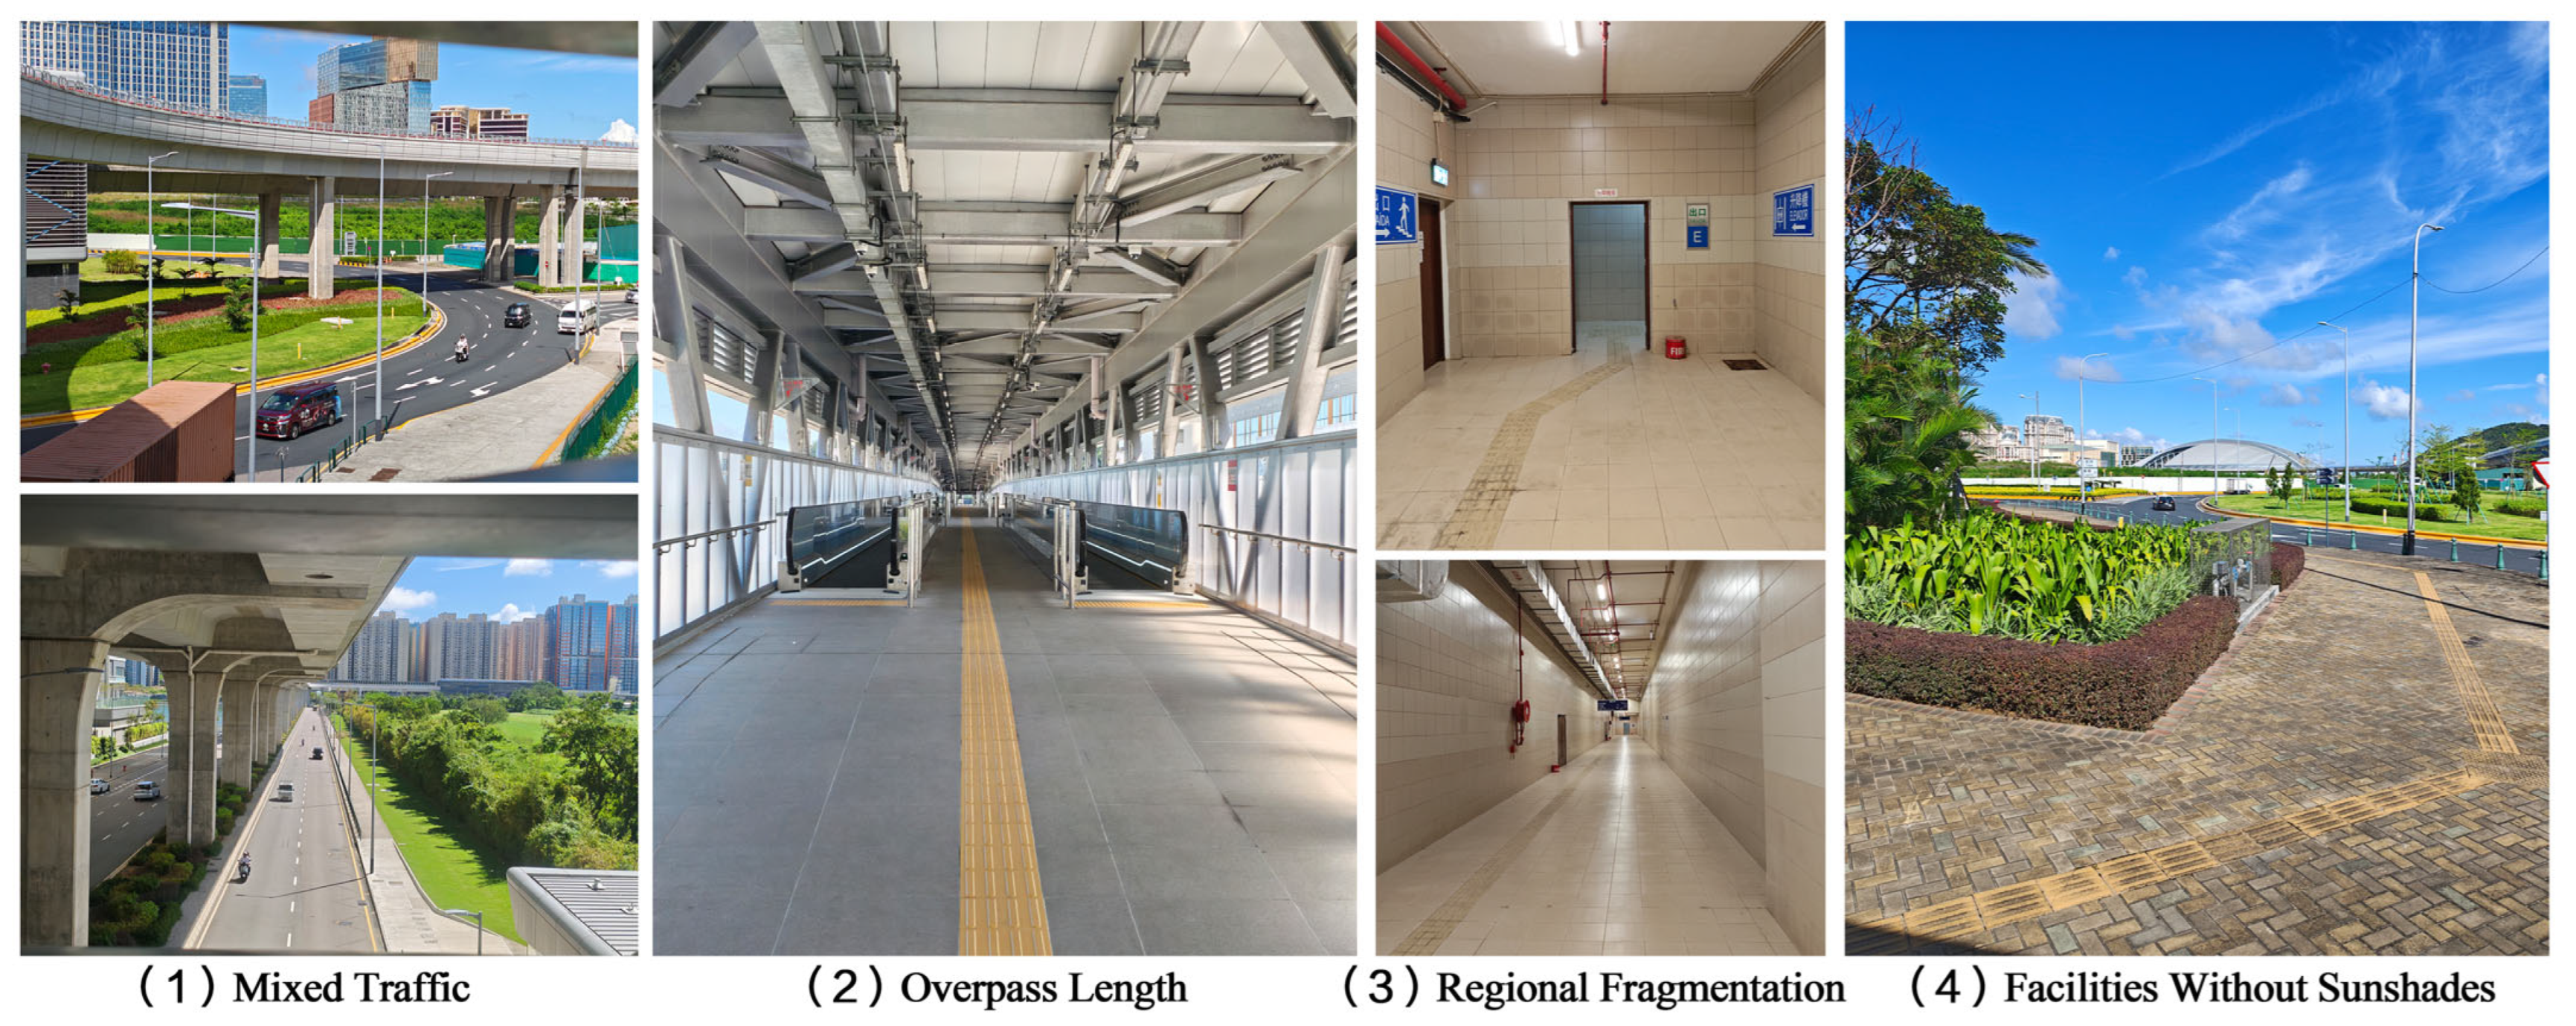
However, the current situation in the study area still presents two major problems: inefficient spatial connectivity and unfavorable simulated thermal conditions for pedestrians (Figure 2). On the one hand, the area’s slow-traffic system suffers from severe physical fragmentation, with prominent conflicts between pedestrians and vehicles. Pedestrian overpasses are too long, and underground passages are dimly lit, resulting in poor overall pedestrian accessibility and connectivity, making it difficult to satisfy basic travel demands of medical-related crowds. On the other hand, pedestrian zones feature inadequate shading layouts, resulting in high modelled heat exposure under standard meteorological inputs. The site has an excessively high proportion of hard paving and limited tree-covered shaded areas, leading to prominent heat stress risks in summer and uneven simulated thermal distribution. Such spatial drawbacks restrict the potential for shading-based thermal improvement of pedestrian environments.
Hospital-oriented development (HOD) areas and conventional transit-oriented development (TOD) areas differ fundamentally in their spatial requirements. Conventional TODs primarily cater to commuters, focusing on improving walking speed and transfer efficiency. HOD areas, on the other hand, primarily serve vulnerable groups such as patients, the elderly, pregnant women, and people with mobility impairments. These groups walk at a slower pace, have a higher demand for rest facilities along their routes, and exhibit lower tolerance for high temperatures and humidity, demonstrating significant heat sensitivity. Therefore, HOD areas require targeted shading-oriented spatial planning and a highly integrated spatial topology network to achieve simulated reduction of pedestrian heat exposure along connected pedestrian routes under standard meteorological conditions. This study covers the area from the central transfer roundabout of the LRT Union Hospital Station to the hospital’s main entrance. Under current conditions, the station’s ground-level intersections are the main points of pedestrian-vehicle conflict. Furthermore, the lack of continuous elevated sunshade facilities along the pedestrian route exposes pedestrians to strong solar radiation for extended periods, further exacerbating traffic obstruction and heat stress issues during the journey between the station and the hospital.

2.2. Solution Strategies and Conceptual Design

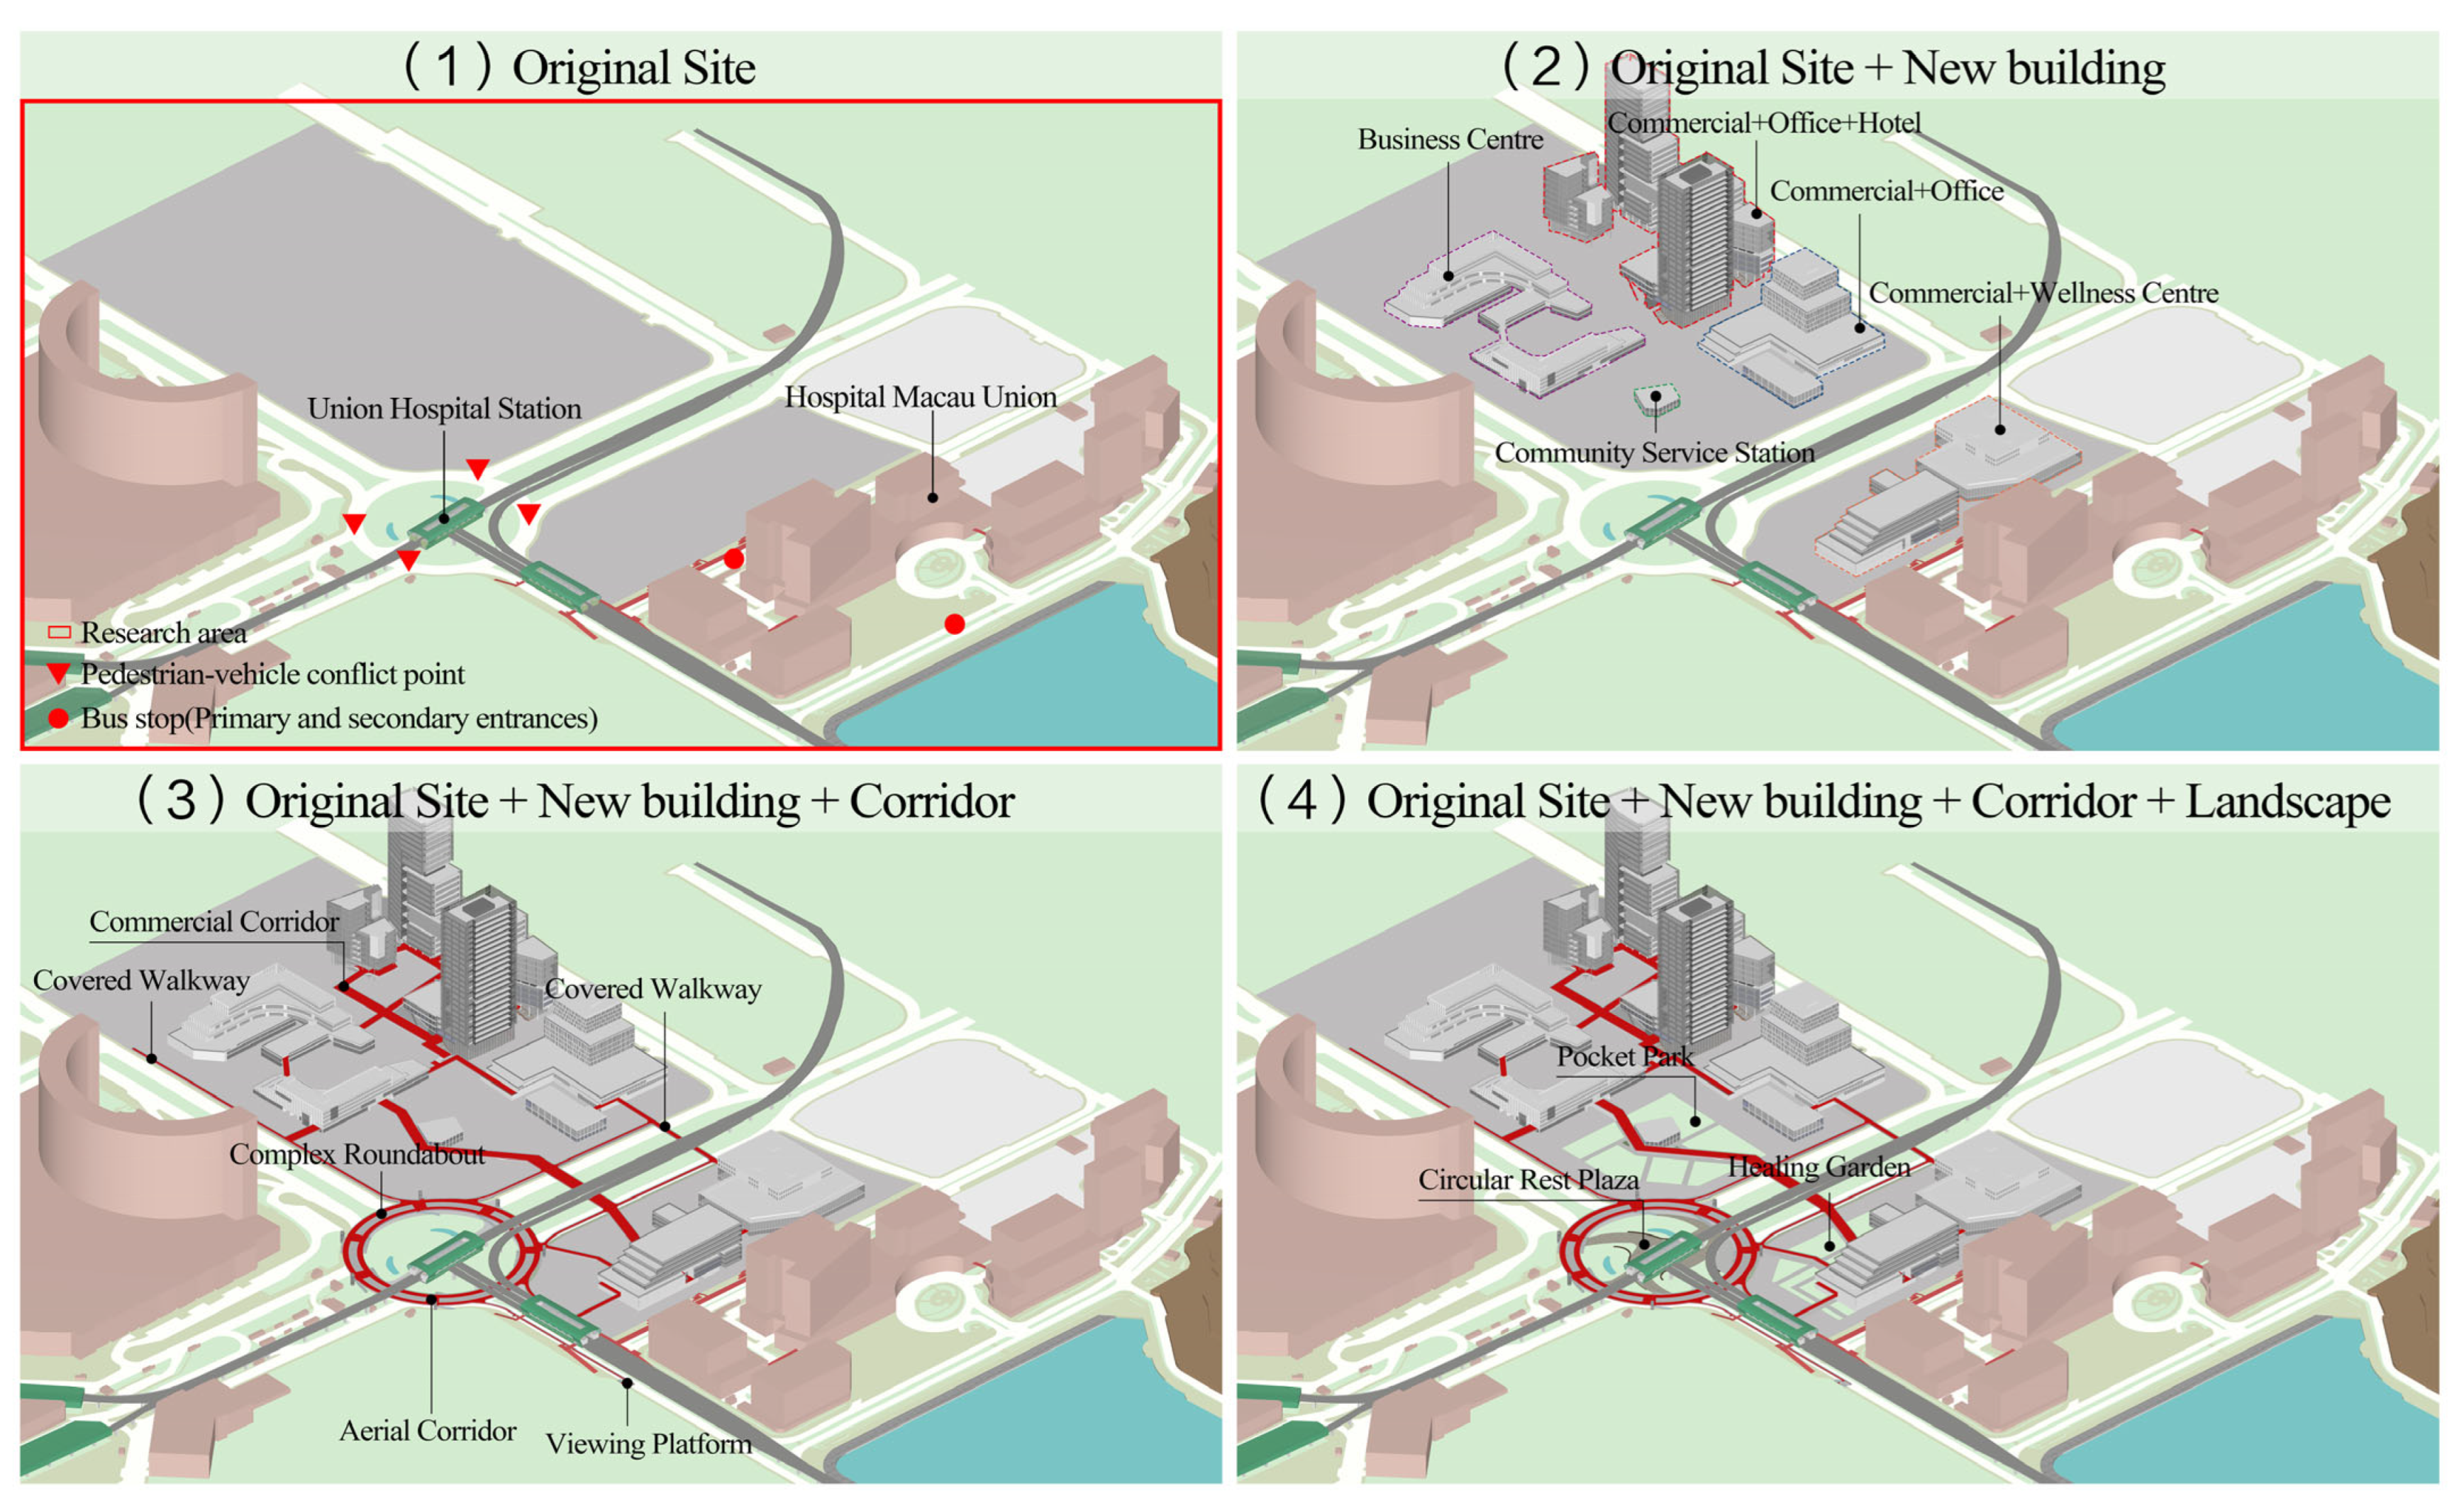
In response to the core issues mentioned above, and in conjunction with the development positioning of HOD, three specific optimization and improvement strategies are proposed (Figure 3). (1) Functional block integration optimization: planning and layout of commercial centers and commercial hotel complexes to improve the diverse supporting functions of the area. (2) Three-dimensional pedestrian network stitching and reshaping: building an integrated sky corridor and a whole-area covered walkway system to break down barriers to slow-moving spaces. (3) Shading-focused landscape layout adjustment: implanting composite island green configurations to enrich overhead shielding and lower modelled pedestrian heat exposure.

2.3. Analysis Methods

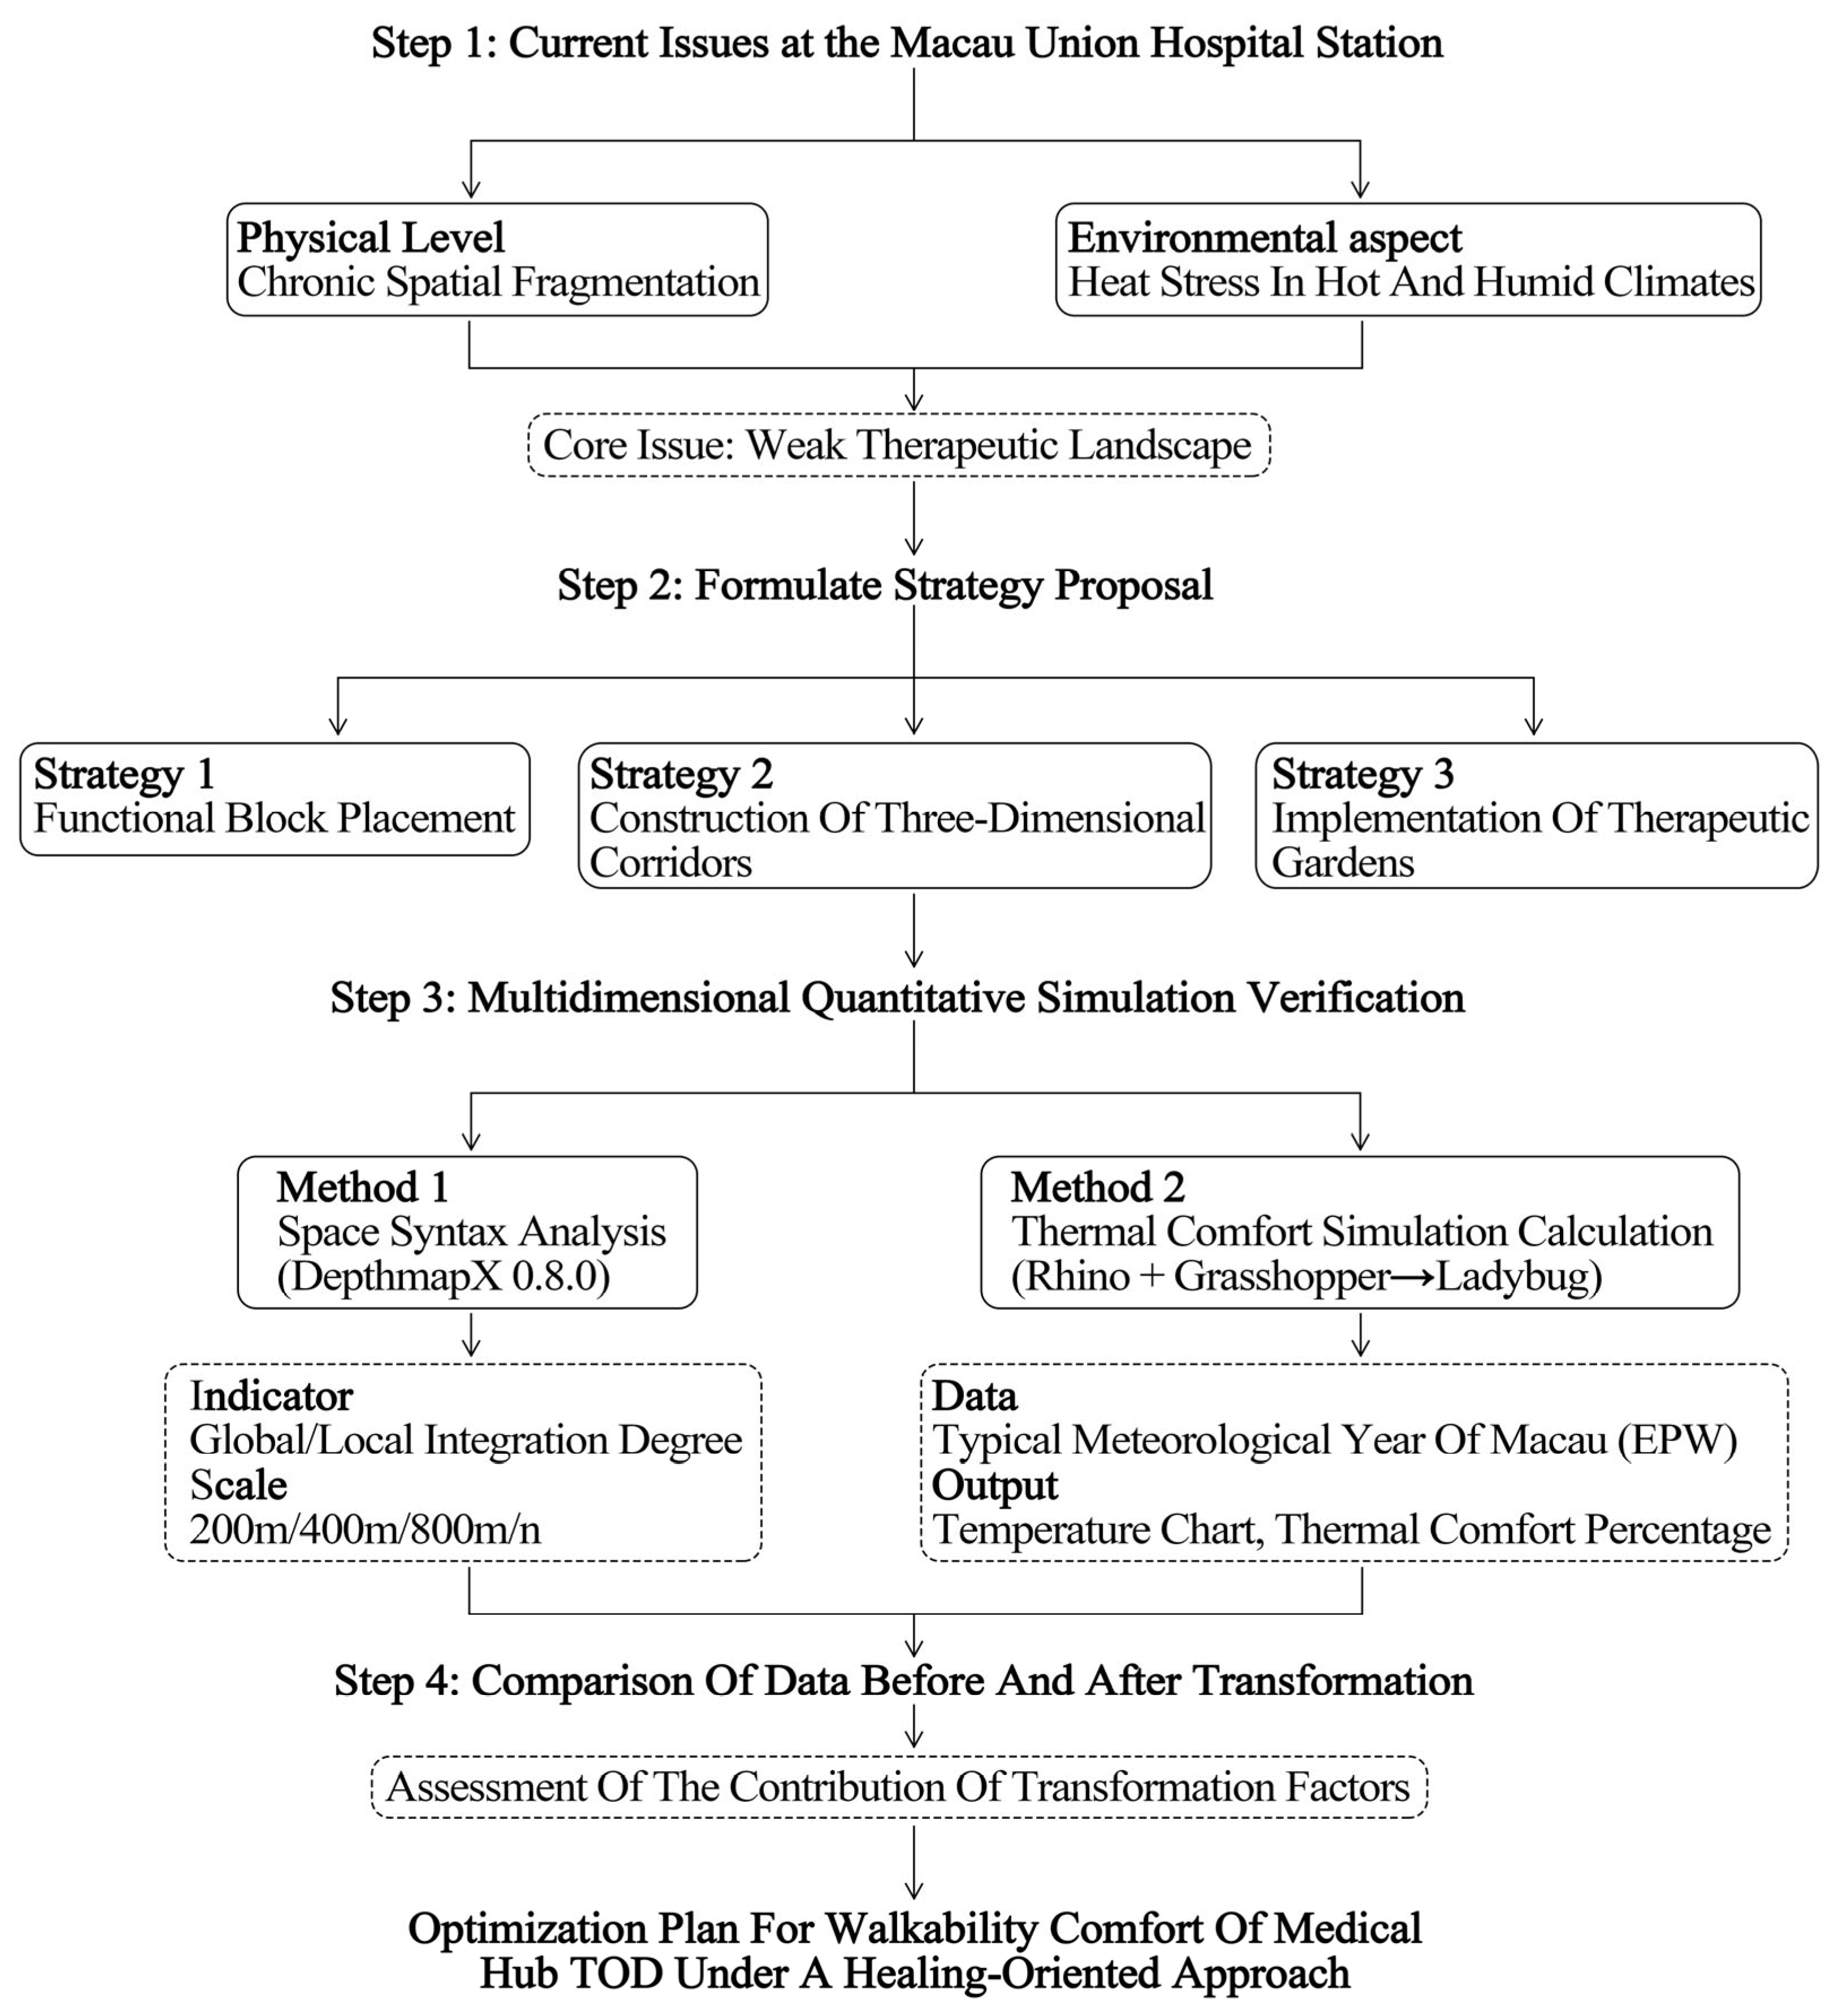
This study overcomes the limitations of a single spatial evaluation dimension by constructing a dual quantitative assessment framework of “topology-climate” suitable for HOD facilities. This framework conducts bidirectional validation of the same design strategy: using spatial syntax analysis, it examines the topology optimization effect of the spatial stitching scheme on the accessibility and connectivity of the pedestrian network. Simultaneously, relying on Ladybug/UTCI parametric simulation with standardized EPW inputs, it assesses simulated heat stress reduction potential of the pedestrian network under defined hot-humid meteorological conditions.
At the methodological and theoretical level, this framework addresses the shortcomings of traditional TOD studies, which focus primarily on traffic efficiency, and single-microclimate studies, which only focus on local thermal environments. Considering the high sensitivity of patients, the elderly, and other healthcare populations to accessibility barriers and thermal stress, this study proposes a comprehensive assessment approach that coordinates spatial connectivity and modelled thermal performance, forming a new evaluation paradigm. This paradigm can provide a complete and scientific closed-loop verification system for the early planning and design scheme demonstration of HOD areas (Figure 4).
This method comprehensively utilizes DepthMapX 0.8.0 to conduct multi-scale (200 m, 400 m, 800 m, and n-radius) topological analysis of global and local integration. Parametric simulation-based thermal assessment was performed using the Ladybug Tools plugin under the Rhino-Grasshopper platform, importing typical meteorological year (TMY) epw (Energy Plus Weather) data from Macau. Through horizontal comparative analysis of core indicators such as simulated UTCI distribution and the proportion of routes with reduced modelled heat exposure, the system systematically identified the intervention efficacy of different modification scenarios in cutting down simulated heat stress, without evaluating practical health-related site functions, thus providing a data-driven scientific decision-making paradigm for the optimized design of pedestrian networks in medical hubs.

2.3.1. Space Syntax Analysis

Quantitative verification of pedestrian connectivity was conducted using space syntax. Global integration and local integration were used as core evaluation indicators, with values of 200 m, 400 m, 800 m, and a global radius of n. The effect of the three-dimensional corridor on improving the spatial topological connectivity of the area was quantitatively assessed.
The operation process is as follows: (1) Based on Google Maps, the research site area was captured, and a model of the existing pedestrian line segments was drawn using CAD. The pedestrian route of the three-dimensional corridor after modification was added to the existing line segments, and two sets of DXF files were exported. (2) The files were imported into DepthmapX 0.8.0 software, a new project was created, and the base map was imported, converting it to generate a segment map line segment model. The angle line segment analysis tool was called, the radius type was selected as metric, and 200 m, 400 m, 800 m, and a global radius of n were set sequentially. The remaining parameters were kept at their default values, and the calculation was run. (3) The analysis results were exported as EPS format, and then the drawing was optimized and visualized using Adobe Illustrator (version 15.0).
To ensure the rigor and repeatability of the spatial topology analysis, this study established the following specific rules for line segment model construction and abstraction:
(1) Network Abstraction and Research Boundary: The research boundary is centered on the LRT Union Hospital Station, covering the main exit commuter flow and medical visit flow. The network extraction rule is to extract the center lines of all open pedestrian walkways, zebra crossings, and plaza passage areas in Google Maps.
(2) Topological Dimensionality Reduction from 3D to 2D: For the “original site + three-dimensional corridor” scenario, this study vertically projects the proposed three-dimensional corridor pedestrian path into two-dimensional planar line segments, which are then directly superimposed onto the existing pedestrian network. Vertical traffic connection nodes between the corridor and the ground (such as escalators and elevator entrances/exits) are uniformly set as two-dimensional topological intersection nodes.
(3) Line segment breakage and parameter settings: All walking line segments are uniformly broken at physical intersection nodes. After importing the model into DepthmapX 0.8.0, the method for analyzing angle line segments is adopted, and the actual length in metric units is used as the calculation weight. When calculating the global or local average integration degree, the arithmetic mean of all valid calculated line segments in the model is taken as the result.

2.3.2. Simulation and Quantification of Pedestrian Thermal Comfort Paths

This study conducted simulation analysis based on the Ladybug Tools platform. The meteorological boundary data was obtained from the typical meteorological year EPW file (2004–2018) for Macau, provided by the platform’s official meteorological map (https://www.ladybug.tools/epwmap/, accessed on 25 April 2026). This file was generated based on the Chinese Standard Weather Data (CSWD) and is EnergyPlus meteorological data in the standard format of typical meteorological year (TMY). It can serve as the basic boundary condition for microclimate simulation, ensuring that the simulation results have excellent regional climate representativeness.
This simulation aims to compare changes in site solar radiation exposure under different spatial interventions, such as new building volumes, connecting corridor shading, and vegetation blocking, to assess the microclimate adaptation potential of the initial design scheme. This phase of the study focuses on exploring the moderating effect of geometric shading on mean radiant temperature (MRT). The simulation process directly utilizes uniform hourly meteorological data from the EPW file, including air temperature, wind speed, and relative humidity. Due to computational resource limitations, this study did not incorporate computational fluid dynamics (CFD) for local wind field simulation, nor did it perform spatial differentiation processing for relative humidity. All thermal results in this paper are obtained from numerical simulation. The climate model is built based on standard EPW data and geometric shelter analysis, without on-site measurement and model calibration.
The study sets up a comparative experiment between the current site conditions and the planned renovation scheme. The existing pedestrian paths, which are highly open and lack physical shelter, are compared with the renovated pedestrian network, which relies on the new building volume, landscape corridors, and the canopy of trees in the comfortable garden to form continuous shade. The study quantitatively analyzes the improvement effect of various spatial elements on the local thermal environment.
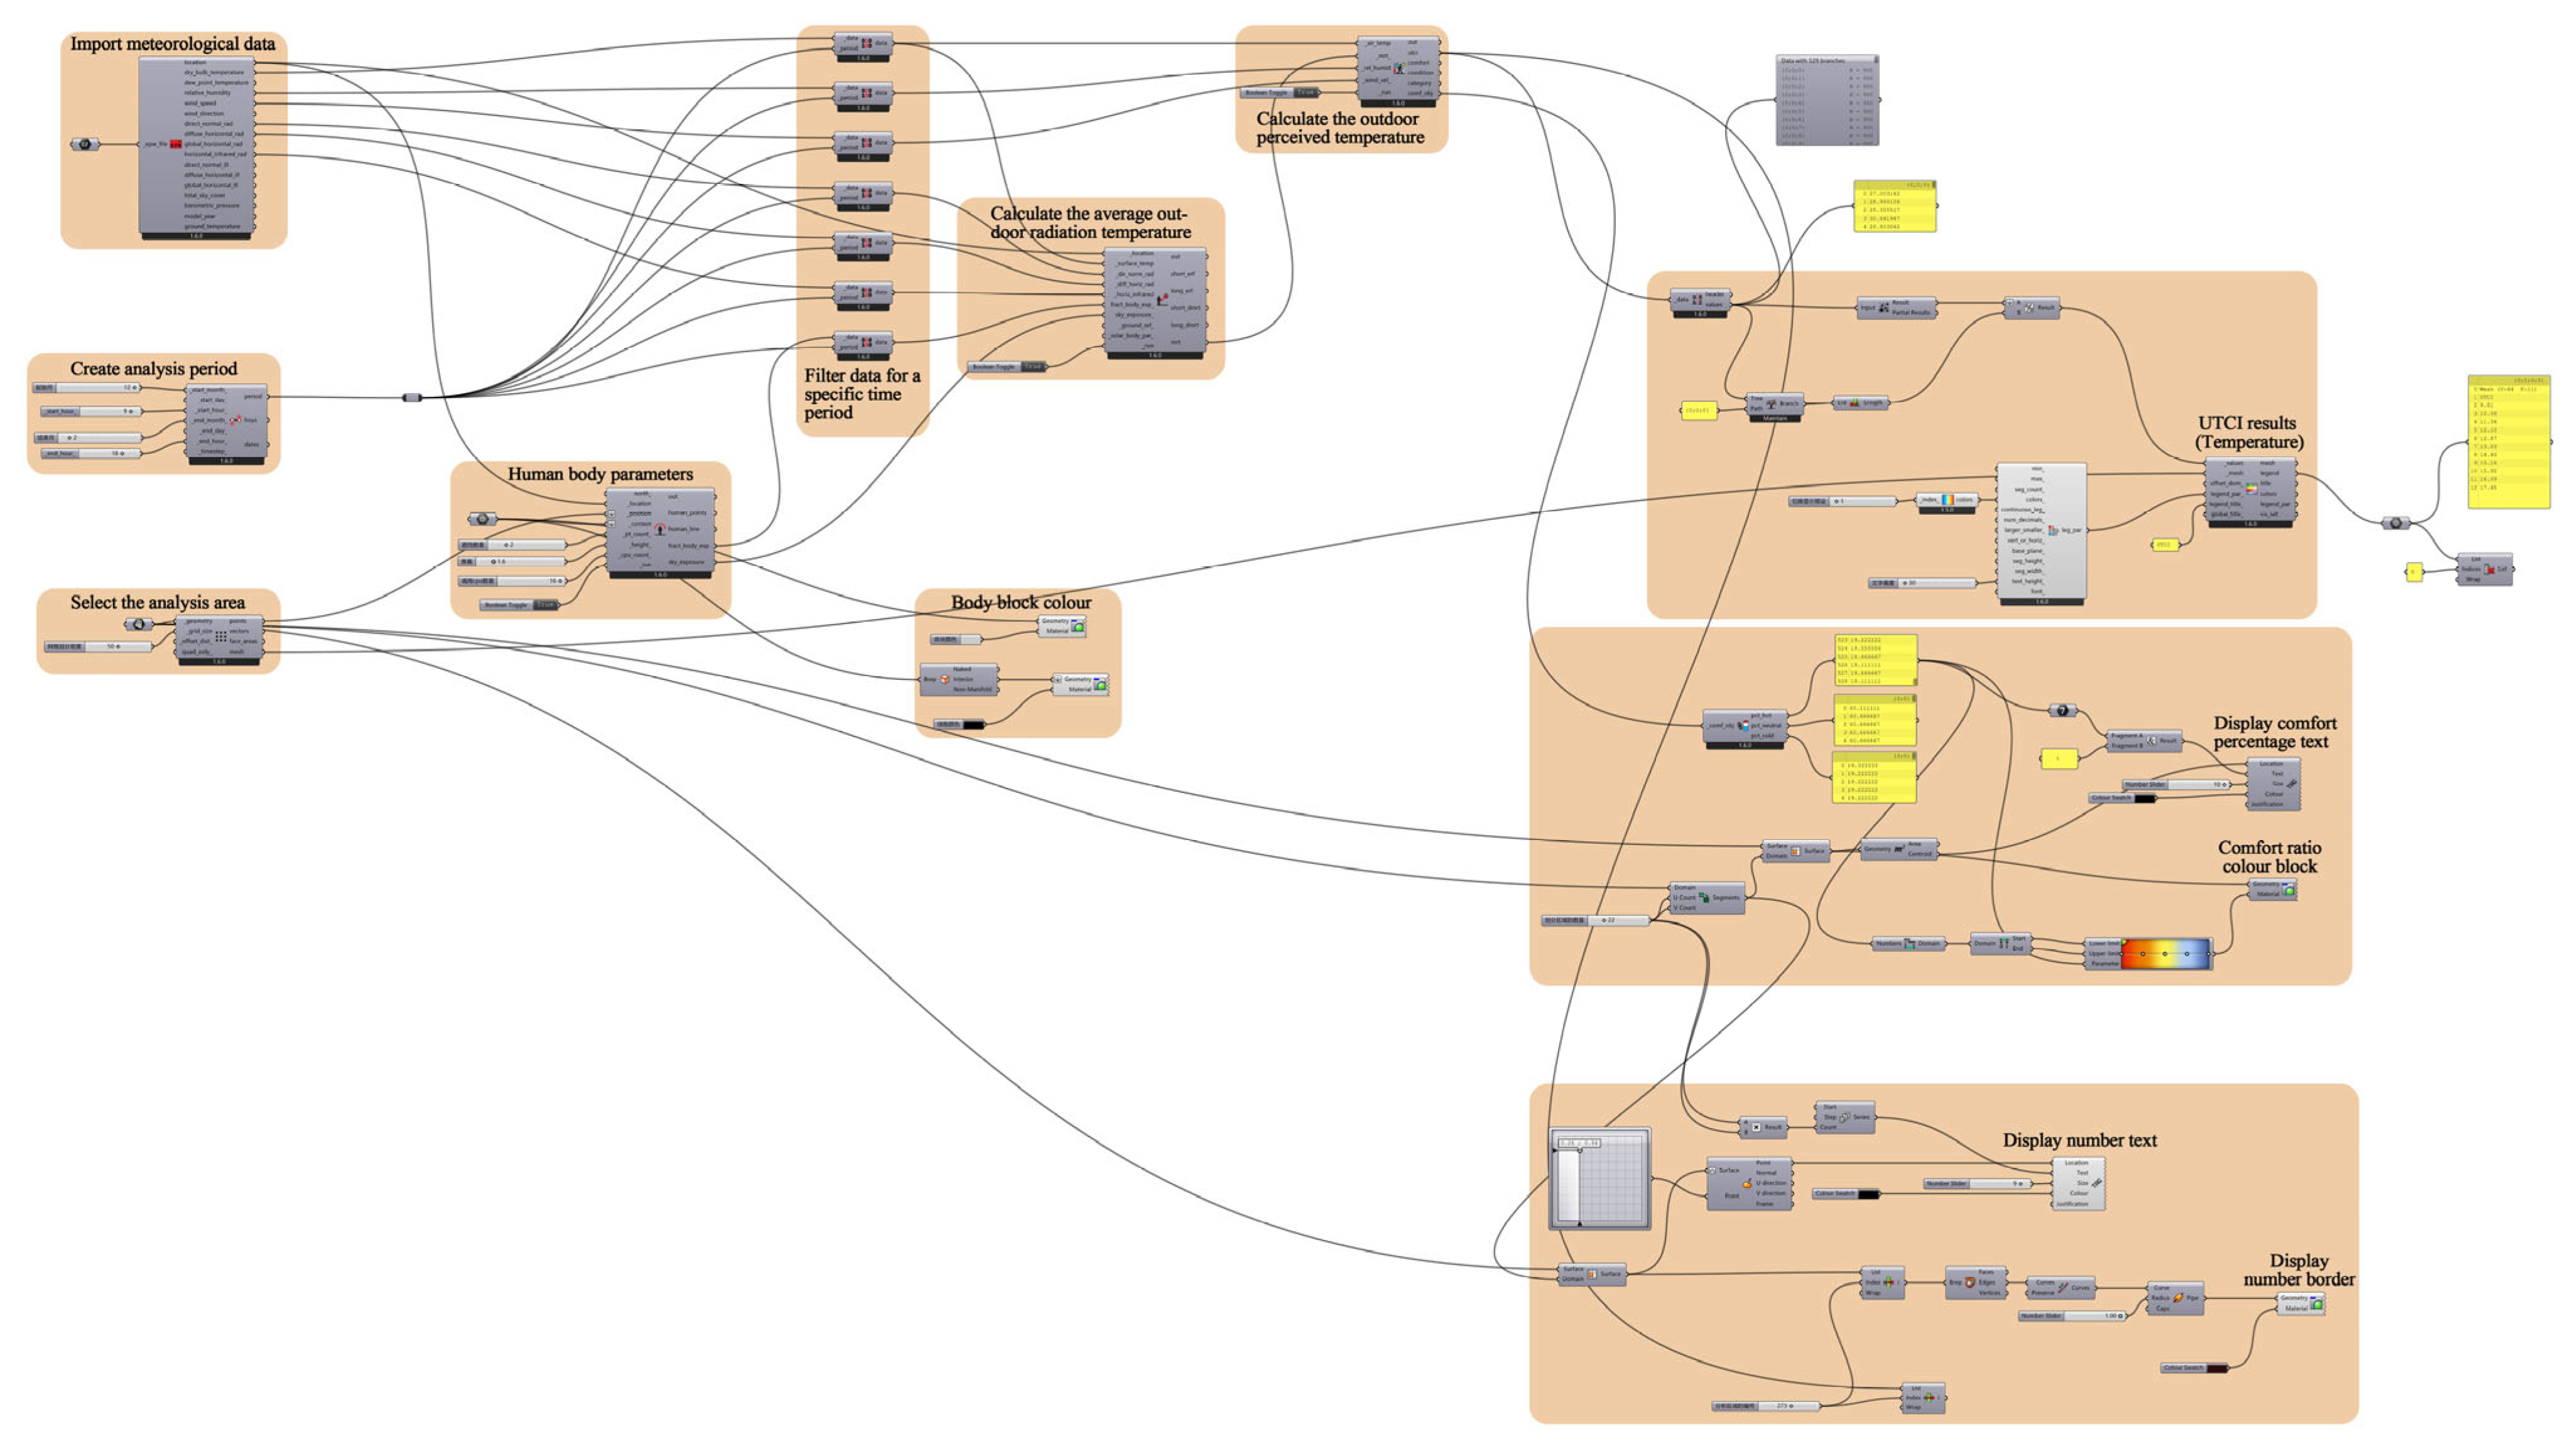
At the technical implementation level, a three-dimensional geometric model of the site was first constructed using Rhino 8 software. This model was then imported into the Grasshopper parametric platform, and a visual computational workflow was built (see Figure 5). Through simulation calculations, the site temperature distribution map and the percentage of thermal comfort levels were output. The study combined the UTCI simulation results for in-depth analysis, selecting the spatial design strategies with the most significant thermal comfort improvement effects and the most suitable for creating a pleasant and comfortable outdoor environment, providing scientific quantitative support for subsequent design decisions. To ensure the reproducibility of the research, Table 1 details the core input parameters and model setting standards required for UTCI calculation.
The Universal Thermal Climate Index (UTCI) is a comprehensive biometeorological index based on human thermophysiology, and it is now widely used for evaluating outdoor thermal comfort. This index is calculated from four core environmental parameters: air temperature, mean radiant temperature (MRT), relative humidity (RH), and wind speed. In this parametric simulation workflow based on Ladybug Tools, air temperature, relative humidity, and wind speed were uniform hourly meteorological data across the entire region, directly extracted and retrieved from the EPW file of a typical meteorological year in Macau. MRT was calculated spatially using the software’s radiation analysis module. This module, considering the site’s three-dimensional spatial morphology, fully takes into account the blocking effects of building volumes, elevated walkways, and vegetation on shortwave solar radiation, as well as the site’s longwave radiation exchange patterns, thereby correcting the radiation exposure level at a pedestrian height of 1.6 m. Ultimately, this achieves direct coupling between spatial topology design and human thermal stress results.
The next step was to construct a site model of the area surrounding the Macau LRT Union Hospital Station before and after the renovation to identify changes in the regional thermal environment. The simulation was divided into two periods: a full 24 h period and a core daytime activity period (9:00–18:00). The differences in the thermal environment before and after the renovation and during the activity period were compared and analyzed to evaluate the health-supportive intervention efficacy of the site. This study analyzed the changes in the thermal environment according to the seasonal dimension to quantify the dynamic fluctuations in temperature. Combining the meteorological characteristics of Macau, the study divided the observation period into spring (March–May), summer (June–August), autumn (September–November), and winter (December–February) and carried out comparative evaluation from the following three dimensions. This analysis can be further divided into three comparisons: (1) the comparison of the annual temperature (measured over 24 h) before and after the renovation with the temperature during the core daytime activity period (9:00–18:00) throughout the year. (2) the comparison between the seasonal temperature (24 h) before and after the renovation and the temperature during the core daytime activity period (9:00–18:00) in each season. (3) Comparison of thermal comfort during the four seasons (24 h) and the core daytime activity period (9:00–18:00) before and after the renovation.
UTCI was adopted as the core indicator for evaluating thermal comfort. Based on internationally accepted standards and combined with the climatic characteristics of hot and humid regions, an evaluation system as shown in Table 2 was constructed. The system divides the thermal environment into three core ranges: (1) Moderate range (no thermal stress): UTCI 9.0~26.0 °C, which is the thermal comfort state of the human body, with relatively low physiological regulatory pressure. (2) Thermal stress range: UTCI > 26.0 °C, which is divided into moderate thermal stress (26.0~32.0 °C), strong thermal stress (32.0~38.0 °C), very strong thermal stress (38.0~46.0 °C), and extreme thermal stress (>46.0 °C) as the temperature increases, with the human body experiencing thermal discomfort and health risks increasing step by step. (3) Cold stress range: UTCI < 9.0 °C, which is divided into slight cold stress (0~9.0 °C), moderate cold stress (−13.0~0 °C), strong cold stress (−27.0~−13.0 °C), severe cold stress (−40.0~−27.0 °C), and extreme cold stress (<−40.0 °C) as the temperature decreases, with the human body experiencing cold discomfort and health risks increasing step by step.

3. Results

3.1. Accessibility Verification of Continuous Slow-Moving Network

Based on multi-scale topological map comparison using space syntax, the newly installed three-dimensional corridors significantly optimized the slow-moving network structure of the area, effectively reducing traffic resistance in core functional areas.
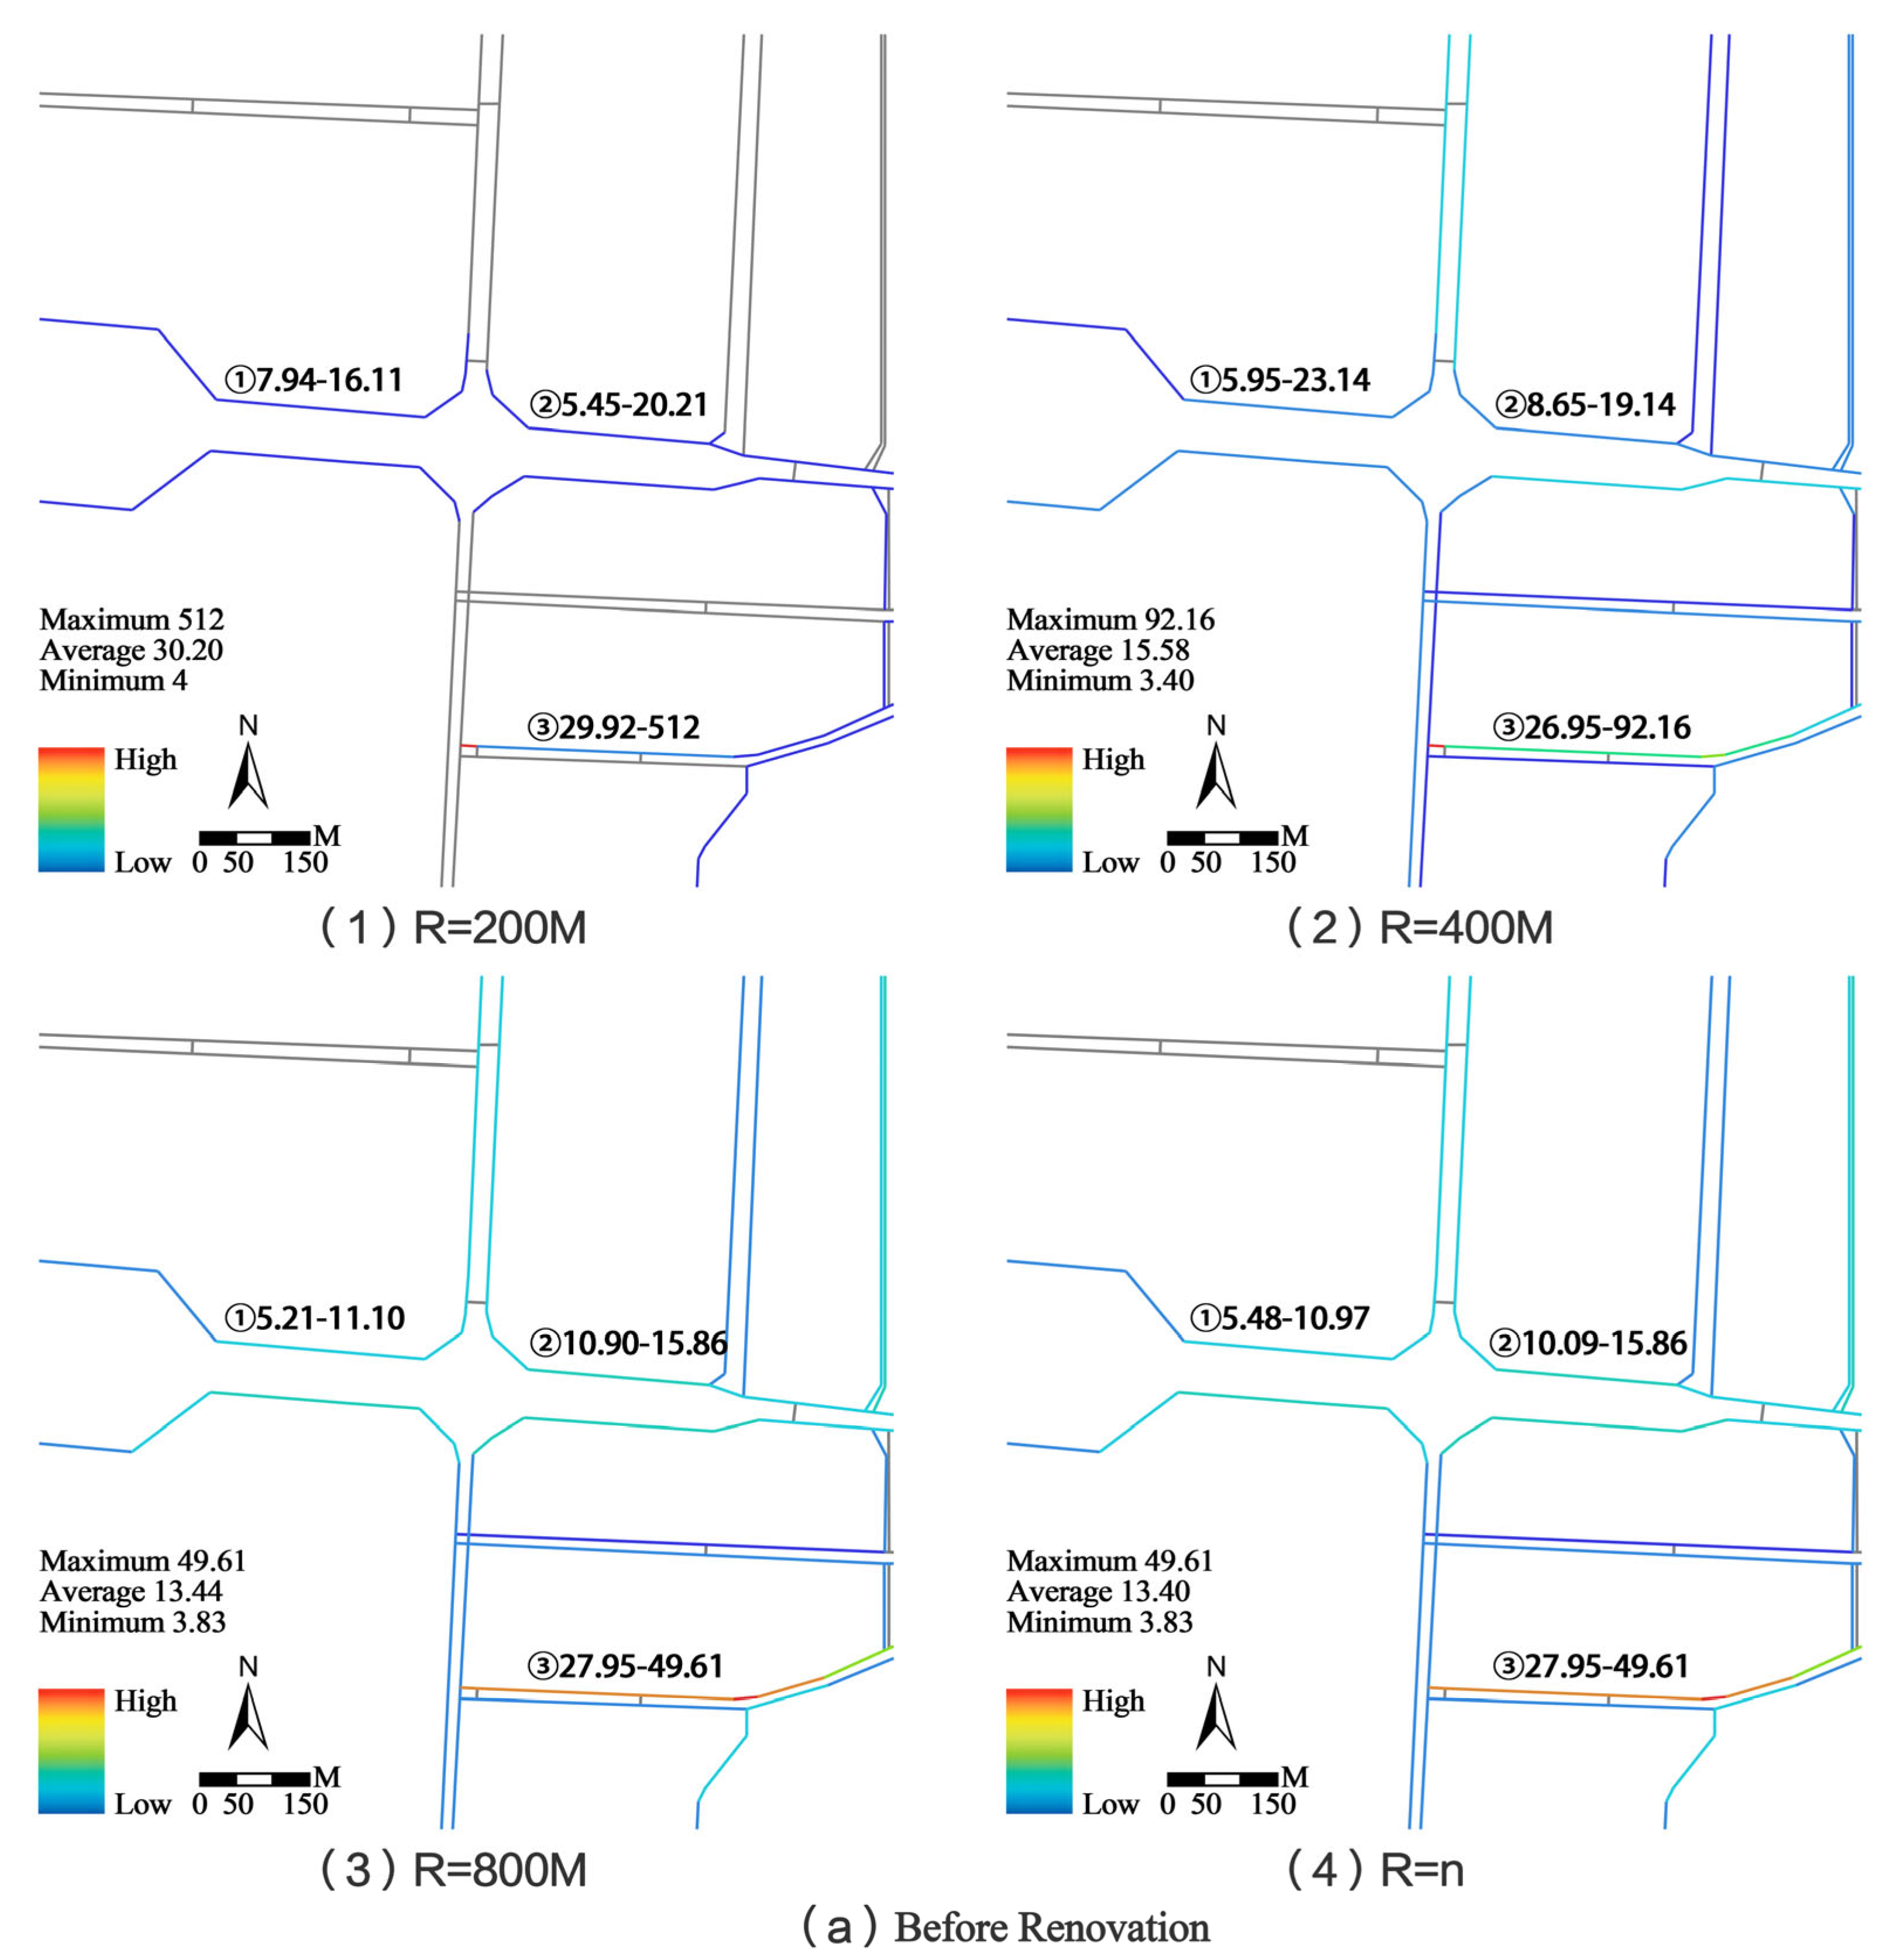
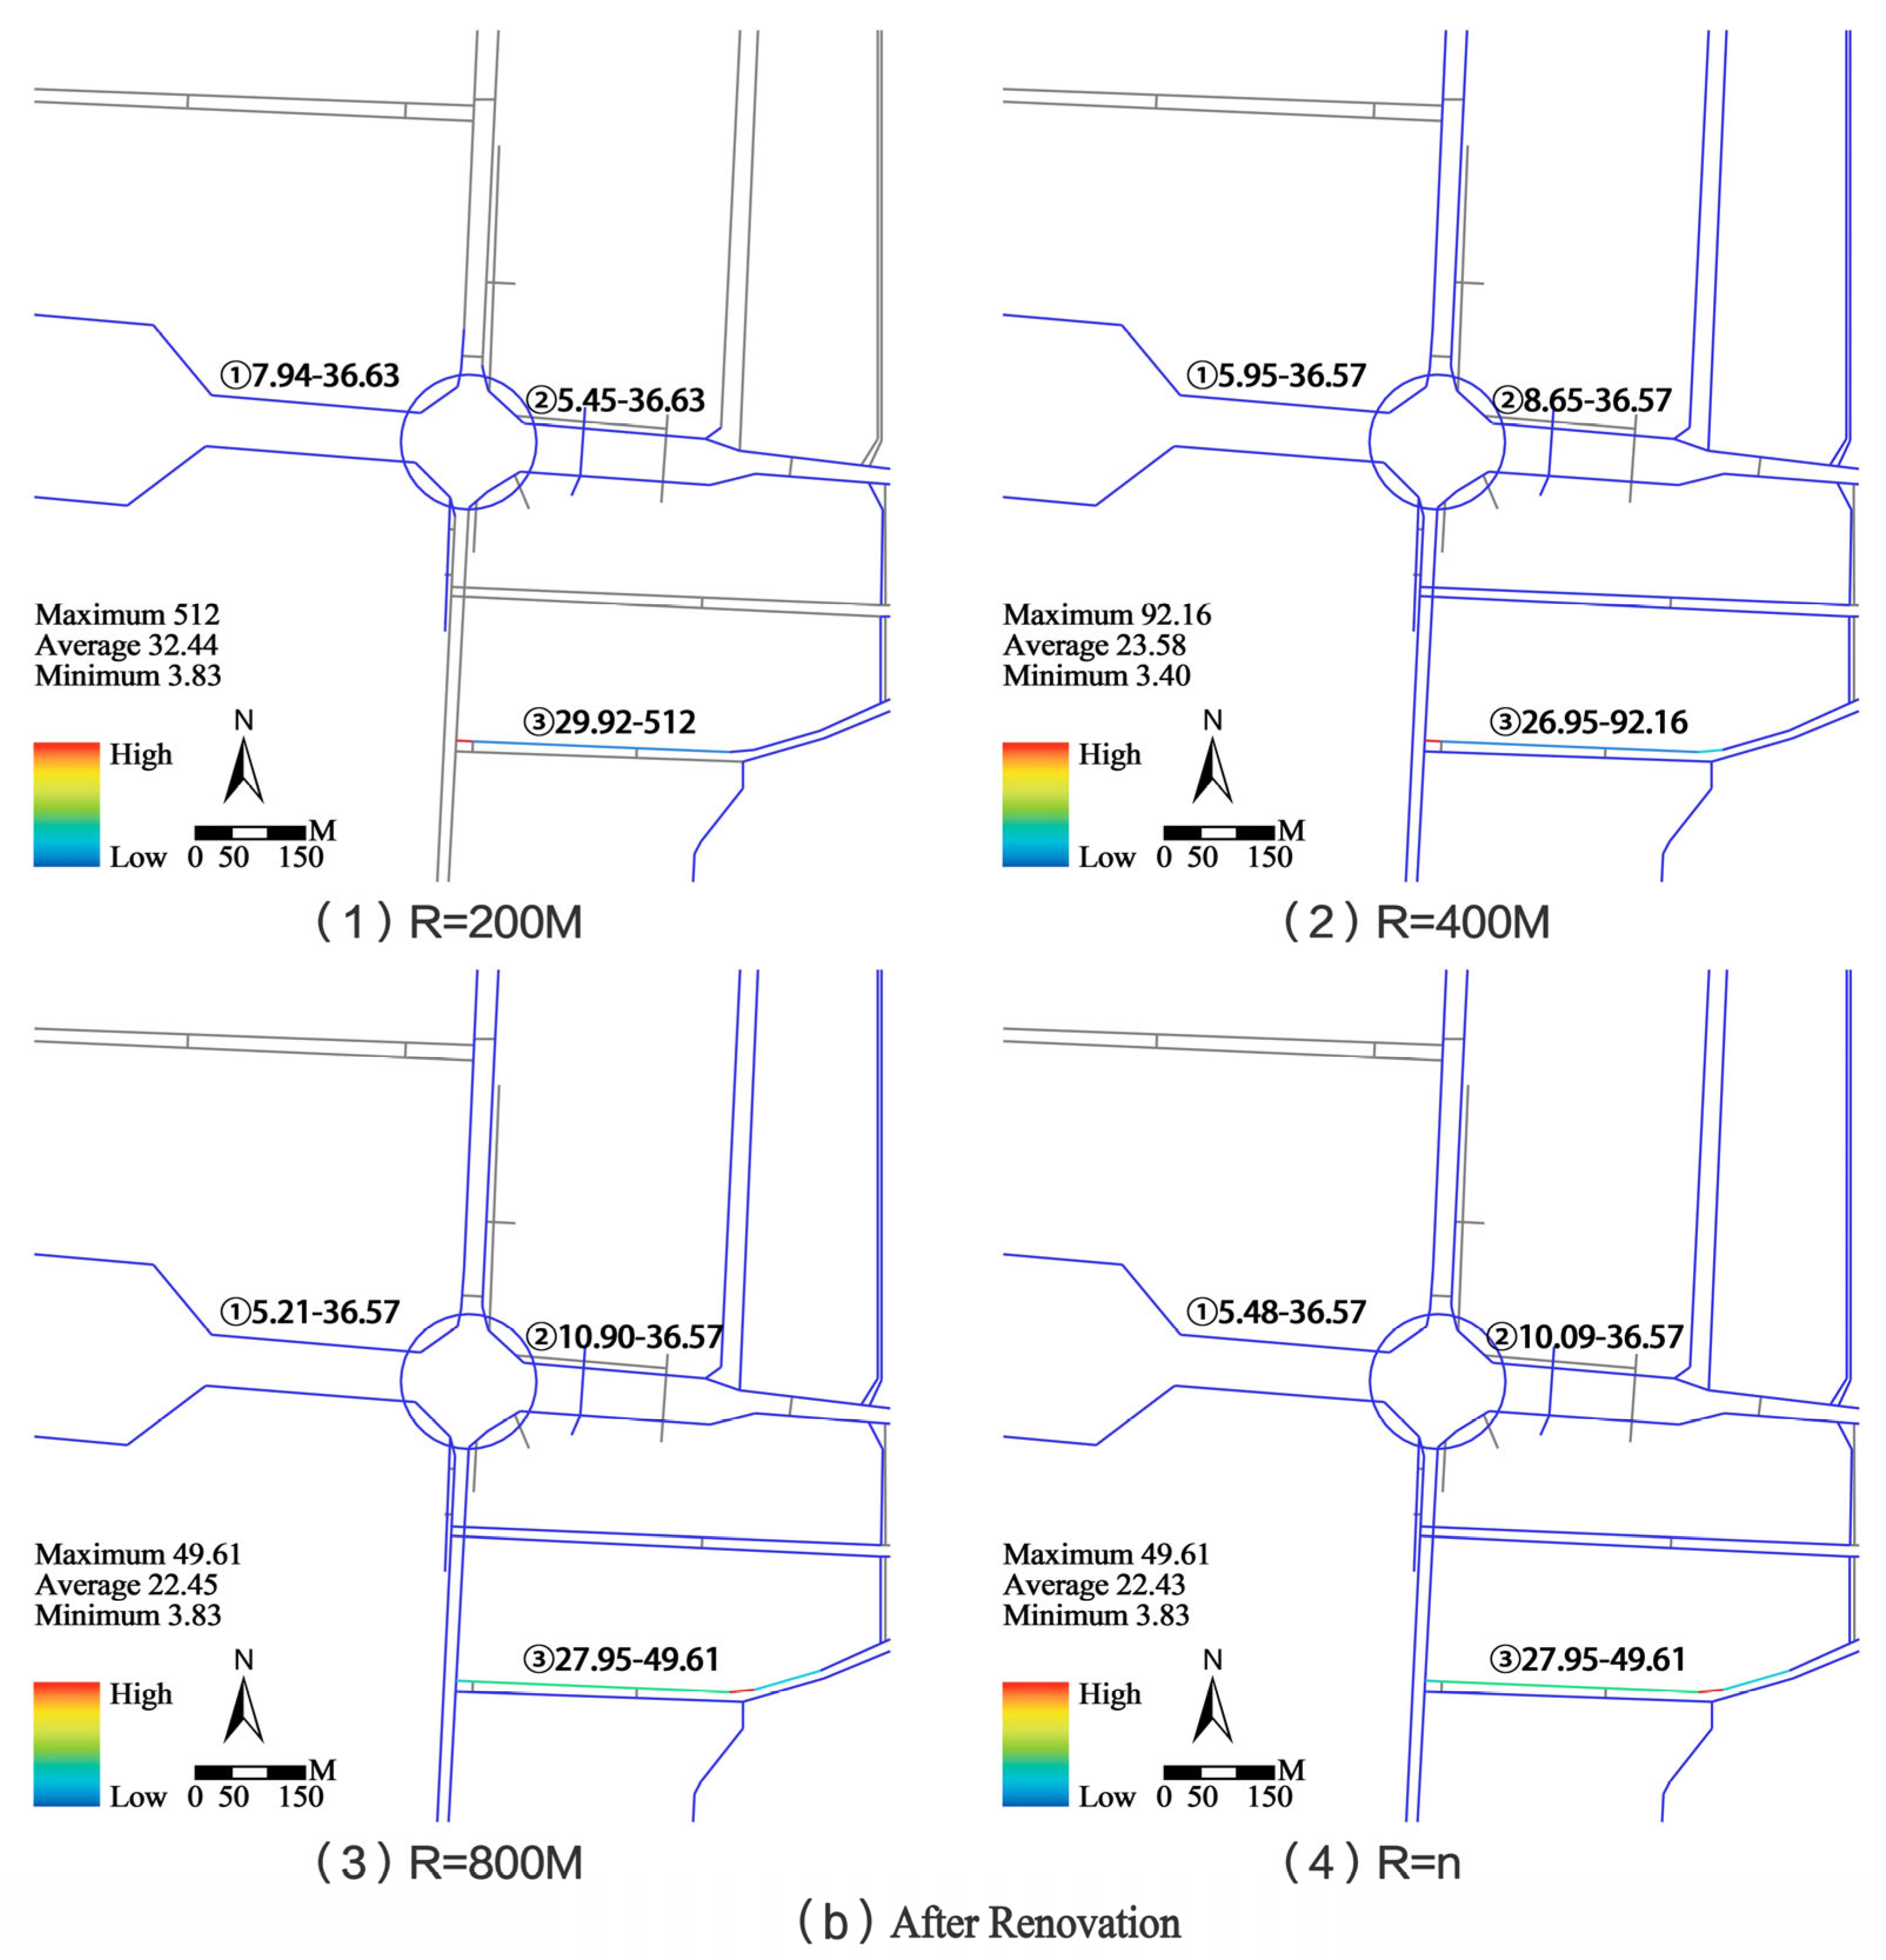
First, at global radii R = n and R = 800 m, the overall network connectivity efficiency of the area achieved significant improvement. Comparing the data before the upgrade (Figure 6), the average integration scores for the area at R = n and R = 800 m were low, at 13.40 and 13.44, respectively, which reflected the inconvenience to pedestrians caused by the fragmentation of main traffic arteries. After the addition of the three-dimensional corridors for three-dimensional integration, these two indicators jumped to 22.43 and 22.45, respectively, an increase of approximately 67.0%. This evidence strongly demonstrates from a global quantitative perspective that the newly added three-dimensional pedestrian system broke down the original physical barriers and significantly reduced the global topological depth between Macau LRT Station, Union Hospital, and the commercial area.
Second, the renovation further amplified the traffic distribution capacity and accessibility advantages of core nodes at R = 400 m and R = 200 m. After the renovation, the average integration degree of R = 400 m significantly improved from 15.58 to 23.58. The distribution clearly shows that the radial paths centered on the light rail station’s central roundabout exhibit a more uniform color tone after the renovation (Figure 6b). The upper limit threshold of integration degree for the central nodes (paths ① and ② marked in Figure 6) increased dramatically from the 10–15 range to 36.57 at global radii R = n and R = 800 m. This indicates that the three-dimensional corridor successfully transformed the previously loosely connected sidewalks into high-frequency, highly accessible, and vibrant axes.
In summary, the above data shows that the three-dimensional stitching strategy not only achieved pedestrian-vehicle separation in three-dimensional space but also reconstructed the slow-traffic framework of the area in terms of spatial topology. It effectively eliminated the physical and psychological barriers for patients and commuters crossing the area between the “rail transit-medical-commercial nodes,” fundamentally enhancing the pedestrian accessibility and health-supportive spatial experience in the HOD core area.

3.2. Walking Thermal Comfort Assessment Results

This study conducted parametric simulation-based microclimate assessment on the site of the Macau LRT Union Hospital Station. From two dimensions—24 h simulation throughout the year and the core daytime activity period (9:00–18:00)—the effects of the three-dimensional suturing and healing landscape design strategies on mitigating site heat stress were quantitatively analyzed.
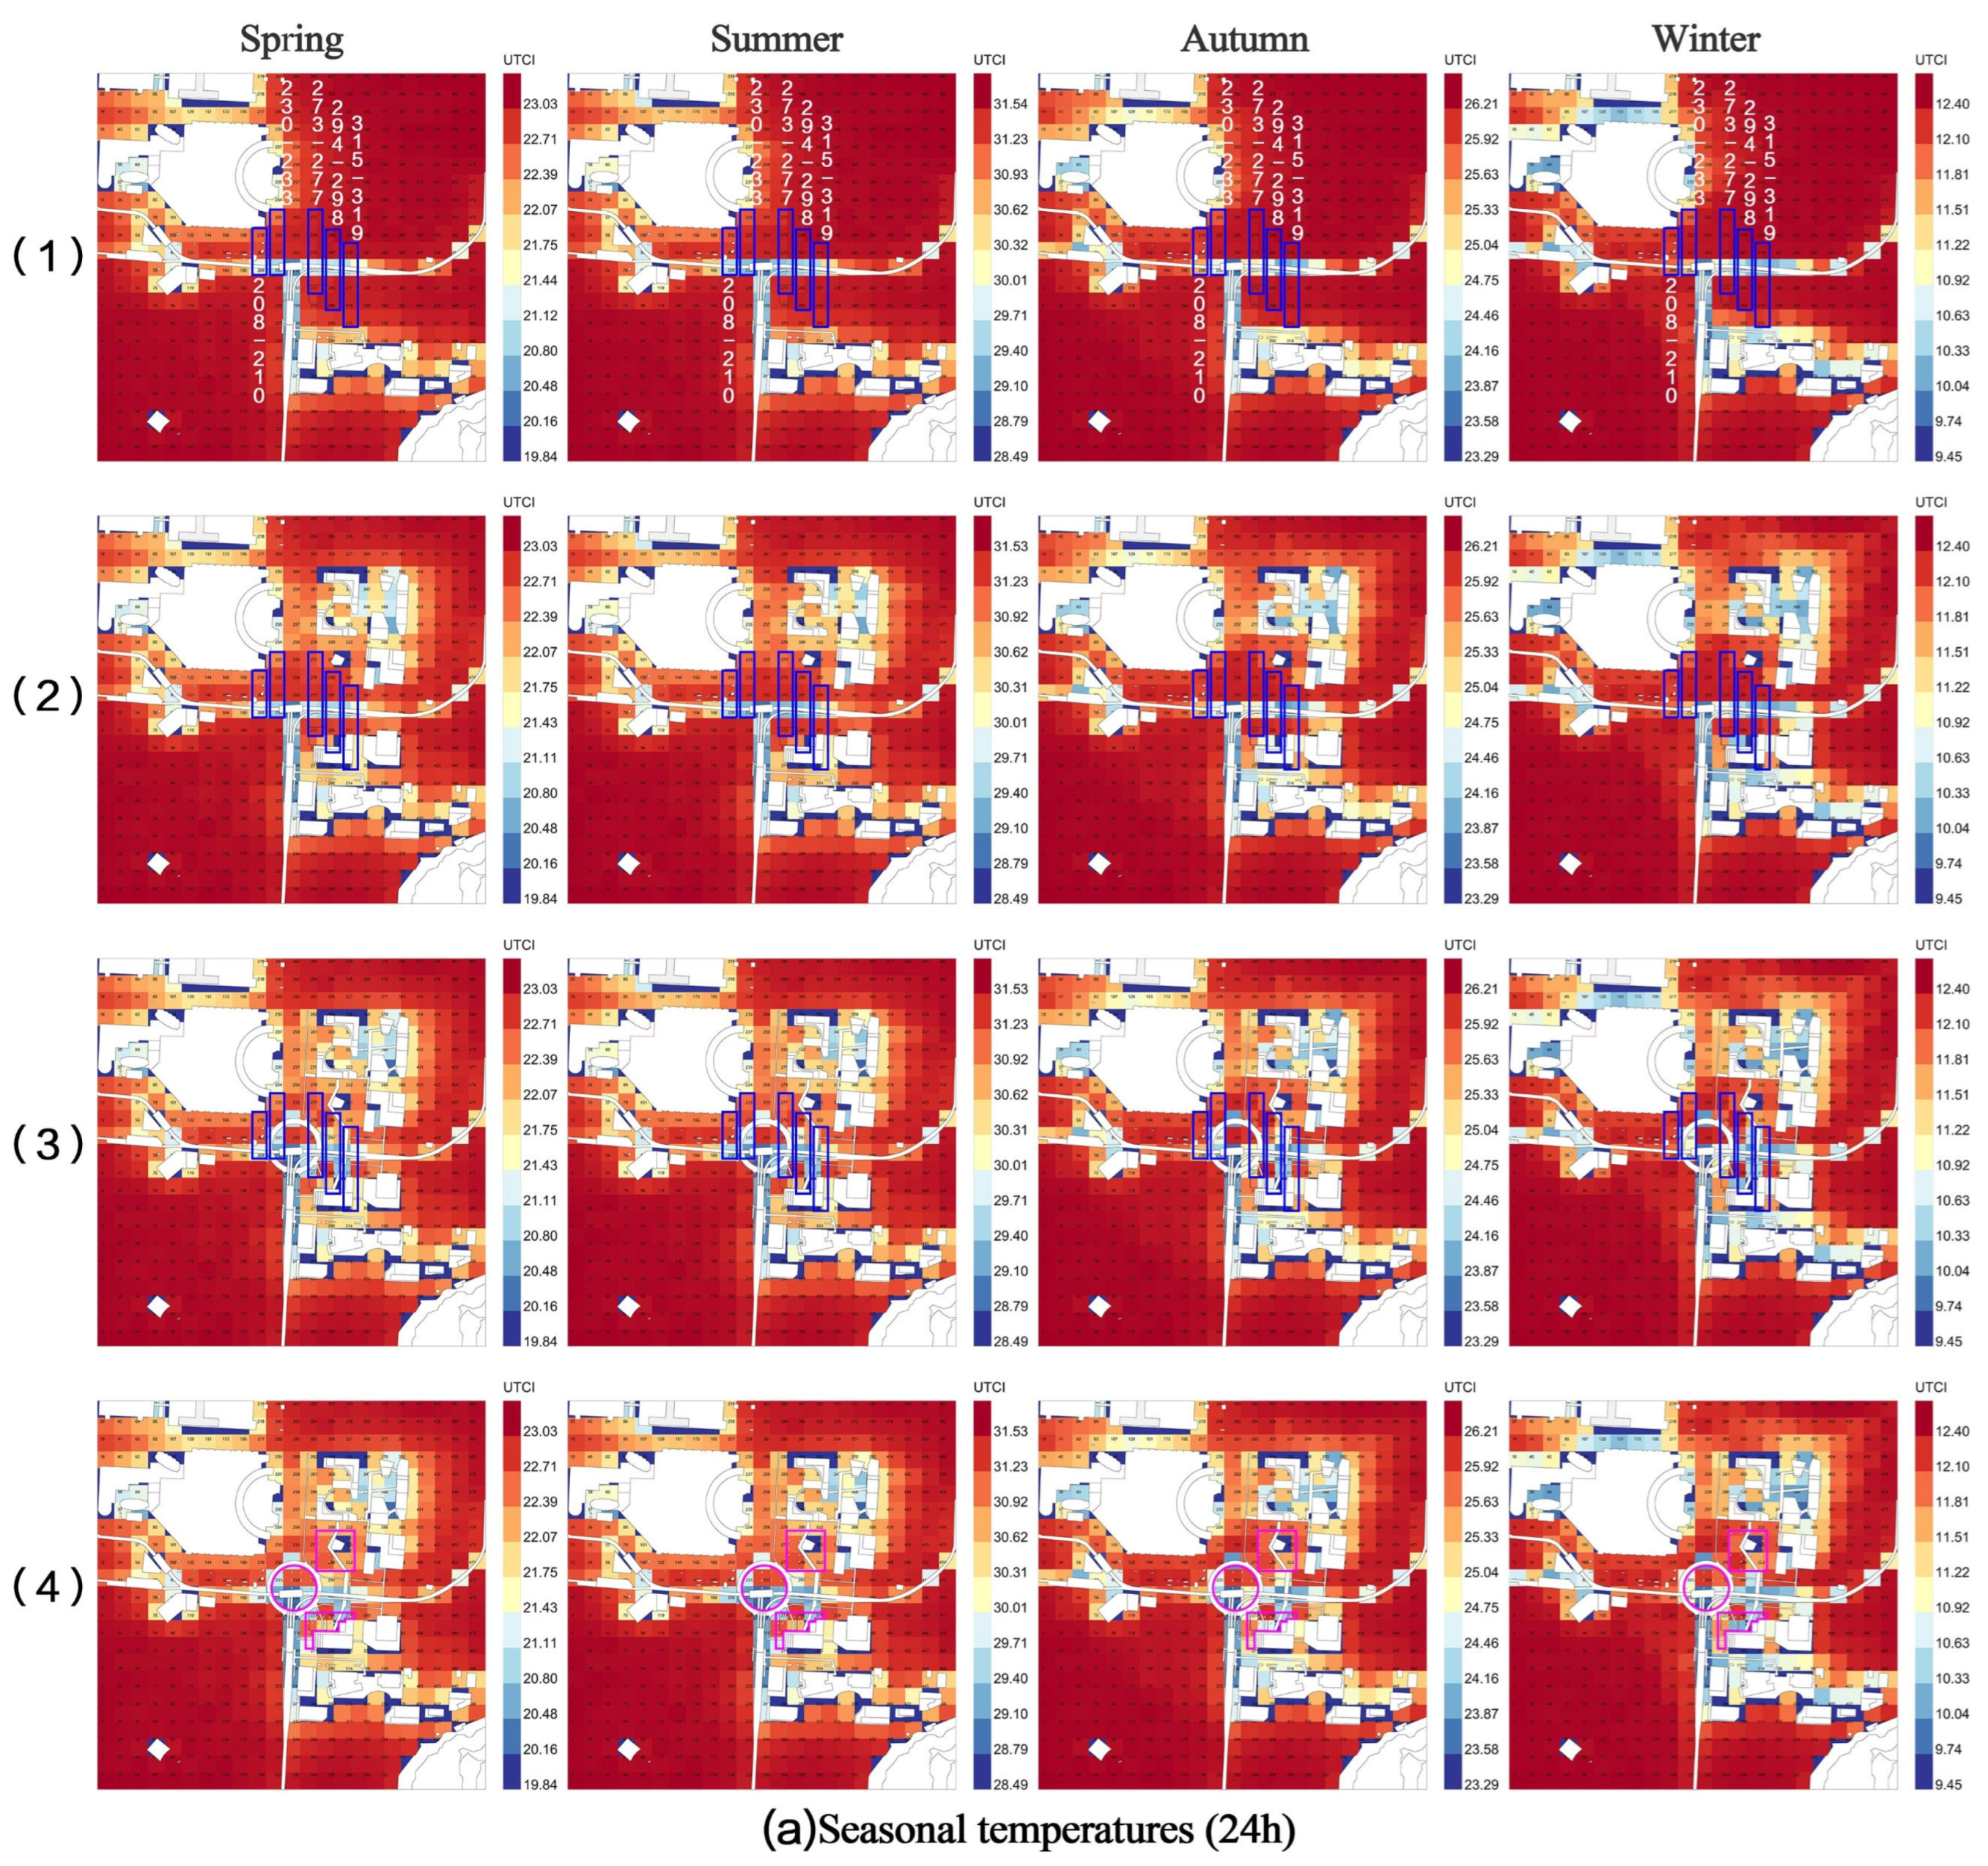
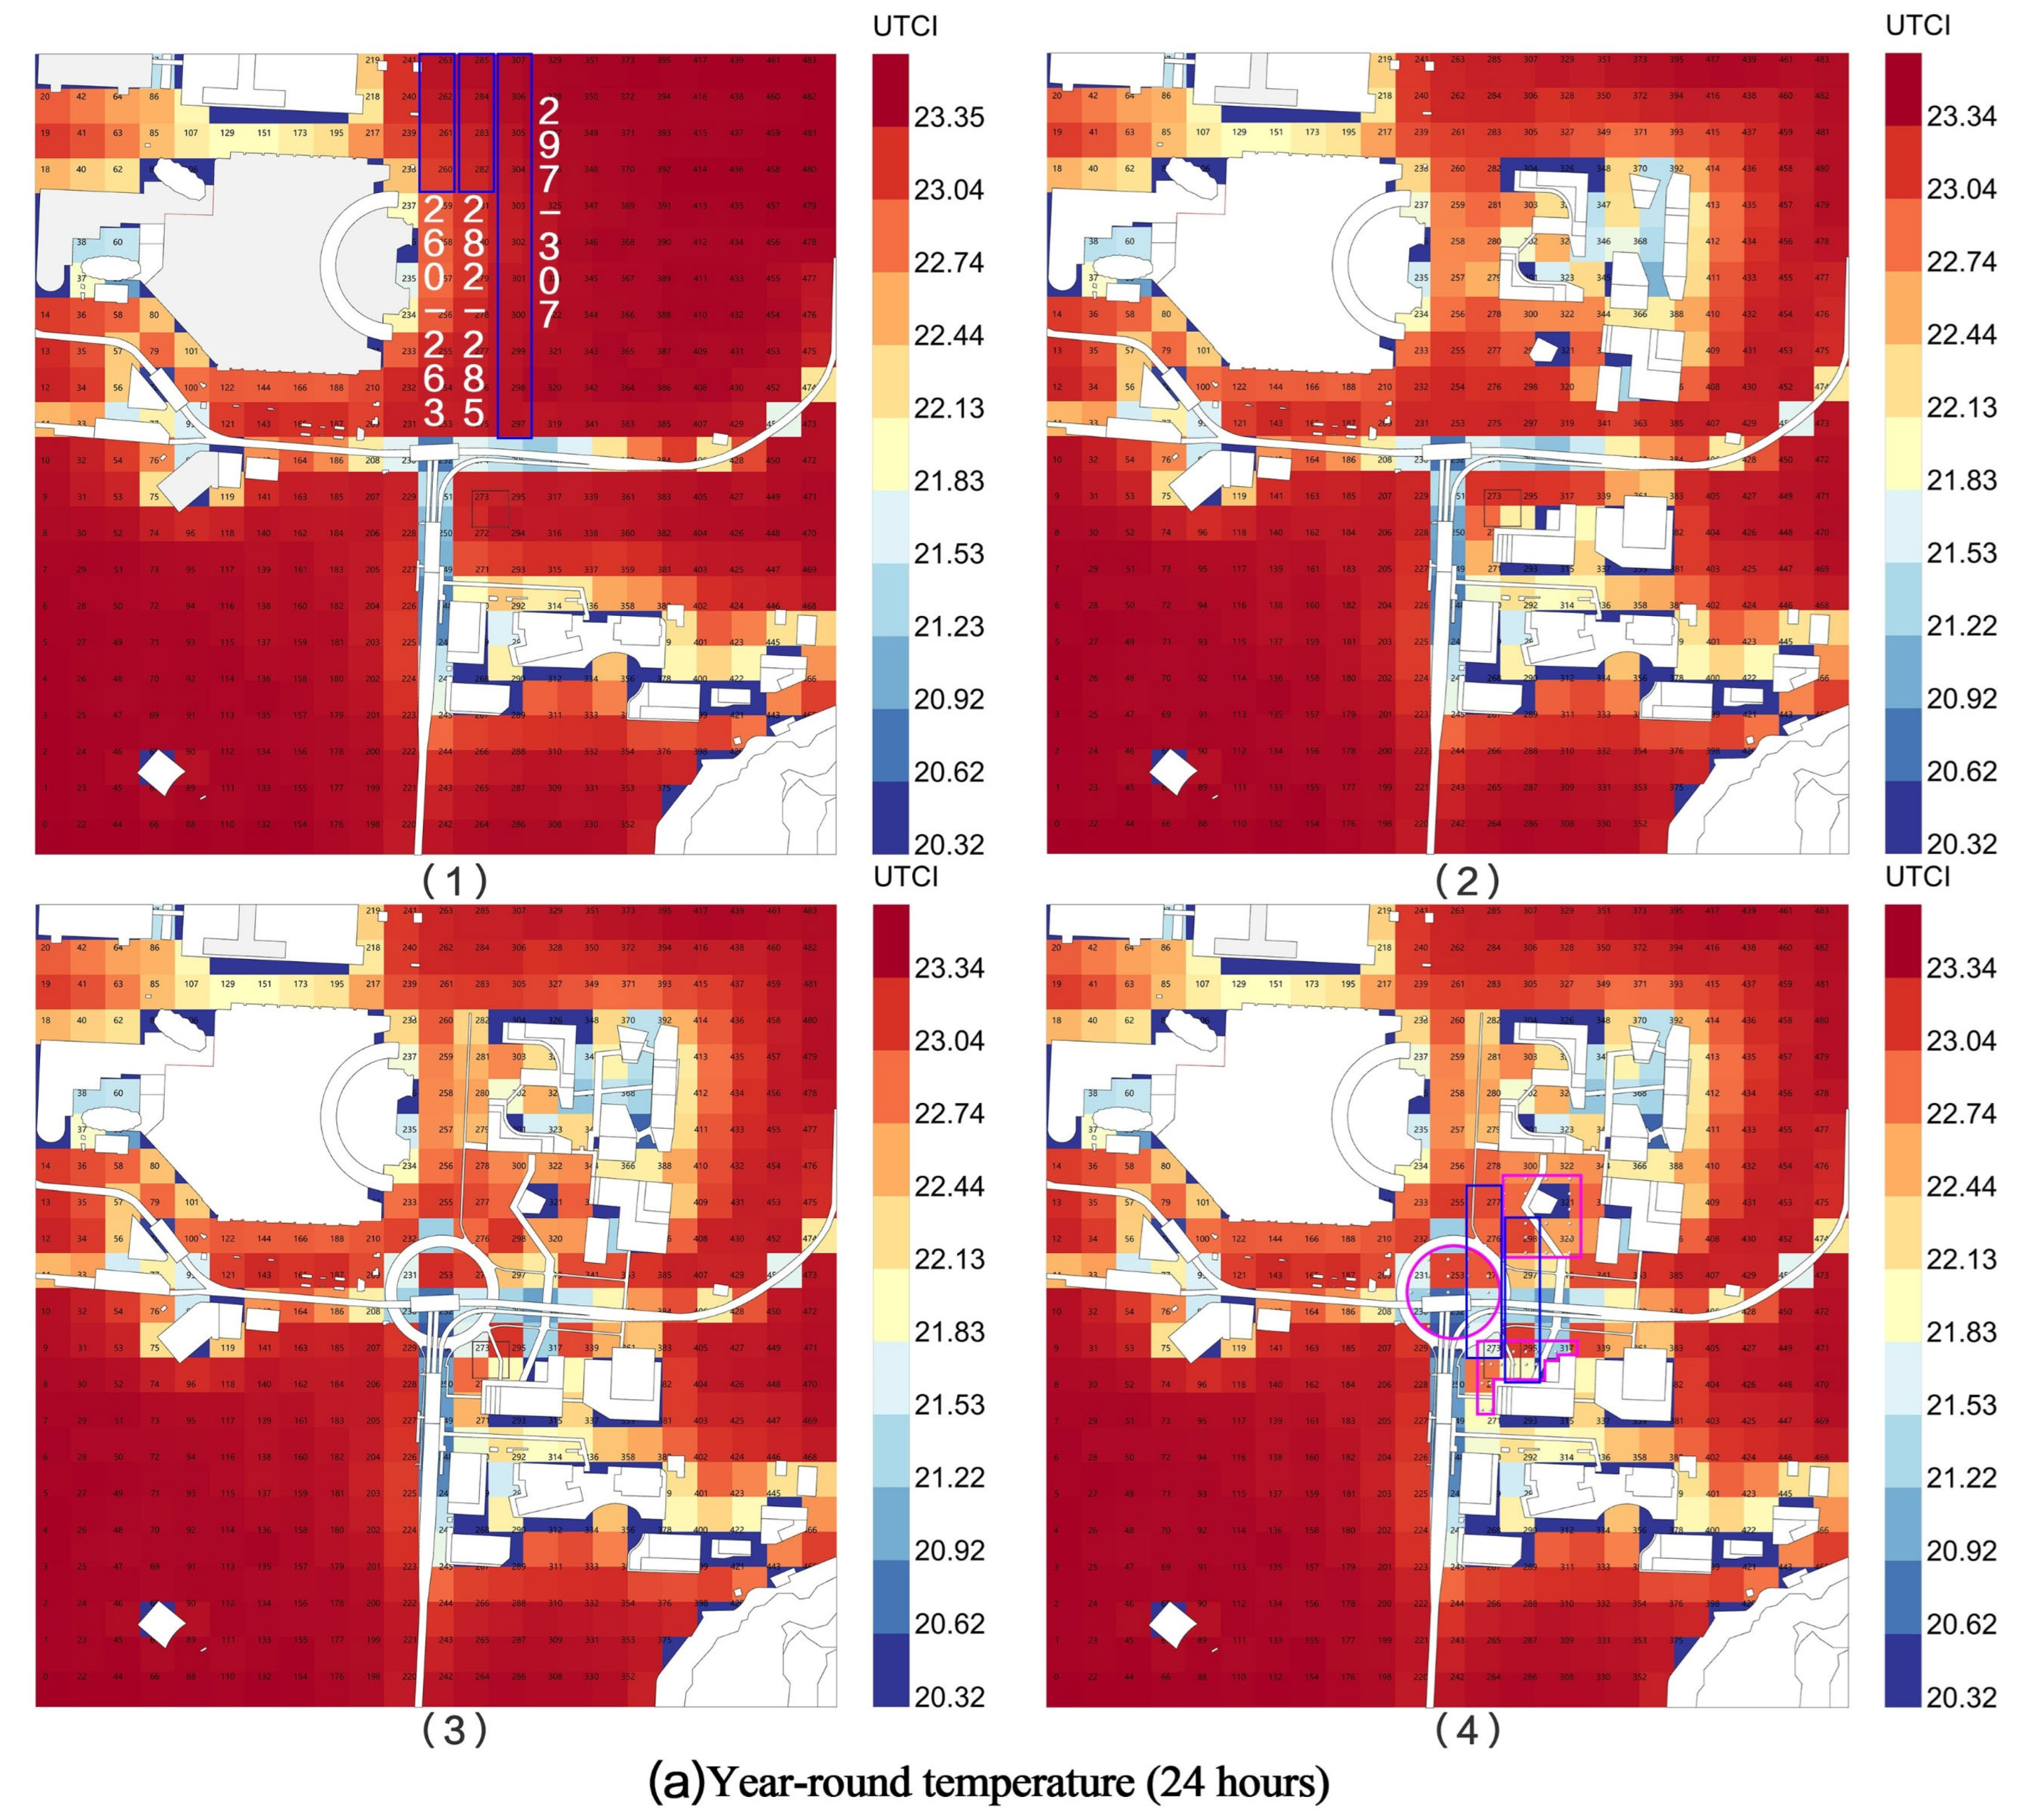
The 24 h average simulation results, covering the nighttime cooling cycle (Figure 7a), show that the overall UTCI value of the site fluctuates smoothly, remaining stable within the range of 20.3 °C to 23.3 °C.
Before the renovation (Figure 7(a1)): The overall average temperature of the site was low, but a large area of unobstructed hard-paved surface on the northeast side, including grids 260–263, 282–285, and 297–307, had higher thermal values, approaching the upper limit of 23.4 °C, and the thermal map showed a deep red high-temperature characteristic. After renovation (Figure 7(a4)): With the addition of commercial and medical buildings, elevated walkways, and landscaped trees, a distinct microclimate cool island was formed within the site. The core pedestrian corridor around the light rail station, the roundabout area, and the eastward-extending path grids 273–277 and 294–298, relying on the physical shading provided by buildings and vegetation, resulted in a significant decrease in UTCI values, with temperatures dropping to 21.5–22.1 °C. The thermal map changed from high-temperature red to light yellow and light-blue low-temperature hues, indicating a more balanced and stable overall thermal environment.
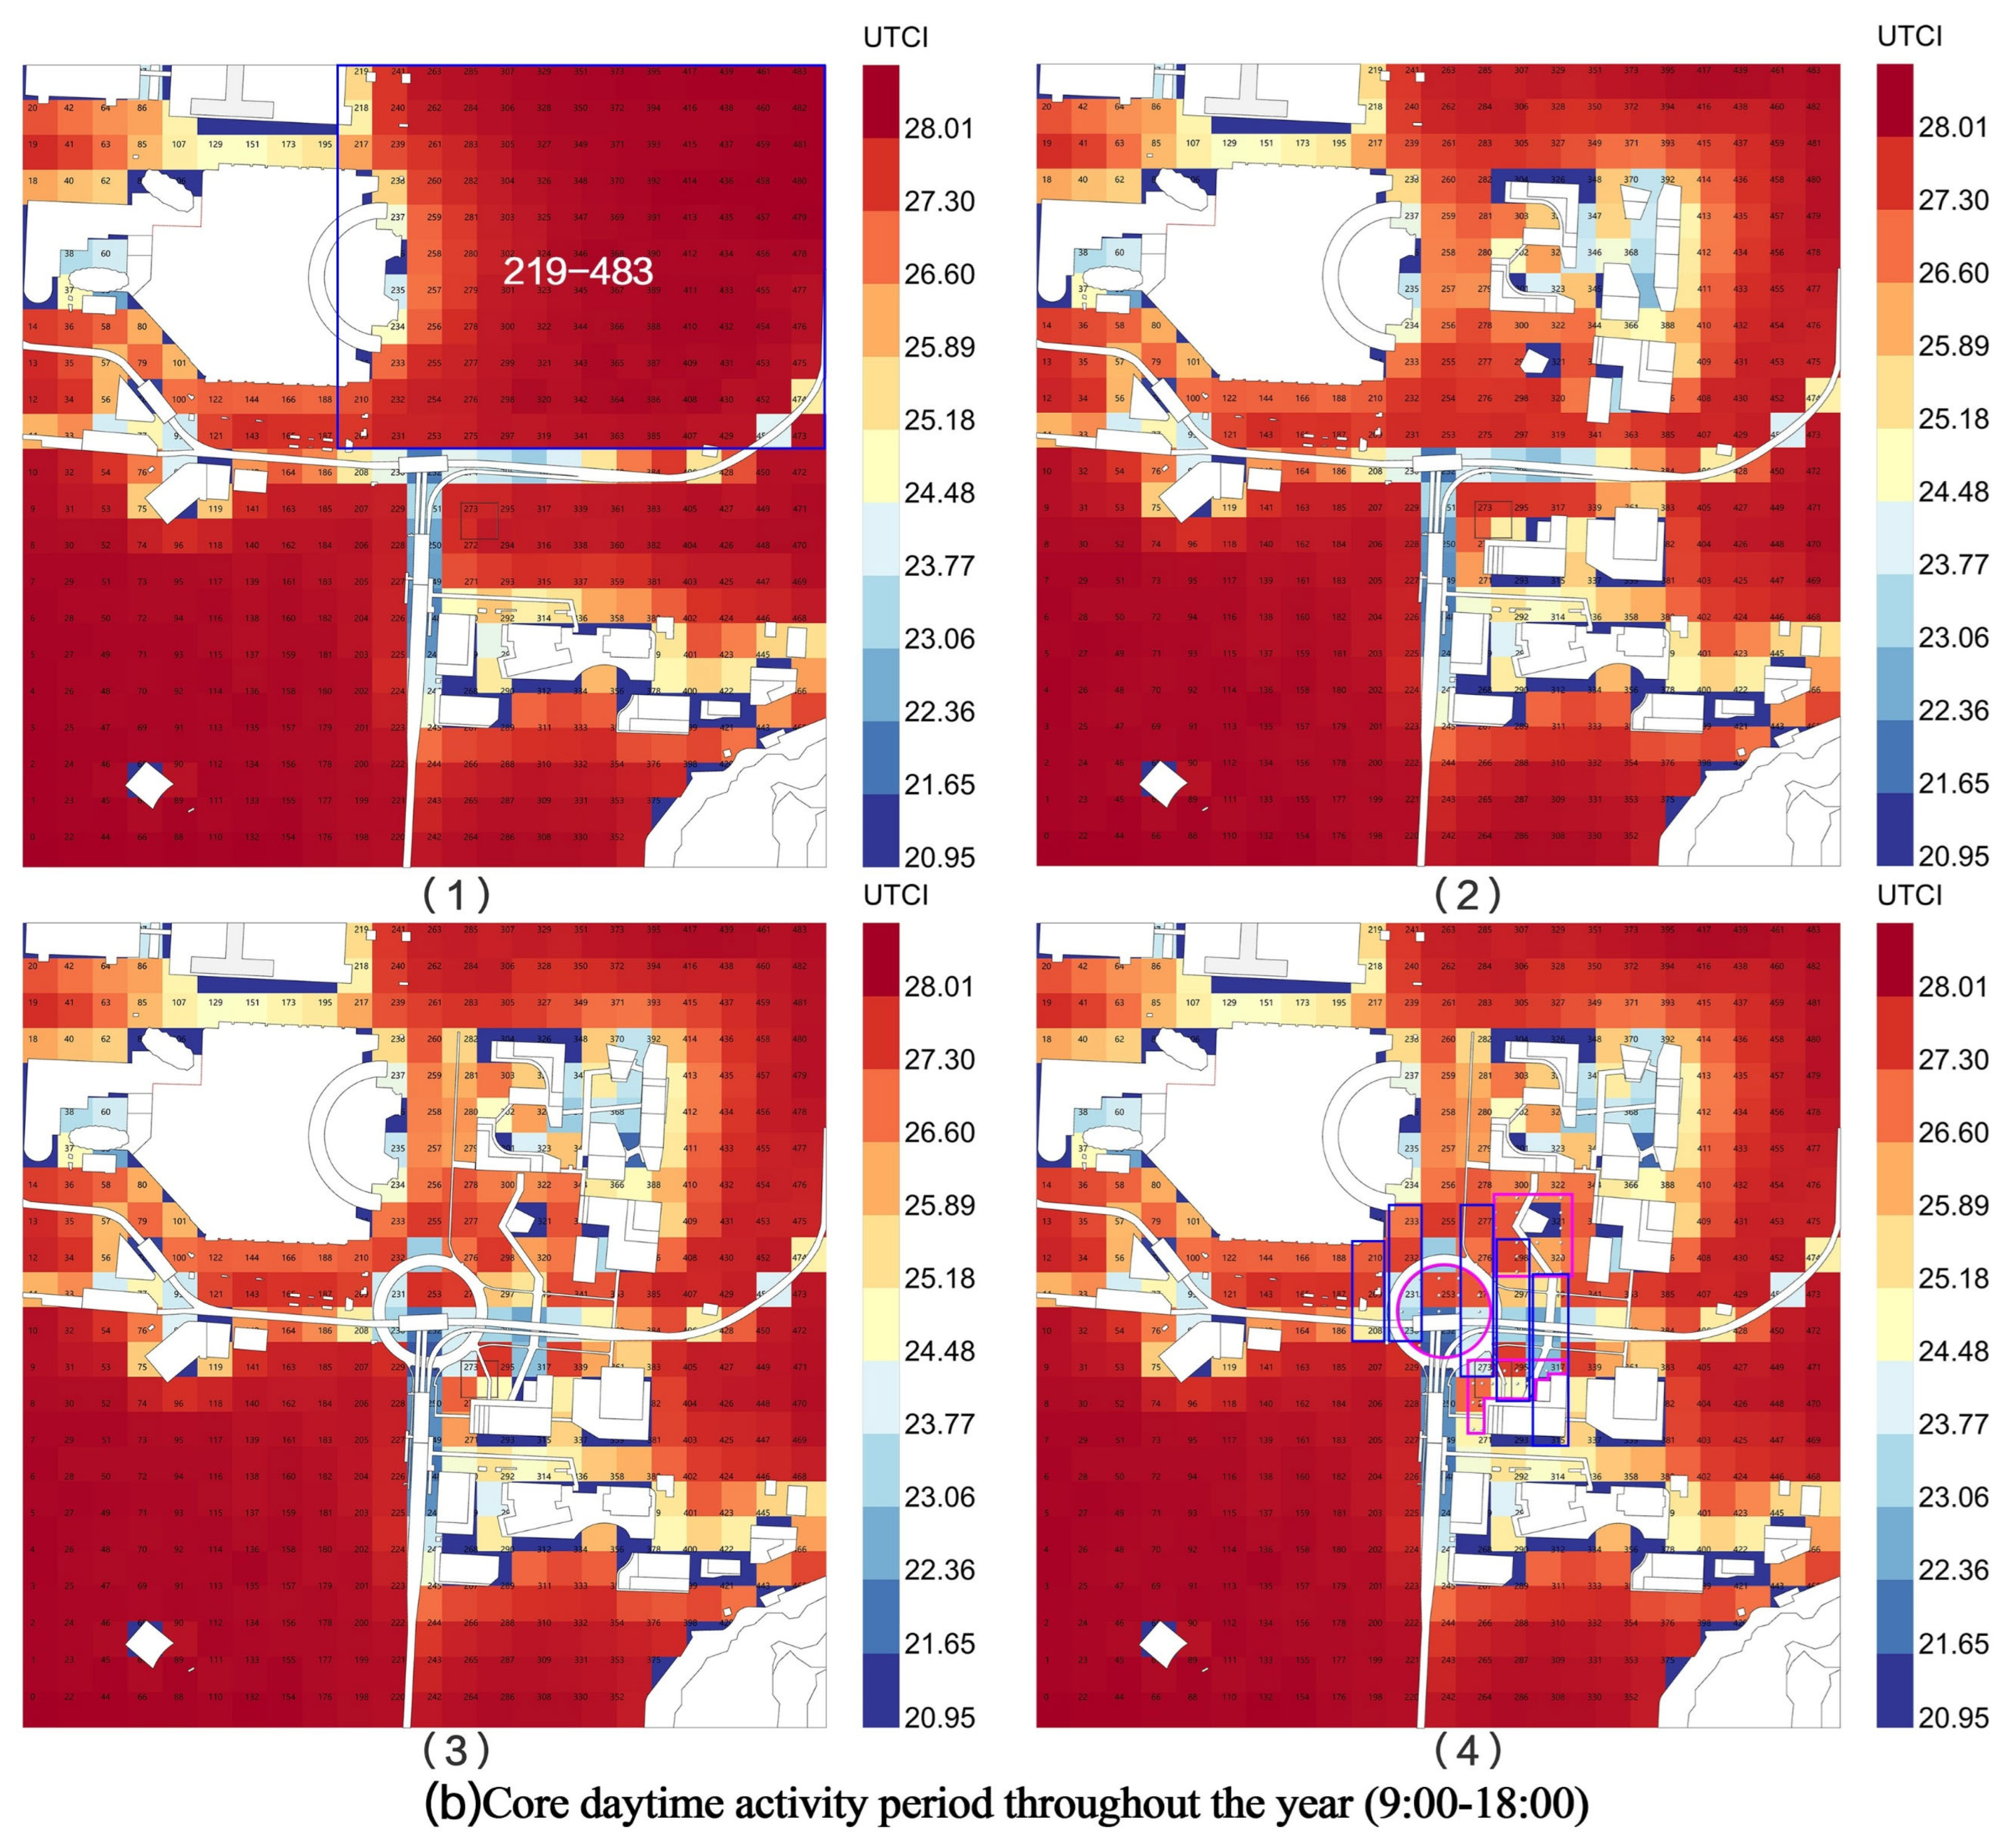
Daytime is the peak period for commuting and seeking medical care, and it is also the period with the strongest direct solar radiation under the local hot and humid climate (Figure 7b). This time period best demonstrates the environmental health-supportive value of the design strategy.
(1)
Before renovation (Figure 7(b1)), the site lacked shading facilities, fully exposing its shortcomings in daytime heat stress. The site’s extreme UTCI rose to 28.0 °C, with a large area of grid 219–483 forming a continuous, deep red high-temperature zone. Pedestrians were subjected to prolonged high-temperature stress during peak activity periods, severely diminishing their willingness to walk slowly and contradicting the health-supportive environmental attributes expected of a medical hub.
(2)
After the renovation (Figure 7(b4)): The design intervention demonstrated a strong cooling and regulation capability. The newly constructed three-dimensional covered walkway and health-supportive garden effectively blocked direct solar radiation during the day, resulting in a significant decline in temperature along the main pedestrian flow lines. In the central roundabout transfer hub grids 208–210 and 230–233 and in the main pedestrian axis grids connecting various functional areas 273–277, 294–298, and 315–319, the UTCI dropped from the high-temperature range of 27.0–28.0 °C to 23.0–24.0 °C, forming a continuous, comfortable low-temperature zone on the thermal map.
Comprehensive simulation data validated the effectiveness of the spatial stitching and climate repair strategy, which focuses on optimizing the daytime period of high radiation. The renovation plan not only alleviated the site’s microclimate fluctuations throughout the day but also created a continuous and pleasant pedestrian space during the peak commuting hours from 9:00 AM to 6:00 PM in a high-temperature environment. The plan fundamentally improved the original site’s poor thermal comfort for pedestrians, providing reliable data support for the design of a health-supportive environment in the HOD area.
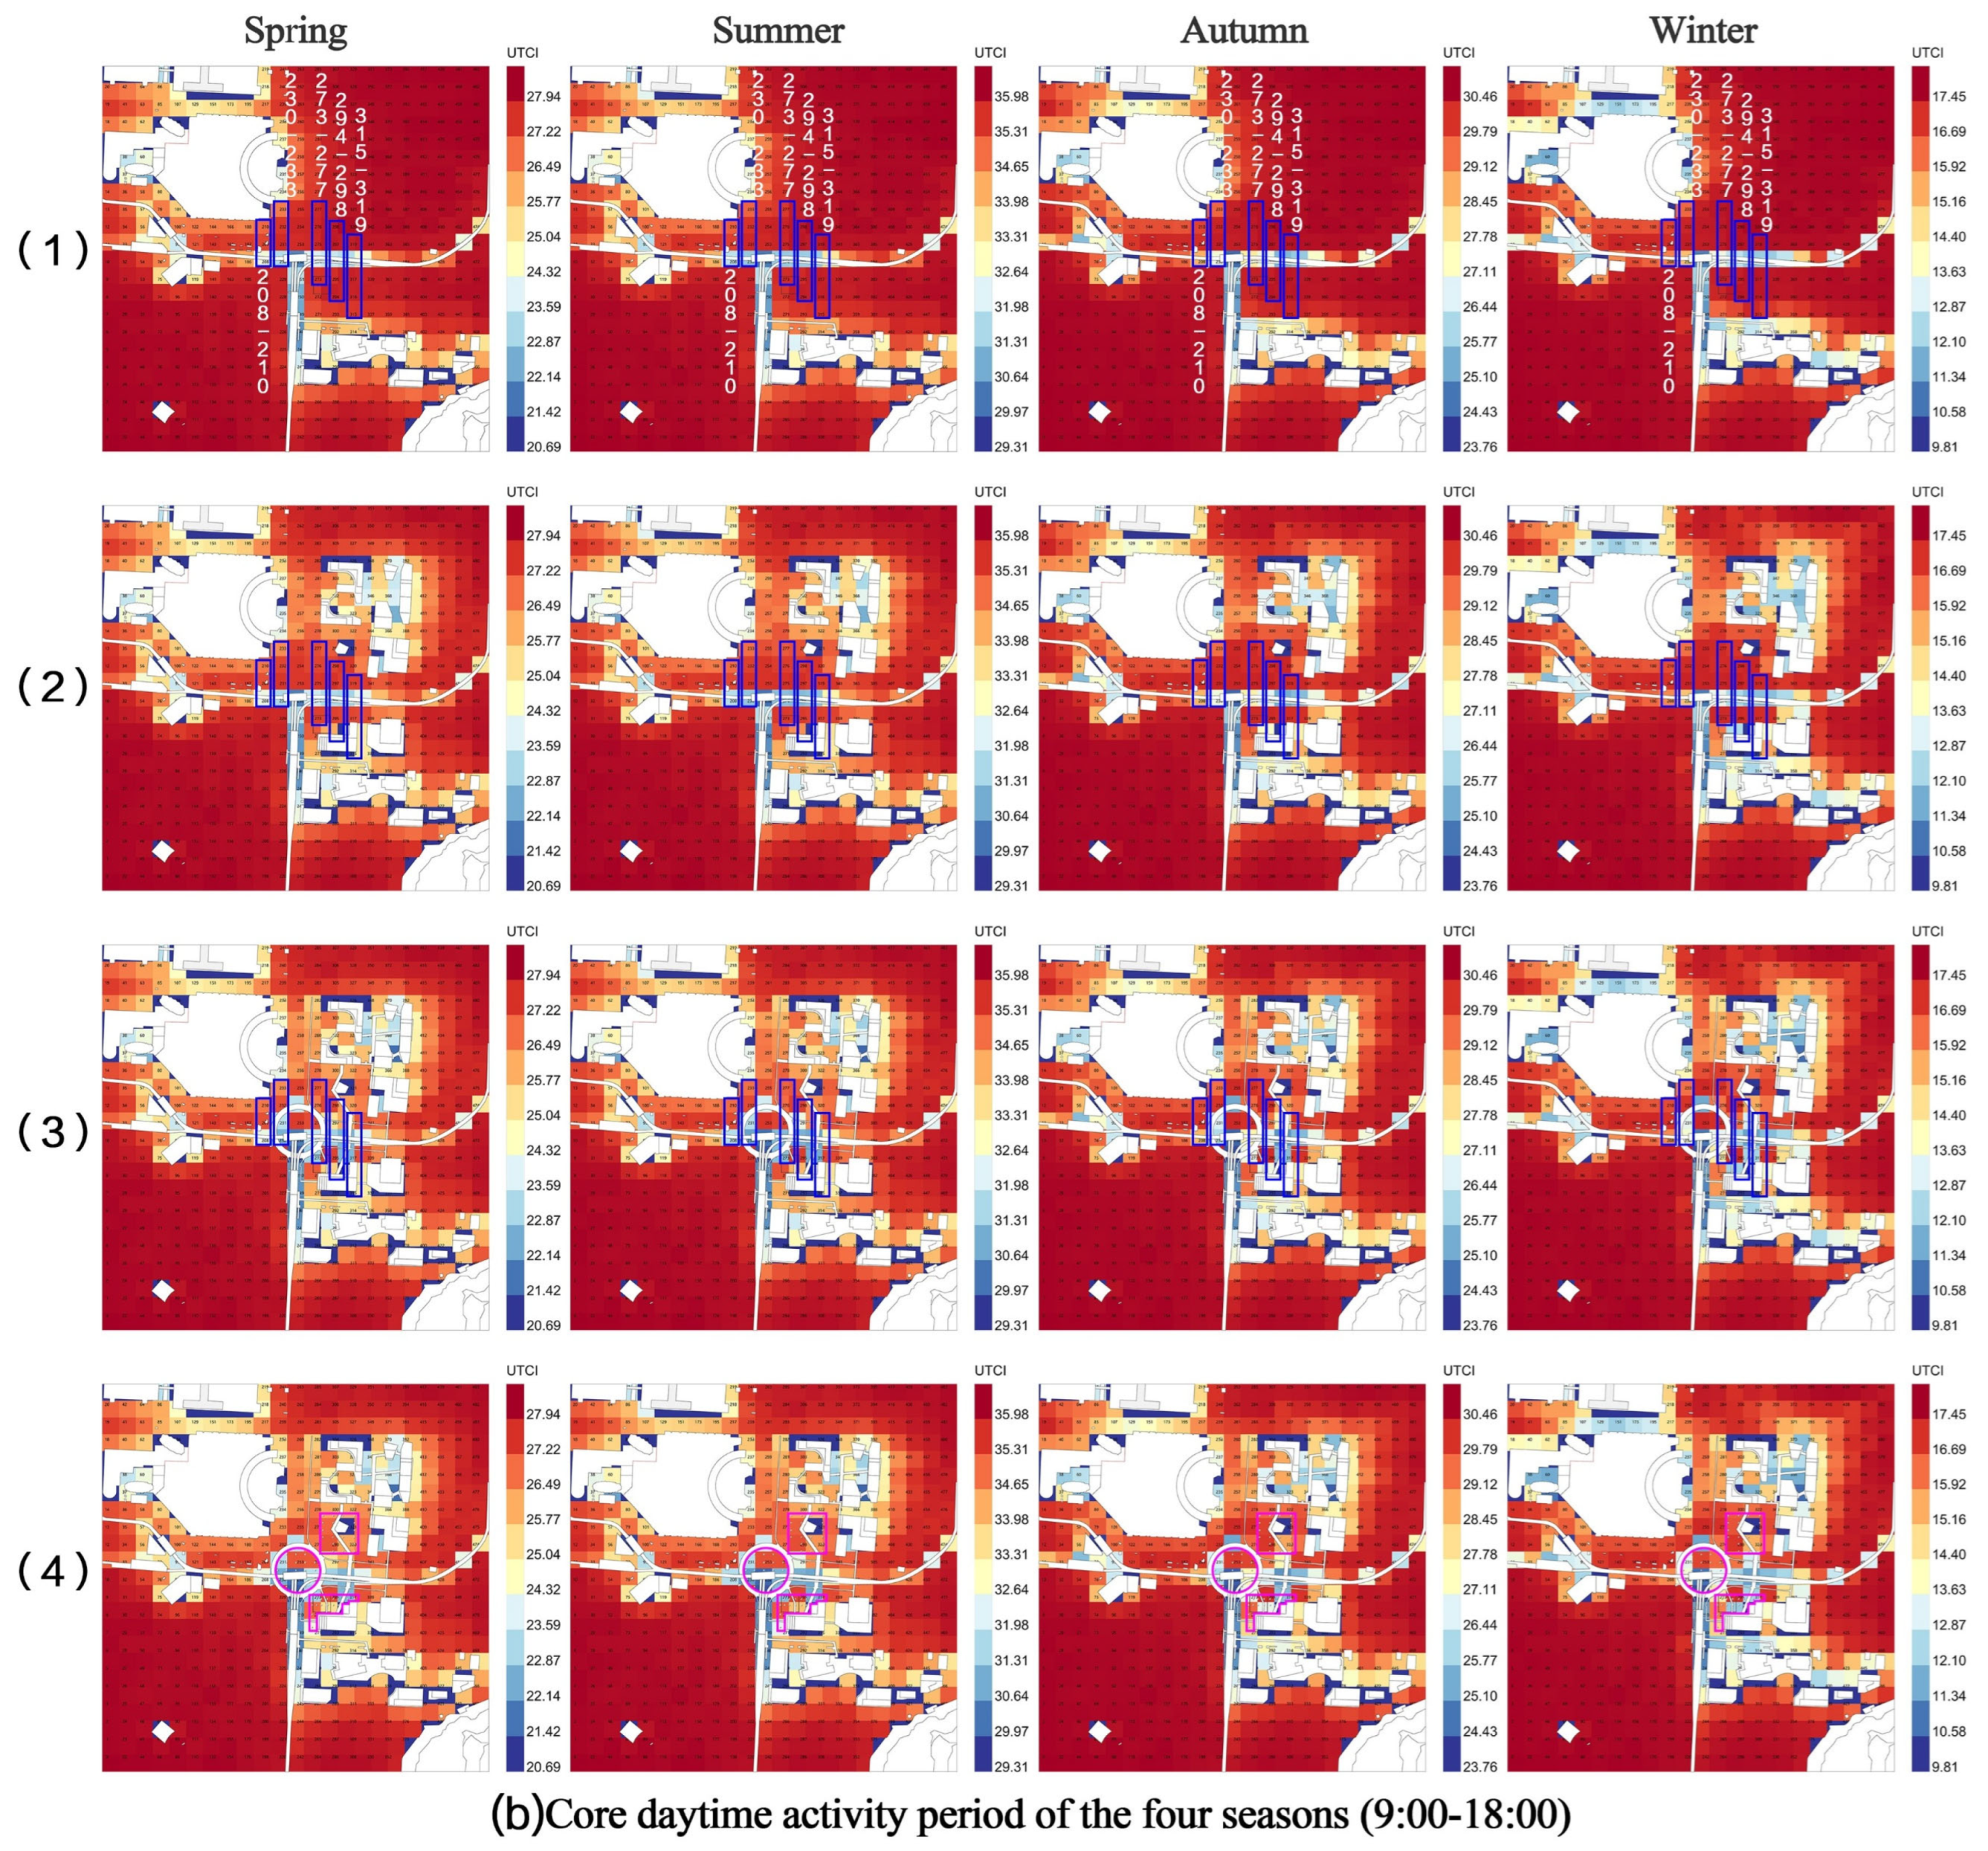
Based on the UTCI simulation map, an in-depth analysis was conducted on the spatial evolution characteristics of the thermal environment at the Macau LRT Union Hospital Station site throughout the four seasons and 24 h, with the core daytime activity period from 9:00 to 18:00. The simulation map is vertically divided into four spatial intervention stages: existing site conditions, added buildings, superimposed three-dimensional corridors, and the implantation of a healing garden. Horizontally, the microclimate change patterns of the four seasons are presented, with specific quantitative assessment results as follows.
From the perspective of the 24 h average temperature distribution characteristics across the four seasons, Macau belongs to a typical hot and humid climate zone. The base temperature of the site is relatively high in summer and autumn, with UTCI peaks reaching 31.6 °C and 26.2 °C, respectively.
Existing site conditions stage (Figure 8(a1)): Overall climate adaptability is weak. In summer and autumn, due to the lack of shading facilities, grids 260–263 and 282–285, as well as the surrounding large areas of hard paved surfaces, form contiguous high-radiation, high-temperature zones. After the addition of buildings (Figure 8(a2)), the building’s projected shadows provide passive cooling to the surrounding grid areas. With the superimposed three-dimensional corridors (Figure 8(a3)), the thermal environment of the core pedestrian space is significantly improved. Stable low-temperature zones are formed in areas such as the central island grid 230–233 and the radial connecting corridor grids 273–277 and 294–298, with a significant reduction in UTCI values. After the introduction of outdoor health-supportive gardens (Figure 8(a4)), relying on the shading and cooling effects of the vegetation canopy, the area covered by the cooling island effect is further expanded, and the overall thermal environment tends to be stable and comfortable in spring, summer, and autumn.
The period from 9:00 AM to 6:00 PM is the time of strongest solar radiation and also the peak period for people seeking medical treatment and commuting. Simulation comparisons during this period objectively demonstrate the value of the spatial design strategy in improving the site’s thermal environment shortcomings.
Current site thermal stress characteristics (Figure 8(b1)): During summer and autumn, the extreme values of the site’s UTCI during the daytime rise to 36.0 °C and 30.5 °C, respectively. A large area of grid 219–483 is under high-intensity thermal stress, resulting in extremely poor thermal comfort for pedestrians and failing to meet the environmental service quality expected of a medical hub. Significant cooling effect after the intervention of the three-dimensional corridor (Figure 8(b3)): In summer, the overall site temperature is consistently above 35.0 °C. The three-dimensional corridor effectively blocks direct sunlight and hinders heat conduction. In the daytime simulation results, the UTCI of areas along the corridor from the light rail station to the hospital, such as grids 208–210, 251, and 273–276, drops significantly; the high-temperature area is significantly reduced; and a continuous and stable comfortable walking path is formed. Synergistic optimization effect of outdoor health-supportive landscape (Figure 8(b4)): Based on the cooling effect of the three-dimensional corridor, the health-supportive garden fills the gap in ecological space outside the corridor system. The high-temperature areas along pedestrian paths and rest areas in grids 252–254 and 315–319 have been significantly reduced, resulting in a marked increase in the proportion of comfortable spaces. Vegetation not only effectively mitigates long-wave radiation from the hard underlying surface but also enhances the overall quality of the spatial environment from both a tactile and visual perspective.
Quantitative data indicates that simply adding a single building cannot fundamentally solve the problem of daytime pedestrian heat stress in Macau’s hot and humid climate. A comprehensive intervention approach, combining vertical corridors for vertical space integration with healing gardens for ecological restoration, represents the optimal design model for improving site thermal comfort. This model can transform high-intensity heat-stressed areas into comfortable pedestrian spaces during peak activity periods in summer and autumn, driving the site’s functional transformation from a single transportation space to a high-quality health and wellness hub.
Furthermore, the average percentage of thermal comfort data at four typical locations (273, 276, 321, and 363) within the site was taken. Statistical results show that spatial intervention has a positive effect on improving the overall thermal comfort of the site, and the improvement effect varies significantly across different observation periods. Combining the data in Table 3 and Table 4, comparing the proportion of moderate comfort during all four seasons (24 h) and the core daytime activity period (9:00–18:00) reveals the following:
In the 24 h dimension, including nighttime cooling, the overall thermal environment of the site is relatively mild. The current proportions of moderate comfort in spring, autumn, and winter are 57.3%, 45.3%, and 60.3%, respectively. After the addition of building interventions, these proportions slightly increased, stabilizing at 60.0%, 46.8%, and 61.5%, respectively.
During the core daytime activity period (9:00–18:00), when the risk of heat stress is extremely high, the site’s climatic vulnerability is fully highlighted. Currently, the site’s moderate thermal comfort rate is only 2.0% in the summer, dropping to 36.2% in the spring and 24.5% in the fall. After the first phase of adding building blocks, the moderate thermal comfort rate rebounded to 41.8% in spring and 28.2% in autumn, while the summer rate slightly increased to 2.8%.
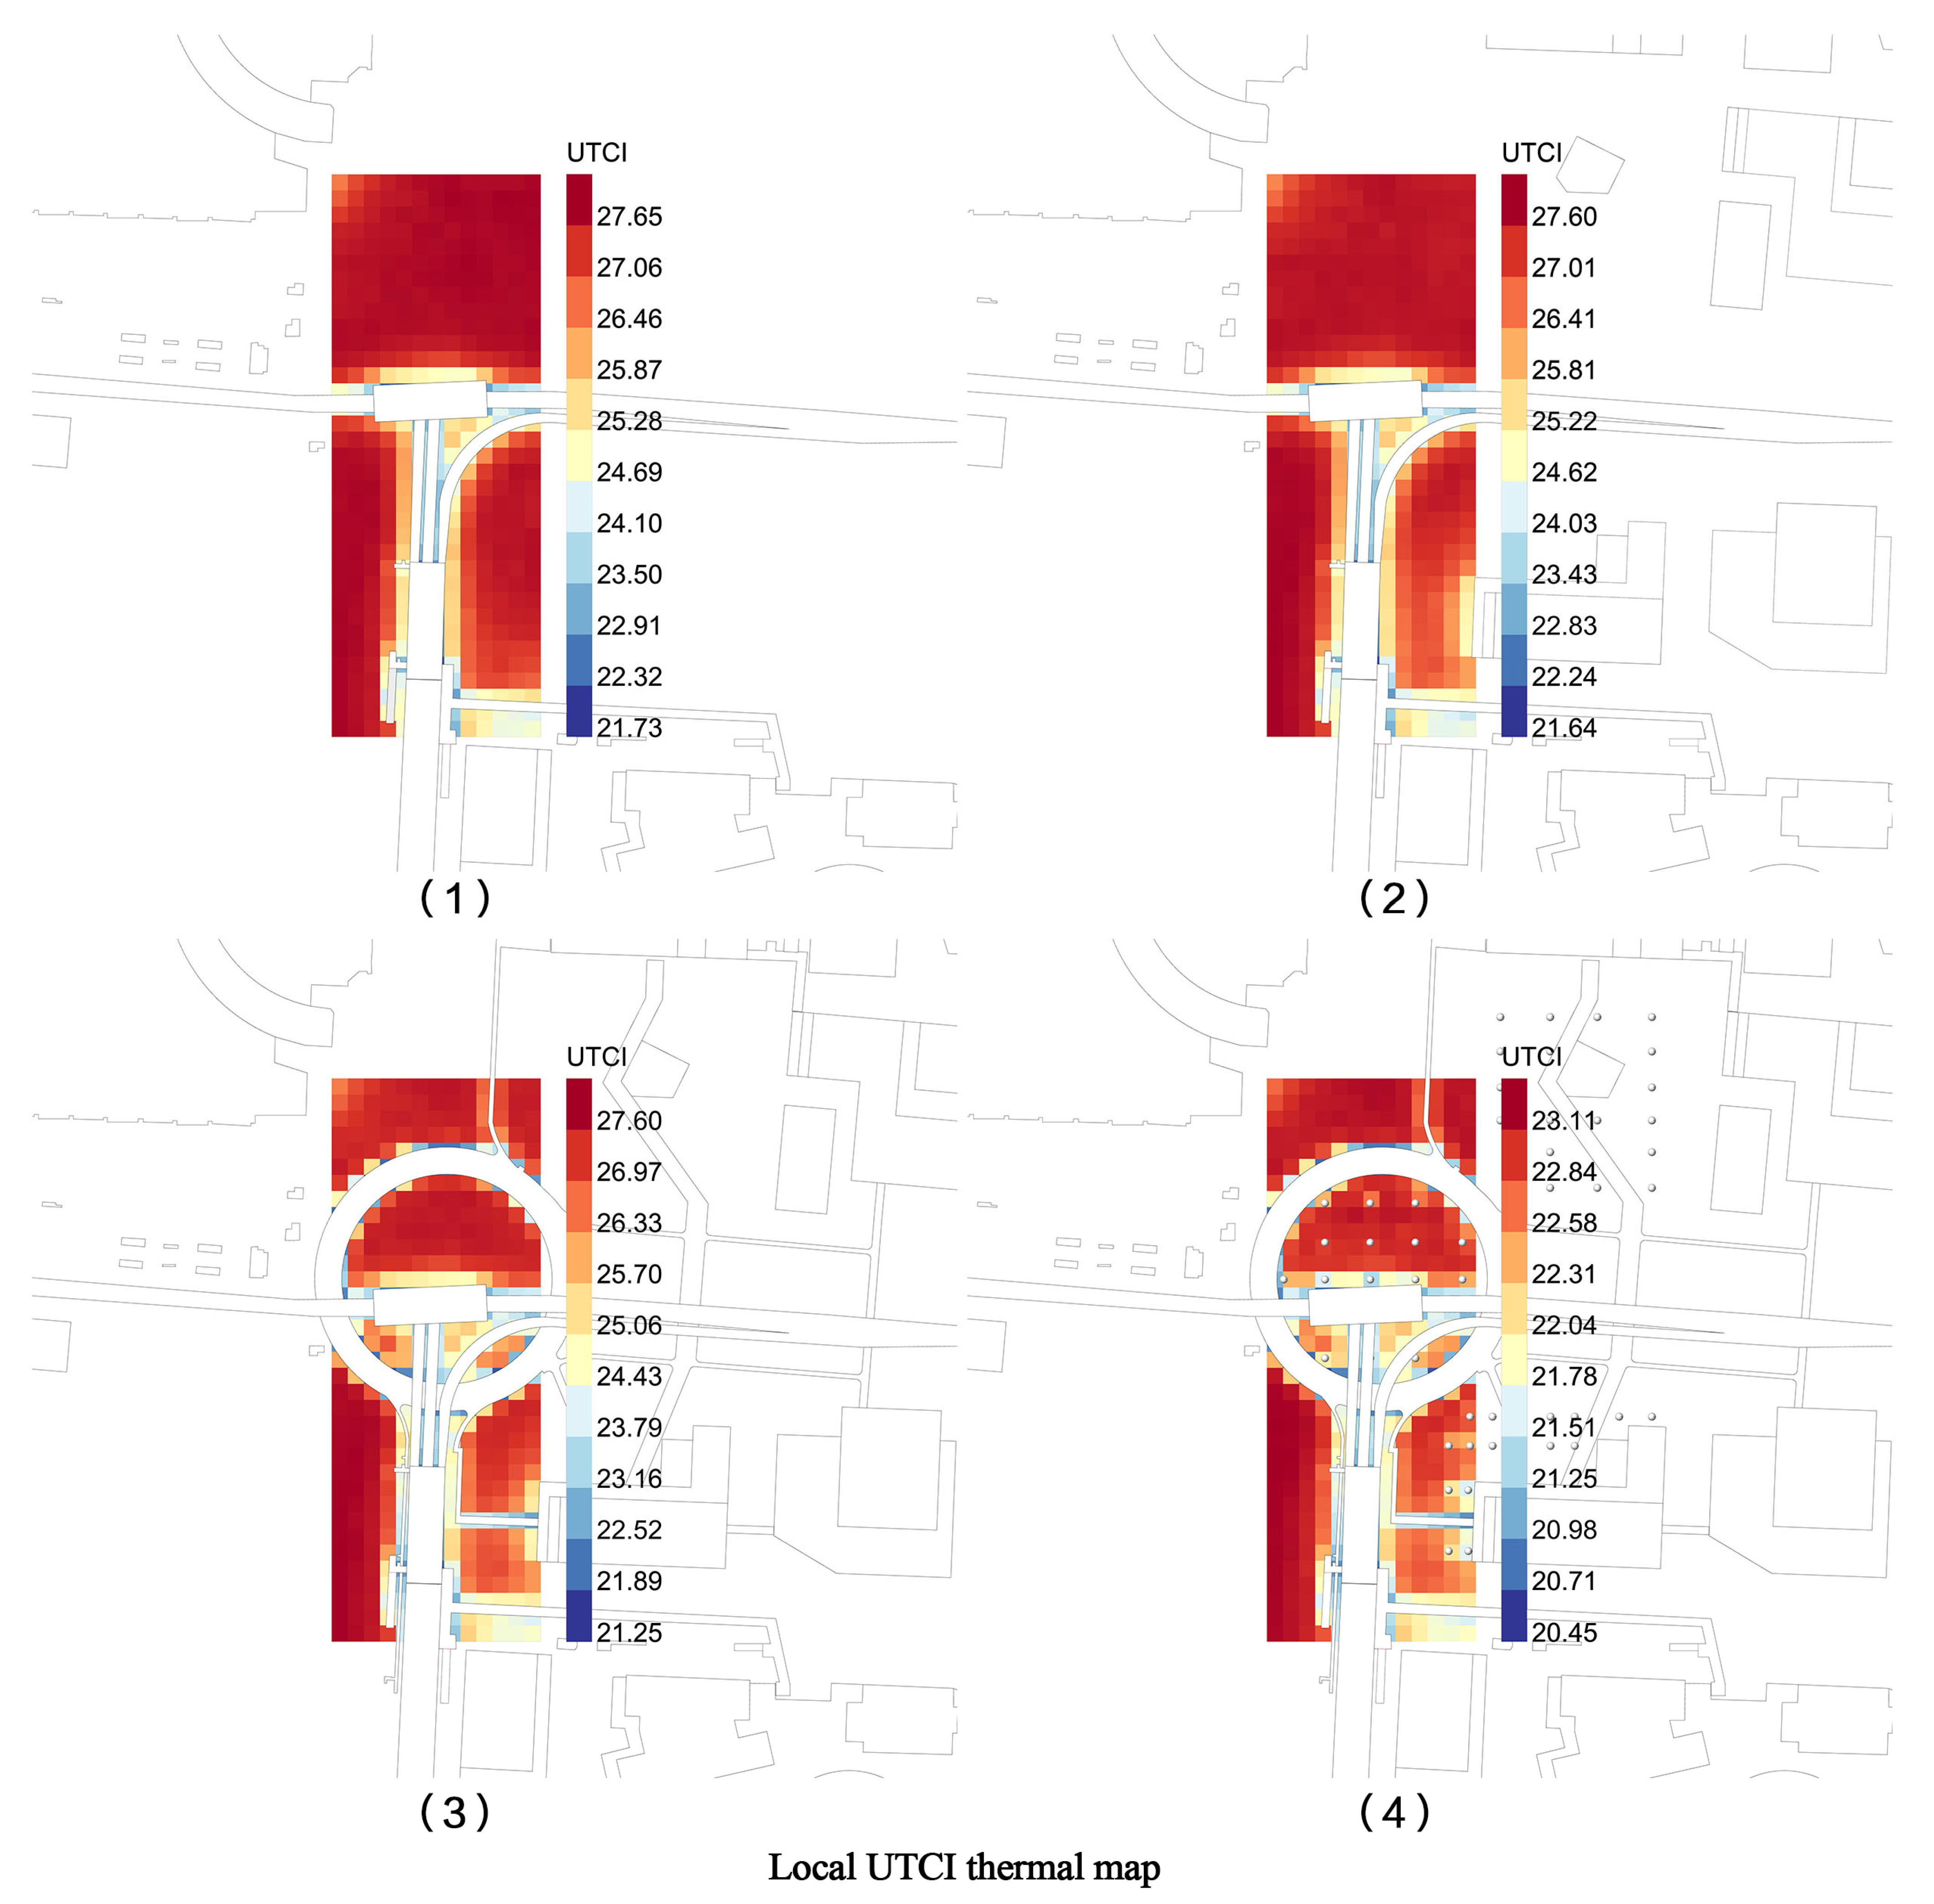
Even after the subsequent addition of three-dimensional corridors and outdoor health-supportive landscape strategies, the average moderate thermal comfort rate across the entire site did not change significantly, remaining at 41.8%, 2.8%, and 28.2% in spring, summer, and autumn, respectively. This phenomenon indicates that for precise, localized interventions targeting specific spaces, such as linear corridors and point-like landscapes, traditional methods of calculating the average area across the entire site weaken their improvement effect and fail to reflect actual changes in thermal comfort experience in key spaces like pedestrian paths. Therefore, by comparing the local UTCI thermal maps of each design intervention stage (Figure 9), the spatial evolution pattern of the overall thermal environment can be intuitively summarized, showing a progressive development pattern in environmental improvement. The overall process is divided into four optimization stages: overall thermal exposure, local form shading, linear corridor integration, and comprehensive landscape coupling.
(1)
Original Model Stage (Figure 9(1)): The entire site and surrounding pedestrian spaces are in a high-heat state (reddish yellow). The site lacks various physical shading structures, and solar radiation causes the rigid underlying surface to continuously accumulate heat, forming large-scale high-heat areas.
(2)
Original Model + Architectural Intervention Stage (Figure 9(2)): The introduction of planned building volumes alters the local radiation characteristics. Discrete cool-toned (orange-yellow) shadow patches begin to appear on the thermal map in areas adjacent to the building edges. This indicates that the building geometry provides direct shading, but warm-toned high-heat areas persist in open plazas and pedestrian axes far from the main buildings.
(3)
Original Model + Building + Connecting Corridor Three-Dimensional Stitching Stage (Figure 9(3)): The integration of the three-dimensional connecting corridor plays a unique role in linear stitching within the spatial form. The thermal map shows that previously isolated and scattered building shadow patches are organically connected through the linear physical shading surfaces formed by the corridor. Along the core pedestrian flow line, a continuous, low-thermal-stress shading corridor begins to take shape.
(4)
Full-Element Landscape Coupling Stage (Figure 9(4)): The green landscape promotes a holistic transformation of the site’s thermal environment, significantly reducing the area of high heat across the entire site and transforming most of the space into a low-temperature, comfortable environment. The continuous high-temperature environment of the outer open spaces is broken up, and the low-temperature areas around the buildings and connecting corridors continue to expand outwards.
To rigorously verify and scientifically evaluate the moderating weights of various renovation strategies on areas with different initial thermal backgrounds, this study extracted UTCI temperature data from 455.0 core grid sampling points across the entire area. First, the temperature data from the original model were sorted in descending order, then precisely divided into three characteristic intervals: the top 20.0% high-temperature zone (91 sampling points), the middle 60.0% heat-exposed zone (273 sampling points), and the bottom 20.0% shaded zone (91 sampling points).
The temperature data for each interval under four scenarios were summed and averaged. Simultaneously, the temperature reduction difference between adjacent renovation stages was calculated (Δ1UTCI is defined as the building intervention benefit, Δ2UTCI as the corridor intervention benefit, and Δ3UTCI as the landscape coupling benefit). The statistical results are shown in Table 5.
Based on the zonal averages and temperature difference statistics of each renovation scheme, the differences in cooling intensity of various optimization strategies can be quantitatively determined, and the mechanisms of action of each measure can be clarified.
(1)
The cooling efficiency of the landscape coupling strategy is absolutely dominant among all control schemes, with Δ3 being the main contributor. The average calculation results for the entire area show that greening optimization can bring an overall temperature reduction of 3.1 °C. The high-temperature zone (the first 20%) within the site is an unshaded, hard-surfaced open plaza, where a temperature reduction of 4.36 °C can be achieved solely through landscape renovation. This simulation simplifies vegetation as an idealized geometric shading entity, does not introduce vegetation transpiration and evaporation calculation models, and ignores the canopy light transmittance coefficient. Quantitative data proves that, compared with rigid artificial structures, high-density vegetation, through geometric shading to block short-wave solar radiation, can effectively alleviate extreme heat stress in urban open spaces and is a key optimization measure to improve the overall outdoor thermal comfort of the area.
(2)
The thermal environment control of the three-dimensional corridor has distinct spatial targeting characteristics, with the optimization effect of Δ2 concentrated in the middle and rear sections of the site. The multi-level pedestrian walkway has a negligible cooling effect on the high-temperature zone (top 20.0%), with a temperature reduction of only 0.1 °C. However, it exhibits excellent cooling capabilities in the heat-exposed zone (middle 60.0%) and the shaded zone (bottom 20.0%), with corresponding temperature reductions of 1.1 °C and 1.1 °C, respectively. These data indicate that multi-level pedestrian walkways are not suitable for large-scale deployment across the entire area. However, by constructing continuous linear shading interfaces along high-frequency pedestrian routes, the facility can precisely transform transitional spaces previously affected by heat radiation into safe pedestrian corridors with low heat loads.
(3)
Building form strategies can slightly improve the site’s basic microclimate, but the overall radiation regulation capacity is weak, with the lowest cooling effect corresponding to Δ1 among all intervention methods. Optimizing building form alone has a limited impact on improving the local thermal environment, with an average temperature reduction of only 0.2 °C across the entire area and temperature reductions in different zones ranging from 0.1 °C to 0.2 °C. This study focuses on the measurement of pedestrian paths. The building footprint within the study area is relatively low, and the buildings in the case study were randomly added. The shading space created by these buildings is concentrated in their immediate vicinity, making it difficult to extend and cover the entire continuous pedestrian corridor. Therefore, the overall radiative cooling effect is limited.
The stratified difference analysis of the data in this study clearly demonstrates that among all the gradual intervention strategies, the landscape coupling strategy has the most outstanding thermal environment regulation efficiency, ranking first in terms of cooling magnitude. It is the core regulation measure to alleviate large-scale pedestrian heat exposure in hot-summer and warm-winter climate zones. Meanwhile, the three-dimensional corridor strategy is a key synergistic mechanism for achieving precise temperature control along the core travel paths and ensuring continuous thermal safety for pedestrian routes. The combined “topology-climate” framework provides data support for the design effectiveness of this study.

4. Discussion

4.1. Exploration of the Causes and Evaluation Mechanisms of Local Thermal Comfort Differences

This study, after superimposing a three-dimensional corridor and shade-oriented landscape layout design strategy, found that the proportion of areas with favourable modelled UTCI conditions across the entire site during the core daytime activity period (9:00–18:00) did not significantly improve, and this indicator remained stable at 2.75% and 28.25% in summer and autumn, respectively. This result confirms that the traditional statistical method based on the average area of the entire site has obvious evaluation limitations and cannot accurately reflect the simulated thermal improvement effect of the slow-moving space. In fact, modelled thermal conditions of the hospital-oriented HOD area have significant spatial heterogeneity, and the differences in local simulated heat exposure levels mainly come from the differentiated physical shading mechanisms of various design interventions. This study clarified the synergistic shading principle involving three core spatial elements: buildings, three-dimensional corridors, and vegetation.
(1) Cooling effect of building projection. The newly added large-scale buildings on the site can form a large area of continuous shadow, constructing a planar passive cooling base for the entire site, effectively reducing the intensity of radiation exposure across the entire area from a macroscopic level.
(2) Shading and regulation effect of three-dimensional corridors. As a core optimization method, the solid canopy of the three-dimensional elevated corridor can effectively block high-intensity shortwave solar radiation during the core daytime period, significantly reducing the mean radiant temperature (MRT) along the corridor and creating a continuous, stable, low-thermal-stress linear pedestrian path on a high-heat environment base.
(3) The regulatory effect of vegetation canopy shading. The cooling contribution of comfortable outdoor garden vegetation mainly relies on canopy shading. Combined with the parameterized geometric simulation settings of this study, vegetation only participates in the calculation as a physical shading model, without considering the effects of heat dissipation from vegetation shading. It can further intercept solar radiation in the hard surfaces around the corridor and rest nodes, forming multi-point distributed local microclimate comfort zones.
In summary, the multiple synergistic effects of building shadows, elevated corridor shading, and vegetation canopy shading systematically explain the physical mechanism of structural spatial intervention in alleviating outdoor thermal stress, making up for the shortcomings of research relying solely on visual temperature appearance analysis. Research confirms that optimizing the microclimate of outdoor public spaces should extend beyond improving overall indicators across the entire area. In the future, the design and evaluation of HOD areas should be based on the actual walking routes of people, focusing on key passage spaces to carry out precise microclimate optimization and targeted intervention.

4.2. Spatial Synergistic Empowerment Mechanism of Accessibility and Comfort

This study quantitatively verified a significant synergistic effect between spatial accessibility and the quality of the outdoor microclimate environment. Multi-scale spatial syntactic topology analysis results show that the three-dimensional spatial stitching transformation strategy effectively breaks down the unfavorable spatial fragmentation caused by the existing site’s main traffic arteries. After the transformation, the average spatial integration of the site at R = n and R = 800 m both achieved a significant increase of 67.0%, transforming the originally isolated pedestrian spaces into highly vibrant urban slow-moving axes. However, without adequate thermal environment support, highly accessible slow-moving flows can lead to long-term exposure of pedestrians to high-intensity heat stress in summer, significantly reducing the travel experience. Analysis of the integration of the slow-moving axis and pedestrian thermal comfort reveals that the core pedestrian network of the transformed site is entirely within the coverage optimization range of the three-dimensional corridors and health-supportive landscapes. This synergistic adaptation mechanism between the thermal environment and spatial pattern ensures convenient access for patients and commuters to and from the light rail station, medical buildings, and commercial support areas, while reducing spatial resistance. At the same time, it continuously provides stable and suitable thermal comfort experience for walking, ultimately achieving a dual improvement in the spatial operation efficiency and outdoor environmental quality of the HOD area.

4.3. Social Benefits of Healing-Oriented Design for Medical Hubs

The development concept of modern medical services has broken through the traditional single scope of clinical diagnosis and treatment, gradually shifting towards a holistic approach to physical and mental well-being that considers both the physical health and psychological state of the population [41]. As a core medical TOD node in a subtropical city, Macau LRT Union Hospital Station serves vulnerable groups highly sensitive to extreme climate changes, including the elderly, pregnant women, and patients. The current site experiences extreme daytime UTCI heat stress values of 36.0 °C and 30.5 °C in summer and autumn, respectively. This prolonged high-intensity heat stress environment not only easily leads to physical fatigue and heatstroke but also exacerbates anxiety and irritability among patients during their medical visits, deviating from the core humanistic care attribute that a medical hub space should possess. This study employs a comprehensive intervention strategy combining three-dimensional suturing with a healing landscape, which, while addressing the site’s microclimate shortcomings, fully aligns with environmental psychology’s stress relief and attention recovery theories. By creating continuous and safe pedestrian shelters and high-quality, nature-friendly landscapes, the original noisy and sun-exposed traffic transition nodes are transformed into urban healing public spaces with functions of psychological stress reduction and emotional comfort. This fully reflects the social equity and humanistic care value of medical and health-related space planning and construction.

4.4. The Universality of the “Topology-Climate” Framework and Its Planning Implications for Hot and Humid Cities

This study uses Macau’s LRT Union Hospital Station as an empirical case, but its constructed “topology-climate” coupled assessment system has significant potential for application to hot and humid cities in Asia with similar climatic backgrounds. For example, urban clusters in South China and most compact cities in Southeast Asia face common challenges such as high-density vertical development, spatial fragmentation of transportation hubs, prolonged periods of extreme high temperatures, and a large population of climate-sensitive users. The technical logic chain established in this paper—comprehensive building volume, integrated three-dimensional pedestrian networks, and the deployment of localized vegetation shading—can provide mature methodological support for the renovation and upgrading of similar high-density areas.
From a planning perspective, this framework reshapes the approach to optimizing the microclimate of pedestrian spaces, shifting from traditional large-scale cooling across the entire area to efficient and precise intervention based on pedestrian paths. In high-density urban renewal scenarios with limited space and financial resources, planners should rely on spatial topology analysis to identify the core framework of the pedestrian network and precisely implement elevated walkways, sunshade components, and healthy pedestrian nodes along high-frequency paths. This path-oriented design strategy has formed a replicable and cost-effective standardized design paradigm for creating climate-resilient and health-oriented TOD and HOD projects in subtropical and tropical regions of Asia.

4.5. Limitations and Future Prospects

This study constructed a comprehensive evaluation framework combining spatial topology analysis and parametric thermal environment simulation, but there are still some shortcomings that need to be further improved in subsequent studies.
First, the adopted climate simulation model has not been calibrated or validated with on-site micro-meteorological measurements, and there are inherent restrictions in model settings and calculation accuracy. This study directly used the global uniform wind speed and relative humidity data in the EPW file without introducing a CFD model, which could not accurately capture the local wind field changes in complex three-dimensional spaces such as corridors and ground floor open spaces [42]. At the same time, in order to simplify the calculation, the health and wellness vegetation in the site was only abstracted as a radiation shading geometry, without including leaf area index, canopy transmittance, and physiological effects such as vegetation shading and humidification, so it was also impossible to carry out sensitivity analysis of vegetation-related parameters. In the future, wind and heat environment coupling simulation can be carried out in conjunction with ENVI-met (5.7.1), and a refined plant thermodynamic model incorporating vegetation physiological attributes can be constructed to improve the simulation accuracy.
Second, the quantitative evaluation of walking thermal comfort is too macroscopic and lacks refinement. On the one hand, the thermal comfort ratio analysis only selected four core grid typical points for calculation, which is a static node analysis and is difficult to reflect the real-time microclimate experience of pedestrians during continuous movement. On the other hand, due to limitations in site size and grid precision, the research mainly relies on global mean statistics and visual interpretation of thermal maps, as well as qualitative and quantitative analysis through local UTCI values. In the future, dynamic thermal sensing models and path evaluation models [43] can be introduced to supplement more refined grid-level statistical indicators, including P90 extreme thermal stress, the proportion of road sections with high thermal stress above 32.0 °C, the length of continuous shaded paths, and the cumulative walking heat exposure. This will transform descriptive global map analysis into rigorous micro-meteorological assessment, better adapting to the walking needs of vulnerable groups such as patients and the elderly.
Third, this study is a forward-looking conceptual design in the early planning stage of services, and the proposed strategies such as three-dimensional spatial stitching and landscape intervention are only at the scheme simulation stage. Without considering the constraints of engineering construction, cost control, existing pipelines, and operation and maintenance management, the scheme is not yet ready for direct implementation. In addition, all simulated thermal results have not been cross-checked by on-site micro-meteorological monitoring and subjective user questionnaires, which is a key limitation of the current numerical analysis.
Fourth, the study lacks statistical testing and model robustness assessment. This study aims at a macro-level assessment of spatial morphological evolution, uniformly controlling various basic parameters before and after intervention to compare trends. However, it did not conduct significance analyses such as paired t-tests on the difference in Δ U T C I at grid points, nor did it use bootstrap sampling for robustness verification. Further rigorous statistical testing and full-parameter sensitivity analysis are needed to quantify the impact of environmental and physiological parameter fluctuations on thermal comfort conclusions, further improving the scientific rigor and stability of the assessment model.
Finally, in terms of spatial syntax research, future studies could combine crowd behavior gaze surveys and agent simulations to expand multi-dimensional road network indicators such as selectivity. We will comprehensively analyze the connectivity characteristics of pedestrian spaces and continuously improve the data-driven evaluation system for healthy walking spaces that are adapted to HOD areas.

5. Conclusions

This study focuses on the Macau LRT Union Hospital Station, addressing the dual challenges of fragmented pedestrian spaces and high-temperature heat stress in summer and autumn. It proposes a three-dimensional suturing design strategy combined with outdoor health-supportive landscape integration and conducts quantitative evaluation using spatial syntax and Ladybug outdoor thermal comfort simulation. The main findings are as follows:
(1) Spatial accessibility and microclimate optimization exhibit a significant synergistic effect. The three-dimensional corridor effectively eliminates spatial barriers caused by road traffic, increasing the site’s spatial integration by 67.0%. After the renovation, the core pedestrian axis was completely within the microclimate optimization coverage area, achieving simultaneous improvements in accessibility and pedestrian thermal comfort.
(2) In hot and humid regions, targeted, localized interventions are recommended to improve the outdoor thermal environment. Data shows that the average temperature reduction across the entire corridor area is 0.9 °C, with reductions of 1.1 °C and 1.2 °C in heat-exposed and shaded areas, respectively; the overall microclimate temperature reduction across the landscape area is 3.1 °C, with a reduction of 4.4 °C in extreme high-temperature areas. Under strong summer and autumn radiation, by combining corridors with vegetation shading, continuous shaded corridors can be built along the main pedestrian route, effectively reducing pedestrian heat stress.
(3) By relying on a composite design that couples spatial reconstruction with landscape shading, the outdoor thermal environment conditions of medical HOD hubs can be optimized. Related designs can optimize the site’s spatial form and reduce extreme heat stress in pedestrian spaces. Based on the quantitative analysis results of geometric shading, data and design references can be provided for the climate adaptability planning of slow-moving spaces in subtropical medical HODs.

Author Contributions

Conceptualization, Z.G.; methodology, Z.G.; software, Z.G.; validation, Z.G.; formal analysis, Z.G.; investigation, Z.G., Q.D., J.L., L.Y., W.L., Y.Z., L.Z. and Y.C.; resources, Z.G.; data curation, Z.G.; writing—original draft preparation, Z.G., L.Z. and Y.C.; writing—review and editing, Z.G., Q.D., J.L., L.Y., W.L., Y.Z., L.Z. and Y.C.; visualization, Z.G., Q.D., J.L., L.Y., W.L., Y.Z., L.Z. and Y.C.; supervision, L.Z. and Y.C.; project administration, L.Z. and Y.C.; funding acquisition, L.Z. and Y.C. All authors have read and agreed to the published version of the manuscript.

Funding

This research was funded by (1) Faculty Research Grants funded by Macau University of Science and Technology (FRG-MUST grant number: FRG-25-041-FA; FRG-25-067-FA); (2) the Guangdong Provincial Department of Education’s key scientific research platforms and projects for general universities in 2023: Guangdong, Hong Kong, and Macau Cultural Heritage Protection and Innovation Design Team (grant number: 2023WCXTD042); (3) the Guangdong Provincial Philosophy and Social Sciences Planning 2025 Lingnan Cultural Project (grant number: GD25LN30). The funders had no role in study conceptualization, data curation, formal analysis, methodology, software, decision to publish, or preparation of the manuscript. No additional external funding was received for this study.

Institutional Review Board Statement

Not applicable.

Informed Consent Statement

Not applicable.

Data Availability Statement

The original contributions presented in this study are included in the article. Further inquiries can be directed at the corresponding authors.

Conflicts of Interest

The authors declare no conflicts of interest. The funders had no role in the design of the study; in the collection, analyses, or interpretation of data; in the writing of the manuscript; or in the decision to publish the results.

References

  1. Farnes, K.; Hurst, N.; Wong, W.-W.; Wilkinson, S. An exploratory study on the benefits of transit orientated development (TOD) to rail infrastructure projects. Smart Sustain. Built Environ. 2025, 14, 310–325. [Google Scholar]
  2. Chen, Z.; Wang, Y.; Zhang, H.; Lei, J.; Tan, H.; Wang, X.; Ye, Y. Hospital-Oriented Development (HOD): A Quantitative Morphological Analysis for Collaborative Development of Healthcare and Daily Life. Land 2025, 14, 1996. [Google Scholar] [CrossRef]
  3. Dai, Y.; Du, S.; Min, H. Comparative hotspot analysis of urban living environments and Transit-Oriented development (TOD) strategies: A case study of Beijing and xi’an. ISPRS Int. J. Geo-Inf. 2023, 12, 446. [Google Scholar]
  4. Loo, B.P.; du Verle, F. Transit-oriented development in future cities: Towards a two-level sustainable mobility strategy. Int. J. Urban Sci. 2017, 21, 54–67. [Google Scholar]
  5. Wan, J.; Sun, H.; Fan, X.; Phillips, A.; Zhao, Y.; Chen, Y.; Wang, Z.; Xiao, H.; Dong, X.; Zhu, W. Refining the 15-minute community living circle: An innovative evaluation method for medical facility allocation in Chengdu. Land Use Policy 2024, 145, 107286. [Google Scholar] [CrossRef]
  6. Verma, S.; Sharma, H. Concept of healing and curing. In Integrated Pathy; Elsevier: Amsterdam, The Netherlands, 2025; pp. 1–14. [Google Scholar]
  7. Ulrich, R.S.; Simons, R.F.; Losito, B.D.; Fiorito, E.; Miles, M.A.; Zelson, M. Stress recovery during exposure to natural and urban environments. J. Environ. Psychol. 1991, 11, 201–230. [Google Scholar] [CrossRef]
  8. Ohly, H.; White, M.P.; Wheeler, B.W.; Bethel, A.; Ukoumunne, O.C.; Nikolaou, V.; Garside, R. Attention Restoration Theory: A systematic review of the attention restoration potential of exposure to natural environments. J. Toxicol. Environ. Health Part B 2016, 19, 305–343. [Google Scholar] [CrossRef]
  9. Lai, D.; Liu, W.; Gan, T.; Liu, K.; Chen, Q. A review of mitigating strategies to improve the thermal environment and thermal comfort in urban outdoor spaces. Sci. Total Environ. 2019, 661, 337–353. [Google Scholar] [CrossRef] [PubMed]
  10. Chen, L.; Ng, E. Outdoor thermal comfort and outdoor activities: A review of research in the past decade. Cities 2012, 29, 118–125. [Google Scholar] [CrossRef]
  11. Xie, Y.; Wang, X.; Wen, J.; Geng, Y.; Yan, L.; Liu, S.; Zhang, D.; Lin, B. Experimental study and theoretical discussion of dynamic outdoor thermal comfort in walking spaces: Effect of short-term thermal history. Build. Environ. 2022, 216, 109039. [Google Scholar] [CrossRef]
  12. Kovats, R.S.; Hajat, S. Heat stress and public health: A critical review. Annu. Rev. Public Health 2008, 29, 41–55. [Google Scholar] [PubMed]
  13. Yang, L.; Qian, F.; Song, D.-X.; Zheng, K.-J. Research on urban heat-island effect. Procedia Eng. 2016, 169, 11–18. [Google Scholar] [CrossRef]
  14. Nikolopoulou, M.; Steemers, K. Thermal comfort and psychological adaptation as a guide for designing urban spaces. Energy Build. 2003, 35, 95–101. [Google Scholar] [CrossRef]
  15. Ibrahim, S.M.; Ayad, H.M.; Saadallah, D.M. Planning transit-oriented development (TOD): A systematic literature review of measuring the transit-oriented development levels. Int. J. Transp. Dev. Integr. 2022, 6, 378–398. [Google Scholar] [CrossRef]
  16. Zhang, M. Next-Gen TOD: Transforming Transit Oriented Development to Embrace New Challenges and Opportunities. Urban Rail Transit 2025, 1–14. [Google Scholar] [CrossRef]
  17. Pan, H. A 5D land-use transport model for a high density, rapidly growing city. In Sustainable Transport for Chinese Cities; Mackett, R.L., May, A.D., Kii, M., Pan, H., Eds.; Emerald Group Publishing Limited: Leeds, UK, 2012. [Google Scholar] [CrossRef]
  18. Yao, C.; Li, G.; Yan, S. Design Strategies to Improve Metro Transit Station Walking Environments: Five Stations in Chongqing, China. Buildings 2024, 14, 1025. [Google Scholar] [CrossRef]
  19. Nafi, S.; Ouahrani, D. Reshaping transit-oriented development to enhance sociocultural harmonization in the context of Qatar. J. Urban Mobil. 2025, 8, 100132. [Google Scholar] [CrossRef]
  20. Rogers, W.P., III; Chen, N.; Looye, J.W. Beyond traditional TOD: Integrating multiuse paths and bike share into public transit to address the first/last mile issue. Urban Rail Transit 2023, 9, 42–56. [Google Scholar] [CrossRef] [PubMed]
  21. Serra-Coch, G.; Chastel, C.; Campos, S.; Coch, H. Graphical approach to assess urban quality: Mapping walkability based on the TOD-standard. Cities 2018, 76, 58–71. [Google Scholar] [CrossRef]
  22. Ha, E.; Joo, Y.; Jun, C. An empirical study on sustainable walkability indices for transit-oriented development by using the analytic network process approach. Int. J. Urban Sci. 2011, 15, 137–146. [Google Scholar] [CrossRef]
  23. Chu, Y.; Cui, J.; Sun, J.; Guo, W. Research on Pedestrian Vitality Optimization in Creative Industrial Park Streets Based on Spatial Accessibility: A Case Study of Qingdao Textile Valley. Buildings 2025, 15, 1679. [Google Scholar] [CrossRef]
  24. Fan, P.Y.; Chun, K.P.; Mijic, A.; Tan, M.L.; Liu, M.S.; Yetemen, O. A framework to evaluate the accessibility, visibility, and intelligibility of green-blue spaces (GBSs) related to pedestrian movement. Urban For. Urban Green. 2022, 69, 127494. [Google Scholar] [CrossRef]
  25. Öztürk, Ö.; Gülgen, F.; Bilgi, S.; Kiliç, B. Accessibility analysis of street networks using space syntax. In Proceedings of the 7th International Conference on Cartography and GIS, Sozopol, Bulgaria, 18–23 June 2018. [Google Scholar]
  26. Kang, C.-D. The effects of spatial accessibility and centrality to land use on walking in Seoul, Korea. Cities 2015, 46, 94–103. [Google Scholar] [CrossRef]
  27. Marinelli, L.J.; Annunziata, A.; Caselli, B.; Desogus, G.; Torrisi, V.; Garau, C. Accessibility and polarities of pedestrian network in university campuses. A space syntax application. In International Conference on Computational Science and Its Applications; Springer Nature: Cham, Switzerland, 2023; pp. 383–400. [Google Scholar] [CrossRef]
  28. Şahin Körmeçli, P. Analysis of walkable street networks by using the space syntax and GIS techniques: A case study of Çankırı City. ISPRS Int. J. Geo-Inf. 2023, 12, 216. [Google Scholar] [CrossRef]
  29. Sajan, S.; Chowbarnika, M.; Dhanushree, N.V.; Gupta, N. Pedestrian Infrastructure and Accessibility in Urban Environments: An Analysis of Walkability, Connectivity, and Spatial Configuration in Kochi. In International Conference on Transportation Planning and Implementation Methodologies for Developing Countries; Springer Nature: Singapore, 2024; pp. 217–236. [Google Scholar] [CrossRef]
  30. Xu, J.; Xu, X.; Wang, Z.; Chen, H.; Ren, Q.; Huang, H.; Cui, Y.; An, R.; Liu, Y. Investigating thermal exposure during daily walking through a human-scale approach: An analysis of a hot summer in Wuhan. Build. Environ. 2024, 264, 111932. [Google Scholar] [CrossRef]
  31. Aghamolaei, R.; Azizi, M.M.; Aminzadeh, B.; O’Donnell, J. A comprehensive review of outdoor thermal comfort in urban areas: Effective parameters and approaches. Energy Environ. 2023, 34, 2204–2227. [Google Scholar] [CrossRef]
  32. Hillier, B.; Leaman, A.; Stansall, P.; Bedford, M. Space syntax. Environ. Plan. B Plan. Des. 1976, 3, 147–185. [Google Scholar] [CrossRef]
  33. Bedra, K.B.; Zheng, J.; Li, J.; Sun, Z.; Zheng, B. Automating Microclimate Evaluation and Optimization during Urban Design: A Rhino–Grasshopper Workflow. Sustainability 2023, 15, 16613. [Google Scholar] [CrossRef]
  34. Zhang, Y.; Liu, C. Digital Simulation for Buildings’ Outdoor Thermal Comfort in Urban Neighborhoods. Buildings 2021, 11, 541. [Google Scholar] [CrossRef]
  35. Chen, L.; Mak, C.M. Integrated impacts of building height and upstream building on pedestrian comfort around ideal lift-up buildings in a weak wind environment. Build. Environ. 2021, 200, 107963. [Google Scholar] [CrossRef]
  36. Zheng, X.; Chen, L.; Yang, J. Simulation framework for early design guidance of urban streets to improve outdoor thermal comfort and building energy efficiency in summer. Build. Environ. 2023, 228, 109815. [Google Scholar]
  37. Wang, H.; Zhang, R.; Jiang, L.; Zhang, L.; Yang, G. A Machine Learning-Based Multi-Objective Optimization and Decision Support Framework for Age-Friendly Outdoor Activity Spaces. Buildings 2026, 16, 1088. [Google Scholar] [CrossRef]
  38. Wu, R.; Huang, M.; Yang, Z.; Zhang, L.; Wang, L.; Huang, W.; Zhu, Y. Pix2Pix-Assisted Beijing Hutong Renovation Optimization Method: An Application to the UTCI and Thermal and Ventilation Performance. Buildings 2024, 14, 1957. [Google Scholar] [CrossRef]
  39. Zhou, L.; Li, B.; Li, S.; Lei, N.L.; Cheong, K. Transportation Integration Development in Hengqin and Macao. In Urban and Regional Cooperation and Development: Challenges and Strategies for the Planning and Development of the Guangdong–Macao Intensive Cooperation Zone in Hengqin Island; Springer: Singapore, 2022; pp. 67–85. [Google Scholar]
  40. Wu, B.; Gong, H.; Wang, X.; Cheng Vong, C. The Formation and Development of Macau’s Healthcare System. In E3S Web of Conferences; EDP Sciences: Les Ulis, France, 2024; Volume 565, p. 02019. [Google Scholar]
  41. Hernandez, R.; Bassett, S.M.; Boughton, S.W.; Schuette, S.A.; Shiu, E.W.; Moskowitz, J.T. Psychological well-being and physical health: Associations, mechanisms, and future directions. Emot. Rev. 2018, 10, 18–29. [Google Scholar] [PubMed]
  42. Li, X.; Wang, J.; Eftekhari, M.; Qi, Q.; Jiang, D.; Song, Y.; Tian, P. Improvement strategies study for outdoor wind environment in a university in Beijing based on CFD simulation. Adv. Civ. Eng. 2020, 2020, 8850254. [Google Scholar] [CrossRef]
  43. Vellei, M.; De Dear, R.; Inard, C.; Jay, O. Dynamic thermal perception: A review and agenda for future experimental research. Build. Environ. 2021, 205, 108269. [Google Scholar] [CrossRef]
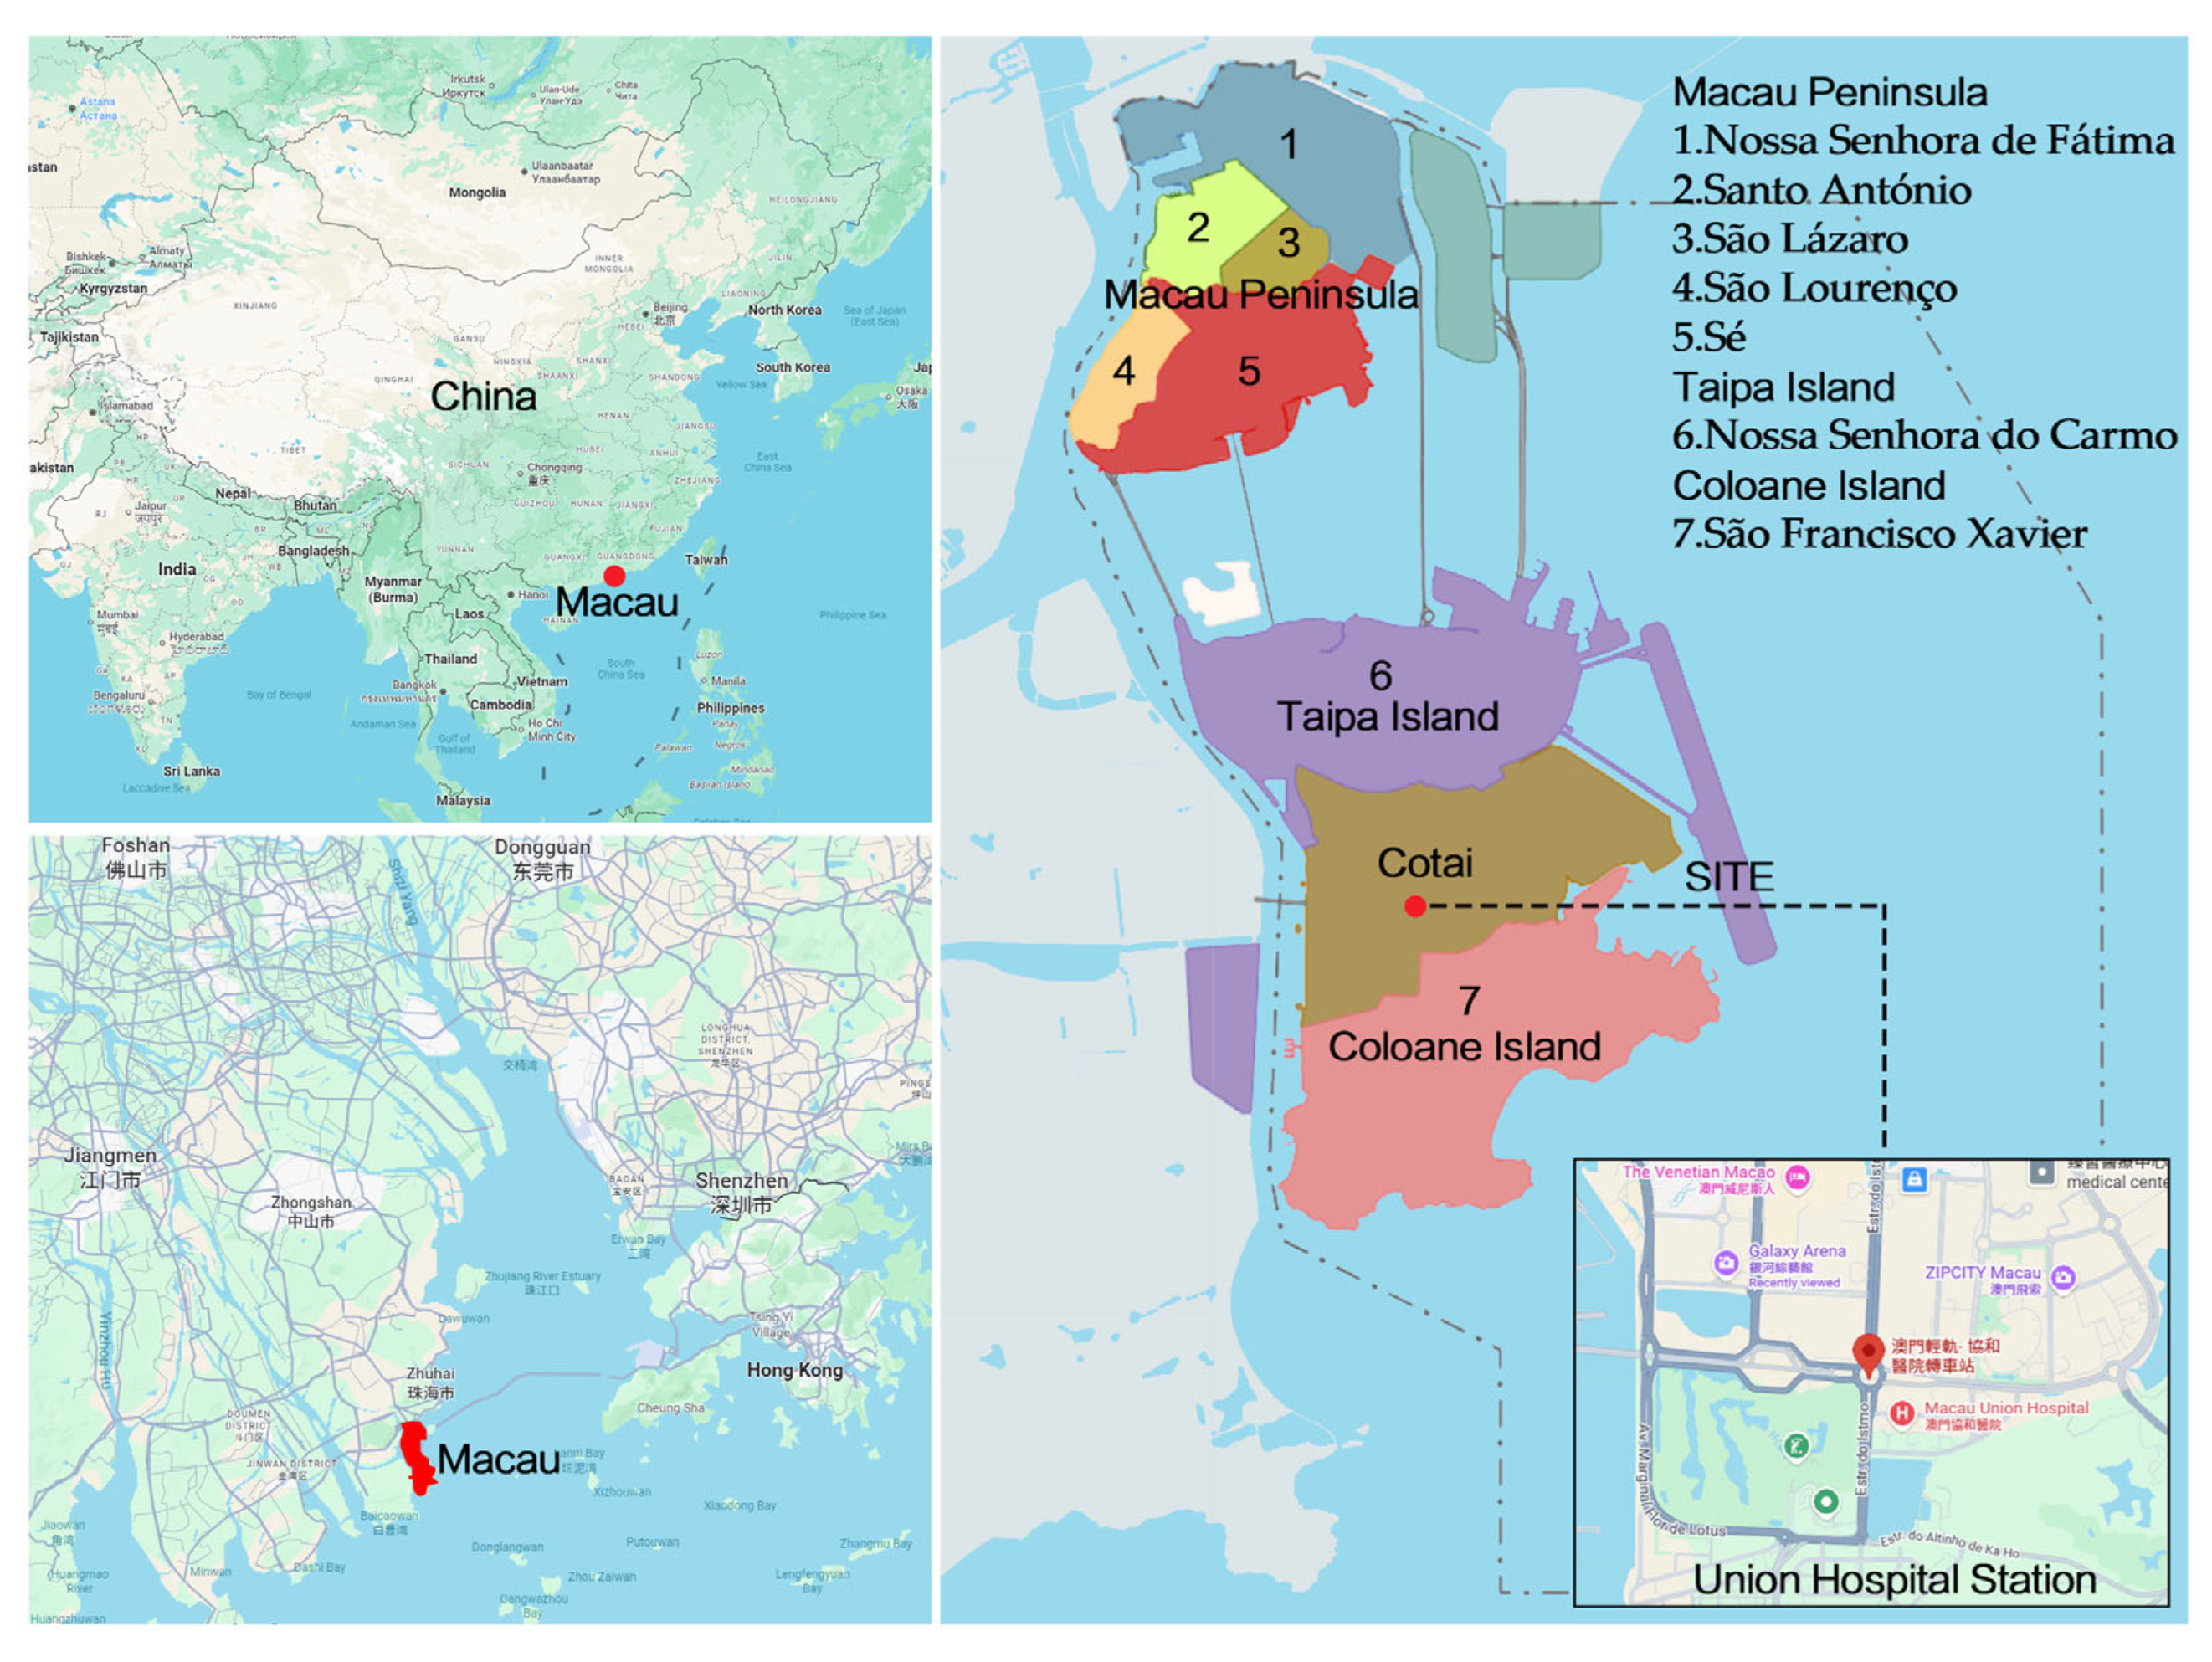
Figure 1. Location analysis of Macau. The Chinese characters in the picture are place names and have no specific meaning. The central geographical coordinates of Macau are approximately 113°32′ E, 22°12′ N. (Image source: Illustration by the author).
Atmosphere 17 00603 g001
Figure 2. Current situation and problems at Macau LRT Union Hospital Station. (1) Mixed Traffic. (2) Overpass Length. (3) Regional Fragmentation. (4) Facilities Without Sunshades. (Image source: Photographed by the author).
Atmosphere 17 00603 g002
Figure 3. Comparison of the renovation of Macau LRT Union Hospital Station before and after: (1) Before renovation; (24) After renovation. (Image source: Illustration by the author).
Atmosphere 17 00603 g003
Figure 4. Walking thermal comfort evaluation research process. (Image source: Illustration by the author).
Atmosphere 17 00603 g004
Figure 5. Outdoor thermal comfort battery pack in grasshopper. (Image source: Illustration by the author).
Atmosphere 17 00603 g005
Figure 6. Integration analysis: (a) Before the area was renovated; (b) After the area was renovated. (Image source: Illustration by the author).
Atmosphere 17 00603 g006aAtmosphere 17 00603 g006b
Figure 7. Comparison of annual temperature and temperature during the core daytime activity period before and after the renovation: (a) Annual temperature; (b) Core daytime activity period. (1) before renovation, while (2), (3), and (4) after renovation. (Image source: Illustration by the author).
Atmosphere 17 00603 g007aAtmosphere 17 00603 g007b
Figure 8. Comparison of seasonal temperatures and core daytime activity periods in all four seasons before and after the renovation. (a) Seasonal temperatures; (b) Core daytime activity periods in all four seasons. Among them, (1) is before the renovation, while (2), (3), and (4) are after the renovation. (Image source: Illustration by the author).
Atmosphere 17 00603 g008aAtmosphere 17 00603 g008b
Figure 9. Local UTCI thermal maps before and after the renovation: (1) Before the renovation; (24) After the renovation design. (Image source: Illustration by the author).
Atmosphere 17 00603 g009
Table 1. UTCI Microclimate Simulation Core Input Parameter Settings.
Parameter CategoriesParameter SettingsData Sources and Explanations
Meteorological Data SourcesMacau Typical Meteorological Year (TMY) EnergyPlus Meteorological (EPW) Format FileLadybug Tools Official Meteorological Database
Air Temperature and Relative HumidityDirectly Call EPW Hourly DataNo local spatial variation corrections performed
Wind SpeedDirectly Call EPW Hourly DataNo CFD wind field simulation or height conversion performed
Grid Resolution50 m × 50 mAdapted to site scale and computational efficiency
Measurement Point (Pedestrian) Height1.6 m Pure Geometric Solid ObstructionSimulates core human perception height
Plant Model SettingsLadybug Outdoor Solar MRT ModuleDoes not consider plant transpiration models and canopy transmittance
MRT Calculation MethodParameter SettingsDoes not consider plant transpiration models and canopy transmittance
Source: Author statistics.
Table 2. UTCI Thermal Stress Classification Standard.
UTCI Range (°C)Stress LevelKey Assessments
>46.0Extreme heat stressLife-threatening, immediate cooling measures required.
38.0~46.0Very strong heat stressSerious health risk: outdoor activities should be avoided.
32.0~38.0Strong heat stressSignificant discomfort and decreased physical activity capacity.
26.0~32.0Moderate heat stressMild discomfort, increased sweating.
9.0~26.0No thermal stressComfort zone, no additional adjustment required.
0~9.0Slight cold stressSlightly cold, requiring some warmth.
−13.0~0Moderate cold stressIt’s significantly cold and requires additional clothing.
−27.0~−13.0Strong cold stressCold discomfort and prolonged exposure should be avoided.
−40.0~−27.0Very strong cold stressSevere cold, risk of frostbite.
<−40.0Extreme cold stressLife-threatening requires immediate warming.
Source: Author statistics.
Table 3. Percentage of thermal comfort in all four seasons.
All Time
1-Year
Full Day (24 H)
ScenarioOriginal Site (%)Original Site + Building (%)Original Site + Building + Connecting Corridor (%)Original Site + Building + Connecting Corridor + Landscape (%)
SeasonSpringSummerAutumnWinterSpringSummerAutumnWinterSpringSummerAutumnWinterSpringSummerAutumnWinter
Hot38.090.052.87.835.089.550.86.035.089.550.756.03589.550.86.0
Moderate57.310.045.360.360.010.546.861.560.010.547.061.56010.547.061.5
Cold5.00.03.031.35.00.03.032.55.00.03.032.55.00.03.032.5
Table 4. Percentage of thermal comfort during core daytime activity periods in all four seasons.
All Time
1-Year
Core Daytime Activity Period (9 to 18 h, 9 h)
ScenarioOriginal Site (%)Original Site + Building (%)Original Site + Building + Connecting Corridor (%)Original Site + Building + Connecting Corridor + Landscape (%)
SeasonSpringSummerAutumnWinterSpringSummerAutumnWinterSpringSummerAutumnWinterSpringSummerAutumnWinter
Hot62.898.074.318.856.597.370.314.056.597.370.314.056.597.370.314.0
Moderate36.32.024.561.541.82.828.363.341.82.828.363.041.82.828.363.0
Cold2.00.01.019.52.30.01.322.52.30.01.322.52.30.01.322.5
Table 5. Stratified mean and staged reduction of 455 grid sampling points under different design strategy interventions.
Data Stratification Intervals:Number of Sampling Points(1) Original Model Mean(2) Original + Building MeanBuilding Intervention Reduction (Δ1)(3) Original + Building + Corridor MeanCorridor Intervention Reduction (Δ2)(4) Original + Building + Corridor + Landscape MeanLandscape Ecological Reduction (Δ3)
First 20.0% (High-temperature zone)9127.6 °C27.5 °C−0.1 °C27.4 °C−0.1 °C23.0 °C−4.3 °C
Middle 60.0% (Heat-exposed zone)27326.9 °C26.6 °C−0.2 °C25.6 °C−1.1 °C22.2 °C−3.4 °C
Last 20.0% (Shady zone)9123.2 °C23.1 °C−0.1 °C21.9 °C−1.1 °C20.7 °C−1.2 °C
Overall average45526.3 °C26.°C−0.2 °C25.2 °C−0.9 °C22.1 °C−3.1 °C
(Note: Δ1 = (2) − (1); Δ2 = (3) − (2); Δ3 = (4) − (3)) (Table source: Author’s own drawing).
Disclaimer/Publisher’s Note: The statements, opinions and data contained in all publications are solely those of the individual author(s) and contributor(s) and not of MDPI and/or the editor(s). MDPI and/or the editor(s) disclaim responsibility for any injury to people or property resulting from any ideas, methods, instructions or products referred to in the content.