1. Introduction
Nitrogen fertilizer has been central to the dramatic increases in global crop production over the past half-century, yet a large fraction of applied nitrogen is not recovered by crops and instead escapes to the environment through gaseous losses—principally as ammonia (NH
3) and nitrous oxide (N
2O) [
1,
2]. Global agricultural NH
3 emissions have grown rapidly since 1980, and synthetic fertilizers account for an average of 12–18% of the nitrogen applied that is lost as NH
3 [
1,
2]. Excessive NH
3 deposition drives soil acidification, eutrophication of water bodies, and—through secondary reactions with sulfur oxides and nitrogen oxides—the formation of fine particulate matter, contributing substantially to regional haze events [
3,
4]. N
2O is among the most potent anthropogenic greenhouse gases, with a 100-year global warming potential 273 times that of CO
2 [
5]; soils contribute more than 80% of total biospheric N
2O flux to the atmosphere [
6], and agricultural production accounted for approximately 74% of human-driven N
2O emissions in the 2010s, with direct agricultural emissions reaching 3.9 Tg N yr
−1 in 2020 [
7]. Managing both loss pathways simultaneously is, therefore, a central challenge for sustainable intensification of crop production, yet the contrasting sensitivities of NH
3 volatilization and N
2O emission to the same management inputs mean that interventions designed to reduce one gas frequently have limited or even counterproductive effects on the other [
8,
9].
Nitrogen application rate is the primary driver of both NH
3 volatilization and N
2O emissions, operating by elevating soil ammonium (NH
4+) concentrations that simultaneously provide a substrate for both hydrolysis-driven pH increases favorable to NH
3 formation and for nitrification–denitrification processes that produce N
2O [
10]. Soil pH exerts a particularly strong additional control on NH
3 volatilization: losses increase sharply above pH 7.5, as the thermodynamic equilibrium between NH
4+ and NH
3 shifts progressively toward the gaseous form with increasing alkalinity [
11]. Enhanced-efficiency fertilizers (EEFs), principally urease inhibitors (UI) such as N-(n-butyl) thiophosphoric triamide (NBPT) and nitrification inhibitors (NI) such as 3,4-dimethylpyrazole phosphate (DMPP), have been widely proposed as tools to reduce gaseous nitrogen losses by slowing urea hydrolysis and suppressing nitrification, respectively. Meta-analyses indicate that NBPT reduces cumulative NH
3 emissions by approximately 52–61% on average [
12,
13], while DMPP and related NIs reduce N
2O by approximately 49% [
14]. However, EEF effectiveness is strongly context-dependent, and the two inhibitor classes address fundamentally different loss pathways: field experiments in intensive maize cropping systems of northern China have demonstrated that the trade-off between NH
3 volatilization and N
2O reduction persists when NIs are applied at the soil surface [
9]. Critically, the NI application has been shown to increase NH
3 emissions by an average of 35.7% globally—with this NH
3 penalty positively correlated with soil pH—so that in alkaline soils the trade-off between N
2O reduction and NH
3 amplification becomes particularly pronounced [
8]. When indirect NH
3-derived N
2O is accounted for, the net climate benefit of NI application is substantially reduced [
8]. Furthermore, a 30-year global synthesis found that DMPP was statistically ineffective for N
2O reduction in alkaline soils, where soil pH and microbial community composition reduced its efficacy [
15]. These findings collectively indicate that the partial decoupling of NH
3 and N
2O pathways is not merely a theoretical concern but a quantifiable management reality, particularly under the alkaline soil conditions that characterize large irrigated agricultural regions of northern China.
The Hetao Irrigation District of Inner Mongolia, one of the three largest irrigation districts in China, exemplifies the intersection of these challenges [
16]. The district is characterized by alkaline soils (pH typically exceeding 8.0), conventional nitrogen application rates substantially above crop requirements, and seasonal flood irrigation delivering 3600–4500 m
3 ha
−1 through the Yellow River canal network—conditions under which crop nitrogen use efficiency averages well below 50% [
17], leaving a large nitrogen surplus that accumulates in the soil profile or is lost to the environment [
18,
19]. Residual mineral nitrogen in the soil profile following harvest represents a legacy pool susceptible to subsequent leaching and denitrification losses, and has been shown to reach 453–749 kg N ha
−1 in the 0–4 m soil profile of wheat and maize croplands across northern China under conventional nitrogen management, representing a substantial reservoir at risk of leaching under future rainfall intensification [
20]. Beyond soil nitrogen accumulation, China’s agricultural soils have been estimated to contribute approximately 23% of global NH
3 and 20% of global N
2O emissions from synthetic fertilizer use, with maize among the three leading reactive nitrogen emitters among crop types [
21]. Under flood irrigation, the rapid transition from aerobic to anaerobic soil conditions following inundation creates transient reducing environments that intensify denitrification and N
2O production within narrow post-irrigation time windows [
22], while the alkaline soil matrix simultaneously sustains high background rates of NH
3 volatilization [
11]. The combination of high pH, high nitrogen inputs, and repeated flood irrigation events, therefore, creates a system in which the performance of EEFs and the relative magnitudes of competing nitrogen loss pathways may diverge substantially from predictions based on studies conducted in more neutral, rainfed, or drip-irrigated systems. Despite the agronomic and environmental importance of this region, the trade-offs among gaseous nitrogen losses, residual soil nitrogen accumulation, and crop productivity under different fertilizer management strategies are governed by interactions among nitrogen rate, soil properties, and irrigation-induced anaerobic dynamics that vary substantially across systems and are difficult to predict from models or studies conducted under contrasting conditions [
23,
24]. Nevertheless, studies that simultaneously quantify cumulative NH
3 volatilization, N
2O emissions, and residual soil mineral nitrogen storage across a range of fertilizer management strategies—including direct assessment of soil pH effects on volatilization and evaluation of inhibitor performance—remain scarce for alkaline flood-irrigated maize production.
To address these gaps, we conducted a two-year field experiment (2019–2020) in the Hetao Irrigation District, comparing the effects of nitrogen application rate, fertilizer form, and enhanced-efficiency fertilizers on NH3 volatilization, N2O emissions, post-harvest soil mineral nitrogen storage, and maize grain yield. A soil pH manipulation sub-experiment was embedded within the main trial to directly quantify the contribution of soil alkalinity to NH3 volatilization efficiency under field conditions. The study addressed three questions: (1) Do nitrogen application rate, fertilizer formulation, and inhibitor inclusion exert differential effects on cumulative NH3 volatilization and N2O emissions, and which factors are the primary determinants of each loss pathway under alkaline flood-irrigated conditions? (2) How sensitive is NH3 volatilization efficiency to soil pH across a controlled gradient under field conditions? And (3) Which fertilizer management strategy most effectively balances the reduction of gaseous nitrogen losses, improvement of greenhouse gas emission intensity, and maintenance of grain yield in this system?
2. Materials and Methods
2.1. Study Site and Experimental Design
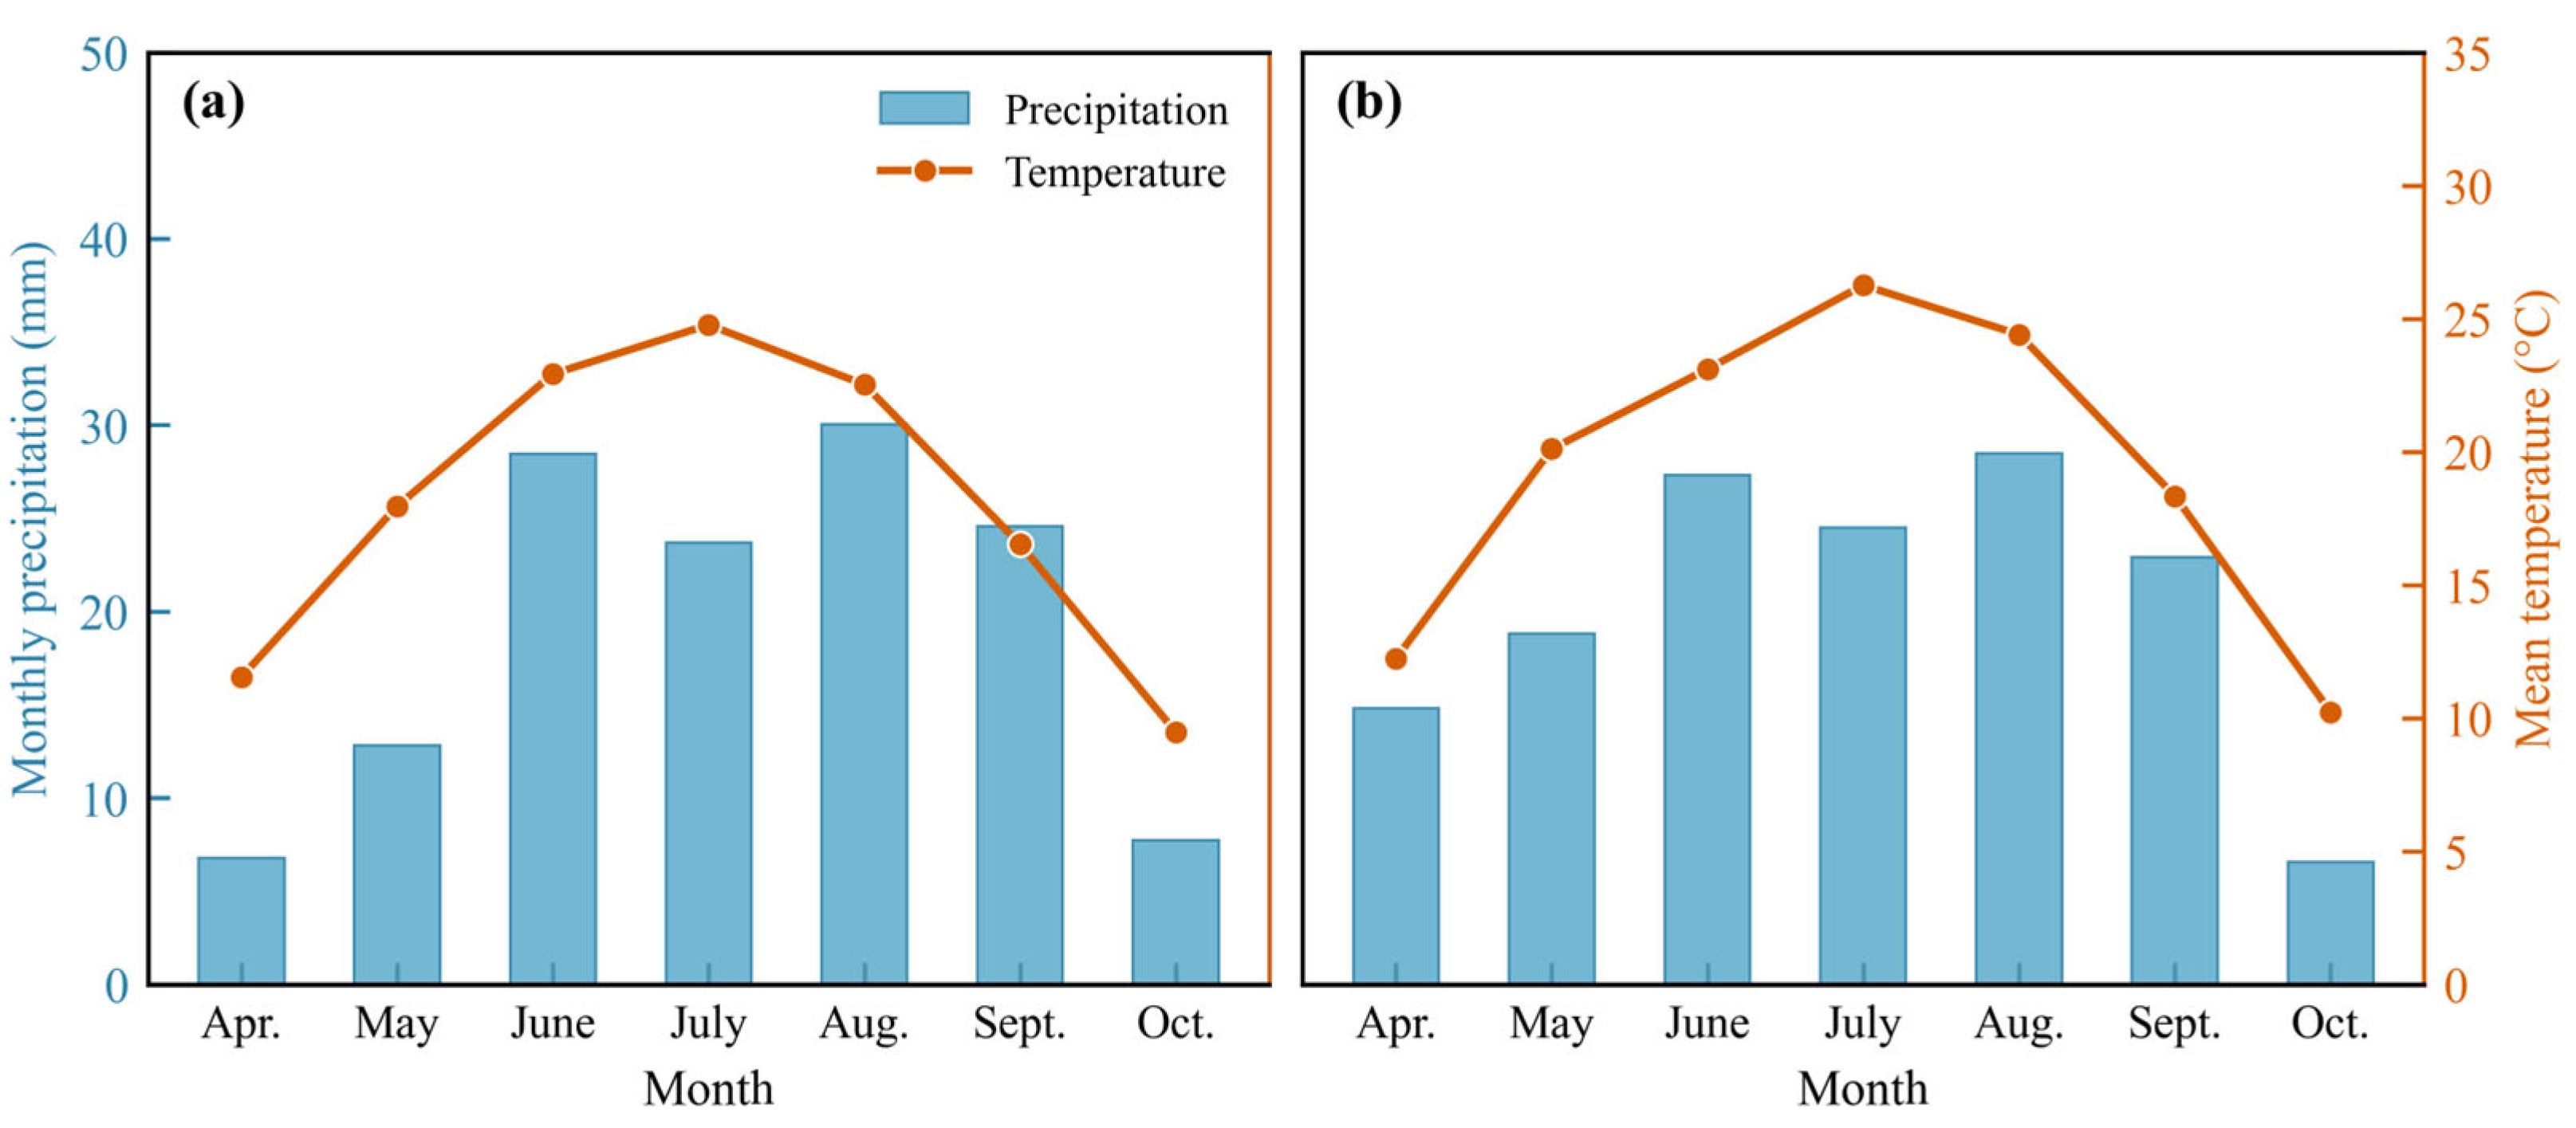
The field experiment was conducted at the Yonglian Village Research Base, Wuyuan County, Bayannur City, Inner Mongolia Autonomous Region, China (41°4′ N, 108°2′ E; altitude 1027 m a.s.l.). The site experiences a temperate continental climate with a mean annual temperature of 6.1 °C, a cumulative active temperature (≥10 °C) of 3362.5 °C, and a frost-free period of 117–136 days. Mean annual precipitation is 170 mm, concentrated predominantly in the summer and autumn months. Monthly precipitation and mean air temperature during the two growing seasons are presented in
Figure 1. The soil is classified as an Irragric Anthrosol (World Reference Base for Soil Resources, WRB), with a silt loam texture and a bulk density of 1.40 g cm
−3. Prior to experimental establishment, the topsoil (0–20 cm) had an organic matter content of 21.64 g kg
−1, alkaline-hydrolyzable N of 53.4 mg kg
−1, available P of 20.08 mg kg
−1, available K of 132.95 mg kg
−1, CaCO
3 equivalent content of 105.27 g kg
−1, CEC of 11.78 cmol(+) kg
−1, exchangeable sodium percentage (ESP) of 8.9%, and a pH of 8.8. Soil organic matter was determined by the potassium dichromate oxidation method, alkaline-hydrolyzable N by the alkaline hydrolysis diffusion method, available P by the sodium bicarbonate extraction method (Olsen method), available K by ammonium acetate extraction, CaCO
3 equivalent by the volumetric calcimeter method, CEC by the ammonium acetate method, ESP by calculation from exchangeable sodium and CEC, and pH in a 1:2.5 soil-to-water suspension [
25].
A two-year field experiment was conducted during the 2019 and 2020 maize (
Zea mays L.) growing seasons. The maize variety was Xinyu 12, sowing occurred at the end of April, and harvest occurred in early October in both years. Each experimental plot measured 6.5 m × 10 m. Six treatments were arranged in a randomized complete block design with four replications (
Table 1): an unfertilized control (CK); an optimized nitrogen rate applied as urea (OPT-U; 180 kg N ha
−1, determined by soil testing and fertilizer recommendation based on pre-experiment soil nutrient analysis and local maize nitrogen demand); a conventional high nitrogen rate applied as urea (CON-U; 400 kg N ha
−1, reflecting the mean application rate established through pre-experiment farmer surveys in the local area; urea combined with the urease inhibitor NBPT at the optimized rate (OPT-IU); ammonium sulfate alone at the optimized rate (OPT-AS); and ammonium sulfate combined with the nitrification inhibitor DMPP at the optimized rate (OPT-IAS).
Nitrogen was applied with 30% as a basal fertilizer and 70% as a topdressing. Basal fertilizer was incorporated into the soil prior to the first irrigation event. Topdressing was applied at the V6 growth stage, followed immediately by flood irrigation. Both inhibitor-treated fertilizers (OPT-IU and OPT-IAS) were commercially available pre-incorporated products: NBPT (N-(n-butyl) thiophosphoric triamide; purity ≥98%, water-soluble powder formulation) was pre-incorporated into urea at a rate of 1% of the fertilizer-N applied (w/w), and DMPP (3,4-dimethylpyrazole phosphate; purity ≥98%, water-soluble formulation) was pre-incorporated into ammonium sulfate at a rate of 1% of the ammonium-N content (w/w). Inhibitor-treated fertilizers were applied following the same split-application schedule as the corresponding non-inhibitor treatments, with no additional handling steps. Phosphorus (90 kg P ha−1) and potassium (120 kg K ha−1) fertilizers were applied uniformly as seed fertilizers in a single basal application across all treatments. Flood irrigation was applied three times per growing season, using water from the Yellow River supplied through the Hetao Irrigation District canal network. Irrigation volumes at crop growth stages V6, R1, and R4 were approximately 1200, 1000, and 1400 m3 ha−1, respectively, determined by flow meter readings at the branch canal, for a total seasonal irrigation volume of approximately 3600 m3 ha−1. All other agronomic practices followed local conventional management.
2.2. Soil pH Microplot Experiment
To isolate and directly quantify the effect of soil pH on NH3 volatilization under field conditions, soil pH manipulation microplots (1.5 m × 0.8 m) were established within each plot of the five fertilized treatments (OPT-U, CON-U, OPT-IU, OPT-AS, and OPT-IAS) across all four replicate blocks. Within each plot, one microplot was adjusted to elevated pH (pH+) and one to reduced pH (pH−), yielding four microplots per pH condition per treatment. Soil pH was adjusted in the upper 0–30 cm layer relative to the ambient plot pH (~8.8) by approximately ±0.5 units, yielding elevated (pH+, ~9.3–9.4) and reduced (pH−, ~8.3) conditions. Soil pH elevation was achieved by thoroughly mixing 110.16 g of calcium oxide (CaO) dissolved in water with the excavated topsoil; soil pH reduction was achieved by mixing 3.1 L of 0.368 mol L−1 sulfuric acid (H2SO4) with the excavated soil. Following the amendment, soil pH was analytically verified before backfilling.
The physical disturbance associated with soil excavation and backfilling required approximately 20 days for bulk density to return to values representative of the surrounding plot. Soil pH in each microplot was monitored continuously after adjustment; values converged to ambient plot levels by approximately day 22 post-adjustment and remained stable thereafter. Accordingly, differences in NH3 volatilization attributable to pH manipulation were detectable only within this ~22-day window. Because the settlement period precluded safe installation of static N2O flux chambers, pH effects on N2O emissions were not measured within the microplots and are evaluated only through the main-plot treatment comparisons.
2.3. NH3 Volatilization Measurement
Ammonia volatilization was quantified using the ventilation (venting) method following the protocol of Wang [
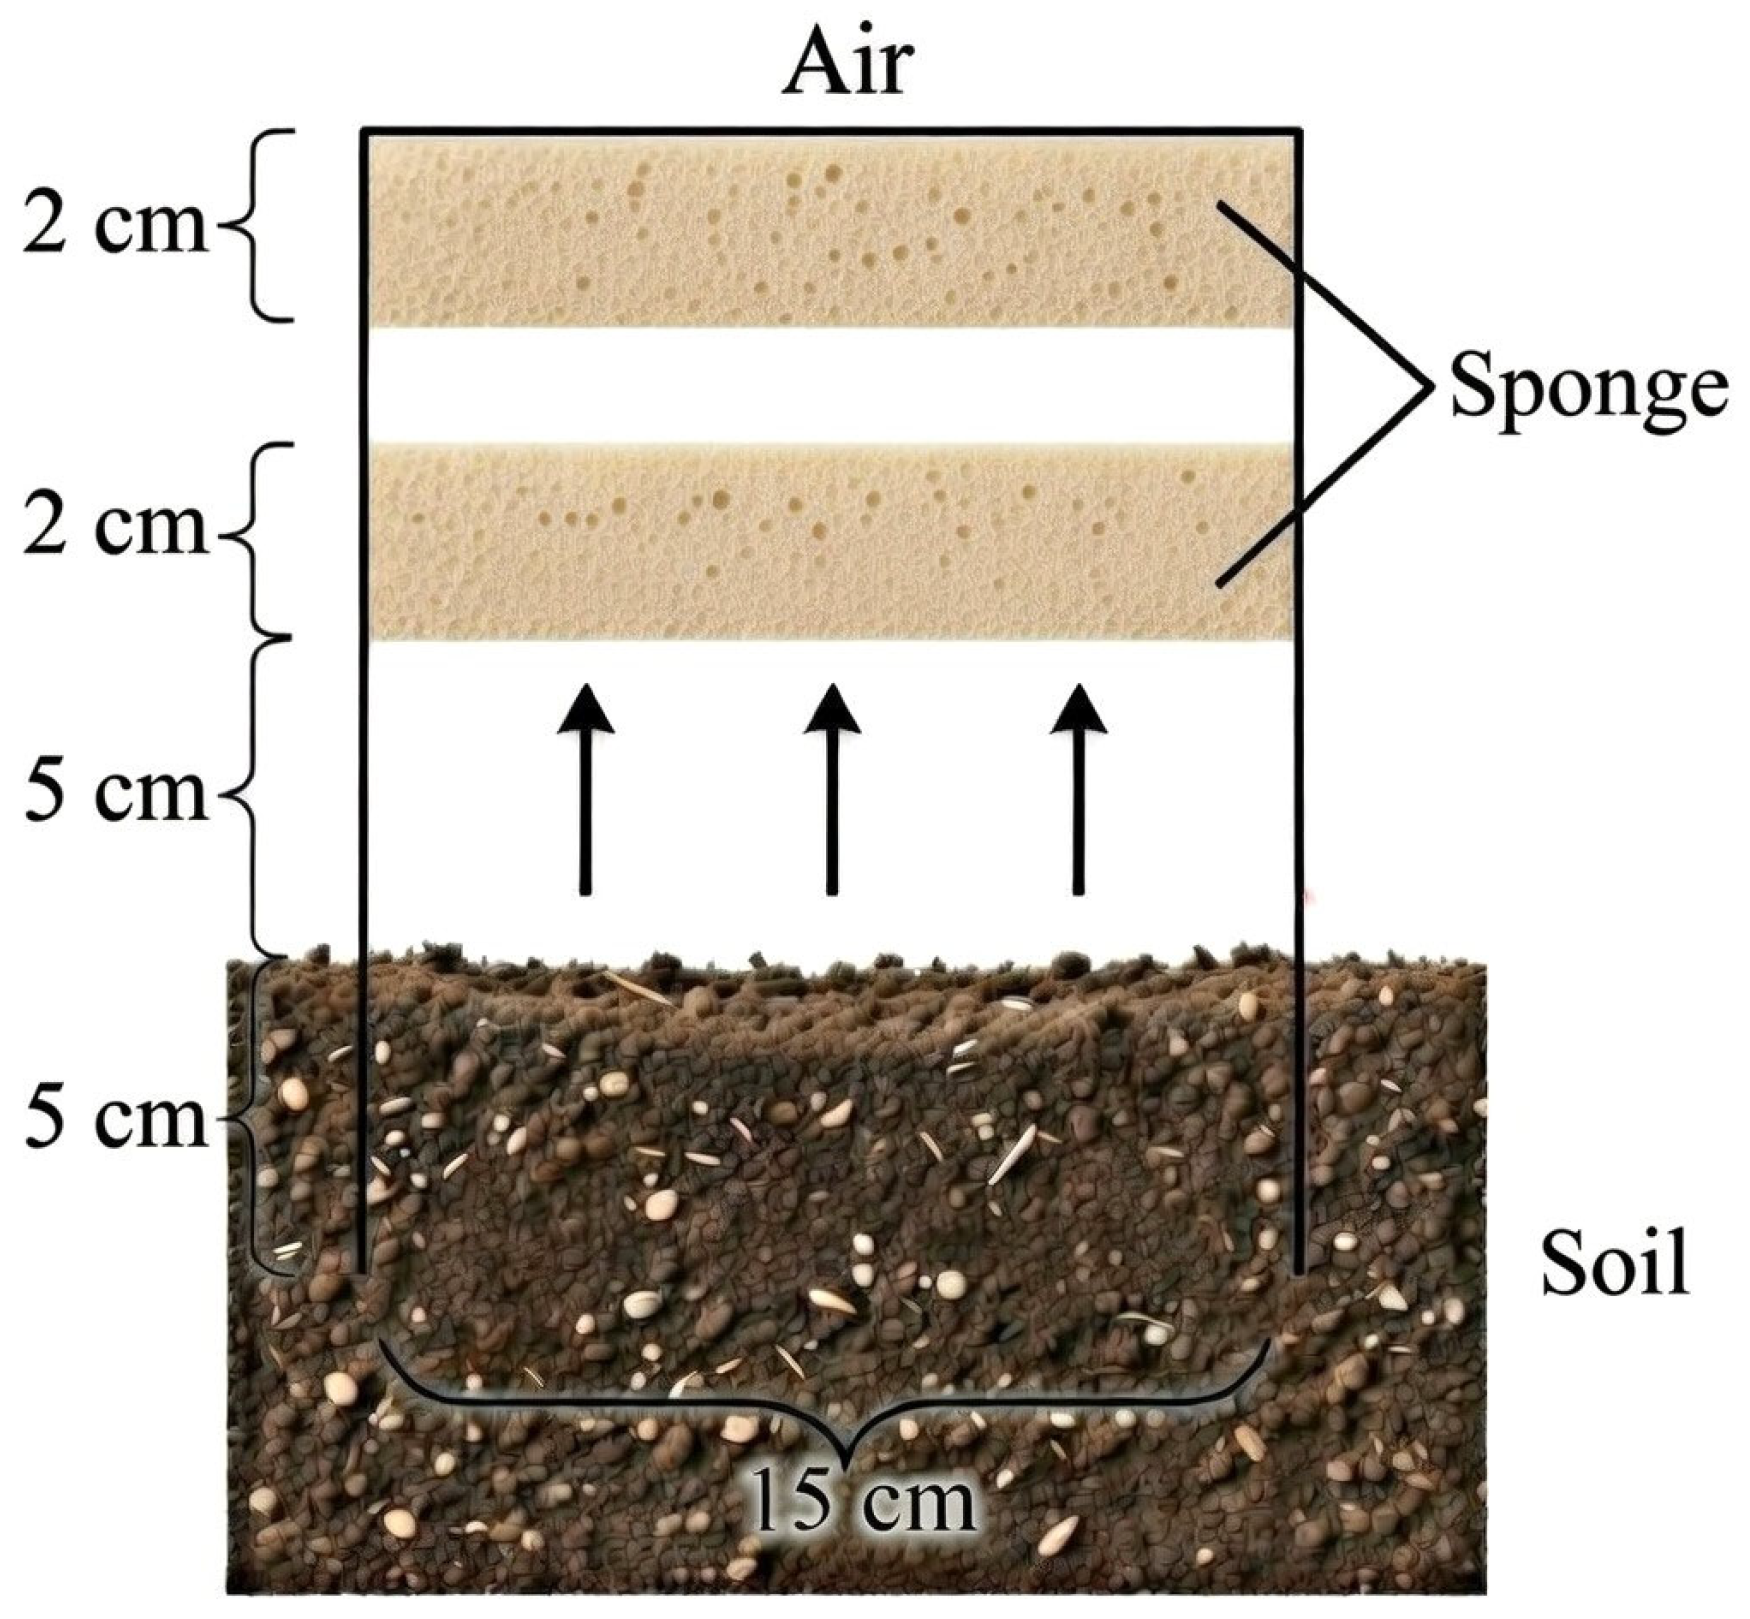
26]. Each capture device consisted of a rigid polyvinyl chloride (PVC) tube (inner diameter 15 cm, height 15 cm) fitted with two polyurethane sponges (diameter 16 cm, thickness 2 cm each) pre-soaked in 15 mL of glycerol-phosphate absorption solution (50 mL phosphoric acid and 40 mL glycerol, adjusted to 1000 mL with deionized water). The lower sponge was positioned 5 cm from the tube base; the upper sponge was placed flush with the tube rim (
Figure 2). Each device was placed with its base resting on the soil surface, enclosing the measurement area in a cap-like configuration without soil insertion, thereby allowing free gas exchange at the soil–device interface. Three devices were deployed randomly per plot, positioned away from plot borders to avoid inter-plot contamination; the same deployment of three devices was applied within each microplot.
Monitoring commenced on the day following each fertilization event. During the 6-day intensive monitoring window after each fertilization and irrigation event, sampling was conducted every 2 days; during non-intensive periods, frequency was reduced to every 15–25 days. At each interval, sponges were retrieved and extracted with 300 mL of 2 mol L
−1 KCl solution by oscillation for 1 h, and the NH
3-N concentration in the extract was determined using a continuous-flow analyzer (AA3, Bran + Luebbe GmbH, Norderstedt, Germany). The NH
3 volatilization rate (
N, kg ha
−1 d
−1) and cumulative seasonal losses were calculated by linear interpolation between consecutive sampling dates. NH
3 volatilization efficiency (%) was expressed as the ratio of cumulative NH
3 volatilization to total nitrogen applied.
where
M is the mean NH
3-N mass (mg) captured by a single device,
A is the cross-sectional area of the capture device (m
2), and
D is the interval between successive measurements (
d).
2.4. N2O Flux Measurement
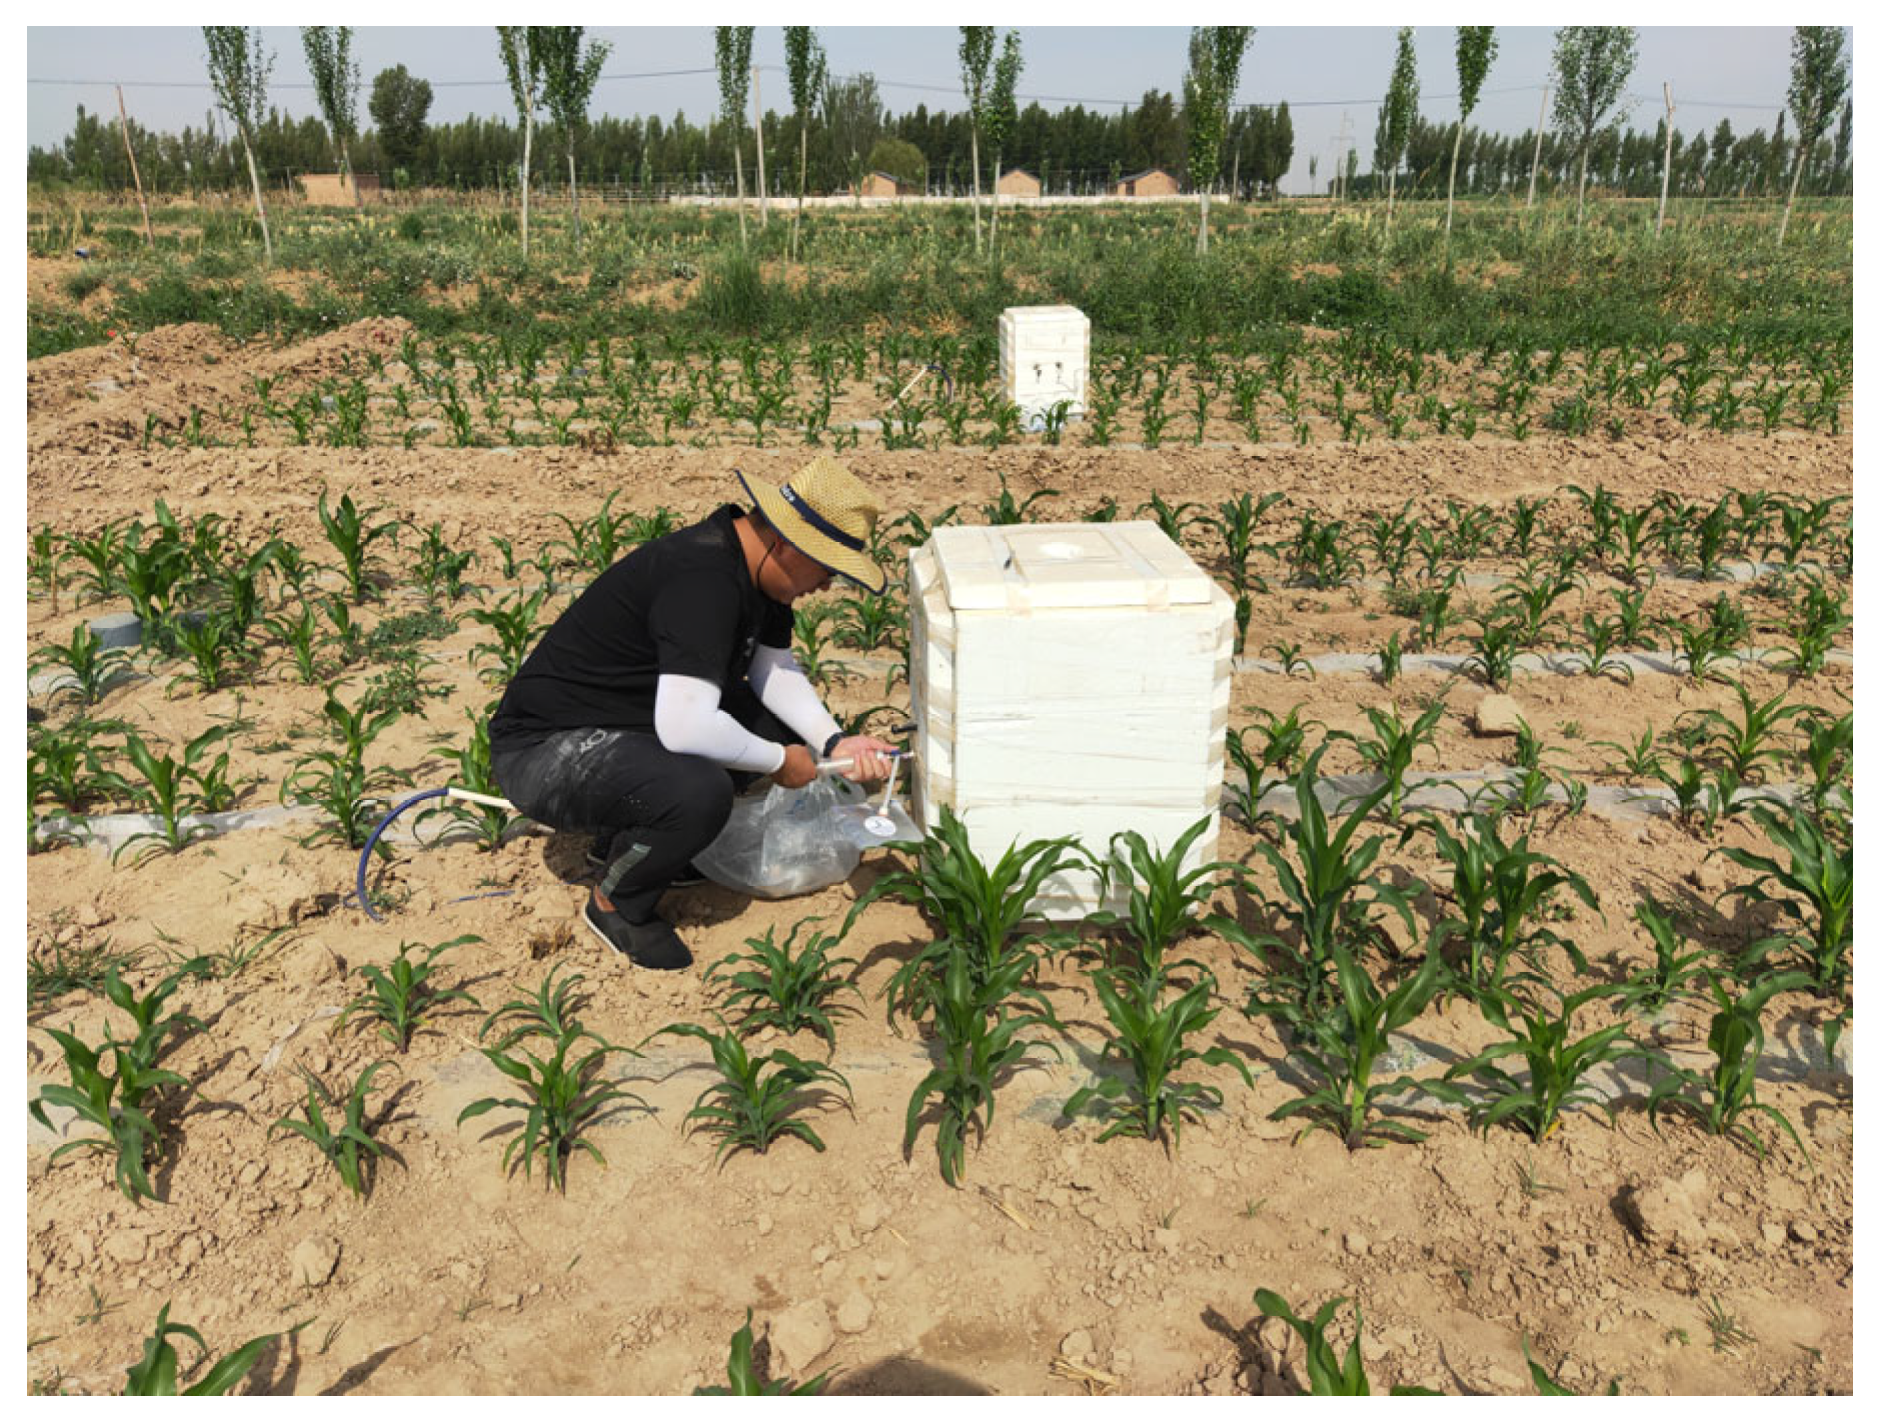
Nitrous oxide emission flux was measured using the static closed-chamber method. One chamber system was permanently installed per experimental plot, giving 24 chambers in total (6 treatments × 4 replicates). Each chamber system consisted of a stainless steel box (50 cm × 50 cm × 70 cm, wall thickness 1.2 cm) externally insulated with a foam layer, mounted on a permanently installed stainless steel base frame (50 cm × 50 cm × 15 cm, inserted 12 cm into the soil) fitted with a water-filled sealing channel (
Figure 3). A three-way sampling valve and temperature port were positioned ~25 cm above the base frame.
Gas samples were collected at 10-day intervals during the background monitoring period (i.e., all periods outside the post-event intensive windows), increasing to every 2 days during the 7-day period following each fertilization and flood irrigation event, as flood inundation independently generates transient anaerobic conditions that drive significant N2O pulses. In both years, the growing season extended from late April (sowing) to early October (harvest), approximately 155 days. Intensive sampling was therefore triggered on three occasions: (i) the first flood irrigation combined with topdressing in mid-May; (ii) the second flood irrigation in mid-June; and (iii) the third flood irrigation in early July. All sampling was conducted between 08:30 and 11:30 h local time, a window selected to approximate the daily mean N2O flux consistent with standard protocols widely adopted in static closed-chamber studies in northern Chinese cropping systems. Sampling was carried out simultaneously by multiple field teams, with chamber closure times staggered across plots to ensure all measurements fell within this window; each plot required approximately 35 min to complete. In total, approximately 24 sampling occasions were conducted per plot per growing season (12 intensive and approximately 12 background occasions), yielding approximately 96 gas samples per plot per season (4 time-point samples × 24 occasions) and approximately 4600 gas samples across all plots and both growing seasons.
Gas samples were withdrawn by syringe at 0, 10, 20, and 30 min after chamber closure and transferred to pre-evacuated vials; N2O concentrations were determined using a Picarro G2308 cavity ring-down spectroscopy analyzer (Picarro Inc., Santa Clara, CA, USA). Cumulative N2O emissions were calculated by trapezoidal interpolation between consecutive flux measurements.
The N
2O emission flux (
F, μg m
−2 h
−1) was calculated as:
where
is the gas density of N
2O under standard conditions (kg m
−3),
h is the effective headspace height of the sampling chamber (m), calculated as the total internal chamber height (0.70 m) minus the depth of the base frame inserted into the soil (0.12 m), giving
h = 0.58 m; Δ
c/Δ
t is the rate of N
2O concentration change within the chamber (μL L
−1 h
−1), 273 is the absolute temperature at 0 °C (K), and
T is the mean air temperature (°C) inside the chamber during sampling. All flux values were converted to daily emission flux units (g ha
−1 d
−1) to facilitate inter-period comparisons.
Cumulative N
2O emissions (g ha
−1) were calculated by trapezoidal interpolation between consecutive sampling dates:
where
CE is the cumulative N
2O emission (g ha
−1),
Fi and
Fi+1 are the emission fluxes at two consecutive sampling times (mg m
−2 h
−1), and
d is the number of days between adjacent sampling intervals.
2.5. Post-Harvest Soil Mineral Nitrogen and Profile Nitrogen Storage
To assess the residual soil nitrogen remaining in the soil profile at the end of each growing season, soil samples were collected by depth increment (0–30, 30–60, and 60–90 cm) from each plot immediately following maize harvest in both 2019 and 2020. At each plot, three soil cores were extracted using a soil auger and composited by depth layer to yield one representative sample per layer per plot. Fresh soil subsamples were extracted with 2 mol L−1 KCl solution (soil:solution ratio 1:5, w/v) by shaking for 1 h at room temperature, followed by filtration through Whatman No. 42 filter paper. Ammonium nitrogen (NH4+-N) and nitrate nitrogen (NO3−-N) concentrations in the filtrate were determined colorimetrically using a continuous flow analyzer (AA3, Bran + Luebbe GmbH, Norderstedt, Germany). Extract concentrations (mg L−1) were converted to a soil dry-mass basis (mg kg−1) using the 1:5 extraction ratio prior to calculation of nitrogen storage.
Soil nitrogen storage (
S, kg ha
−1) within each depth increment was calculated as:
where
C is the NH
4+-N or NO
3−-N concentration expressed on a soil dry-mass basis (mg kg
−1),
is the soil bulk density (g cm
−3) of the respective layer, and
d is the thickness of the soil layer (cm). The factor 10 converts units to kg ha
−1. Total profile nitrogen storage (0–90 cm) was obtained by summing the storage values across all three depth increments. Soil bulk density for each layer was determined from undisturbed core samples collected at the beginning of the experiment using the cutting-ring method.
2.6. Maize Grain Yield Measurement
Grain yield was determined at physiological maturity in a representative harvest area of 6.6 m2 per plot, avoiding border rows. Harvested grain was oven-dried to a constant weight, and yield was expressed as dry matter yield (kg ha−1) adjusted to a standard moisture content of 14%.
2.7. Greenhouse Gas Warming Potential and Emission Intensity
The global warming potential (
GWP, kg CO
2-eq ha
−1) attributable to N
2O emissions during the crop growing season was calculated as:
where
RN2O is the cumulative N
2O emission during the growing season (kg ha
−1), and the factor 273 reflects the 100-year global warming potential of N
2O relative to CO
2 [
5]. Background GWP from CH
4 and CO
2 soil respiration was determined from concurrent static chamber flux measurements at the experimental site during the 2019–2020 growing seasons, yielding a site-specific value of 3023 kg CO
2-eq ha
−1, which was incorporated into the total GWP calculation for each treatment.
The greenhouse gas emission intensity (GHGI, kg CO
2-eq kg
−1 grain) was calculated as:
where Yield is the grain yield (kg ha
−1) of maize at harvest.
2.8. Statistical Analysis
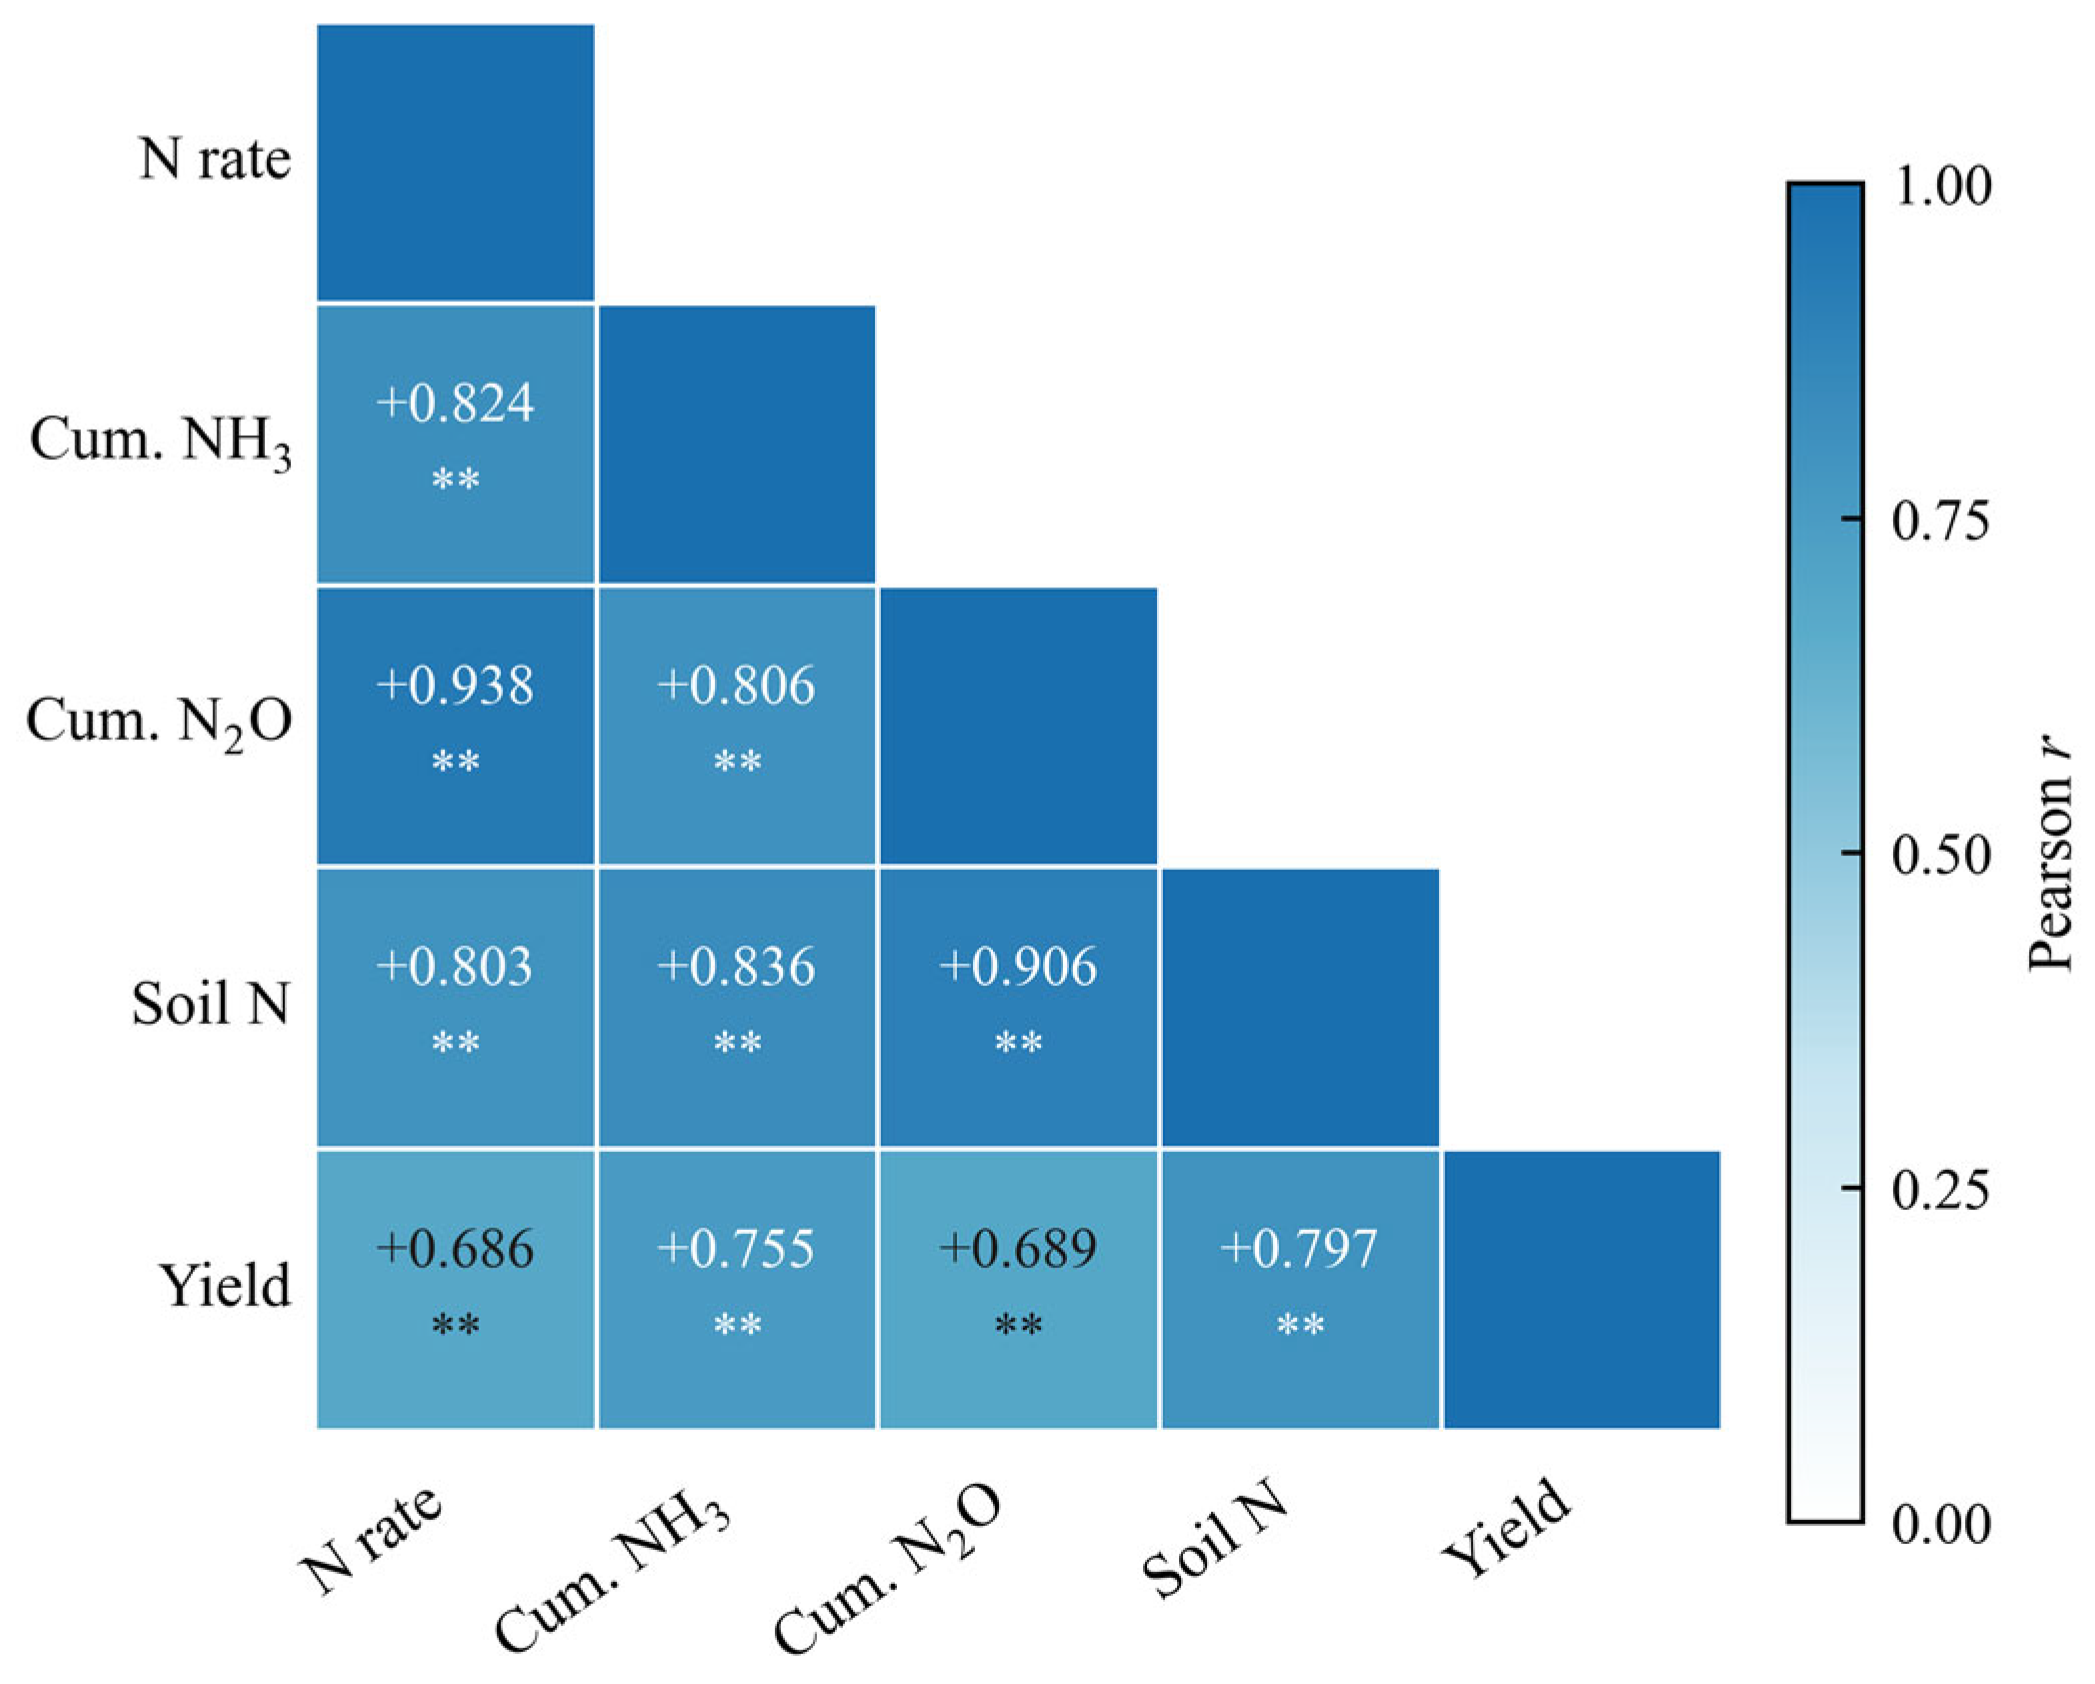
All data were compiled in Microsoft Excel 2024. Statistical analyses were performed in SPSS Statistics v30.0 (IBM Corporation, Armonk, NY, USA). Figures were produced using Python 3.13 with the Matplotlib library (v3.10.6). Each treatment was replicated in four independent blocks (n = 4); sub-plot measurements within each plot—three NH3 capture devices and three composited soil cores per depth increment—were averaged to yield a single plot-level value prior to analysis, so that the plot mean constituted the unit of replication throughout. Because year represented a confounded climatic and pedological covariate rather than a controlled experimental factor, one-way ANOVA was conducted independently for each growing season, with treatment as the sole factor; cross-year robustness of treatment effects was evaluated by the consistency of treatment rank orders and significance patterns across both years. Differences among treatment means for cumulative NH3 volatilization, cumulative N2O emissions, post-harvest soil mineral nitrogen storage, GWP, GHGI, and grain yield were evaluated using one-way ANOVA for each year separately, followed by Duncan’s multiple-range test for post-hoc pairwise comparisons (p < 0.05). To evaluate the effects of fertilizer treatment and soil pH manipulation on NH3 volatilization efficiency, a two-way mixed ANOVA was performed for each year separately, with Treatment as the between-subject factor and pH condition (pH−, ambient, pH+) as the within-subject factor, using block as the subject unit. To evaluate the effect of growth stage on cumulative NH3 volatilization and N2O emissions, one-way ANOVA was performed with growth stage (Period 1, Period 2, and Period 3) as the independent variable across all treatments for each year separately. The significance threshold was set at p < 0.05. Pearson correlation coefficients were computed among nitrogen application rate, cumulative NH3 volatilization, cumulative N2O emissions, post-harvest soil nitrogen storage, and grain yield using plot-level observations pooled across both years (n = 48). Ninety-five percent confidence intervals for each correlation coefficient were calculated using the Fisher z-transformation. To assess interannual stability, correlations were additionally computed separately for each growing season (n = 24 per year). Significance was assessed at p < 0.05 and p < 0.01.
4. Discussion
The results demonstrate that nitrogen application rate was the primary driver of both NH
3 volatilization and N
2O emissions, consistent with its role in elevating soil ammonium concentrations, which simultaneously supply substrate for volatilization and for microbial nitrification–denitrification processes [
27,
28]. However, the two loss pathways responded differently to fertilizer formulation and inhibitor application, indicating that nitrogen rate alone does not determine their relative magnitudes. NH
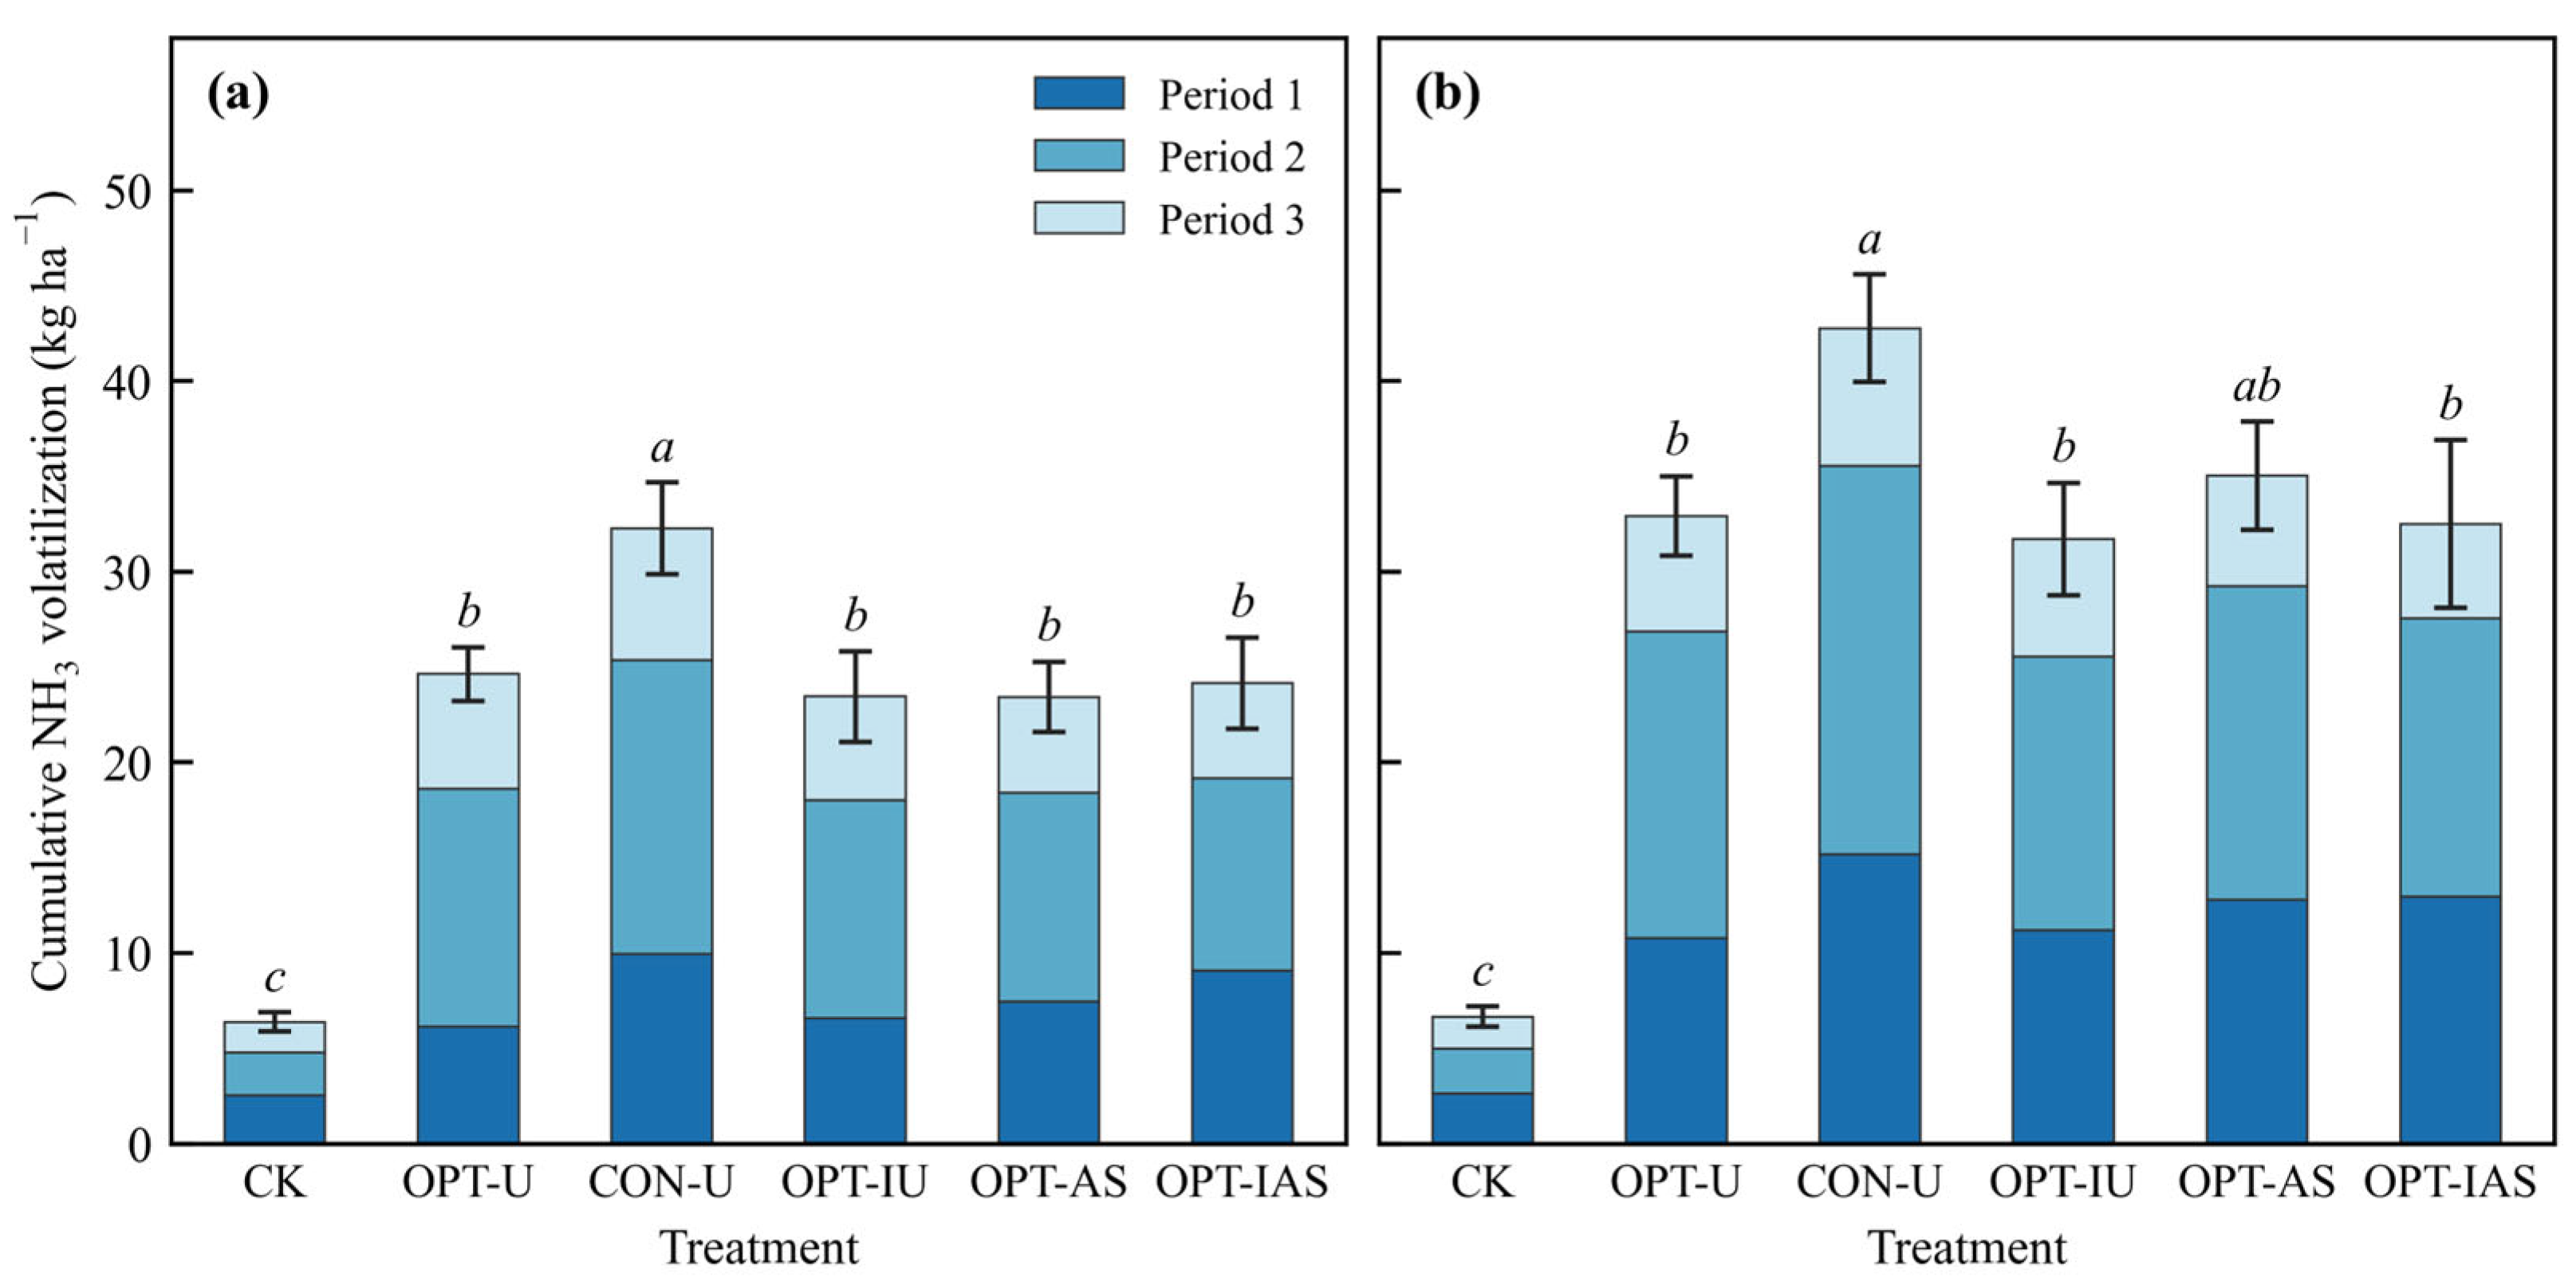
3 volatilization was insensitive to fertilizer formulation and inhibitor inclusion, whereas N
2O emissions differed significantly between ammonium sulfate-based and urea-based formulations and were substantially reduced when inhibitors were included. This divergence reflects the fundamental mechanistic distinction between NH
3 volatilization—a physicochemical equilibrium process governed by soil pH and ammonium availability—and N
2O production—a biologically mediated process dependent on nitrifier and denitrifier activity [
29]. The insensitivity of NH
3 volatilization to fertilizer formulation is consistent with evidence that the loss difference between urea and ammonium sulfate virtually disappears once soil pH exceeds 7.0, when thermodynamic control of the NH
4+–NH
3 equilibrium overrides substrate-level effects of fertilizer formulation [
30]. Similar decoupling between the two pathways has been documented in northern Chinese cropping systems, where urease and nitrification inhibitors target biochemically distinct steps in the nitrogen transformation sequence, and NH
3 and N
2O responses to the same management inputs consistently diverge [
9].
Soil pH exerted a dominant influence on NH
3 volatilization efficiency, overriding the effects of fertilizer formulation and inhibitor application. The microplot pH manipulation experiment demonstrated that a change of only 0.5 pH units at the ambient site pH of ~8.8 altered volatilization efficiency by up to 25% upward and up to 18% downward, relative to ambient conditions. This asymmetric sensitivity is consistent with the nonlinear relationship between pH and the NH
4+–NH
3 equilibrium, in which the proportion of dissolved ammonium present as volatile NH
3 increases sharply above pH 7.5 [
11]. Large-scale data syntheses across Chinese upland crops and Mediterranean calcareous systems consistently identify soil pH as the most important edaphic variable controlling NH
3 volatilization, surpassing fertilizer type, application method, and crop type in relative importance [
31,
32], and the within-site, within-season pH manipulation conducted here provides more direct evidence of this relationship under field conditions than cross-site comparisons allow.
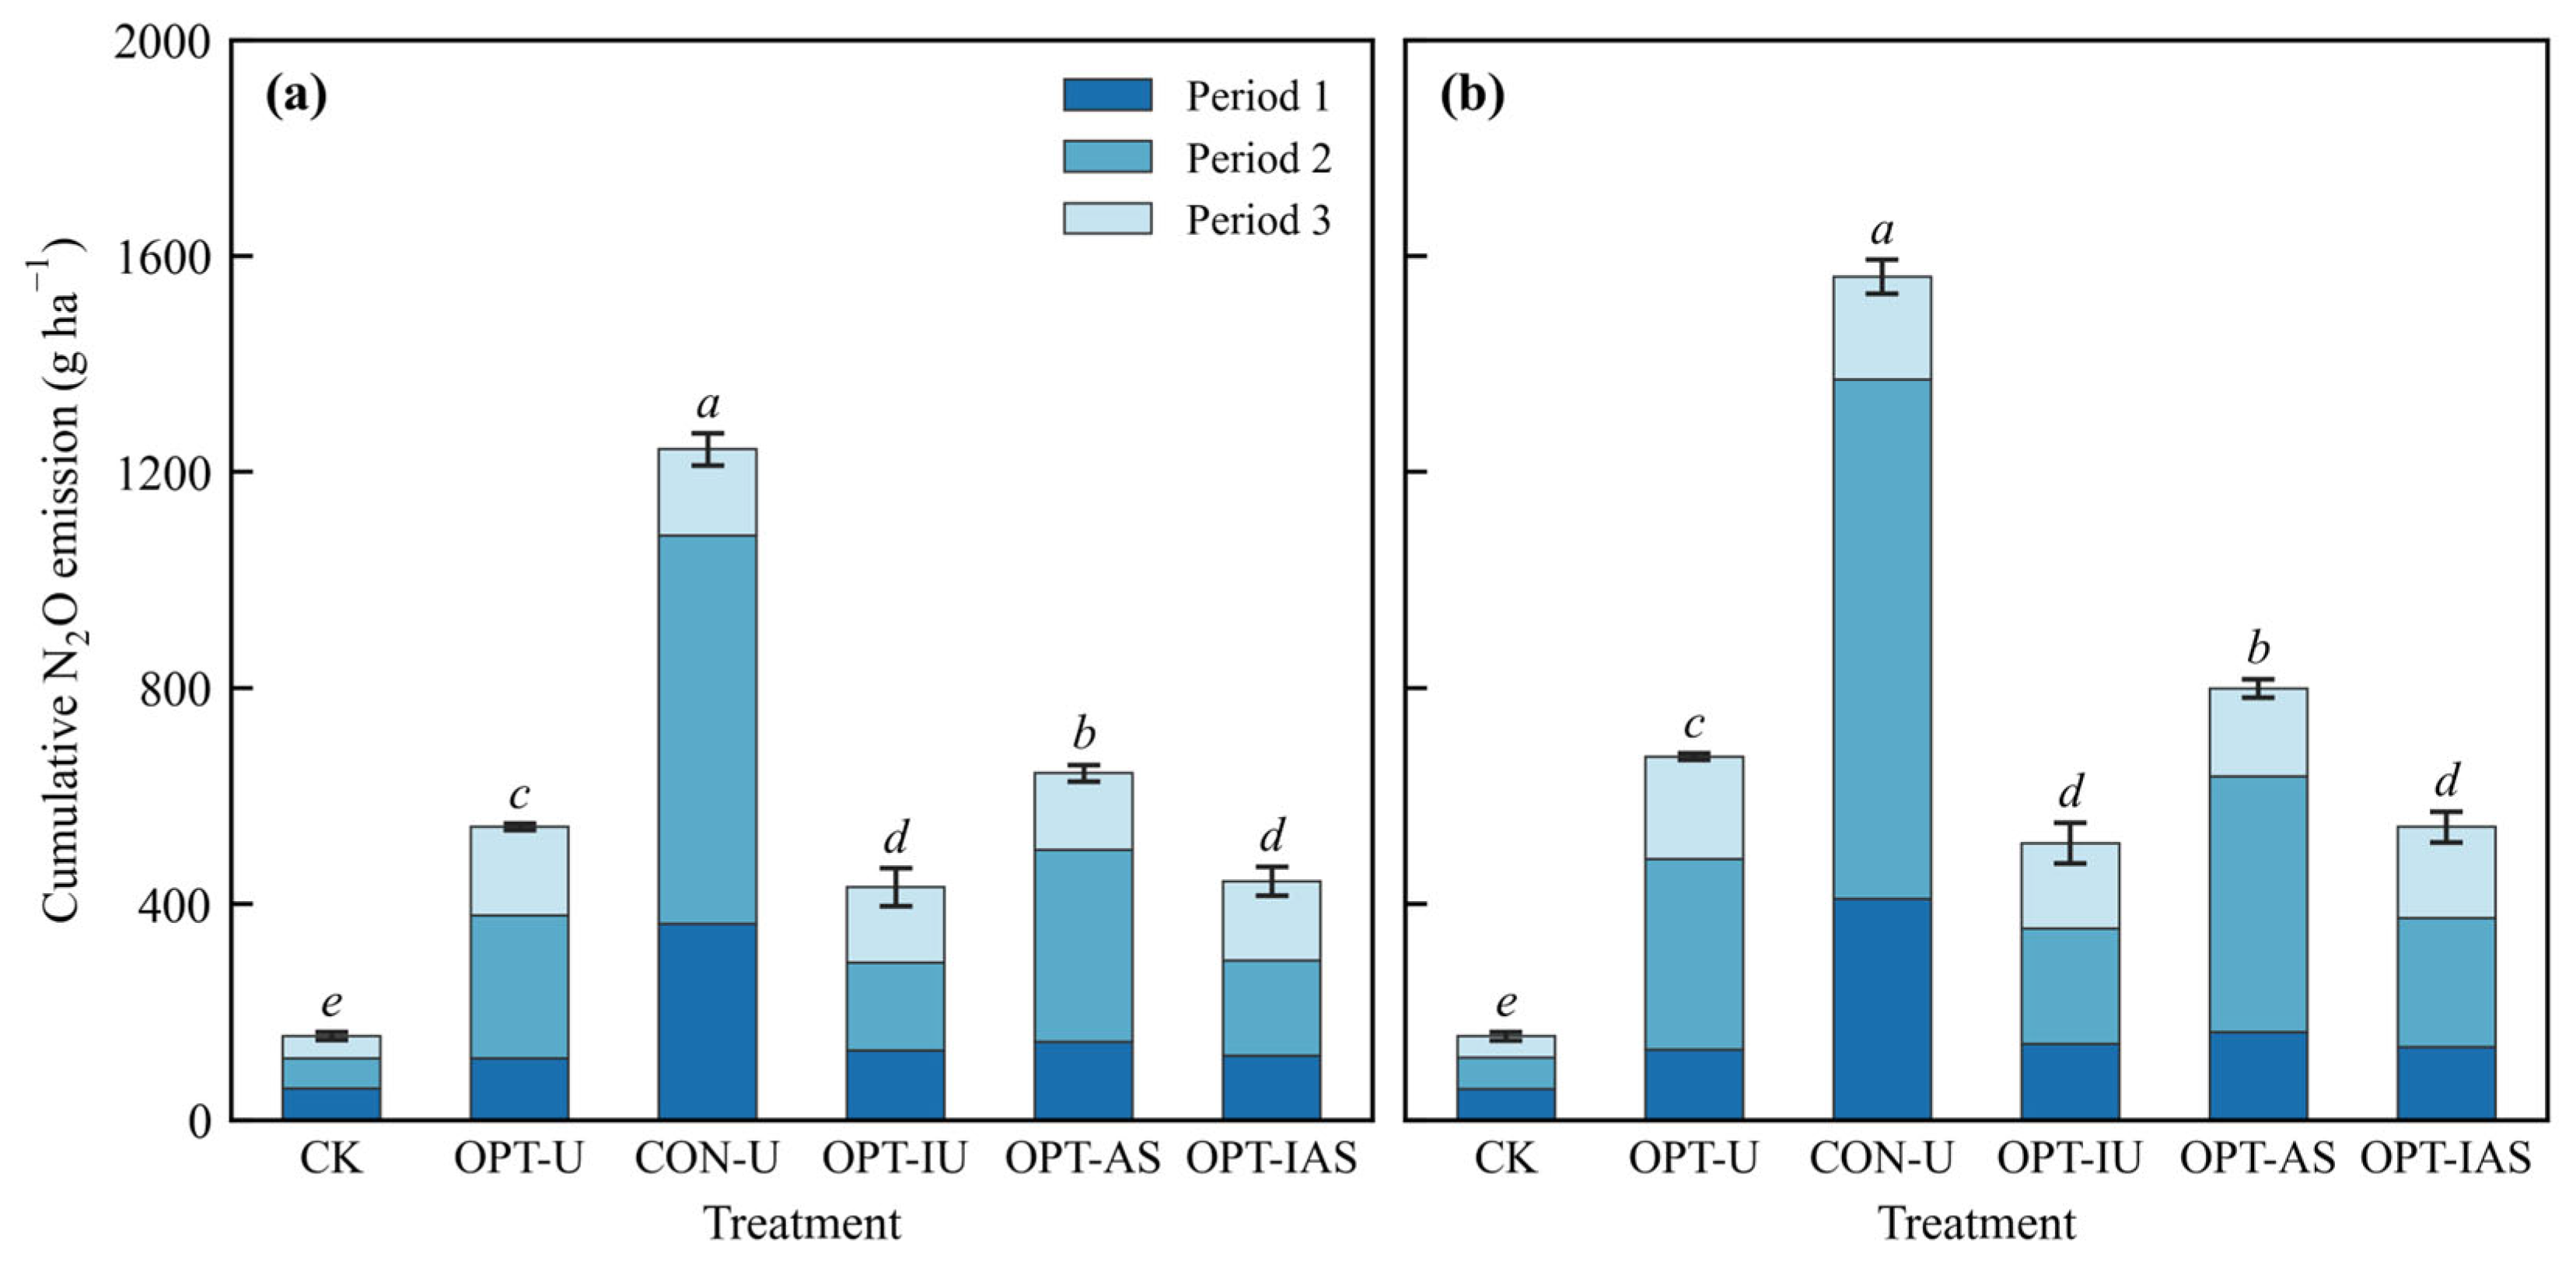
The higher N
2O emissions observed under OPT-AS relative to OPT-U at equivalent nitrogen rates are consistent with the immediate availability of NH
4+ in ammonium sulfate, which enters the nitrification pathway without the hydrolysis step required for urea and may therefore sustain higher rates of ammonia oxidation during the critical post-irrigation period [
33]. In alkaline soils, ammonia-oxidizing bacteria (AOB) dominate the nitrification process and are the primary contributors to nitrification-derived N
2O production, with NH
4+ amendment shown to stimulate AOB activity and N
2O emissions particularly at high pH [
34]. In calcareous fluvo-aquic soils of northern China—geochemically comparable to the alkaline irrigated soils of the Hetao District—isotopomeric evidence has demonstrated that NH
4+-based fertilizer application actively drives O
2 consumption and induces suboxic conditions, under which ammonia oxidation and linked nitrifier denitrification together account for the large majority of total N
2O production [
35]. Under transiently anaerobic conditions generated by flood inundation, both nitrifier denitrification and heterotrophic denitrification respond strongly to NH
4+ substrate availability at low O
2 concentrations [
36], providing a plausible mechanistic basis for the elevated N
2O observed under ammonium sulfate. A two-year field experiment in irrigated maize independently found that ammonium sulfate produced the highest cumulative N
2O losses among tested fertilizer types regardless of irrigation system, with DMPP being the most effective mitigation strategy [
37], consistent with the pattern observed here. However, as direct measurements of soil O
2 dynamics, nitrification rates, and denitrification rates were not conducted in the present study, the relative contributions of nitrifier denitrification and heterotrophic denitrification to the observed N
2O difference between OPT-AS and OPT-U cannot be quantified, and the pathway attribution remains inferential. Nonetheless, It should be noted that globally, ammonium sulfate does not consistently produce higher N
2O than urea, and the reverse pattern has been reported in several field studies under different irrigation and pH regimes [
38]; the elevated emissions under OPT-AS are therefore likely context-specific, reflecting the rapid post-irrigation oxygen depletion and high ambient pH characteristic of flood-irrigated alkaline soils in the Hetao District.
Irrespective of fertilizer type, the pronounced concentration of N
2O emissions in Period 2—encompassing topdressing and the first flood irrigation event—across all fertilized treatments is consistent with transient anaerobic conditions generated by flood inundation, which intensify denitrification during a narrow post-irrigation window [
39]. Mechanistic evidence confirms that transient anoxia stimulates denitrification capacity and reduces the N
2O-to-N
2 reduction ratio, producing short-lived but intense N
2O pulses that account for a disproportionate share of seasonal emissions [
40]. OPT-IAS reduced N
2O emissions by 31–32% without increasing NH
3 volatilization, contrasting with the global meta-analytic finding that nitrification inhibitors increase NH
3 emissions by an average of 35.7%, particularly in alkaline soils. This discrepancy likely reflects the dominant thermodynamic control of soil pH on the NH
4+–NH
3 equilibrium established above: at pH > 8.8, any secondary effect of DMPP on ammonium substrate availability is masked, consistent with the observation that the NH
3 penalty of nitrification inhibitor application is amplified at lower pH where substrate-level effects become relatively more important [
8]. OPT-IU similarly showed no increase in NH
3 volatilization, consistent with the mechanism of NBPT action: delayed urea hydrolysis reduces the transient peak in NH
4+ concentration at the soil surface, which, at strongly alkaline pH, is the primary determinant of volatilization flux [
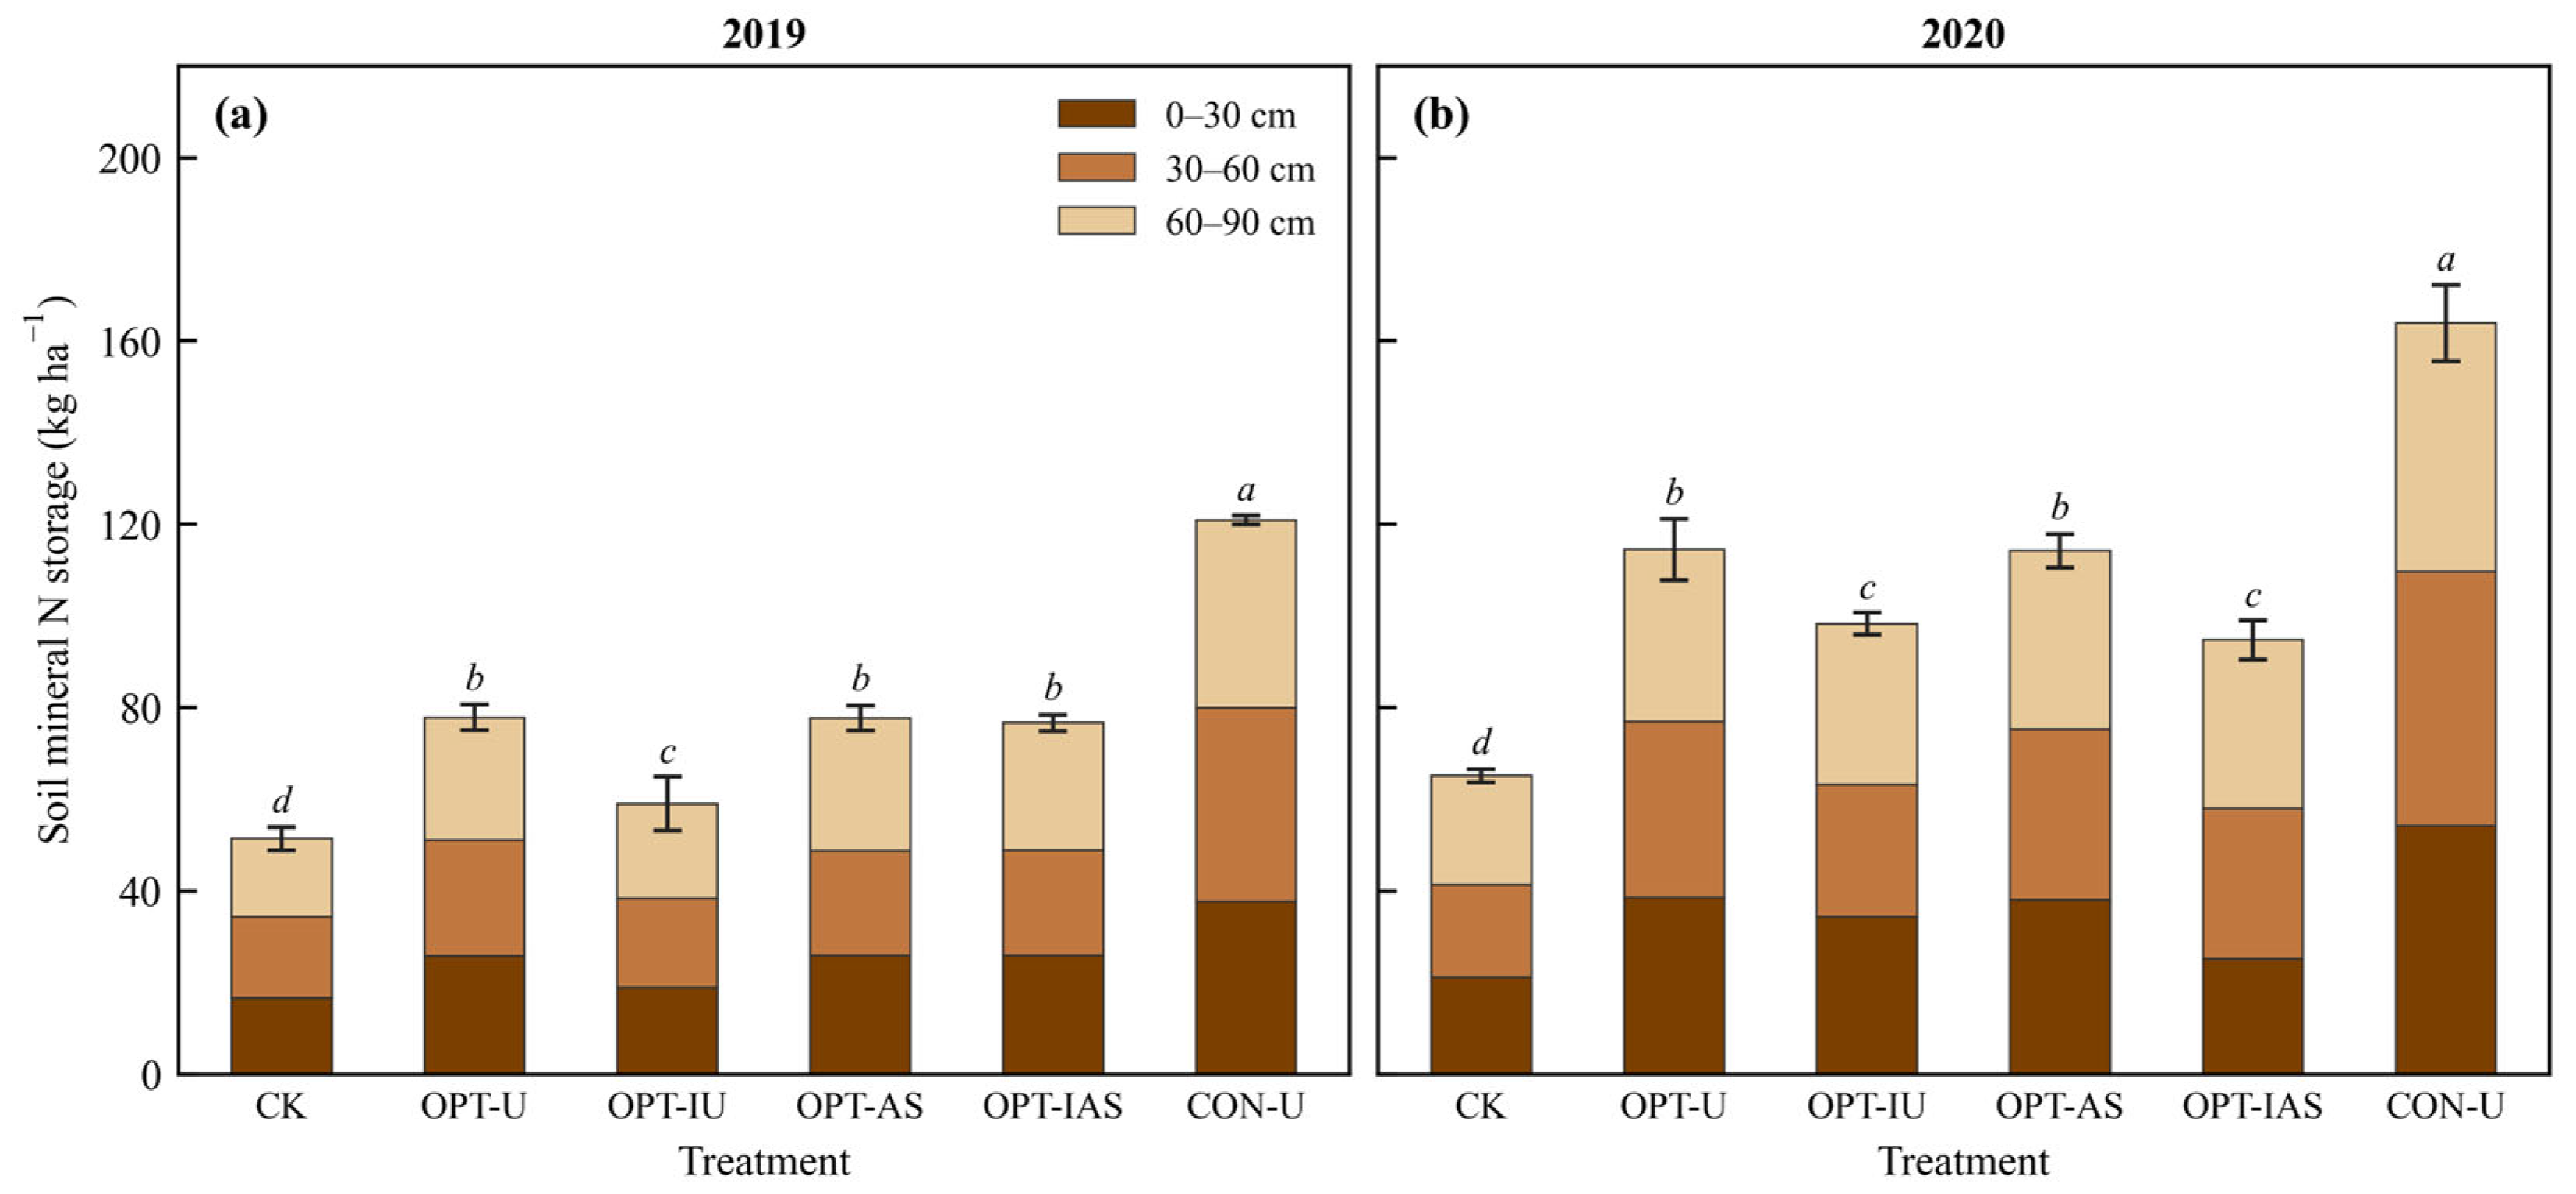
41]. The reduction in post-harvest soil mineral nitrogen under OPT-IU relative to OPT-U in both years further suggests that NBPT-mediated slowing of urea hydrolysis improved the synchrony between nitrogen supply and crop demand, reducing residual nitrogen accumulation susceptible to subsequent loss [
42].
The inverse relationship between GHGI and grain yield across treatments—most pronounced for CON-U, which achieved the lowest GHGI despite the highest absolute N
2O emissions—illustrates a well-recognized limitation of emission intensity metrics as standalone environmental indicators [
43]. This yield-dilution effect is pervasive across global maize, wheat, and rice systems: yield-scaled N
2O emissions decline mechanically as yields increase beyond system-specific thresholds, such that high-yielding treatments appear environmentally favorable even when their absolute emission loads are highest [
44,
45]. The yield-dilution effect under CON-U obscures its substantially greater absolute gaseous losses and post-harvest soil nitrogen accumulation (up to 163.9 kg N ha
−1 in 2020), which represents a legacy nitrogen pool at risk of leaching or denitrification in subsequent seasons. Comprehensive evaluation of nitrogen management strategies, therefore, requires simultaneous consideration of absolute emission loads, residual soil nitrogen, and emission intensity rather than reliance on any single metric. Among optimized-rate treatments, OPT-IU and OPT-IAS achieved the most favorable combination of outcomes—higher grain yield, lower N
2O emissions, lower GHGI, and in the case of OPT-IU, reduced residual soil nitrogen—relative to OPT-U, without increasing NH
3 volatilization. However, as the preceding analysis shows, no single modification was sufficient to address all nitrogen loss pathways simultaneously.
The present study offers several methodological strengths: the simultaneous quantification of NH
3 volatilization, N
2O emissions, and post-harvest soil mineral nitrogen storage within a single replicated field experiment enables direct evaluation of trade-offs among competing nitrogen loss pathways, rather than inference from separate studies conducted under different conditions; the embedded soil pH manipulation sub-experiment provides within-site, within-season evidence of pH control on NH
3 volatilization efficiency, free from the confounding by soil type, climate, and management history inherent in cross-site comparisons; and the two-year design, with consistent treatment rankings across contrasting climatic seasons, establishes temporal robustness beyond what single-year studies can support. Several limitations should nonetheless be acknowledged. The experimental design was not fully factorial with respect to fertilizer type and inhibitor type—NBPT was applied exclusively with urea (OPT-IU) and DMPP exclusively with ammonium sulfate (OPT-IAS), reflecting commercially available inhibitor–fertilizer pairings in the study region—and the independent contributions of these two factors to the observed differences in N
2O emissions therefore cannot be fully disentangled; the comparisons are best interpreted as evaluations of fertilizer formulation effects under conditions representative of regional agricultural practice. The study was additionally conducted at a single experimental site within the Hetao Irrigation District; while the site conditions—alkaline soil pH, high nitrogen inputs, and seasonal flood irrigation—are broadly representative of the district, direct extrapolation of quantitative emission magnitudes to systems differing in soil texture, organic matter content, or irrigation regime should be made with caution. The two-year observation period, while sufficient to establish cross-year consistency in treatment rankings, does not capture the longer-term dynamics of residual soil nitrogen accumulation that may develop under sustained application of the evaluated management strategies. At the system level, a fundamental constraint is the pollution swapping characteristic of alkaline irrigated conditions [
46]: NH
3 volatilization remained governed by soil pH and nitrogen input irrespective of fertilizer formulation or inhibitor application, whereas N
2O reductions were achievable through inhibitor use, and trade-off analyses indicate that inhibitor-induced NH
3 increases can under some conditions offset the climate benefit of N
2O reduction [
47]. Achieving concurrent mitigation of both pathways will therefore require complementary interventions—such as deep placement or drip fertigation, which have been shown to simultaneously reduce NH
3, N
2O, and NO
3− leaching in alkaline Chinese cropping systems [
9,
48]—beyond rate optimization and inhibitor application alone.




 and
and