Article

Heat and Cold Extremes and Urban Mortality in Greece: An Event-Based Assessment Using Cumulative Thermal Stress Indices


Department of Physics, University of Ioannina, 45110 Ioannina, Greece
*
Author to whom correspondence should be addressed.
Atmosphere 2026, 17(4), 401; https://doi.org/10.3390/atmos17040401
Submission received: 28 February 2026 / Revised: 8 April 2026 / Accepted: 13 April 2026 / Published: 15 April 2026

Abstract

Extreme temperatures increasingly threaten public health, yet temperature–mortality relationships vary substantially across regions and are often obscured by average exposure–response models. This study investigates heat- and cold-related mortality in five climatically diverse Greek cities—Athens, Thessaloniki, Larissa, Patra, and Heraklion—during 1992–2024 using an event-based framework that integrates cumulative thermal stress with synoptic atmospheric conditions. Heat and cold events were defined using the Excess Heat Factor and Excess Cold Factor, combined with persistence criteria and Spatial Synoptic Classification air masses. Mortality responses were assessed through daily mortality ratios, regression analyses, and event severity categories. Dry Moderate air masses dominated across cities, accounting for more than 60% of all days in each city, indicating that extremes typically reflect departures from generally mild background conditions. Linear associations between cumulative thermal stress and mortality were weak overall, with correlation coefficients generally below |0.15| for cold events and below 0.20 for heat events. However, severe heat events produced substantial mortality increases, with mean mortality ratios reaching 1.69 in Larissa and exceeding 1.30 in all cities, despite relatively low event frequency. In contrast, cold-related mortality was often linked to frequent lower-severity events, particularly in Thessaloniki (more than 200 cold events) and Athens. These findings demonstrate that mortality risk concentrates in discrete high-impact episodes rather than increasing linearly with thermal stress, underscoring the value of event-based approaches for locally tailored adaptation and early-warning strategies.

1. Introduction

Extreme ambient temperatures, whether elevated during heat waves or depressed during cold spells, are well-established drivers of adverse health outcomes, including increased morbidity and mortality. Elevated temperatures accentuate cardiovascular and respiratory strain, disrupt thermoregulatory processes, and exacerbate underlying chronic conditions, while cold exposure can impair immune function, elevate blood pressure, and increase risk of respiratory infections [1,2]. The public health burden associated with thermal extremes is substantial and growing under a warming climate, particularly in urban areas where population density and urban heat island effects amplify thermal stress [3,4,5]. Thermal vulnerability is not uniformly distributed across the population. Previous studies have shown that elderly individuals, people with pre-existing cardiovascular and respiratory conditions, socio-economically disadvantaged groups, and occupationally exposed populations such as outdoor workers are particularly sensitive to extreme temperatures [6,7,8,9]. These forms of vulnerability are especially relevant in Mediterranean urban environments, where population ageing, urban heat-island effects, and socio-economic disparities can substantially amplify the health impacts of both heat waves and cold spells.
Across epidemiological and climatological studies, the definitions of heat waves and cold spells have evolved from simple threshold and percentile criteria to more nuanced, context-sensitive metrics. Traditional approaches often define a heat wave as a sequence of days above a fixed temperature threshold (for example, values derived from percentile-based or absolute criteria) and a cold spell as a sequence below a corresponding low-temperature threshold, typically combined with a minimum duration requirement [10,11,12,13,14,15]. However, the use of fixed absolute thresholds may be inappropriate in regions such as the Mediterranean, where population acclimatization and climatic variability strongly influence thermal risk. These criteria capture persistent extreme conditions linked to mortality spikes, especially when combined with duration and seasonal timing. More sophisticated methods use statistical models such as distributed lag non-linear models (DLNM) to capture delayed and non-linear associations between temperature and health outcomes, revealing complex J- or U-shaped exposure–response relationships and lag structures that differ for heat and cold [16,17,18]. However, while DLNMs and percentile-based threshold definitions have substantially improved the quantification of temperature–mortality relationships, they are primarily designed to describe continuous exposure–response associations and to estimate attributable mortality over long time series. As a result, they may not fully capture the discrete structure of high-impact thermal episodes, during which mortality increases abruptly over a limited number of days and is strongly influenced by short-term acclimatization and synoptic atmospheric conditions. Event-based approaches offer a complementary perspective by focusing on the identification, characterization, and comparison of individual heat and cold episodes rather than average responses across entire temperature distributions. Despite their potential relevance for early-warning systems and urban adaptation planning, integrated multi-city studies that combine cumulative thermal stress indices, synoptic air-mass classification, and event-level mortality analysis remain relatively limited, particularly in Mediterranean climates.
To address the limitations of simple temperature thresholds, a wide range of thermal stress indices have been developed to better approximate human physiological response to atmospheric conditions. These indices move beyond single-variable metrics by integrating multiple meteorological parameters, such as humidity, wind speed, and radiation, and in some cases incorporate simplified representations of human heat balance. Among the most widely applied biometeorological indices is the Universal Thermal Climate Index (UTCI), which is grounded in a multi-node human thermoregulation model and expresses thermal stress as an equivalent temperature under reference conditions [19]. UTCI has been extensively used in Europe and globally for heat-health warning systems, climate change projections, and comparative thermal stress assessments due to its physiological basis and comparability across climates. Similarly, the Physiologically Equivalent Temperature (PET), derived from the Munich Energy Balance Model for Individuals (MEMI), translates complex meteorological conditions into an equivalent air temperature experienced in a standardized indoor setting [20,21]. Other commonly employed indices include apparent temperature (AT), which combines air temperature, humidity, and wind speed to approximate perceived heat stress, and wind chill indices for cold exposure, which quantify enhanced convective heat loss under windy conditions [22,23]. For cold environments, indices such as the Wind Chill Temperature (WCT) and the Standard Effective Temperature (SET) have been used to estimate frostbite risk and whole-body heat loss [24]. More comprehensive indices, including UTCI, are capable of representing both heat and cold stress within a unified thermophysiological framework, making them particularly valuable for climate–health assessments spanning multiple seasons.
While physiologically based indices such as UTCI and PET provide detailed representations of instantaneous thermal stress, they are not explicitly designed to capture cumulative exposure or short-term acclimatization effects that are critical in determining health outcomes during extreme events. Epidemiological evidence suggests that mortality risk during heat waves depends not only on absolute temperature levels but also on recent thermal history and population adaptation. In this context, the Excess Heat Factor (EHF) was developed to quantify heat stress relative to both long-term climatology and short-term acclimatization windows, thereby identifying anomalous and potentially hazardous heat events [25]. Analogously, the Excess Cold Factor (ECF) captures cumulative cold anomalies relative to recent temperature conditions, acknowledging that cold-related mortality often exhibits longer lag structures and that adaptation processes modulate vulnerability [26]. These indices therefore bridge the gap between purely meteorological measures and event-based epidemiological relevance.
In addition to thermal indices, air-mass classification systems, such as the Spatial Synoptic Classification (SSC), provide a synoptic context for thermal stress by categorizing daily atmospheric conditions into discrete air-mass types based on multiple meteorological variables [27]. SSC has been effectively used to link broad scale circulation patterns with localized extreme temperatures and health outcomes [28,29]. For example, certain synoptic types characterized by stagnant, hot, and dry conditions are associated with elevated heat-related mortality, while cold, dry air masses correspond to increased winter mortality [30,31]. The integration of SSC with cumulative indices like EHF and ECF offers a robust, physiologically and climatologically grounded framework for the identification and characterization of thermal events.
Despite advances in both index-based and synoptic approaches, multi-city analyses that integrate cumulative thermal stress, synoptic classification, and event-level mortality outcomes are still relatively rare, especially in the Mediterranean region. Much of the extant literature focuses on single cities or employs temperature-only metrics [32,33]. Comparative studies across multiple urban environments are essential to disentangle the roles of climatic regime, population acclimatization, and urban morphology in shaping thermal vulnerability [34,35]. Furthermore, while heat-related impacts have received substantial attention, cold-related mortality in warmer climates is less well understood despite evidence that cold effects may persist and contribute significantly to total temperature-related mortality [36].
In the present study, an integrated, event-based framework is applied to five Greek cities (Athens, Thessaloniki, Larissa, Patra, and Heraklion), encompassing diverse climatic and geographic settings across the Mediterranean region. Daily mortality and meteorological data spanning the period 1992–2024 are used to identify heat and cold events through the combined application of cumulative thermal stress indices (EHF and ECF) and synoptic air-mass characterization derived from the Spatial Synoptic Classification (SSC). Associations are further examined using multiple exposure metrics, including mean air temperature, apparent temperature (incorporating humidity and wind effects), and wind chill for cold events. This approach enables consistent identification of events that are anomalous relative to local acclimatization and prevailing atmospheric conditions, while simultaneously accounting for synoptic-scale influences. By combining cumulative indices, synoptic classification, and physiologically informed exposure metrics, this study provides a multi-city perspective on thermal health risks. While these indices capture short-term acclimatization, they remain indirect measures of physiological stress and do not account for behavioral or socio-economic modifiers. Mortality data are all-cause, and potential confounders such as air pollution or influenza are not explicitly modeled. Despite these limitations, this integrated framework enables robust evaluation of thermal extremes across Mediterranean urban contexts.

2. Materials and Methods

2.1. Study Area

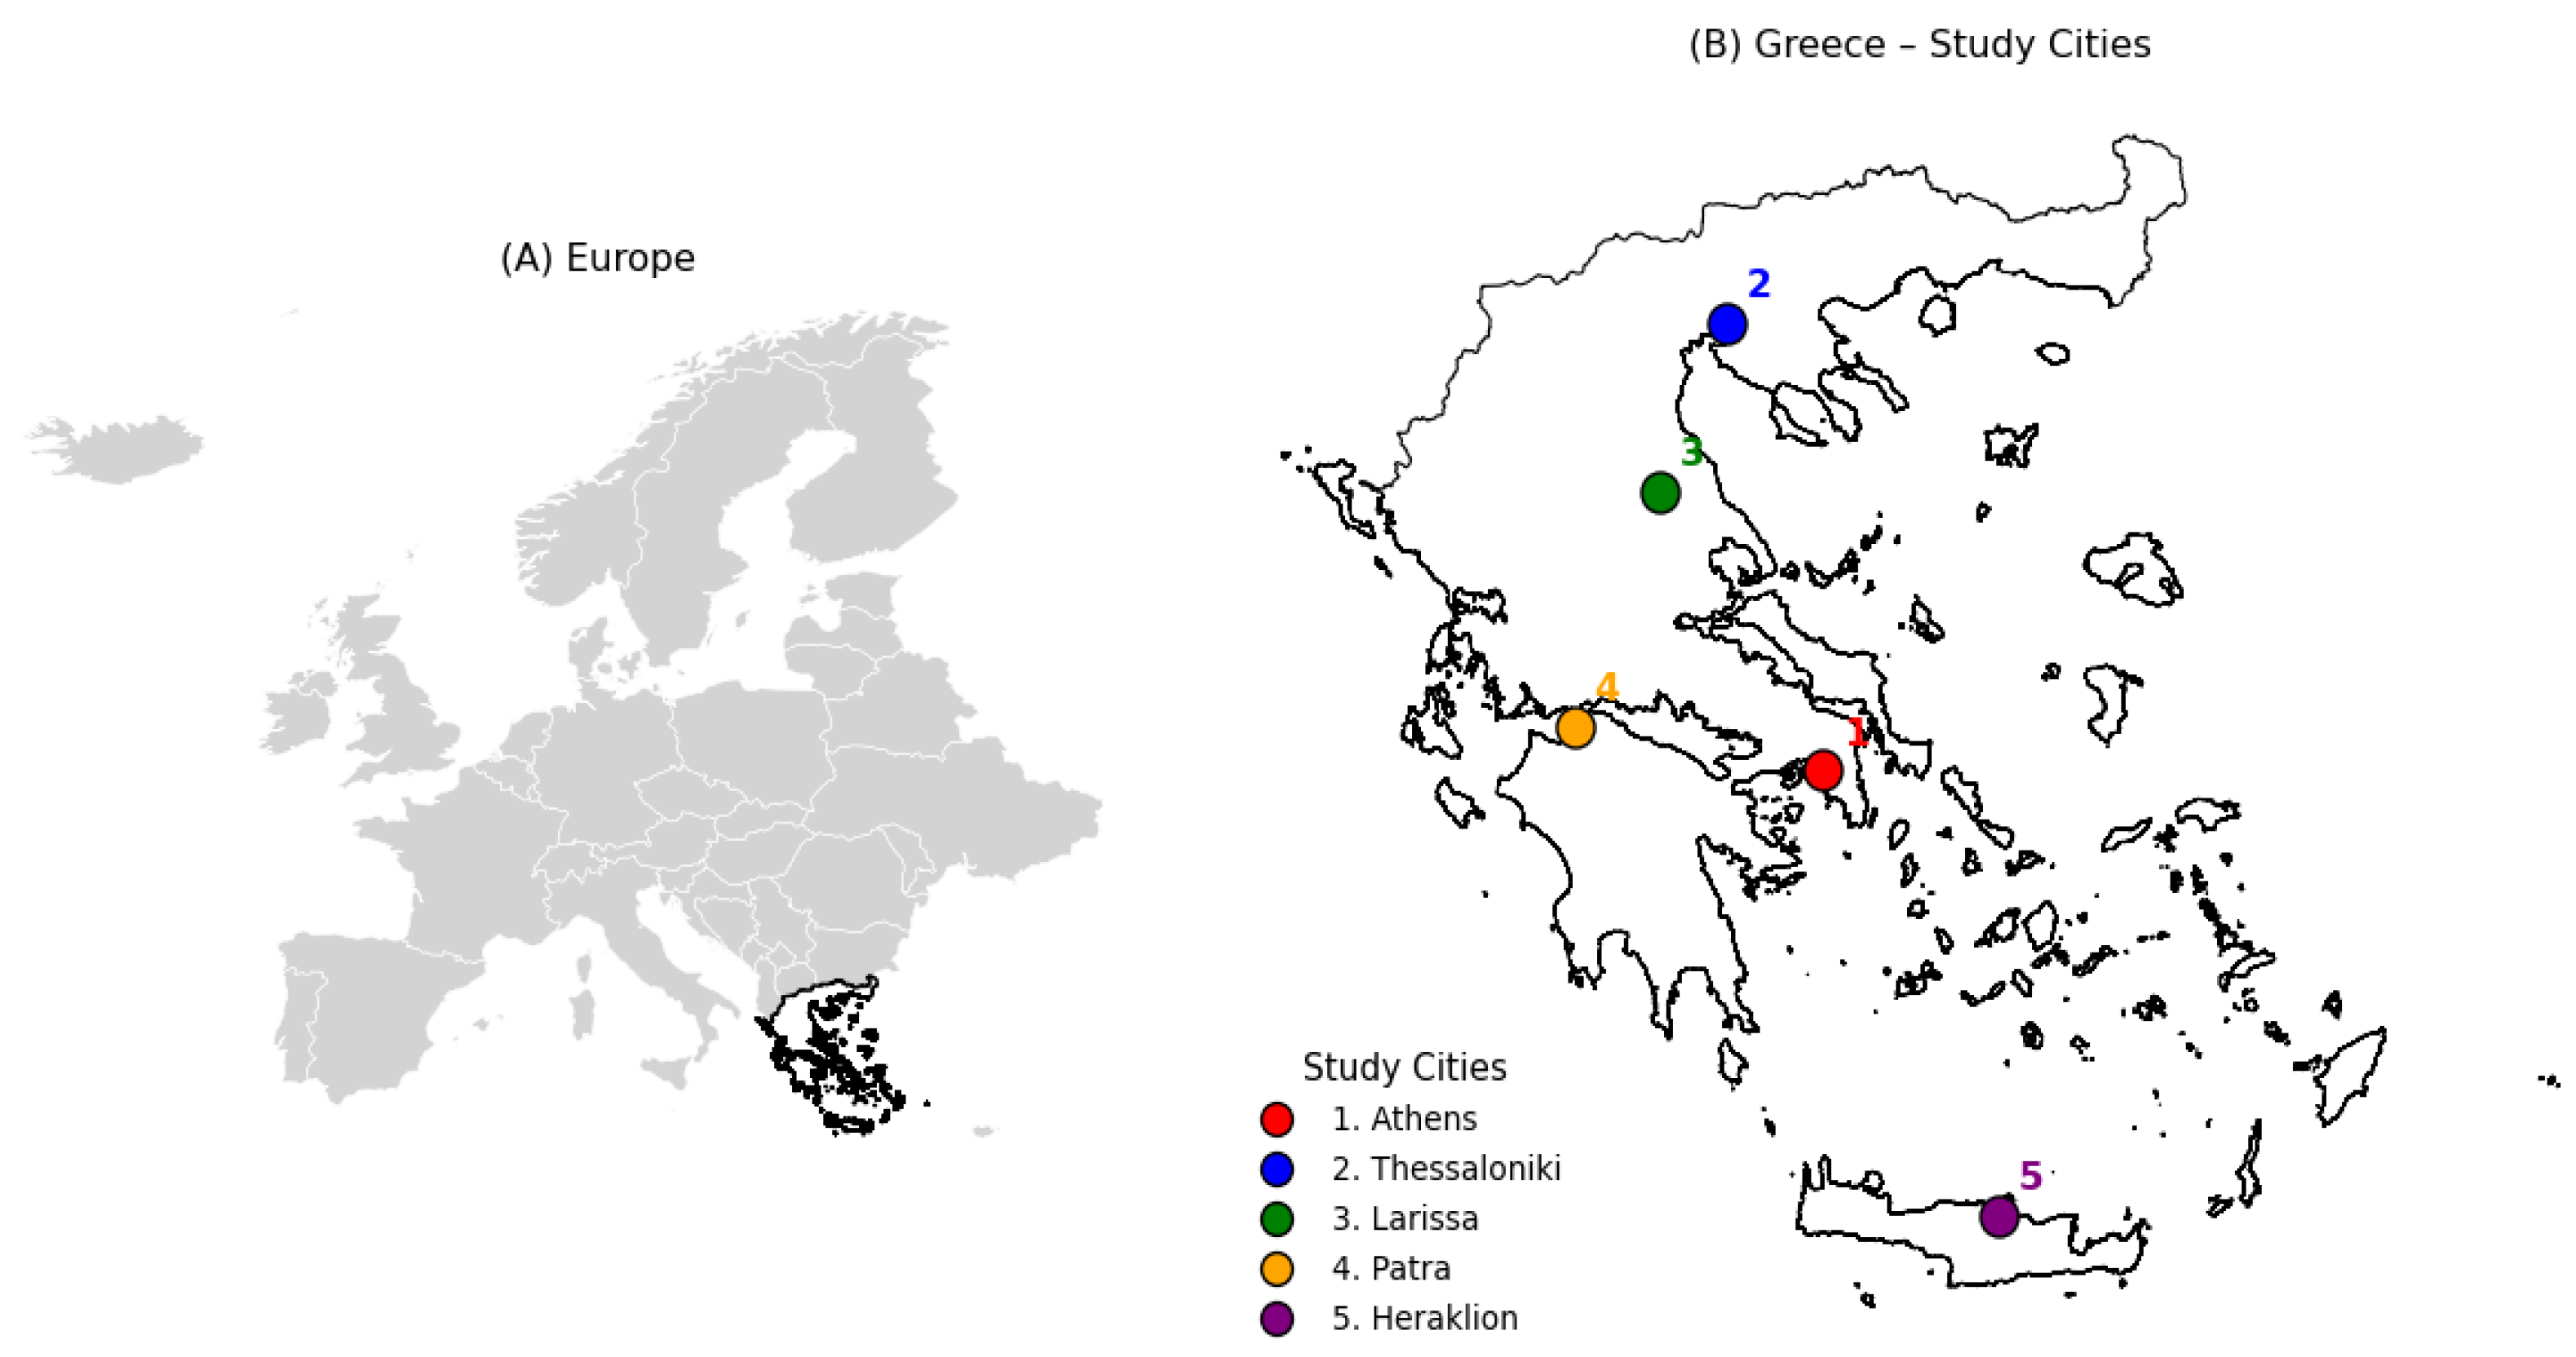
This study focuses on five major Greek cities—Athens, Thessaloniki, Patra, Larissa, and Heraklion—selected to represent a range of climatic, geographic, and urban characteristics across Greece. Athens and Thessaloniki are the two largest metropolitan areas, characterized by dense urbanization and strong urban heat island effects. Patra is a coastal city in western Greece influenced by maritime conditions, while Larissa represents an inland continental setting in central Greece with pronounced seasonal temperature variability. Heraklion, located on the island of Crete, exhibits a distinctly Mediterranean maritime climate with relatively mild winters and fewer cold extremes (Figure 1). Together, these cities provide a robust spatial sample for examining thermal extremes across mainland and insular Greece, spanning coastal, inland, northern, southern, and island environments. The study period extends from 1992 to 2024, a timeframe that captures both recent climatic warming and several historically significant heat and cold events.

2.2. Data

2.2.1. Meteorological Data

This study makes use of high-resolution reanalysis data and synoptic air-mass classifications to identify heat and cold events in Greece. Hourly meteorological variables were obtained from the ERA5-Land reanalysis [37], produced by the European Centre for Medium-Range Weather Forecasts (ECMWF) and distributed through the Copernicus Climate Data Store, which is available to download from https://cds.climate.copernicus.eu/datasets/reanalysis-era5-land?tab=overview (accessed on 10 December 2025). ERA5-Land provides hourly fields at approximately 9 km spatial resolution from 1950 to the present. For each city, a single grid cell corresponding to the urban core was extracted from the ERA5-Land “hourly time-series” service. The variables used include: 2 m air temperature (t2m), 2 m dew point temperature (d2m), 10 m zonal and meridional wind components (u10, v10). Hourly wind speed was calculated as the magnitude of the horizontal wind vector. Daily maxima and minima were derived from the hourly data to compute thermal stress indices. All meteorological data were processed consistently across cities to ensure comparability.
Moreover, all meteorological variables are expressed in standard physical units. Air temperature and dew point temperature are expressed in degrees Celsius (°C), wind speed in meters per second (m s−1), and vapor pressure in hectopascals (hPa). Derived indices, including apparent temperature (AT) and wind chill index (WCI), are also expressed in °C. The Excess Heat Factor (EHF) and Excess Cold Factor (ECF) are expressed in °C2 because they combine temperature anomalies with acclimatization terms.

2.2.2. Synoptic Air-Mass Classification

Synoptic air-mass types were obtained from the Spatial Synoptic Classification (SSC), a long-standing system that classifies each day into one of several thermodynamically meaningful categories [27,38], available on https://sheridan.geog.kent.edu/ssc3.html (accessed on 2 December 2025). These categories include, among others, Dry Tropical (DT), Moist Tropical Plus (MT+), Dry Polar (DP), and Moist Polar (MP). In this study, the SSC data were provided as daily categorical values. For heat-related analyses, the air masses interpreted as thermally oppressive include DT, DT+, and MT+, whereas cold-related analyses rely on the cold-advection air masses DP, DP+, MP, and MP+. The “+” designation denotes an intensified variant of the parent air mass, defined as conditions exceeding one standard deviation from the mean thermal characteristics of that air-mass type (warmer for tropical types and colder for polar types). These categories therefore represent more thermally extreme environments and have been widely used in heat–health applications to identify conditions associated with elevated physiological stress. The SSC has been widely applied in climate–health studies, including in Europe, North America, and Asia, owing to its capacity to capture the holistic thermodynamic environment experienced by human populations.
In this study, the SSC is not used as an independent predictor in the regression models but as a synoptic-scale classification framework that provides physical context for thermally extreme days. While temperature-based exposure metrics quantify the magnitude of thermal stress, the SSC allows events to be interpreted in terms of large-scale atmospheric circulation patterns (e.g., persistent hot and dry air masses or cold-advection episodes). This combined approach helps distinguish isolated temperature anomalies from coherent synoptic events that are more likely to produce substantial health impacts.

2.2.3. Mortality Data

Daily all-cause mortality data were obtained from the Hellenic Statistical Authority (ELSTAT) for each of the five study cities (Athens, Thessaloniki, Patra, Larissa, and Heraklion). The mortality records span the period 1992–2024, providing more than three decades of continuous observations suitable for climate–health analysis. Mortality counts correspond to the date of death and include all causes, thereby capturing the total population-level health burden associated with extreme thermal exposure without imposing assumptions about cause-specific attribution. All-cause mortality is widely used in heat- and cold-health studies because it avoids misclassification biases and better reflects the aggregate physiological stress imposed by extreme environmental conditions. To enable comparison across cities with different population sizes and long-term demographic trends, daily mortality counts were converted into a relative mortality ratio. A city-specific baseline mortality was estimated using a 365-day rolling median centered on each day, requiring a minimum of 180 valid observations. This approach removes long-term population growth, ageing effects, and seasonal variability while preserving short-term mortality fluctuations associated with extreme weather events. The mortality ratio was then calculated as the ratio of observed daily deaths to the baseline mortality for the same day, and can therefore be interpreted as the relative deviation (%) from expected mortality under typical conditions. Similar normalization approaches based on smoothed baseline mortality or relative mortality measures have been widely applied in temperature–mortality studies to enable comparisons across populations and long time periods [39,40].

2.3. Methods

2.3.1. Apparent Temperature and Wind Chill

For each city, heat stress was quantified using daily maximum apparent temperature ( A T ), which integrates air temperature, humidity, and wind speed following the Steadman formulation [22]. Hourly values of air temperature ( T ) and dew point ( T d ) were obtained from ERA5-Land reanalysis, and wind speed ( V ) was calculated as the magnitude of the horizontal wind components. Apparent temperature at each hourly step was computed as:
A T = T + 0.33 × e 0.70 V 4.0
where e is the vapor pressure in hPa [41], calculated from the dew point temperature as:
e = 6.105     e 17.27     T d 237.7 + T d
Daily maximum apparent temperature was then obtained by selecting the largest hourly value for each day.
Cold stress was characterized using the Wind Chill Index ( W C I ), computed from daily hourly air temperature and wind speed converted to km/h:
W C I = 13.12 + 0.6215     T 11.37     V 0.16 + 0.3965     T     V 0.16
where T is in °C and V in km/h. Daily minimum W C I was selected to capture the most extreme cold exposure each day [42].

2.3.2. Excess Heat Factor (EHF) and Excess Cold Factor (ECF)

Heat events were identified through the Excess Heat Factor (EHF) framework, originally introduced by Nairn and Fawcett [25]. EHF combines a short-term temperature anomaly with a longer-term acclimatization component and has been widely adopted in operational early warning systems.
For each day i, the three-day mean maximum apparent temperature is:
A T 3 i = A T i + A T i 1 + A T i 2 3
and the 30-day acclimatization baseline is:
A T 30 i = 1 30 j = i 30 i 1 A T j
The excess heat component is defined as:
E H i = A T 3 i A T 95
where A T 95 is the 95th percentile of the full-period distribution of daily maximum apparent temperatures. The acclimatization factor is:
A i = A T 3 i A T 30 ( i )
The Excess Heat Factor is then:
E H F i = E H i     m a x ( 1 , A ( i ) )
with E H F ( i ) > 0 indicating days of meaningful heat stress.
To construct an analogous metric for cold events, this study defines an Excess Cold Factor (ECF) using daily minimum wind chill instead of apparent temperature. The approach mirrors the structure of EHF but is adapted to represent strong cold anomalies.
First, the three-day mean minimum wind chill is:
W C I 3 i = W C I i + W C I i 1 + W C I i 2 3
The 30-day cold-acclimatization baseline is:
W C I 30 i = 1 30 j = i 30 i 1 W C I j
The short-term cold anomaly is expressed as:
X C i = W C I 30 i W C I 3 ( i )
so that larger positive values correspond to more intense, anomalous cold. The acclimatization term is defined as:
A c o l d i = W C I 30 i W C I 3 ( i )
and the Excess Cold Factor becomes:
E C F i = X C i     m a x ( 1 , A c o l d ( i ) )
with E C F ( i ) > 0 signifying unusually cold conditions relative to climatology.

2.3.3. Event Definition

Heat and cold events were identified using a combined thermodynamic and synoptic framework. The primary criterion for event detection is cumulative thermal stress, quantified using the Excess Heat Factor (EHF) for heat events and the Excess Cold Factor (ECF) for cold events. The Spatial Synoptic Classification (SSC) was then used as a consistency filter to ensure that identified events correspond to physically coherent atmospheric circulation patterns rather than isolated temperature anomalies.
A heat event was defined when the following three conditions were satisfied simultaneously: (1) the Excess Heat Factor (EHF) exceeded the 80th percentile of all positive EHF values for the corresponding city, (2) the day was classified as a thermally oppressive warm-season synoptic type according to the SSC (Dry Tropical—DT, Dry Tropical Plus—DT+, or Moist Tropical Plus—MT+), and (3) these conditions persisted for at least three consecutive days. All days fulfilling these criteria were classified as heat-wave days. Cold events were defined using an analogous procedure. A day was considered part of a cold event when (1) the Excess Cold Factor (ECF) exceeded the 80th percentile of all positive ECF values, (2) the corresponding synoptic air mass belonged to one of the cold-advection SSC types (Dry Polar—DP, Dry Polar Plus—DP+, Moist Polar—MP, or Moist Polar Plus—MP+), and (3) the conditions persisted for a minimum of three consecutive days.
This combined approach ensures that the identified events represent not only statistically extreme thermal conditions but also physically consistent synoptic situations known to produce hazardous heat and cold episodes in the Mediterranean region.

2.3.4. Mortality Processing, Exposure Aggregation and Statistical Analysis

Daily all-cause mortality data were obtained for each city and processed to account for long-term temporal variability and seasonality. Each day was assigned to either the heat season (May–September) or the cold season (November–March), restricting heat- and cold-related analyses to climatologically relevant periods. To normalize mortality and remove long-term trends, a daily mortality baseline was estimated using a 365-day rolling median centered on each day, requiring a minimum of 180 valid observations. Relative daily mortality was then expressed as the ratio of observed deaths to the baseline:
M R i = D ( i ) D b a s e ( i )
where M R i is the mortality ratio on day i (dimensionless), D ( i ) is the observed number of deaths on that day, and D b a s e ( i ) is the corresponding baseline mortality. Values greater than 1 indicate excess mortality relative to expected conditions, while values below 1 indicate lower-than-expected mortality. This relative metric served as the outcome variable in all subsequent analyses.
To account for delayed health effects, lagged cumulative exposure indices were calculated. The cumulative indices therefore represent a temporally smoothed exposure metric rather than single-day thermal stress, allowing each event day to reflect the combined physiological effect of sustained heat or cold conditions. For heat events, cumulative exposure was defined as the sum of the Excess Heat Factor (EHF) for the current day and the preceding seven days, reflecting the well-documented short-lag structure of heat-related mortality, which typically peaks within a few days after exposure [43,44]. For cold events, cumulative exposure was calculated over the current day and the preceding fourteen days, consistent with epidemiological evidence showing that cold-related mortality often exhibits longer and more gradual lag responses [45]. These lag structures therefore allow the exposure metrics to reflect the temporal dynamics of heat- and cold-related health impacts more realistically than single-day temperature values. However, because the cumulative indices integrate exposure over different time windows, the resulting heat- and cold-exposure metrics are not directly comparable in magnitude. The longer accumulation period used for cold events produces smoother exposure values and may reduce apparent day-to-day variability in the mortality ratios, which is taken into account when interpreting the regression results. Thermal events were identified as consecutive days exceeding heat or cold thresholds and grouped into discrete events. Although events are defined based on consecutive days exceeding thresholds, the cumulative exposure indices extend beyond the nominal event duration. As a result, mortality on a given event day may also reflect thermal conditions during the days preceding the event. For each event, start and end dates, duration, mean and maximum EHF/ECF, and mean and maximum mortality ratios were computed, providing integrated descriptors of both physical intensity and health impact.
Exposure–response relationships were quantified using the cumulative thermal indices and event-level mortality. Scatterplots of cumulative EHF/ECF versus relative mortality revealed the functional form of the association, and ordinary least squares (OLS) regression models were fitted. Both linear and quadratic terms were included to capture potential nonlinearity:
M R i = β 0 + β 1 Χ ι + β 2 Χ ι 2 + ϵ ι
where M R i is the mortality ratio for event day i and Χ i is the cumulative EHF or ECF. Regression diagnostics, including R2, F-statistic, and 95% confidence intervals for coefficients, were reported. Predictions were made across a grid of exposure values to construct relative risk curves with 95% confidence intervals using the OLS covariance matrix:
C I 95 % = M R ^ ± 1.96     S E ( M R ^ )
Spearman rank correlation coefficients were calculated between severity class and mean mortality ratio to assess monotonic associations between intensity category and health impact. OLS regression was used because the response variable in this study is not the daily mortality count but a normalized mortality ratio representing relative deviations from expected mortality. The objective of the regression analysis is therefore to examine the functional relationship between cumulative thermal stress and relative mortality during identified events rather than to estimate attributable mortality using a full epidemiological framework. While Poisson and quasi-Poisson models with distributed lag structures are commonly applied in temperature–mortality studies based on daily counts, the event-based and normalized approach adopted here is better suited to exploratory analysis of exposure–response patterns across cities. Nevertheless, the limitations of OLS in the presence of autocorrelation and non-Gaussian residuals are acknowledged and considered when interpreting the results.

2.3.5. Event Severity Categorization

Heat and cold events were stratified into severity categories to facilitate epidemiological comparisons. For each city, the maximum EHF (for heat) or maximum ECF (for cold) per event was used to define thresholds at the 80th, 90th, 95th, and 99th percentiles. Events were then assigned to the following classes:
For heat, Below H1, H1, H2, H3, H4, where H1–H4 correspond to increasing intensity levels defined by the percentile thresholds. For cold, Below C1, C1, C2, C3, C4 were similarly defined. Formally, for a given event with maximum thermal factor X m a x :
C l a s s = H 4 , C 4 ,     X m a x p 99 H 3 , C 3 ,     X m a x p 95 H 2 , C 2 ,     X m a x p 90 H 1 , C 1 ,     X m a x p 80 B e l o w   H 1 , B e l o w C 1 ,     X m a x < p 80
where p 80 , p 90 , p 95 , and p 99 are the city-specific percentile values of maximum EHF or ECF across all events. Event-level mortality statistics were aggregated by class to obtain the mean and maximum mortality ratio per severity level. The event-based framework was evaluated through multiple consistency checks: (1) seasonal consistency, as events occurred predominantly during the climatologically relevant warm or cold seasons; (2) synoptic consistency, where identified events corresponded to the expected SSC air-mass types (e.g., DT, MT+ for heat, DP, MP for cold); and (3) health-impact consistency, as event severity classes (H1–H4, C1–C4) showed monotonic increases in mean mortality ratio with increasing intensity. These checks confirm that the framework identifies physically coherent and epidemiologically meaningful thermal events.

2.3.6. Comparison of Thermal Exposure Metrics

To evaluate the relationship between thermal stress and mortality, we compared multiple meteorological metrics for both heat and cold events. For heat events, the cumulative Excess Heat Factor (EHF) over the current day plus the previous seven days was calculated to account for lagged physiological responses, while the daily mean (Tmean) and apparent temperature (AT) were used as complementary metrics. For cold events, the cumulative Excess Cold Factor (ECF) over the current day plus the previous fourteen days was computed, and the daily mean and wind chill (WCI) were used as metrics, with wind chill reflecting the combined effect of low temperature and wind on human thermal perception. Event-level statistics, including mean, maximum, and cumulative exposure values, were calculated for each metric and correlated with the relative daily mortality. Ordinary least squares (OLS) regression models were fitted for each event type to quantify the exposure–response relationship, including multiple predictors to capture potential nonlinearity and multicollinearity. These analyses allowed us to compare the explanatory power of simple temperature metrics (Tmean, AT, WCI) against cumulative thermal indices (EHF, ECF), providing a robust assessment of heat- and cold-related health risks. All analyses were performed using Python (version 3.12.3).

3. Results

3.1. Climatic Context and Identification of Heat and Cold Events

Across all five study cities (Athens, Thessaloniki, Larissa, Patra, and Heraklion), the most frequently occurring synoptic weather type during the study period (1992–2024) was Dry Moderate (DM). The relative frequency of all synoptic air-mass types for each city is presented in Figures S1–S5 (Supplementary Materials), which provide the climatological background for the thermal stress analysis that follows. According to the Spatial Synoptic Classification framework, DM air masses are characterized by mild temperatures, low humidity, and generally pleasant conditions, and are commonly associated with zonal midlatitude flow, particularly in the lee of mountain ranges [27]. In southern Europe, DM conditions often represent the baseline atmospheric state, against which both anomalously warm and cold conditions emerge. The dominance of DM air across all cities indicates that thermal extremes in Greece typically arise as departures from otherwise benign background conditions, rather than as persistent features of the prevailing synoptic climate. This supports the use of relative, anomaly-based indices—such as the Excess Heat Factor (EHF) and Excess Cold Factor (ECF)—for identifying heat and cold events, rather than relying on absolute thresholds alone. The dominance of DM conditions in all five cities can be visually verified in Figures S1–S5, where it consistently represents the largest proportion of classified days.
Heat and cold events were therefore identified using EHF and ECF, respectively, combined with persistence criteria to define multi-day events. This approach allows for consistent detection of anomalous thermal conditions across climatically diverse locations, including coastal (Athens, Patra, Heraklion), continental (Larissa), and transitional (Thessaloniki) environments. The resulting events form the basis for subsequent analyses of mortality response and event categorization.

3.2. Identification and Characteristics of Thermal Stress Events

Thermal stress events were identified for Athens, Thessaloniki, Larissa, Patra, and Heraklion using the combined Excess Heat Factor (EHF), Excess Cold Factor (ECF), and synoptic air-mass framework described in Section 2. This approach isolates days of anomalous thermal stress relative to recent acclimatization and prevailing atmospheric conditions, rather than relying solely on fixed temperature thresholds or calendar-based definitions.
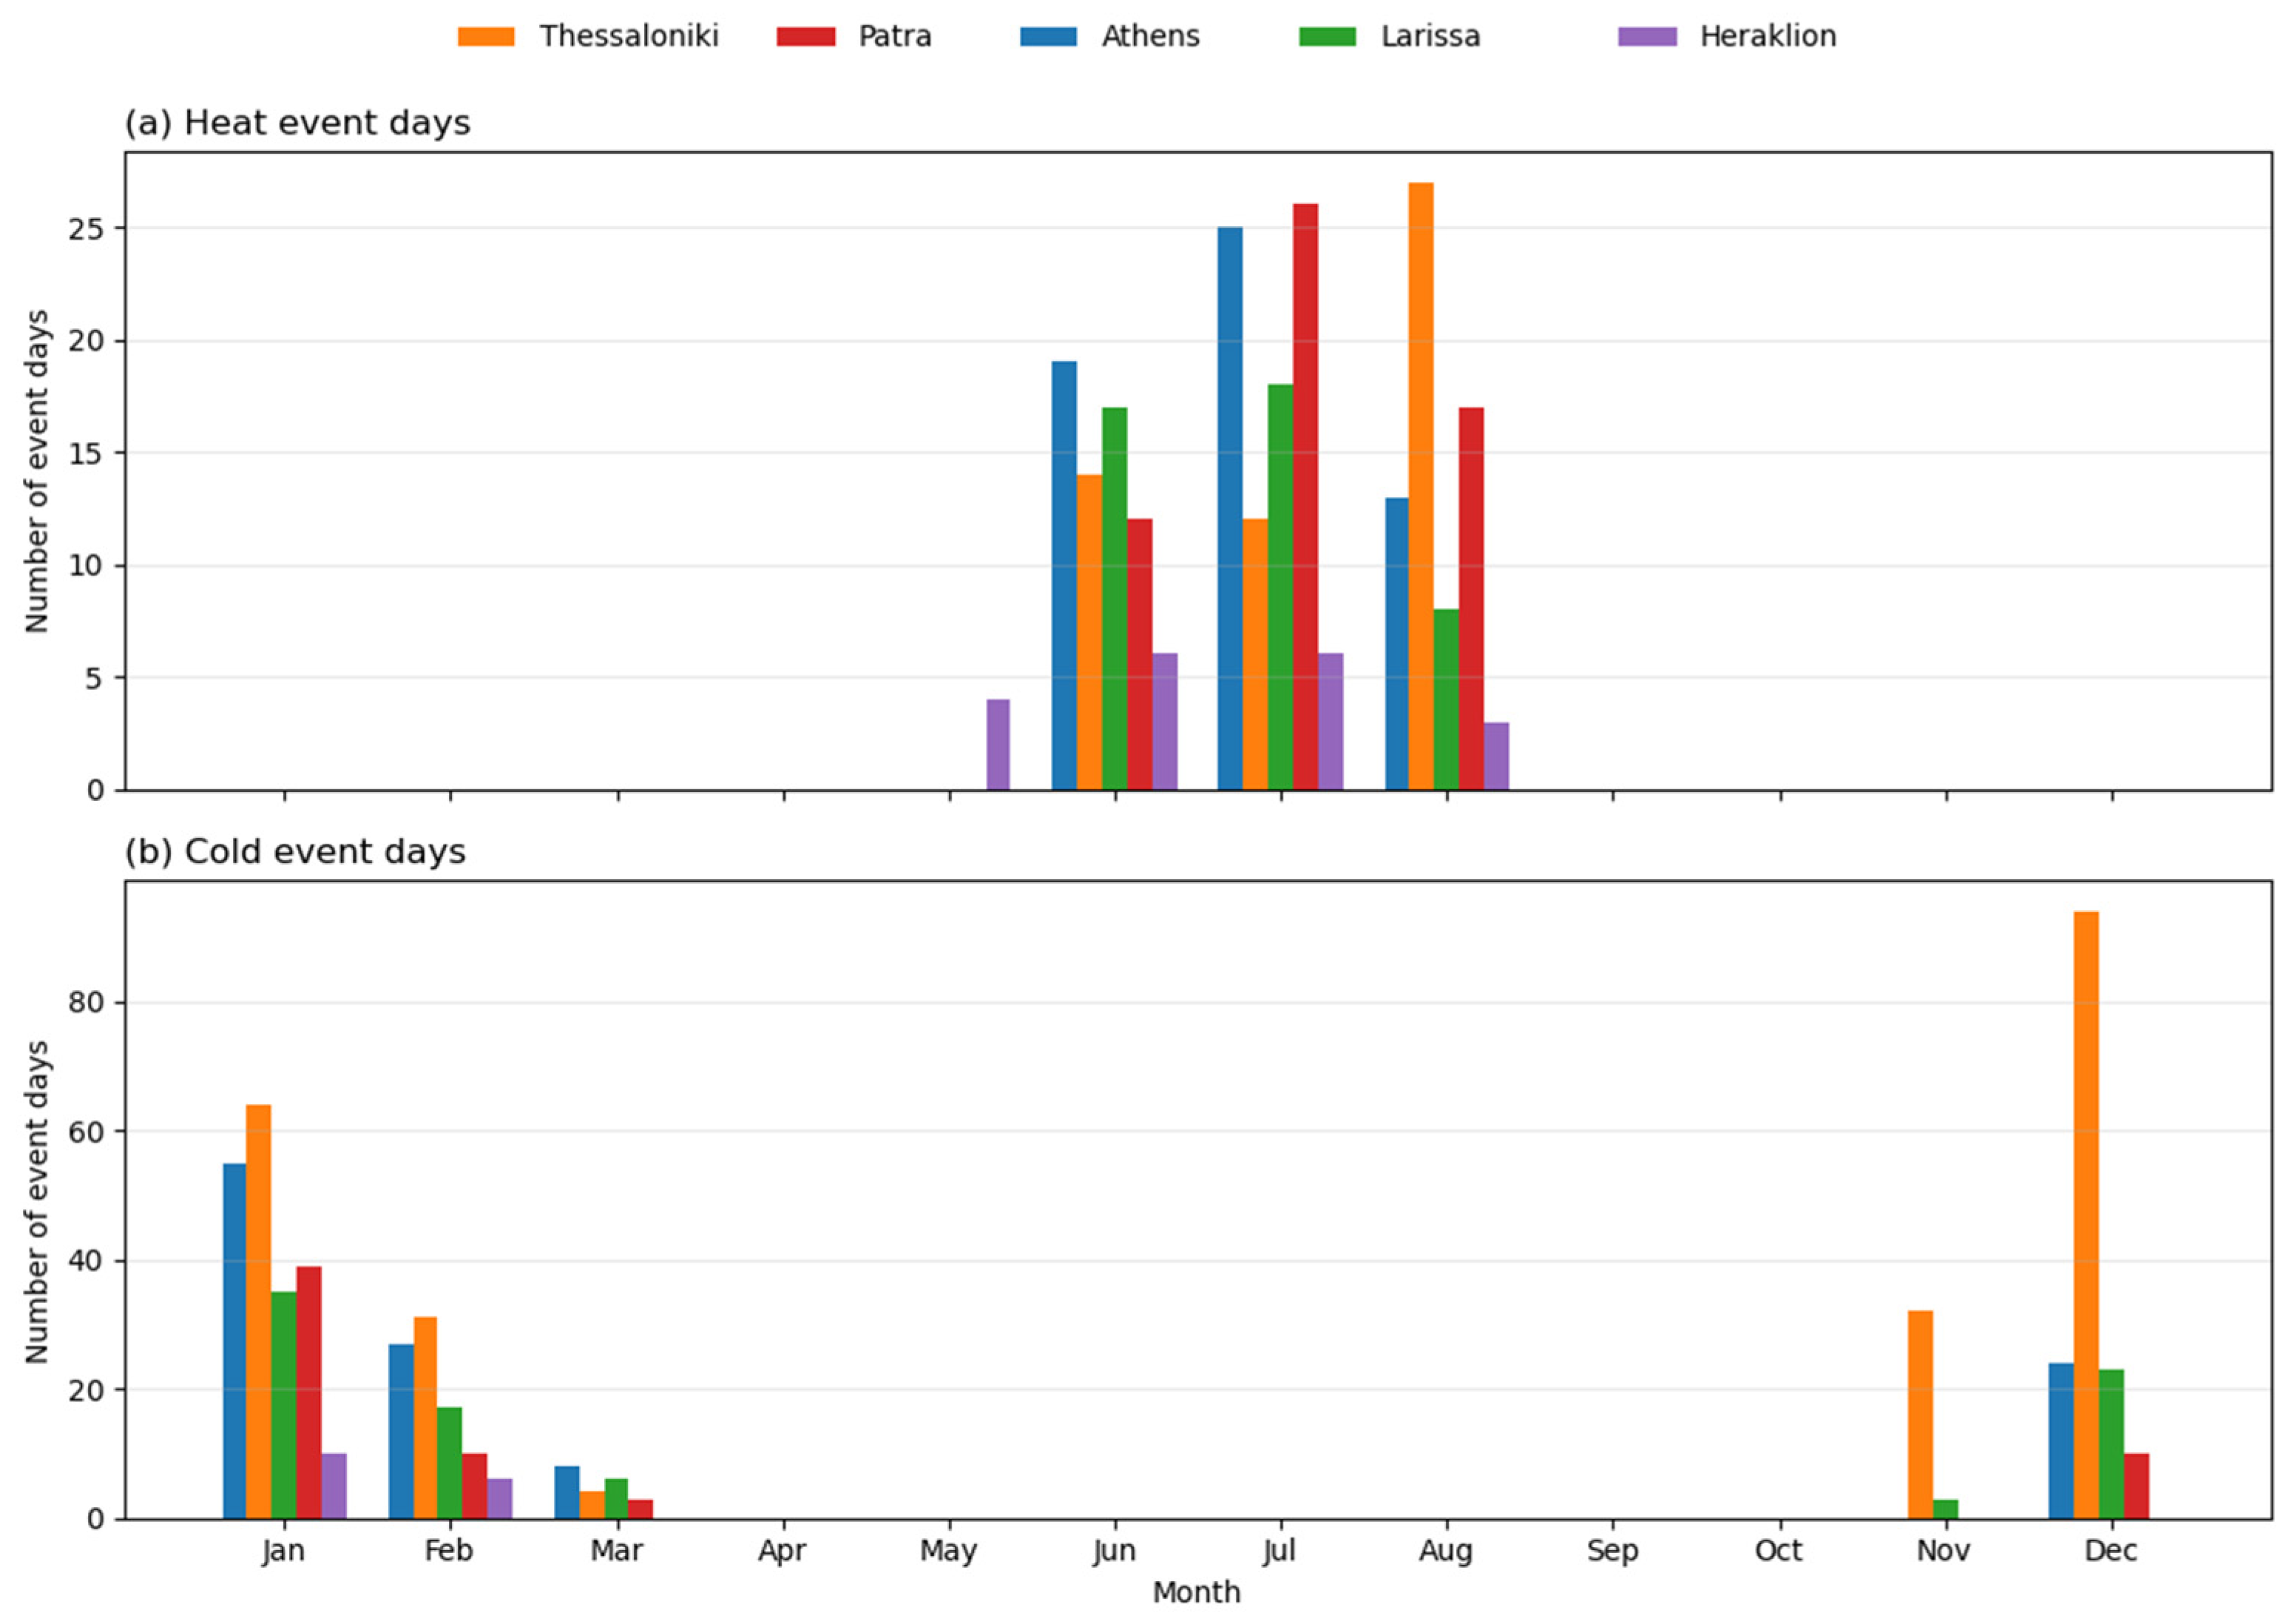
Across the study period (1992–2024), all five cities experienced recurrent heat and cold events, although their frequency varied substantially by location (Figure 2). Figure 2a illustrates the monthly distribution of heat-event days, while Figure 2b shows the corresponding distribution for cold-event days. Continental and northern cities exhibited a higher number of cold events, while southern and maritime locations showed fewer thermal extremes overall.
Athens experienced 57 heat events (1.78 events yr−1) and 114 cold events (3.56 events yr−1), reflecting its transitional position between continental and maritime climatic influences. Thessaloniki exhibited the highest frequency of cold events (209 events; 6.53 events yr−1), consistent with its northern latitude and greater exposure to cold air advection. Larissa and Patra showed intermediate behavior, while Heraklion recorded the fewest events of both types, with fewer than one heat or cold event per year on average, highlighting the strong moderating influence of the surrounding sea. Overall, cold events were more frequent than heat events in all cities except Patra, underscoring the continued relevance of cold-related thermal stress in Greece despite recent warming trends. The seasonal distribution of event days exhibits clear and physically consistent patterns across all cities. Heat-related event days are concentrated in the warm half of the year, while cold-related events occur predominantly during the cooler months. Athens, Thessaloniki, and Larissa show pronounced seasonality, with heat events clustered in summer and early autumn and cold events occurring mainly in winter and early spring. Patra displays a more extended warm-season distribution of heat events, consistent with its coastal setting and milder thermal regime. In contrast, Heraklion exhibits weak seasonality for both heat and cold events, reflecting strong maritime moderation and reduced thermal variability. These seasonal patterns confirm that the EHF–ECF framework captures climatically meaningful thermal stress, while allowing for regional differences in the timing and persistence of extreme conditions. These seasonal contrasts are clearly visible in Figure 2, where heat-event days are concentrated in summer months and cold-event days in winter across all cities.

3.3. Heat- and Cold-Related Mortality Relationships

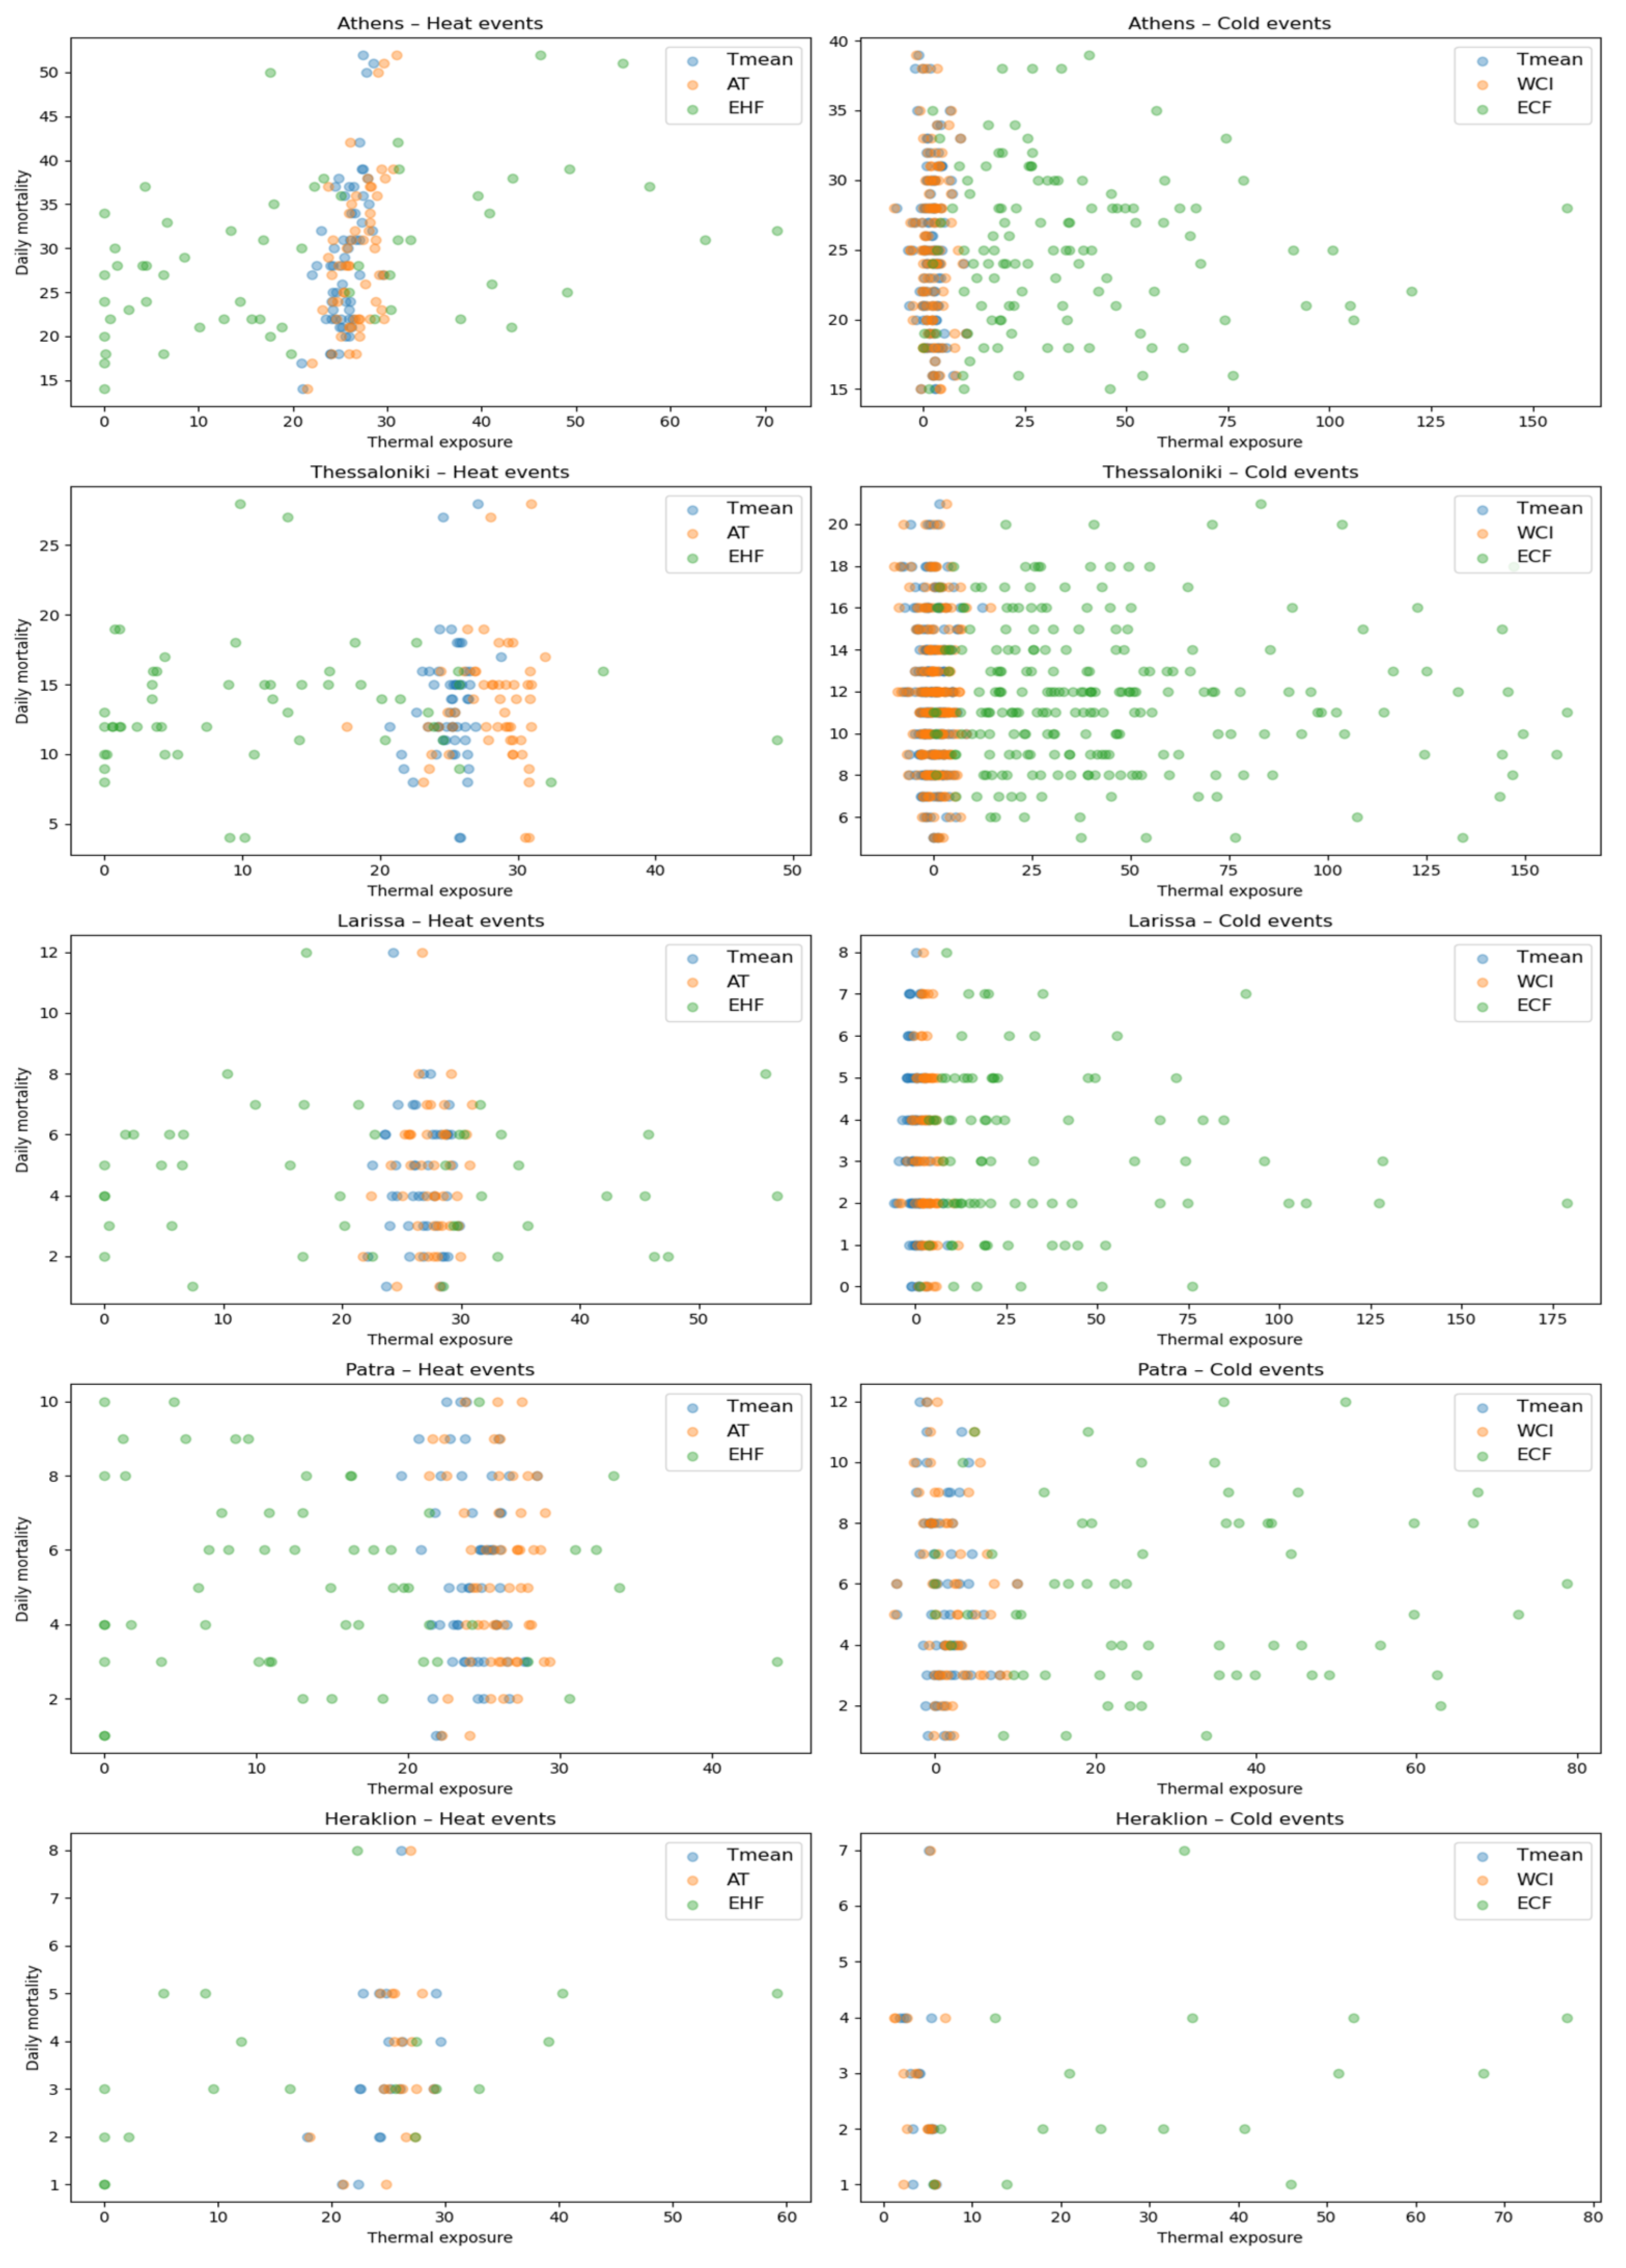
Daily mortality responses to extreme thermal conditions were examined across all five study cities using an event-based framework that combines cumulative thermal stress indices with commonly used temperature-based exposure metrics. The relationships between mortality and the different exposure metrics are summarized graphically in Figure 3. Heat exposure was represented by the 7-day cumulative Excess Heat Factor (EHF0–7), while cold exposure was represented by the 14-day cumulative Excess Cold Factor (ECF0–14). Temperature-based exposure metrics (Tmean and AT) are expressed in degrees Celsius (°C), while the wind chill index (WCI) is also expressed in °C. The cumulative thermal indices (EHF0–7 and ECF0–14) are composite indices derived from temperature anomalies and persistence in °C2. To assess the added value of alternative representations of thermal stress, these indices were evaluated alongside daily mean air temperature (Tmean), apparent temperature (AT) during heat events, and wind chill (WCI) during cold events. Mortality impacts were quantified using the mortality ratio relative to a rolling baseline, and analyses were restricted to seasonally relevant heat- and cold-wave days.
To facilitate comparison of thermal exposure conditions between the five study cities, simple descriptive statistics were calculated for the four-exposure metrics used in the analysis (Tmean, apparent temperature—AT, wind chill index—WCI, and the cumulative thermal indices EHF0–7 and ECF0–14) during heat- and cold-event days. Substantial inter-city differences are evident. Continental and northern locations (particularly Larissa and Thessaloniki) exhibit the largest variability in temperature-based exposure metrics, while the maritime city of Heraklion shows the narrowest temperature range. In contrast, cumulative heat exposure (EHF0–7) tends to be higher and more variable in Athens and Larissa, reflecting the greater persistence and intensity of heat events in these cities. These descriptive statistics confirm that the five cities differ not only geographically but also in the magnitude and variability of thermal exposure, supporting their treatment as distinct climatic and exposure environments in the subsequent analyses. The detailed statistics are summarized in Table S1.

3.3.1. Heat-Related Mortality and Comparison of Exposure Metrics

Across the study cities, heat-related mortality responses exhibited substantial spatial heterogeneity and were generally modest in magnitude. All exposure values discussed in this section are expressed either in °C (for temperature-based metrics) or in °C2 as cumulative index values (for EHF0–7). Simple correlation analyses indicated that cumulative heat stress, represented by EHF0–7, was positively associated with mortality in some cities but weak or inconsistent elsewhere. In Athens, the mortality ratio showed a moderate positive correlation with EHF0–7 (r ≈ 0.43), comparable in magnitude to its correlation with Tmean (r ≈ 0.46), while the association with AT was slightly weaker (r ≈ 0.38). These results suggest that in Athens, cumulative heat stress and ambient temperature convey broadly similar information with respect to mortality risk. Multivariable regression analysis for Athens confirmed that EHF0–7 retained an independent association with mortality when Tmean and AT were included simultaneously. The coefficient for cumulative heat exposure was positive and statistically significant, whereas neither Tmean nor AT contributed significantly once EHF0–7 was accounted for. The overall explanatory power of the model remained moderate (R2 ≈ 0.30), indicating that while cumulative heat stress is relevant, much of the day-to-day mortality variability remains unexplained. In Thessaloniki, heat–mortality associations were consistently weak across all metrics. Correlations between mortality and EHF0–7, Tmean, and AT were near zero, and the multivariable regression model explained less than 2% of the variance in mortality. This suggests a limited sensitivity of daily mortality to short-term heat stress in this city, potentially reflecting acclimatization, demographic structure, or the mitigating influence of regional climate and urban characteristics. Patra and Larissa similarly exhibited weak heat-related mortality signals. In both cities, correlations between mortality and EHF0–7 were close to zero, while correlations with Tmean and AT were negative or negligible. Regression models confirmed the absence of statistically significant heat effects, and explanatory power remained low. These findings indicate that, for these locations, neither cumulative heat indices nor temperature-based metrics captured a strong mortality signal at the daily event scale. Heraklion stood out as the most heat-sensitive city. Despite a relatively small number of heat events, mortality was strongly associated with thermal conditions. Mortality correlated positively with Tmean (r ≈ 0.62) and AT (r ≈ 0.44), while EHF0–7 showed a negative correlation, reflecting the unique thermal and synoptic structure of heat events in this maritime setting. In the multivariable model, Tmean emerged as a strong positive predictor of mortality, while AT exhibited a significant negative coefficient once Tmean was controlled for, and EHF0–7 was marginally significant. The model explained over 60% of the variance in mortality, far exceeding explanatory power observed in other cities. This result indicates that in Heraklion, absolute thermal conditions rather than relative cumulative anomalies dominate the heat–mortality relationship, likely due to the city’s narrow temperature range and strong maritime moderation.
Taken together, these results indicate that cumulative heat indices and temperature-based metrics provide overlapping but not identical information. In larger urban and continental settings such as Athens, cumulative heat stress retains explanatory value beyond mean temperature, whereas in strongly maritime environments such as Heraklion, absolute temperature metrics appear more relevant for mortality outcomes.

3.3.2. Cold-Related Mortality and the Role of Wind Chill

Cold-related mortality associations were uniformly weaker than heat-related associations across all five cities, regardless of the exposure metric used. This result should not be interpreted as evidence that cold events have negligible health impacts. Rather, it reflects the fact that cold-related mortality in Mediterranean climates tends to be driven by the cumulative effect of many moderate events rather than by a small number of extreme episodes, which weakens linear day-to-day associations between exposure and mortality. Correlation analyses revealed small negative associations between mortality and ECF0–14, Tmean, and WCI in Athens, Thessaloniki, Patra, and Larissa, with correlation coefficients generally below |0.15|. Such weak daily correlations are commonly reported in regions with relatively mild winters, where temperature variability is limited and cold-related mortality is strongly influenced by non-meteorological factors such as seasonal influenza, long-term health conditions, and baseline winter mortality patterns. These weak associations were reflected in regression models, which explained less than 5% of the variance in mortality in most cases. This low explanatory power also reflects the temporal structure of cold-related mortality, which typically develops gradually over longer periods and therefore is less strongly linked to short-term fluctuations in daily temperature or wind chill compared with heat-related mortality. In Athens, cumulative cold exposure showed a small negative correlation with mortality (r ≈ −0.08), comparable in magnitude to correlations with Tmean and WCI. None of these metrics were statistically significant predictors in the multivariable model, indicating limited sensitivity of daily mortality to cold stress once baseline mortality variability is accounted for. Thessaloniki and Larissa exhibited similar patterns, with weak negative correlations between mortality and both temperature and WCI, and negligible explanatory power in regression models. Patra displayed slightly stronger cold-related signals than the other mainland cities, with modest negative correlations between mortality and both Tmean and WCI. However, these associations remained statistically non-significant, and regression results indicated that neither cumulative cold exposure nor WCI contributed meaningfully to explaining mortality variability. Heraklion again differed from the other cities, showing moderate negative correlations between mortality and cold metrics, including ECF0–14 and WCI. Nevertheless, the regression model for Heraklion explained little variance and no individual predictor reached statistical significance, reflecting the small number of cold events and the generally mild winter climate.
Overall, replacing mean temperature with WCI during cold events did not materially improve model performance in any city. While WCI was strongly correlated with Tmean, particularly in continental locations, it did not capture additional mortality-relevant information beyond that already conveyed by ambient temperature. This suggests that in the Greek context, where extreme cold is relatively rare and wind speeds during cold events are moderate, WCI may be of limited utility for mortality-focused analyses. The event-based results presented in Section 3.4 confirm that cold events are nevertheless associated with measurable increases in mortality, but these impacts are not well captured by simple linear relationships using daily exposure metrics.

3.3.3. Synthesis and Implications

Across all cities, cumulative thermal stress indices and temperature-based exposure metrics explained only a modest fraction of daily mortality variability during heat and cold events. Heat-related effects were generally stronger and more consistent than cold-related effects, although substantial inter-city heterogeneity was evident. Athens showed a modest but robust association between cumulative heat exposure and mortality, while Heraklion appeared particularly sensitive to absolute temperature conditions. In contrast, Thessaloniki, Patra, and Larissa exhibited weak or negligible associations across most exposure metrics.
Figure 3 synthesizes these patterns by illustrating the relationships between daily mortality and multiple thermal exposure metrics during heat and cold event days across the five study cities. Each point represents a single event day, enabling direct visualization of variability, strength, and structure in mortality responses that are not captured by average exposure–response relationships alone. For heat events, increasing thermal stress is generally associated with higher mortality, but the wide dispersion of points highlights substantial day-to-day variability. Tmean shows weak organization and considerable scatter across cities, whereas AT provides a clearer alignment of mortality responses, particularly in coastal cities such as Athens and Heraklion. This suggests that physiological heat stress, rather than air temperature alone, more effectively captures conditions associated with elevated mortality risk. Cumulative anomaly-based indices such as the EHF effectively distinguish extreme heat events from more moderate conditions, with higher values generally corresponding to elevated mortality. However, the broad vertical spread of mortality outcomes for similar EHF magnitudes indicates that cumulative severity is more informative for identifying extreme events than for predicting daily mortality intensity. This is consistent with the observation that a small number of high-severity heat events account for a disproportionate share of heat-related mortality, while moderate events can still produce substantial impacts.
Cold-related mortality relationships are more heterogeneous and less monotonic. Mean air temperature again exhibits weak structure, while WCI—incorporating both temperature and wind speed—often provides improved alignment of mortality responses, particularly in more continental cities such as Larissa. The ECF identifies severe cold episodes but does not substantially reduce the variability in daily mortality, reflecting the longer lag structure of cold effects, cumulative winter vulnerability, and the influence of non-meteorological factors. These relationships are summarized in Figure 3, which compares daily mortality responses across multiple thermal exposure metrics for each city.
Overall, the results indicate that no single thermal exposure metric universally outperforms others across climatic contexts. Physiological indices tend to outperform air temperature alone, while cumulative indices are most effective for event identification rather than for explaining daily mortality variability. Importantly, the weak linear associations observed here do not imply an absence of health risk; instead, they suggest that mortality impacts are concentrated in specific high-severity events and are strongly modulated by local vulnerability, acclimatization, and contextual factors. This motivates the event-based categorization framework introduced in the following section, which focuses on differences in severity, duration, and mortality impact across individual thermal events rather than average exposure–response relationships.

3.3.4. Temporal Changes in Thermal Exposure and Mortality (Pre-2000 vs. Post-2000)

The study period (1992–2023) allows an assessment of temporal changes in thermal exposure and associated mortality. To capture potential shifts in climate and population adaptation, the period was split into pre-2000 (1992–1999) and post-2000 (2000–2023), following documented changes in Eastern Mediterranean heat exposure and resilience development [46]. Descriptive statistics of EHF, ECF, and heat- and cold-event days were calculated separately for these two periods (Table S2).
Across all five cities, mean and maximum EHF values increased substantially after 2000. For example, in Athens mean EHF increased from 0.23 to 0.41 and the maximum value increased from 43.3 to 71.3, while in Larisa mean EHF increased from 0.22 to 0.39. Similar increases were observed in Thessaloniki, Patra, and Heraklion, indicating a systematic intensification of heat exposure across the study area. The number of heat-event days also increased markedly in all cities, particularly in Athens (from 12 to 45 days), Thessaloniki (13 to 40 days), and Larisa (0 to 43 days).
Cold exposure showed smaller and less consistent changes. Mean ECF values increased slightly in most cities, but the increase was considerably weaker than that observed for EHF. In contrast to exposure, mean daily mortality did not show a systematic increase after 2000 in most cities, suggesting that increased heat exposure has not been accompanied by a proportional increase in mortality risk. This pattern is consistent with partial adaptation or gradual thermal resilience development in the population, as also suggested by regional studies of long-term heat exposure [46].

3.4. Categorization of Thermal Events and Associated Mortality

The cross-city analyses presented above indicate that average linear relationships between mortality and continuous thermal exposure metrics are generally weak, heterogeneous, and often statistically insignificant. These findings suggest that excess mortality is not uniformly distributed across the thermal exposure spectrum but may instead be concentrated within discrete episodes of anomalous conditions. To address this limitation, we adopt an event-based framework in which heat and cold episodes are classified into severity categories based on cumulative thermal indices (EHF for heat and ECF for cold).
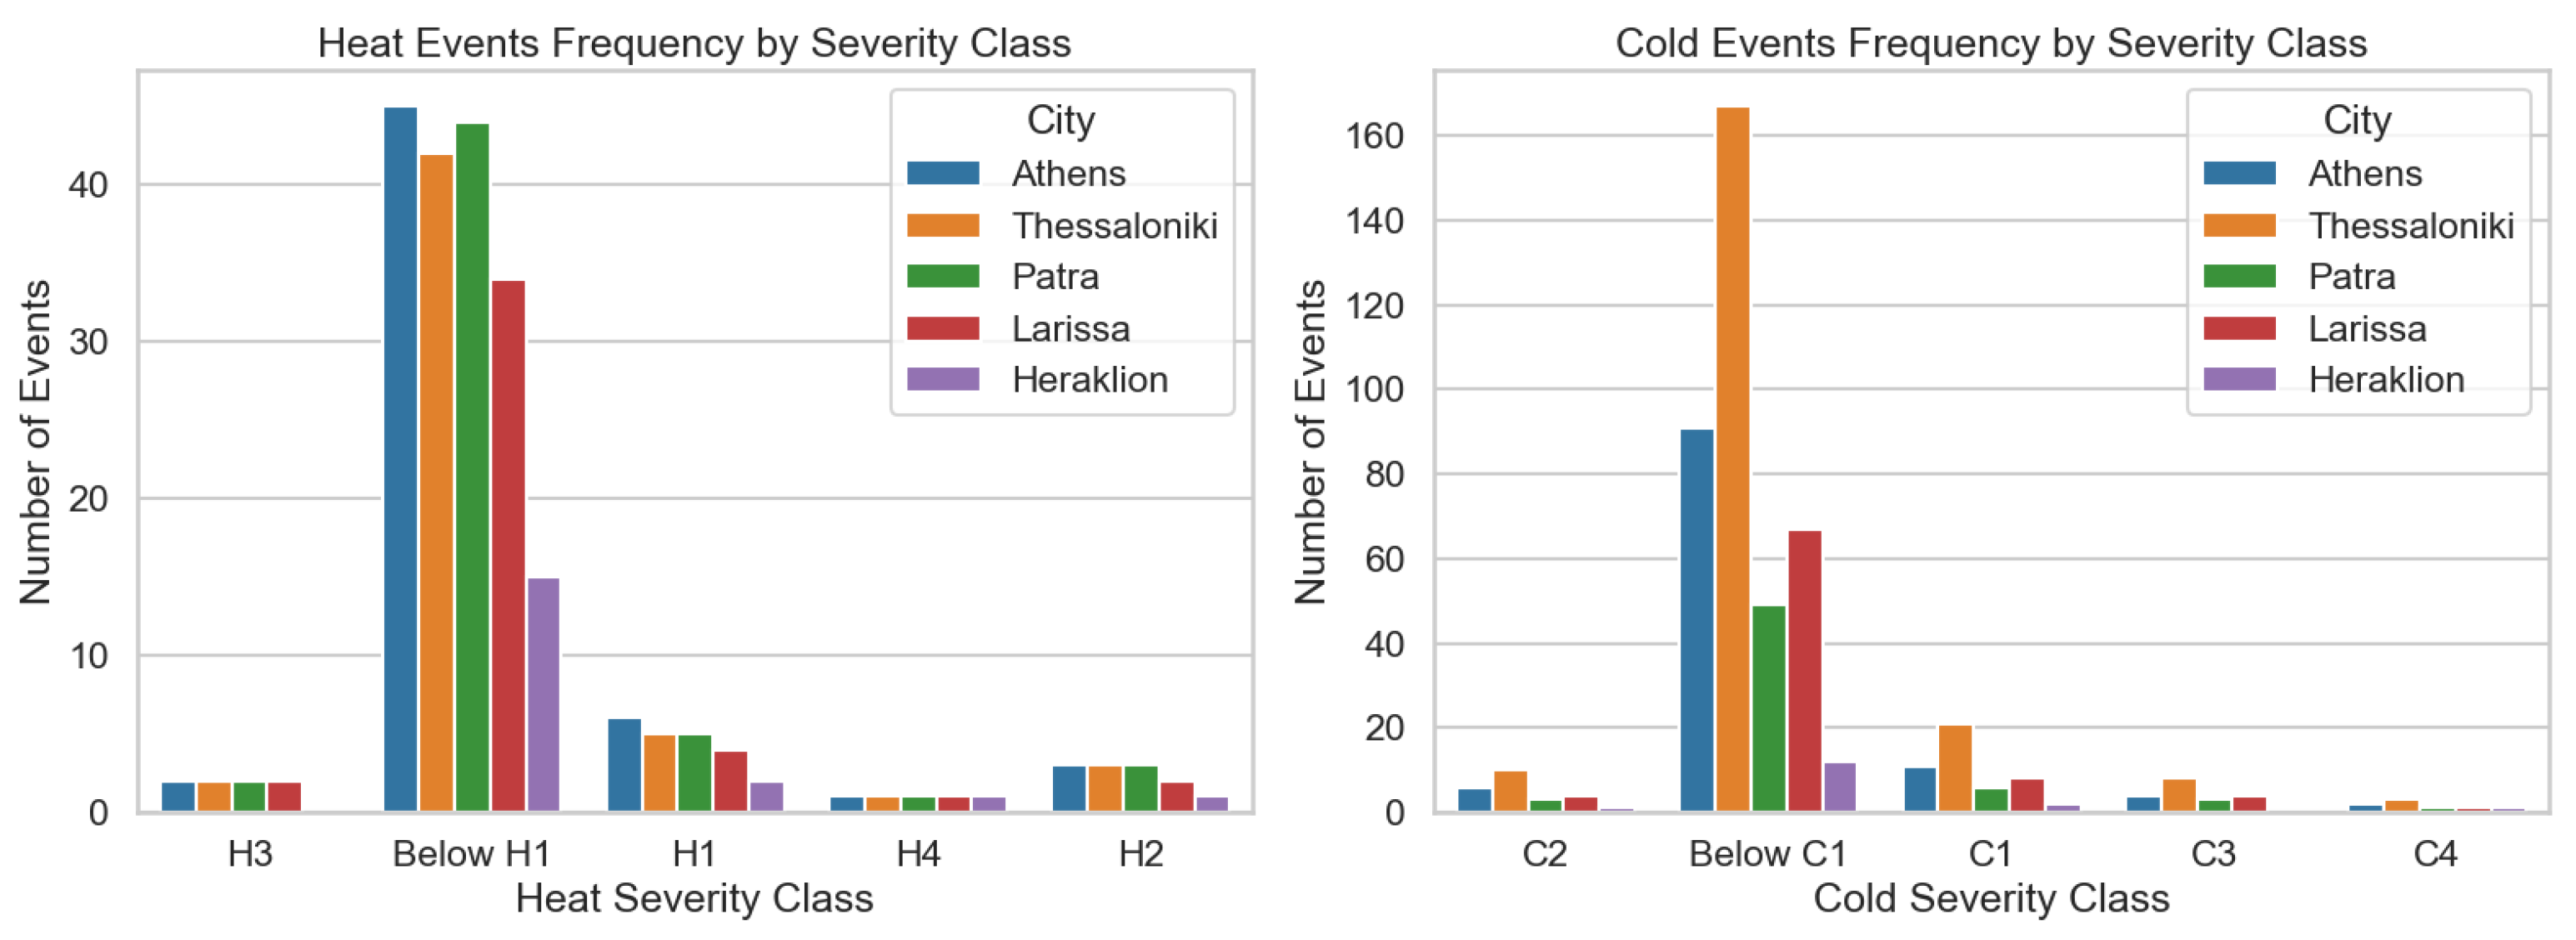
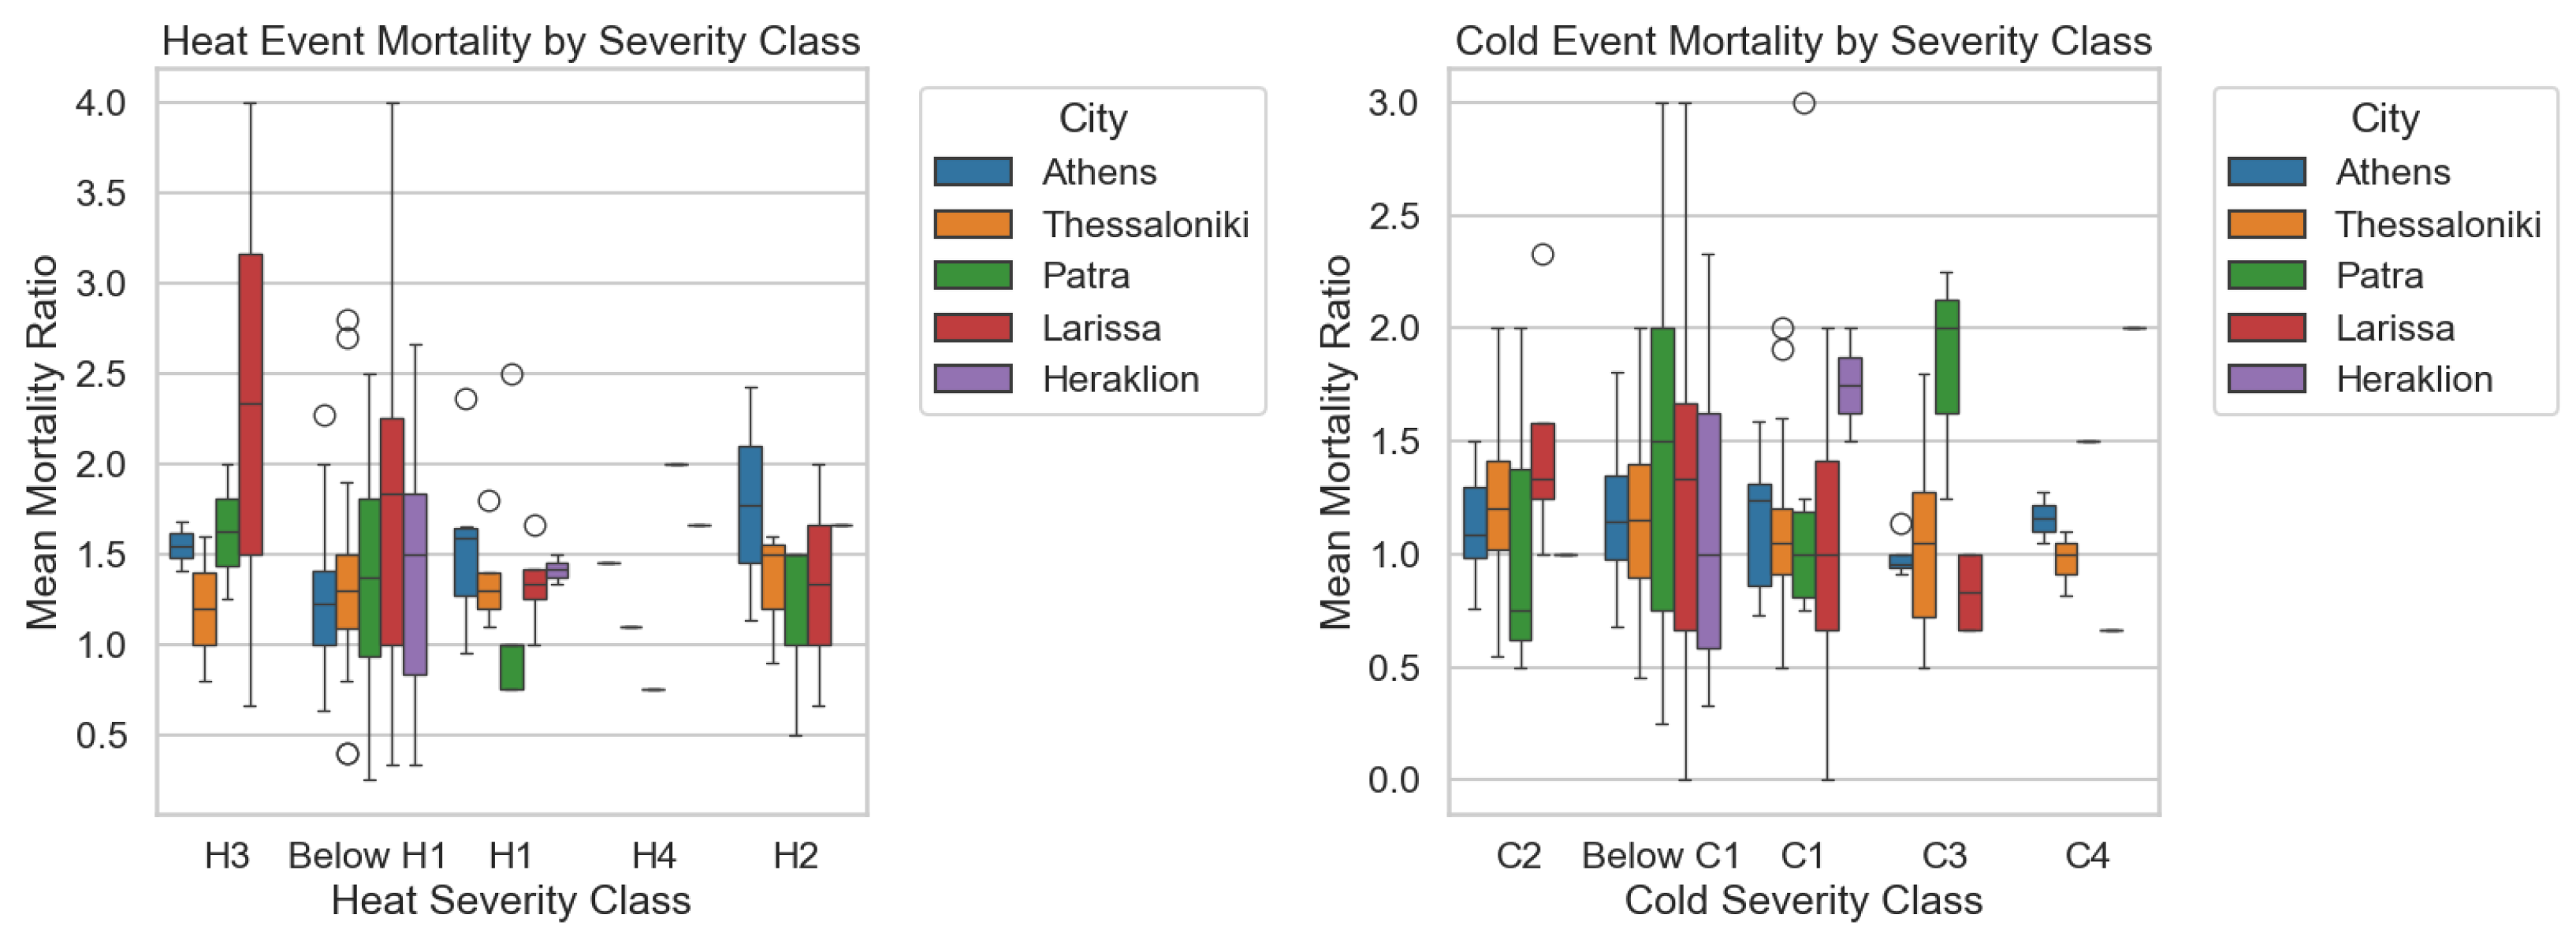
This categorization allows the joint examination of physical intensity, event frequency, seasonal timing, and associated mortality response, thereby capturing nonlinear and threshold-like effects that are obscured in city-wide regression models. Events were grouped into four increasing severity classes (H1–H4 for heat and C1–C4 for cold), along with a “Below H1, C1” category representing weaker but still anomalous conditions. For each category and city, we evaluate the number of events, their typical timing, and the mean daily mortality change relative to baseline. Table 1 summarizes the total number of heat and cold events in each city together with the mean and maximum mortality ratios and the corresponding average values of the cumulative exposure indices (EHF and ECF). This framework enables a direct assessment of whether increasing thermal severity systematically corresponds to higher mortality impacts and whether this relationship differs across climatic and geographic contexts. Figure 4 summarizes the frequency of heat and cold events by severity class for each city, while Figure 5 illustrates the distribution of associated mean mortality ratios across severity categories. Together, these figures provide a comparative overview of how event severity, frequency, and mortality response differ across climatic and urban contexts, and set the framework for the city-specific analyses that follow. Across the five cities, mean mortality during heat events ranges from 1.33 in Athens and Thessaloniki to 1.69 in Larissa, corresponding to increases of 33–69% above baseline mortality. Cold-event mortality ratios are generally smaller but still substantial, ranging from 1.16 to 1.42 depending on the city (Table 1).

3.4.1. Athens

Athens exhibits a clear contrast between cold- and heat-related mortality mechanisms. Cold-related mortality is primarily frequency-driven: a large number of low-severity cold events collectively contribute to winter excess mortality, while higher-severity cold episodes are rare and show no systematic increase in mortality impact. A total of 114 cold events were identified in Athens, with a mean mortality ratio of 1.16 and a maximum value of 1.81, confirming that the cumulative effect of frequent moderate cold events is more important than rare extreme episodes. This pattern is consistent with the weak and inconsistent cold–mortality associations identified in the regression analyses. In contrast, heat-related mortality in Athens is strongly severity-dependent. Although heat events are less frequent than cold events, mortality increases sharply during higher-severity heat episodes, indicating that a small number of intense events account for a disproportionate share of summer excess mortality. In quantitative terms, Athens experienced 57 heat events with a mean mortality ratio of 1.33 and a maximum value of 2.43, indicating that mortality during the most severe heat episodes was more than double the baseline level (Table 1). This finding helps reconcile the modest average heat–mortality correlation observed in Section 3.3 with the substantial impacts observed during severe heat episodes. Overall, Athens demonstrates a dual risk structure in which cold mortality arises from repeated moderate stress, while heat mortality is dominated by episodic extremes.

3.4.2. Thessaloniki

Thessaloniki is characterized by a pronounced dominance of cold-related thermal stress, reflected in both event frequency and mortality response. Cold events occur frequently across a wide range of severities, and even low-severity cold episodes are associated with persistent increases in daily mortality. Thessaloniki shows the largest number of cold events among the five cities (209 events), with a mean mortality ratio of 1.16 and a maximum value of 2.00 (Table 1). However, mortality impacts do not systematically increase with cold severity, suggesting that cumulative exposure and duration, rather than peak intensity, govern cold-related risk in the city. Heat-related mortality in Thessaloniki exhibits a comparatively flat response across severity categories. A total of 53 heat events were identified, with a mean mortality ratio of 1.34 and a maximum value of 2.80, indicating that severe heat episodes can still produce substantial mortality impacts despite the weak average relationship. Mortality increases once moderate heat stress is exceeded, but additional severity does not translate into proportionally larger impacts. This saturation-type behavior is consistent with the near-zero linear heat–mortality associations reported earlier and suggests that adaptive responses or infrastructural buffering may limit marginal heat-related risk beyond a certain threshold. Overall, Thessaloniki’s thermal mortality profile is shaped primarily by frequent cold exposure and moderate heat stress rather than rare extremes.

3.4.3. Patra

Patra displays a distinctive thermal mortality profile in which cold-related impacts are disproportionately large relative to event frequency. While cold events are less frequent than in northern cities, even low- and moderate-severity cold episodes are associated with substantial increases in mortality, and severe cold events, though rare, correspond to particularly pronounced mortality responses. In total, 62 cold events were identified in Patra, but they are associated with the highest mean cold-event mortality ratio among the five cities (1.42), with a maximum value reaching 3.0 (Table 1). This pattern suggests heightened vulnerability to cold stress, potentially linked to limited acclimatization, housing characteristics, or preparedness for low temperatures in this coastal city. Heat-related mortality in Patra is more heterogeneous and does not exhibit a clear monotonic relationship with severity. Patra experienced 55 heat events with a mean mortality ratio of 1.34 and a maximum value of 2.50, confirming the large variability of heat-related impacts in this city. Frequent low-severity heat events contribute to excess mortality, but higher-severity events show variable impacts, likely reflecting small sample sizes and nonlinear responses. Taken together, these findings indicate that cold stress represents the dominant thermal hazard in Patra, while heat-related impacts are more diffuse and event-specific.

3.4.4. Larissa

Larissa shows the strongest and most consistent heat-related mortality response among the study cities. This is clearly reflected in the quantitative results: Larissa has the highest mean heat-event mortality ratio (1.69) and the largest maximum value (4.0), meaning that mortality during the most severe heat events was up to four times higher than the baseline level (Table 1). Heat events are both frequent and severe, and mortality impacts increase markedly with event severity, culminating in exceptionally large responses during the most intense heat episodes. Notably, even lower-severity heat events are associated with substantial excess mortality, indicating high baseline vulnerability to heat stress in this continental setting. Cold-related mortality in Larissa is more variable and lacks a consistent severity gradient. A total of 84 cold events were identified, with a mean mortality ratio of 1.20 and a maximum value of 3.0, confirming that cold impacts are present but considerably weaker than heat-related impacts. While moderate cold events are associated with increased mortality, the most severe categories do not show systematic impacts, likely reflecting limited event numbers and statistical variability. Overall, the results identify heat as the dominant thermal hazard in Larissa, with severity playing a central role in shaping mortality outcomes.

3.4.5. Heraklion

Heraklion experiences the lowest frequency of thermal extremes, reflecting strong maritime moderation; nevertheless, both heat and cold events are associated with notable mortality impacts when they occur. Only 19 heat events and 16 cold events were identified in Heraklion, yet the mean mortality ratios remain high (1.43 for heat and 1.23 for cold), indicating that even infrequent extremes can produce substantial health impacts (Table 1). Heat-related mortality is evident even during relatively low-severity events, and more severe heat episodes—often occurring early in the warm season—are linked to pronounced mortality increases, suggesting a key role for limited acclimatization. Cold events in Heraklion are rare but can be associated with disproportionately large mortality responses, particularly during the most severe episodes. Although these findings are based on small samples and should be interpreted cautiously, they indicate that infrequent extremes may pose substantial health risks in insular Mediterranean environments. Overall, Heraklion’s thermal mortality profile underscores that low event frequency does not equate to low vulnerability.
Across all cities, mean mortality ratios exceed 1.30 during heat events and reach values above 1.70 in the most vulnerable locations, while cold-event mortality ratios generally remain between 1.10 and 1.40 but can exceed 2.0 during the most severe episodes. Taken together, the event-based categorization results demonstrate that thermal mortality risk in Greek cities is governed by different combinations of event frequency, severity, and seasonal timing, rather than by cumulative thermal exposure alone. Figure 4 highlights pronounced inter-city differences in the frequency and severity distribution of thermal events. Cold events are generally more frequent than heat events across all cities, with the majority of events classified in the lowest severity category. However, the relative contribution of higher-severity classes varies substantially between cities, reflecting differences in climatic regimes and exposure patterns. Figure 5 shows the distribution of mean daily mortality ratios associated with each severity class. In contrast to event frequency, mortality responses exhibit greater heterogeneity across cities and severity levels, with several cities displaying disproportionately large mortality impacts during higher-severity events despite their rarity. This divergence between frequency and impact underscores the importance of event severity in shaping health outcomes. The variability of mortality responses within each severity class is substantial, with standard deviations typically ranging from 0.25 to 0.85 depending on the city and event type, indicating considerable statistical uncertainty in the estimated effects.
While the regression-based analyses show generally weak and heterogeneous linear associations between cumulative heat or cold indices and mortality, the categorization framework reveals that substantial excess mortality is concentrated in specific classes of events. In particular, frequent low-severity cold events contribute persistently to winter mortality in northern and continental cities, whereas rare but intense heat events dominate summer mortality risk in several locations. These findings highlight the limitations of average exposure–response relationships and motivate a mechanistic discussion of how climatic context, acclimatization, and urban characteristics shape vulnerability to thermal extremes.

4. Discussion

This study examined heat- and cold-related mortality across five Greek cities using an event-based framework grounded in cumulative thermal stress (EHF and ECF) and synoptic context. Rather than modelling continuous exposure–response relationships, this study focused on discrete thermal events, their severity, and associated mortality responses. This perspective provides complementary insights to the existing literature and helps reconcile weak average associations with substantial mortality impacts during specific extreme episodes. While DLNMs and other continuous exposure–response models capture non-linear and lagged temperature–mortality relationships, they generally represent average effects across the entire temperature distribution. The event-based framework complements these methods by isolating specific episodes of extreme stress relative to recent acclimatization, enabling direct quantification of mortality during rare, high-intensity events. This approach emphasizes episodic public health risk, which can be masked in models that focus on mean exposures, offering additional insights for early warning systems and targeted interventions.
Previous studies in Greece have consistently demonstrated statistically significant associations between ambient temperature and mortality, often characterized by nonlinear exposure–response relationships and delayed effects. Using distributed lag non-linear models (DLNM), Psistaki et al. [32] identified U- or J-shaped relationships between temperature and mortality in Thessaloniki, with minimum mortality temperatures around the upper percentiles of the temperature distribution. This study reported stronger relative risks at extreme temperatures but emphasized that moderate cold temperatures accounted for the largest attributable mortality burden, due to their higher frequency and longer duration. The results presented here are broadly consistent with these findings, particularly regarding the importance of cold exposure in northern and continental cities such as Thessaloniki and Larissa. However, unlike DLNM-based studies, this regression analyses yielded weak linear associations between cumulative thermal indices and daily mortality. This apparent discrepancy reflects methodological differences rather than contradictory evidence. While DLNMs are designed to capture nonlinear and lagged effects across the full temperature distribution, the event-based approach presented here isolates periods of anomalous thermal stress relative to recent acclimatization. As a result, average exposure–response slopes are expected to be small, even when specific events exert substantial mortality impacts. Importantly, the event categorization analysis revealed that in several cities—most notably Athens, Patra, and Larissa—mortality increases were concentrated in a limited number of high-severity heat or cold events. This aligns with the findings of Parliari et al. [33], who reported short-lived but intense heat effects and longer-lasting cold effects, and supports the interpretation that thermal mortality risk in Greece is episodic rather than continuously proportional to temperature.
Furthermore, consistent with the broader Mediterranean literature, cold-related mortality effects were generally more frequent but weaker on a per-event basis, while heat-related effects were less frequent but often more severe. Almendra et al. [36] reported that Athens exhibits lower cold-related relative risk than Lisbon and London, but still experiences substantial cold-attributable mortality, likely driven by housing quality and socioeconomic factors. The findings of this study for Athens support this interpretation: frequent low-severity cold events were associated with persistent mortality increases, whereas rare but intense heat events produced disproportionately large impacts. In Thessaloniki, both presented results of this study and those of Psistaki et al. [32] point to a dominant cold burden, with moderate cold conditions contributing more to mortality than extreme cold or heat. The relatively flat mortality gradient across heat severity categories observed in Thessaloniki suggests a saturation effect, whereby mortality risk increases once a moderate heat threshold is exceeded but does not rise proportionally with additional severity. This behavior has been noted in other Mediterranean cities and may reflect behavioral adaptation, public awareness, and physiological acclimatization. Larissa and Patra exhibited distinct patterns. In Larissa, a continental climate and large diurnal and seasonal temperature variability were associated with exceptionally strong heat-related mortality responses, particularly during high-severity events. In contrast, Patra showed pronounced sensitivity to cold events, including moderate categories, despite its coastal location. This finding echoes the conclusions of Almendra et al. [36], who emphasized the role of the built environment and social vulnerability in shaping cold-related mortality, beyond climatological severity alone. Heraklion represents a contrasting case. Despite the lowest frequency of thermal events, both heat and cold extremes were associated with substantial mortality increases. This pattern is consistent with the concept of low acclimatization in maritime climates, where rare extremes may catch populations unprepared. Similar interpretations have been proposed in multi-country reviews, including Tseliou and Zervas [35], which highlight adaptation as a key determinant of regional vulnerability. Although regional differences in thermal mortality suggest adaptation or acclimatization effects, the current analytical framework does not explicitly model adaptive responses over time. Temporal analyses (Table S2) provide indirect evidence of thermal resilience, with increased exposure post-2000 not translating proportionally into higher mortality. Future work could integrate adaptation metrics directly into event-based or continuous models to better quantify how physiological, behavioral, and infrastructural adjustments modulate health risk.
Several studies have also argued that composite thermal indices better capture physiological stress than air temperature alone. Nastos and Matzarakis [47] demonstrated significant associations between mortality and PET and UTCI in Athens, with stronger cold effects and shorter heat lags. Similarly, Parliari et al. [33] reported strong heat-related risks for cardiovascular and respiratory mortality using apparent temperature metrics. In this analysis, apparent temperature and WCI showed stronger correlations with mortality than EHF or ECF in certain cities, particularly for heat events in Heraklion and Athens. However, when included jointly in regression models, multicollinearity and limited sample sizes reduced statistical significance. These results suggest that while thermal comfort indices may improve mechanistic interpretation, their added value over cumulative anomaly-based indices depends on context, event frequency, and study design. Importantly, the strong correlations among temperature-based metrics underscore the challenge of disentangling individual contributions in multi-variable models.
A key contribution of this study is demonstrating that weak linear exposure–response relationships can coexist with large, socially relevant mortality impacts during specific events. This finding aligns with recent reviews emphasizing that average effects often mask episodic risk [35]. By categorizing events according to cumulative severity, we show that public health risk is not evenly distributed across thermal conditions but is instead concentrated in a small number of extreme episodes, whose impacts vary substantially by city. This perspective has important implications for climate adaptation and early warning systems. Policies based solely on mean temperature–mortality relationships may underestimate the importance of rare but high-impact events, particularly in regions with strong acclimatization or maritime moderation.
Building on the study period (1992–2023), a temporal analysis comparing pre-2000 and post-2000 periods (see Table S2) indicates that heat exposure has increased substantially in all cities, both in mean and maximum EHF, as well as in the number of heat-event days. Despite this intensification, mean daily mortality has not increased proportionally, suggesting a degree of thermal resilience or partial acclimatization in the population over time. These findings highlight that adaptation processes may moderate the health impacts of rising thermal stress, emphasizing the need to consider both exposure trends and population vulnerability when assessing future climate risks.

5. Conclusions

This study investigated heat- and cold-related mortality across five climatically diverse Greek cities using an event-based framework that explicitly isolates high-impact thermal episodes, grounded in cumulative thermal stress and synoptic atmospheric context. By combining Excess Heat Factor (EHF), Excess Cold Factor (ECF), and air-mass classification, this study identified discrete thermal stress events and evaluated their associated mortality impacts, moving beyond traditional continuous exposure–response approaches. Across all cities, thermal extremes were associated with measurable increases in mortality, but the strength, direction, and consistency of these effects varied markedly by location and event type. Heat-related impacts were generally more pronounced than cold-related impacts, particularly during high-severity events, although cold events were more frequent and contributed to a persistent background mortality burden in northern and continental cities. Coastal and insular locations, especially Heraklion, exhibited heightened sensitivity to both heat and cold despite fewer events, highlighting the role of acclimatization and preparedness rather than climatic severity alone.
A central finding of this work is that cumulative thermal indices explain only a limited proportion of day-to-day mortality variability, yet extreme events can produce disproportionately large mortality responses. This apparent paradox underscores the limitations of linear or average exposure–response metrics and emphasizes the value of an event-focused perspective that can capture non-linear, threshold-like effects missed by conventional models. The categorization of thermal events by cumulative severity revealed that mortality risk is concentrated in a relatively small number of high-impact episodes, whose characteristics and health consequences differ substantially between cities. The results also suggest that no single thermal metric universally captures mortality risk across all settings. While anomaly-based indices such as EHF and ECF provide a robust framework for identifying extreme events relative to local acclimatization, apparent temperature and wind-related indices appear to enhance interpretation in certain contexts, particularly for cold stress. This reinforces the need for multi-metric, city-specific approaches that integrate episodic intensity, frequency, and climatological context. Several limitations should be acknowledged. First, the analysis was based on all-cause daily mortality, which may dilute stronger associations for specific causes such as cardiovascular or respiratory deaths. Second, the relatively small number of high-severity events—especially in southern and insular cities—limits statistical power and increases uncertainty in estimated mortality impacts for the most extreme categories. Third, the use of city-wide meteorological and mortality data does not capture intra-urban variability in exposure, vulnerability, or socioeconomic conditions, which are known to modulate temperature–mortality relationships. Additionally, potential confounding factors such as air pollution, influenza epidemics, and demographic changes were not explicitly modeled and may contribute to residual variability. Finally, the event-based framework, while effective for highlighting episodic risk, does not quantify attributable mortality or delayed effects with the same precision as distributed lag non-linear models. The two approaches should therefore be viewed as complementary rather than interchangeable.
Future work should aim to integrate event-based severity classification with traditional distributed lag modeling to better capture both episodic impacts and cumulative population burden. Expanding analyses to cause-specific mortality and vulnerable subpopulations would improve mechanistic understanding and public health relevance. Incorporating intra-urban exposure gradients, socioeconomic indicators, and housing characteristics would further clarify the drivers of spatial heterogeneity in vulnerability. As climate change is expected to intensify heat extremes while modifying cold-event characteristics, applying this framework to future climate projections could provide valuable insights into evolving thermal risk. Ultimately, combining cumulative thermal metrics with city- and event-specific vulnerability assessments offers a promising pathway for improving early warning systems and tailoring adaptation strategies to local conditions. By emphasizing the episodic nature of thermal risk, this study provides a novel and actionable perspective that complements conventional continuous exposure–response analyses, enhancing the relevance of findings for public health planning and climate adaptation.

Supplementary Materials

The following supporting information can be downloaded at: https://www.mdpi.com/article/10.3390/atmos17040401/s1, Figure S1: The most frequent occurring synoptic weathers types per month during the study period (1992–2024) in Athens; Figure S2: The most frequent occurring synoptic weathers types per month during the study period (1992–2024) in Thessaloniki; Figure S3: The most frequent occurring synoptic weathers types per month during the study period (1992–2024) in Patra; Figure S4: The most frequent occurring synoptic weathers types per month during the study period (1992–2024) in Larissa; Figure S5: The most frequent occurring synoptic weathers types per month during the study period (1992–2024) in Heraklion; Table S1: Descriptive statistics of thermal exposure metrics during heat and cold events in the five study cities. Mean, standard deviation, minimum, and maximum values are shown for mean air temperature (Tmean, °C), apparent temperature (AT, °C), wind chill index (WCI, °C), and cumulative thermal indices (EHF0–7 and ECF0–14, °C2) calculated only for identified heat- and cold-event days; Table S2: Temporal changes in thermal exposure and mortality in the study cities (comparison between 1992–1999 and 2000–2023).

Author Contributions

Conceptualization, I.P. and P.K.; software, I.P., methodology, I.P. and P.K.; validation, I.P. and P.K.; formal analysis, I.P. and P.K.; investigation, I.P.; resources, I.P.; data curation, I.P.; writing—original draft preparation, I.P.; writing—review and editing, P.K.; visualization, I.P.; supervision, P.K.; funding acquisition, P.K. All authors have read and agreed to the published version of the manuscript.

Funding

This work was supported by the project “Support for upgrading the operation of the National Network for Climate Change (CLIMPACT II)” (Project Code 75539; reference 2023NA11900001–N. 5201588), funded by the Public Investment Program of Greece, General Secretary of Research and Technology/Ministry of Development and Investments.

Institutional Review Board Statement

Not applicable.

Informed Consent Statement

Not applicable.

Data Availability Statement

Mortality data were obtained from the Hellenic Statistical Authority (ELSTAT) and are subject to confidentiality and data protection regulations; therefore, they are not publicly available. Meteorological data are publicly available from the Copernicus Climate Data Store. Derived datasets generated during the current study are available from the corresponding author upon reasonable request.

Acknowledgments

The authors gratefully acknowledge the Hellenic Statistical Authority (ELSTAT) for providing the mortality data that formed the basis of this analysis.

Conflicts of Interest

The authors declare no conflicts of interest.

Abbreviations

The following abbreviations are used in this manuscript:
EHFExcess Heat Factor
ECFExcess Cold Factor
SSCSpatial Synoptic Classification
DMDry Moderate
DTDry Tropical
MT+Moist Tropical Plus
DPDry Polar
DP+Dry Polar Plus
MPMoist Polar
MP+Moist Polar Plus
ATApparent Temperature
WCIWind Chill Index
OLSOrdinary least squares
TmeanDaily mean air temperature
DLNMDistributed lag non-linear models

References

  1. Hajat, S.; Kosatky, T. Heat-Related Mortality: A Review and Exploration of Heterogeneity. J. Epidemiol. Community Health 2010, 64, 753–760. [Google Scholar] [CrossRef]
  2. Armstrong, B.; Bell, M.L.; Coelho, M.d.S.Z.S.; Guo, Y.-L.L.; Guo, Y.; Goodman, P.; Hashizume, M.; Honda, Y.; Kim, H.; Lavigne, E.; et al. Longer-Term Impact of High and Low Temperature on Mortality: An International Study to Clarify Length of Mortality Displacement. Environ. Health Perspect. 2017, 125, 107009. [Google Scholar] [CrossRef] [PubMed]
  3. Guo, Y.; Gasparrini, A.; Armstrong, B.; Li, S.; Tawatsupa, B.; Tobias, A.; Lavigne, E.; Coelho, M.d.S.Z.S.; Leone, M.; Pan, X.; et al. Global Variation in the Effects of Ambient Temperature on Mortality: A Systematic Evaluation. Epidemiology 2014, 25, 781–789. [Google Scholar] [CrossRef] [PubMed]
  4. Huang, Y.; Mao, F.; Xu, Y.; Qi, J.; Zhang, W.; Li, C.; Zhou, M. Association between Urban Heat Islands and Heat-Related Mortality in 70 Pairs of Adjacent Urban–Rural Counties among 8 Topographic Regions in China. Sustain. Cities Soc. 2025, 121, 106182. [Google Scholar] [CrossRef]
  5. Michelozzi, P.; De’ Donato, F.; Scortichini, M.; Xu, Y.; Qi, J.; Zhang, W.; Li, C.; Zhou, M. Sull’Incremento della Mortalità in Italia nel 2015: Analisi della Mortalità Stagionale nelle 32 Città del Sistema di Sorveglianza della Mortalità Giornaliera. Epidemiol. Prev. 2016, 40, 22–28. [Google Scholar] [CrossRef]
  6. Zafeiratou, S.; Samoli, E.; Analitis, A.; Gasparrini, A.; Stafoggia, M.; de’ Donato, F.K.; Rao, S.; Zhang, S.; Breitner, S.; Masselot, P.; et al. Assessing Heat Effects on Respiratory Mortality and Location Characteristics as Modifiers of Heat Effects at a Small Area Scale in Central-Northern Europe. Environ. Epidemiol. 2023, 7, e269. [Google Scholar] [CrossRef]
  7. Liu, J.; Varghese, B.M.; Hansen, A.; Zhang, Y.; Driscoll, T.; Morgan, G.; Dear, K.; Gourley, M.; Capon, A.; Bi, P. Heat Exposure and Cardiovascular Health Outcomes: A Systematic Review and Meta-Analysis. Lancet Planet. Health 2022, 6, e484–e495. [Google Scholar] [CrossRef] [PubMed]
  8. Dimitriou, I.C.; Arsenopoulos, A.; Xenakis, A.; Kouloukakis, P.; Marinakis, V. Integrating socio-economic dimensions into climate-resilience assessment of building stock: A case on marginalized groups in Athens. In Proceedings of the 2025 IEEE International Workshop on Metrology for Living Environment (MetroLivEnv 2025), Venice, Italy, 11–13 June 2025; pp. 461–466. [Google Scholar] [CrossRef]
  9. Pogačar, T.; Žnidaršič, Z.; Kajfež Bogataj, L.; Flouris, A.D.; Poulianiti, K.; Črepinšek, Z. Heat waves occurrence and outdoor workers’ self-assessment of heat stress in Slovenia and Greece. Int. J. Environ. Res. Public Health 2019, 16, 597. [Google Scholar] [CrossRef]
  10. Founda, D.; Santamouris, M. Synergies between Urban Heat Island and Heatwaves in Athens (Greece), during an Extremely Hot Summer (2012). Sci. Rep. 2017, 7, 10973. [Google Scholar] [CrossRef]
  11. Barcena-Martin, E.; Molina, J.; Ruiz-Sinoga, J.D. Issues and Challenges in Defining a Heatwave: A Mediterranean Case Study. Int. J. Climatol. 2019, 39, 331–342. [Google Scholar] [CrossRef]
  12. Luo, M.; Lau, N.C.; Liu, Z. Different Mechanisms for Daytime, Nighttime, and Compound Heatwaves in Southern China. Weather Clim. Extrem. 2022, 36, 100449. [Google Scholar] [CrossRef]
  13. Su, Q.; Dong, B. Recent Decadal Changes in Heat Waves over China: Drivers and Mechanisms. J. Clim. 2019, 32, 4215–4234. [Google Scholar] [CrossRef]
  14. Perkins, S.E.; Alexander, L.V. On the Measurement of Heat Waves. J. Clim. 2013, 26, 4500–4517. [Google Scholar] [CrossRef]
  15. Petrou, I.; Kassomenos, P.; Kyriazis, N. Assessing Future Heatwave-Related Mortality in Greece Using Advanced Machine Learning and Climate Projections. Atmosphere 2025, 16, 1093. [Google Scholar] [CrossRef]
  16. Gasparrini, A.; Guo, Y.; Hashizume, M.; Lavigne, E.; Zanobetti, A.; Schwartz, J.; Tobias, A.; Tong, S.; Rocklöv, J.; Forsberg, B.; et al. Mortality Risk Attributable to High and Low Ambient Temperature: A Multicountry Observational Study. Lancet 2015, 386, 369–375. [Google Scholar] [CrossRef]
  17. Vicedo-Cabrera, A.M.; Sera, F.; Guo, Y.; Chung, Y.; Arbuthnott, K.; Tong, S.; Tobias, A.; Lavigne, E.; Coelho, M.d.S.Z.S.; Saldiva, P.H.N.; et al. A Multi-Country Analysis on Potential Adaptive Mechanisms to Cold and Heat in a Changing Climate. Environ. Int. 2018, 111, 239–246. [Google Scholar] [CrossRef] [PubMed]
  18. Psistaki, K.; Kouis, P.; Michanikou, A.; Yiallouros, P.K.; Papatheodorou, S.I.; Paschalidou, A.Κ. Temporal Trends in Temperature-Related Mortality and Evidence for Maladaptation to Heat and Cold in the Eastern Mediterranean Region. Sci. Total Environ. 2024, 943, 173899. [Google Scholar] [CrossRef]
  19. Jendritzky, G.; de Dear, R.; Havenith, G. UTCI—Why Another Thermal Index? Int. J. Biometeorol. 2012, 56, 421–428. [Google Scholar] [CrossRef]
  20. Höppe, P. The Physiological Equivalent Temperature—A Universal Index for the Biometeorological Assessment of the Thermal Environment. Int. J. Biometeorol. 1999, 43, 71–75. [Google Scholar] [CrossRef] [PubMed]
  21. Matzarakis, A.; Mayer, H.; Iziomon, M. Applications of a Universal Thermal Index: Physiological Equivalent Temperature. Int. J. Biometeorol. 1999, 43, 76–84. [Google Scholar] [CrossRef] [PubMed]
  22. Steadman, R.G. A Universal Scale of Apparent Temperature. J. Appl. Meteorol. Climatol. 1984, 23, 1674–1687. [Google Scholar] [CrossRef]
  23. Elmastas, N.; Adiguzel, F.; Ustuner, M.; Cetin, M.; Alkan, A.; Sahap, A. Determining climatic risks in the Eastern Anatolia region using the wind chill index, Türkiye. Air Qual. Atmos. Health 2025, 18, 3151–3162. [Google Scholar] [CrossRef]
  24. Ji, W.; Zhu, Y.; Du, H.; Cao, B.; Lian, Z.; Geng, Y.; Liu, S.; Xiong, J.; Yang, C. Interpretation of Standard Effective Temperature (SET) and Explorations on Its Modification and Development. Build. Environ. 2022, 210, 108714. [Google Scholar] [CrossRef]
  25. Nairn, J.R.; Fawcett, R.J.B. The Excess Heat Factor: A Metric for Heatwave Intensity and Its Use in Classifying Heatwave Severity. Int. J. Environ. Res. Public Health 2015, 12, 227–253. [Google Scholar] [CrossRef]
  26. Wang, Y.; Shi, L.; Zanobetti, A.; Schwartz, J.D. Estimating and Projecting the Effect of Cold Waves on Mortality in 209 US Cities. Environ. Int. 2016, 94, 141–149. [Google Scholar] [CrossRef]
  27. Sheridan, S.C. The Redevelopment of a Weather-Type Classification Scheme for North America. Int. J. Climatol. 2002, 22, 51–68. [Google Scholar] [CrossRef]
  28. Reid, C.E.; Snowden, J.M.; Kontgis, C.; Tager, I.B. The Role of Ambient Ozone in Epidemiologic Studies of Heat-Related Mortality. Environ. Health Perspect. 2012, 120, 1627–1630. Available online: https://pubmed.ncbi.nlm.nih.gov/22899622/ (accessed on 12 April 2026). [CrossRef]
  29. Urban, A.; Kyselý, J. Application of Spatial Synoptic Classification in Evaluating Links between Heat Stress and Cardiovascular Mortality and Morbidity in Prague, Czech Republic. Int. J. Biometeorol. 2018, 62, 85–96. [Google Scholar] [CrossRef]
  30. Lee, D.G.; Kim, K.R.; Kim, J.; Kim, B.-J.; Cho, C.-H.; Sheridan, S.C.; Kalkstein, L.S.; Kim, H.; Yi, S.-M. Effects of Heat Waves on Daily Excess Mortality in 14 Korean Cities during the Past 20 Years (1991–2010): An Application of the Spatial Synoptic Classification Approach. Int. J. Biometeorol. 2018, 62, 575–583. [Google Scholar] [CrossRef] [PubMed]
  31. Fonseca-Rodríguez, O.; Sheridan, S.C.; Lundevaller, E.H.; Schumann, B. Hot and Cold Weather Based on the Spatial Synoptic Classification and Cause-Specific Mortality in Sweden: A Time-Stratified Case-Crossover Study. Int. J. Biometeorol. 2020, 64, 1435–1449. [Google Scholar] [CrossRef] [PubMed]
  32. Psistaki, K.; Dokas, I.M.; Paschalidou, A.K. Analysis of the Heat- and Cold-Related Cardiovascular Mortality in an Urban Mediterranean Environment through Various Thermal Indices. Environ. Res. 2023, 216, 114831. [Google Scholar] [CrossRef]
  33. Parliari, D.; Cheristanidis, S.; Giannaros, C.; Keppas, S.C.; Papadogiannaki, S.; De’donato, F.; Sarras, C.; Melas, D. Short-Term Effects of Apparent Temperature on Cause-Specific Mortality in the Urban Area of Thessaloniki, Greece. Atmosphere 2022, 13, 852. [Google Scholar] [CrossRef]
  34. Zafeiratou, S.; Analitis, A.; Founda, D.; Giannakopoulos, C.; Varotsos, K.V.; Sismanidis, P.; Keramitsoglou, I.; Katsouyanni, K. Spatial Variability in the Effect of High Ambient Temperature on Mortality: An Analysis at Municipality Level within the Greater Athens Area. Int. J. Environ. Res. Public Health 2019, 16, 3689. [Google Scholar] [CrossRef] [PubMed]
  35. Tseliou, A.; Zervas, E. Review of the Effect of Air Temperature on Human Mortality. E3S Web Conf. 2024, 585, 06001. [Google Scholar] [CrossRef]
  36. Almendra, R.; Santana, P.; Mitsakou, C.; Heaviside, C.; Samoli, E.; Rodopoulou, S.; Katsouyanni, K.; Vardoulakis, S. Cold-Related Mortality in Three European Metropolitan Areas: Athens, Lisbon and London. Implications for Health Promotion. Urban Clim. 2019, 30, 100532. [Google Scholar] [CrossRef]
  37. Muñoz-Sabater, J.; Dutra, E.; Agustí-Panareda, A.; Albergel, C.; Arduini, G.; Balsamo, G.; Boussetta, S.; Choulga, M.; Harrigan, S.; Hersbach, H.; et al. ERA5-Land: A State-of-the-Art Global Reanalysis Dataset for Land Applications. Earth Syst. Sci. Data 2021, 13, 4349–4383. [Google Scholar] [CrossRef]
  38. Sheridan, S.C.; Kalkstein, L.S. A Synoptic Climatological Approach to Separate Weather- and Pollution-Induced Impacts on Human Mortality. Epidemiology 2004, 15, S40. [Google Scholar] [CrossRef]
  39. Khatana, S.A.M.; Werner, R.M.; Groeneveld, P.W. Association of extreme heat with all-cause mortality in the contiguous US, 2008–2017. JAMA Netw. Open 2022, 5, e2212957. [Google Scholar] [CrossRef]
  40. Weiss, J. Short-term effects of extreme heat, cold, and air pollution episodes on excess mortality in Luxembourg. Int. J. Environ. Res. Public Health 2025, 22, 376. [Google Scholar] [CrossRef]
  41. Bolton, D. The Computation of Equivalent Potential Temperature. Mon. Weather Rev. 1980, 108, 1046–1053. [Google Scholar] [CrossRef]
  42. Osczevski, R.; Bluestein, M. The New Wind Chill Equivalent Temperature Chart. Bull. Am. Meteorol. Soc. 2005, 86, 1453–1458. [Google Scholar] [CrossRef]
  43. Michelozzi, P.; Accetta, G.; De Sario, M.; D’Ippoliti, D.; Marino, C.; Baccini, M.; Biggeri, A.; Anderson, H.R.; Katsouyanni, K.; Ballester, F.; et al. High temperature and hospitalizations for cardiovascular and respiratory causes in 12 European cities. Am. J. Respir. Crit. Care Med. 2009, 179, 383–389. [Google Scholar] [CrossRef]
  44. Wu, K.; Ho, H.C.; Su, H.; Huang, C.; Zheng, H.; Zhang, W.; Tao, J.; Hossain, M.Z.; Zhang, Y.; Hu, K.; et al. A systematic review and meta-analysis of intraday effects of ambient air pollution and temperature on cardiorespiratory morbidities: First few hours of exposure matters to life. eBioMedicine 2022, 86, 104327. [Google Scholar] [CrossRef] [PubMed]
  45. Xu, H.; Yin, L.; Zhang, Y.; Zhang, H.; Zhao, H.; Du, K.; Li, M.; Yu, D.; Dong, K.; Peng, S.; et al. Cold climate dual threats: Lagged and nonlinear effects of air pollution and meteorological extremes on acute myocardial infarction risk. BMC Cardiovasc. Disord. 2026, 26, 89. [Google Scholar] [CrossRef] [PubMed]
  46. Shafran-Nathan, R.; Broday, D.M. Long-term recurrent exposure to excessive heat in the east Mediterranean and climate resilience development—A case study in Israel. Reg. Environ. Change 2024, 24, 153. [Google Scholar] [CrossRef]
  47. Nastos, P.T.; Matzarakis, A. The Effect of Air Temperature and Human Thermal Indices on Mortality in Athens, Greece. Theor. Appl. Climatol. 2012, 108, 591–599. [Google Scholar] [CrossRef]
Figure 1. (A) Inset map of Europe highlighting the location of Greece within the continental context. (B) Map of Greece indicating the study cities.
Atmosphere 17 00401 g001
Figure 2. Seasonal distribution of heat- and cold-related event days across the five study cities during 1992–2024. Panel (a) shows the monthly frequency of heat-wave days, while panel (b) shows cold-wave days, identified using the EHF–ECF framework.
Atmosphere 17 00401 g002
Figure 3. City-specific relationships between thermal exposure metrics and daily mortality during heat and cold events. The x-axis represents the magnitude of the corresponding exposure metric (°C for Tmean, AT, and WCI; and °C2 for EHF0–7 and ECF0–14).
Atmosphere 17 00401 g003
Figure 4. Frequency of heat and cold events by severity category (H1–H4 for heat, C1–C4 for cold, including lower-severity events) across the five study cities. Bars represent the number of events identified in each category, highlighting differences in thermal event climatology between cities.
Atmosphere 17 00401 g004
Figure 5. Distribution of mean daily mortality ratios associated with heat and cold event severity categories across the five study cities. Boxplots illustrate the variability and magnitude of mortality responses within each severity class, emphasizing the non-linear relationship between event severity and health impact.
Atmosphere 17 00401 g005
Table 1. Summary of heat- and cold-event characteristics across the five study cities, including the number of events, mean and maximum mortality ratios (MR), and mean cumulative exposure intensity (EHF for heat and ECF for cold).
CityHeat Events (n)Mean Heat MRMax Heat MRMean EHFCold Events (n)Mean Cold MRMax Cold MRMean ECF
Athens571.332.4321.731141.161.8135.02
Thessaloniki531.342.8011.722091.162.0044.36
Patra551.342.5013.99621.423.0030.11
Larissa431.694.0022.14841.203.0034.59
Heraklion191.432.6718.81161.232.3333.60
Disclaimer/Publisher’s Note: The statements, opinions and data contained in all publications are solely those of the individual author(s) and contributor(s) and not of MDPI and/or the editor(s). MDPI and/or the editor(s) disclaim responsibility for any injury to people or property resulting from any ideas, methods, instructions or products referred to in the content.