Research on the Impact of PM2.5 Pollution and Climate Change on Respiratory Diseases in Chinese Children Based on XGBoost-SHAP


Abstract
1. Introduction
2. Data and Methods
2.1. Research Data
2.2. Research Methods
2.2.1. XGBoost Model Construction
2.2.2. SHAP Explainability Analysis Framework
3. Results and Discussion
3.1. Model Performance Evaluation
3.2. Results Analysis and Discussion
3.2.1. Full Sample SHAP Analysis
3.2.2. Urban-Rural Stratified Analysis of SHAP
3.2.3. Hierarchical SHAP Analysis of Clustering Clusters
3.2.4. Analysis of the Typical Case SHAP Waterfall Diagram
4. Conclusions
Author Contributions
Funding
Institutional Review Board Statement
Informed Consent Statement
Data Availability Statement
Conflicts of Interest
References
- World Health Organization. WHO Global Air Quality Guidelines: Particulate Matter (PM2.5 and PM10), Ozone, Nitrogen Dioxide, Sulfur Dioxide and Carbon Monoxide; World Health Organization: Geneva, Switzerland, 2021. [Google Scholar]
- World Health Organization. 9 Out of 10 People Worldwide Breathe Polluted Air, but More Countries Are Taking Action (News Release); World Health Organization: Geneva, Switzerland, 2018. [Google Scholar]
- IARC Working Group on the Evaluation of Carcinogenic Risks to Humans. Outdoor Air Pollution. IARC Monogr. Eval. Carcinog. Risks Hum. 2016, 109, 9–444. [Google Scholar] [PubMed] [PubMed Central]
- Li, Y.R.; Xiao, C.C.; Li, J.; Tang, J.; Geng, X.Y.; Cui, L.J.; Zhai, J.X. Association between air pollution and upper respiratory tract infection in hospital outpatients aged 0–14 years in Hefei, China: A time series study. Public Health 2018, 156, 92–100. [Google Scholar] [CrossRef] [PubMed]
- Zhu, L.; Ge, X.; Chen, Y.; Zeng, X.; Pan, W.; Zhang, X.; Ben, S.; Yuan, Q.; Xin, J.; Shao, W.; et al. Short-term effects of ambient air pollution and childhood lower respiratory diseases. Sci. Rep. 2017, 7, 4414. [Google Scholar] [CrossRef] [PubMed] [PubMed Central]
- MacIntyre, E.A.; Gehring, U.; Mölter, A.; Fuertes, E.; Klümper, C.; Krämer, U.; Quass, U.; Hoffmann, B.; Gascon, M.; Brunekreef, B.; et al. Air pollution and respiratory infections during early childhood: An analysis of 10 European birth cohorts within the ESCAPE Project. Environ. Health Perspect. 2014, 122, 107–113, Erratum in Environ. Health Perspect. 2014, 122, 112. [Google Scholar] [CrossRef] [PubMed] [PubMed Central]
- Feng, S.; Huang, F.; Zhang, Y.; Feng, Y.; Zhang, Y.; Cao, Y.; Wang, X. The pathophysiological and molecular mechanisms of atmospheric PM2.5 affecting cardiovascular health: A review. Ecotoxicol. Environ. Saf. 2023, 249, 114444. [Google Scholar] [CrossRef] [PubMed]
- Sofia, C.; Parkin, J.G.H.; Bell, J.A.; Dean, L.S.N.; Edgeway, L.J.; Sayer, L.; Easton, N.H.C.; Davies, D.E.; Marshall, B.G.; Holgate, S.T.; et al. Air pollution and alveolar health. Eur. Respir. Rev. 2025, 34, 240280. [Google Scholar] [CrossRef] [PubMed] [PubMed Central]
- Health Effects Institute (HEI). State of Global Air 2024: Special Report; Based on GBD 2021 Data from IHME; Health Effects Institute: Boston, MA, USA, 2024. [Google Scholar]
- Gudziunaite, S.; Mackintosh, K.A.; Davies, G.A.; Jordan, K.A.; Lewis, P.D.; Griffiths, C.J.; Alexander Swain, T.; McNarry, M.A. Global Trends in the Relationship Between Chronic Air Pollution Exposure, Physical Activity and Lung Function in Youth Aged 5–18 Years with and Without Asthma: A Systematic Review. Sports Med. Open 2025, 11, 57. [Google Scholar] [CrossRef] [PubMed] [PubMed Central]
- Schwartz, J. Air pollution and children’s health. Pediatrics 2004, 113, 1037–1043. [Google Scholar] [CrossRef] [PubMed]
- Aithal, S.S.; Sachdeva, I.; Kurmi, O.P. Air quality and respiratory health in children. Breathe 2023, 19, 230040. [Google Scholar] [CrossRef] [PubMed] [PubMed Central]
- Tsai, Y.G.; Wang, J.Y.; Yang, K.D.; Yang, H.Y.; Yeh, Y.P.; Chang, Y.J.; Lee, J.H.; Wang, S.L.; Huang, S.K.; Chan, C.C. Long-term PM2.5 exposure impairs lung growth and increases airway inflammation in Taiwanese school children. ERJ Open Res. 2025, 11, 00972–2024. [Google Scholar] [CrossRef] [PubMed] [PubMed Central]
- World Meteorological Organization (WMO). Air Quality and Climate Bulletin No. 3, September 2023; WMO: Geneva, Switzerland, 2023; Available online: https://library.wmo.int/records/item/62090-no-3-september-2023 (accessed on 15 March 2026).
- Wu, J.; Zhong, T.; Zhu, Y.; Ge, D.; Lin, X.; Li, Q. Effects of particulate matter (PM) on childhood asthma exacerbation and control in Xiamen, China. BMC Pediatr. 2019, 19, 194. [Google Scholar] [CrossRef] [PubMed] [PubMed Central]
- Zhou, X.; Guo, M.; Li, Z.; Yu, X.; Huang, G.; Li, Z.; Zhang, X.; Liu, L. Associations between air pollutant and pneumonia and asthma requiring hospitalization among children aged under 5 years in Ningbo, 2015–2017. Front. Public Health 2023, 10, 1017105. [Google Scholar] [CrossRef] [PubMed] [PubMed Central]
- Silver, B.; Reddington, C.L.; Chen, Y.; Arnold, S.R. A decade of China’s air quality monitoring data suggests health impacts are no longer declining. Environ. Int. 2025, 197, 109318. [Google Scholar] [CrossRef] [PubMed]
- Analitis, A.; Michelozzi, P.; D’Ippoliti, D.; De’Donato, F.; Menne, B.; Matthies, F.; Atkinson, R.W.; Iñiguez, C.; Basagaña, X.; Schneider, A.; et al. Effects of heat waves on mortality: Effect modification and confounding by air pollutants. Epidemiology 2014, 25, 15–22. [Google Scholar] [CrossRef] [PubMed]
- Shah, S.H.; Ragavan, M.I. Climate Change, Extreme Weather Events, and Child Health: A Call to Action. Pediatrics 2024, 154, e2024067391. [Google Scholar] [CrossRef] [PubMed] [PubMed Central]
- Zhang, Q.; Meng, X.; Shi, S.; Kan, L.; Chen, R.; Kan, H. Overview of particulate air pollution and human health in China: Evidence, challenges, and opportunities. Innovation 2022, 3, 100312. [Google Scholar] [CrossRef] [PubMed] [PubMed Central]
- Sheridan, R.P.; Wang, W.M.; Liaw, A.; Ma, J.; Gifford, E.M. Extreme Gradient Boosting as a Method for Quantitative Structure-Activity Relationships. J. Chem. Inf. Model. 2016, 56, 2353–2360, Erratum in J. Chem. Inf. Model. 2020, 60, 1910. https://doi.org/10.1021/acs.jcim.0c00029. [Google Scholar] [CrossRef] [PubMed]
- Rajesh, M.; Babu, R.G.; Moorthy, U.; Easwaramoorthy, S.V. Machine learningdriven framework for realtime air quality assessment and predictive environmental health risk mapping. Sci. Rep. 2025, 15, 28801. [Google Scholar] [CrossRef] [PubMed] [PubMed Central]
- Yasin, K.H.; Yasin, M.I.; Iguala, A.D.; Gelete, T.B.; Tulu, D.; Kebede, E. Predictive machine learning and geospatial modeling reveal PM10 hotspots and guide targeted air pollution interventions in Addis Ababa, Ethiopia. Discov. Appl. Sci. 2025, 7, 263. [Google Scholar] [CrossRef]
- Shi, H.; Shen, Y.; Li, L. Early prediction of acute kidney injury in patients with gastrointestinal bleeding admitted to the intensive care unit based on extreme gradient boosting. Front. Med. 2023, 10, 1221602. [Google Scholar] [CrossRef] [PubMed] [PubMed Central]
- Baker, M.J.; Gordon, J.; Thiruvarudchelvan, A.; Yates, D.; Donald, W.A. Rapid, non-invasive breath analysis for enhancing detection of silicosis using mass spectrometry and interpretable machine learning. J. Breath Res. 2025, 19, 026011. [Google Scholar] [CrossRef] [PubMed]
- Zhang, C.; Liu, L. Machine learning prediction model for medical environment comfort based on SHAP and LIME interpretability analysis. Sci. Rep. 2025, 15, 39269. [Google Scholar] [CrossRef] [PubMed] [PubMed Central]
- Liu, B.; Zheng, N.; Liu, J.; Li, F.P.; Zhang, J. Risk prediction and interpretability analysis for left atrial thrombus or spontaneous echo contrast in patients with non-valvular atrial fibrillation based on XGBoost and SHAP. Chin. J. Cardiovasc. Med. 2025, 30, 530–536. [Google Scholar] [CrossRef]
- Yi, F.; Yang, H.; Chen, D.; Qin, Y.; Han, H.; Cui, J.; Bai, W.; Ma, Y.; Zhang, R.; Yu, H. XGBoost-SHAP-based interpretable diagnostic framework for Alzheimer’s disease. BMC Med. Inform. Decis. Mak. 2023, 23, 137. [Google Scholar] [CrossRef] [PubMed] [PubMed Central]
- Rackow, B.; König, H.H.; Wall, M.; Konnopka, C. The interaction between air pollution, weather conditions, and health risks: A systematic review. Sci. Total Environ. 2025, 996, 180080. [Google Scholar] [CrossRef] [PubMed]
- Barnett-Itzhaki, Z.; Nir, V.; Kellner, A.; Biton, O.; Toledano, S.; Klein, A. Machine Learning Models for Predicting Pediatric Hospitalizations Due to Air Pollution and Humidity: A Retrospective Study. Pediatr. Pulmonol. 2025, 60, e71106. [Google Scholar] [CrossRef] [PubMed] [PubMed Central]
- Niu, Z.; Chen, T.; Zhang, L.; Zhang, X.; Lu, C.; Wang, T.; Zheng, X.; Norback, D.; Wang, J.; Xu, Y.; et al. Exposure to outdoor humid-heat and indoor dampness-mold during infancy is associated with increased childhood asthma risk: A large-scale multi-city study in Chinese preschool children. Sustain. Cities Soc. 2025, 118, 106061. [Google Scholar] [CrossRef]
- Lin, W.W.; Chen, Z.X.; Kong, M.L.; Xie, Y.Q.; Zeng, X.W. Air Pollution and Children’s Health in Chinese. Adv. Exp. Med. Biol. 2017, 1017, 153–180. [Google Scholar] [CrossRef] [PubMed]
- Lin, H.; Wang, X.; Liu, T.; Li, X.; Xiao, J.; Zeng, W.; Ma, W. Air Pollution and Mortality in China. Adv. Exp. Med. Biol. 2017, 1017, 103–121. [Google Scholar] [CrossRef] [PubMed]
- Xie, X.F.; Xu, H.; Wu, J.L.; Guo, B.; Xiao, X.; Zhou, J.M.; Yang, S.J.; Zhao, X. Causal inference methods and its application in the study of health effects of air pollution. Zhonghua Yu Fang Yi Xue Za Zhi 2021, 55, 1364–1370. (In Chinese) [Google Scholar] [CrossRef] [PubMed]
- Gao, A.; You, X.; Li, Z.; Liao, C.; Yin, Z.; Zhang, B.; Zhang, H. Health effects associated with ozone in China: A systematic review. Environ. Pollut. 2025, 367, 125642. [Google Scholar] [CrossRef] [PubMed]
- Sun, H.Z.; Zhao, J.; Liu, X.; Qiu, M.; Shen, H.; Guillas, S.; Giorio, C.; Staniaszek, Z.; Yu, P.; Wan, M.W.L.; et al. Antagonism between ambient ozone increase and urbanization-oriented population migration on Chinese cardiopulmonary mortality. Innovation 2023, 4, 100517. [Google Scholar] [CrossRef] [PubMed] [PubMed Central]
- Chen, T.; Guestrin, C. XGBoost: A Scalable Tree Boosting System. In Proceedings of the KDD ‘16: Proceedings of the 22nd ACM SIGKDD International Conference on Knowledge Discovery and Data Mining; ACM: New York, NY, USA, 2016. [Google Scholar] [CrossRef]
- Friedman, J.H. Greedy Function Approximation: A Gradient Boosting Machine. Ann. Stat. 2001, 29, 1189–1232. [Google Scholar] [CrossRef]
- Lundberg, S.M.; Erion, G.G.; Lee, S.I. Consistent Individualized Feature Attribution for Tree Ensembles. arXiv 2018, arXiv:1802.03888. [Google Scholar] [CrossRef]
- Lundberg, S.M.; Erion, G.; Chen, H.; DeGrave, A.; Prutkin, J.M.; Nair, B.; Katz, R.; Himmelfarb, J.; Bansal, N.; Lee, S.-I. From local explanations to global understanding with explainable AI for trees. Nat. Mach. Intell. 2020, 2, 56–67. [Google Scholar] [CrossRef]
- Lundberg, S.M.; Lee, S.-I. A Unified Approach to Interpreting Model Predictions. Adv. Neural Inf. Process. Syst. 2017, 30. Available online: https://proceedings.neurips.cc/paper/2017/hash/8a20a8621978632d76c43dfd28b67767-Abstract.html (accessed on 8 March 2026).



| Variables | Variable Description | Number of Disease Cases/Total (%) |
|---|---|---|
| Total | Total sample size | 12,492/20,241 (61.7) |
| Demographic characteristics | ||
| Age (years) | Continuous variable (mean ± standard deviation) | - |
| 0–6 years old | Pre-school age | 5192/7406 (70.1) |
| 6–12 years old | School age | 5267/8885 (59.3) |
| 12–16 years old | Adolescence | 2031/3950 (51.4) |
| Gender (1) | Binary classification | - |
| Residence (urban = 1) | Binary classification | 5785/9214 (62.8) |
| Residence (rural = 0) | Binary classification | 6707/11,027 (60.8) |
| Parental behavioral factors | ||
| Parents smoke (is = 1) | Smoking in the past month | - |
| Cooking fuel (solid = 1) | Use solid fuel | - |
| Model | Area Under Curve (AUC) Mean | Standard Deviation of AUC | F1 Mean | Standard Deviation of F1 | Brier Mean | Brier Standard Deviation |
|---|---|---|---|---|---|---|
| XGBoost overall | 0.6765 | 0.0110 | 0.7541 | 0.0056 | 0.2153 | 0.0022 |
| XGBoost Urban | 0.6576 | 0.0132 | 0.7553 | 0.0056 | 0.2177 | 0.0033 |
| XGBoost Rural | 0.6864 | 0.0063 | 0.7508 | 0.0051 | 0.2142 | 0.0019 |
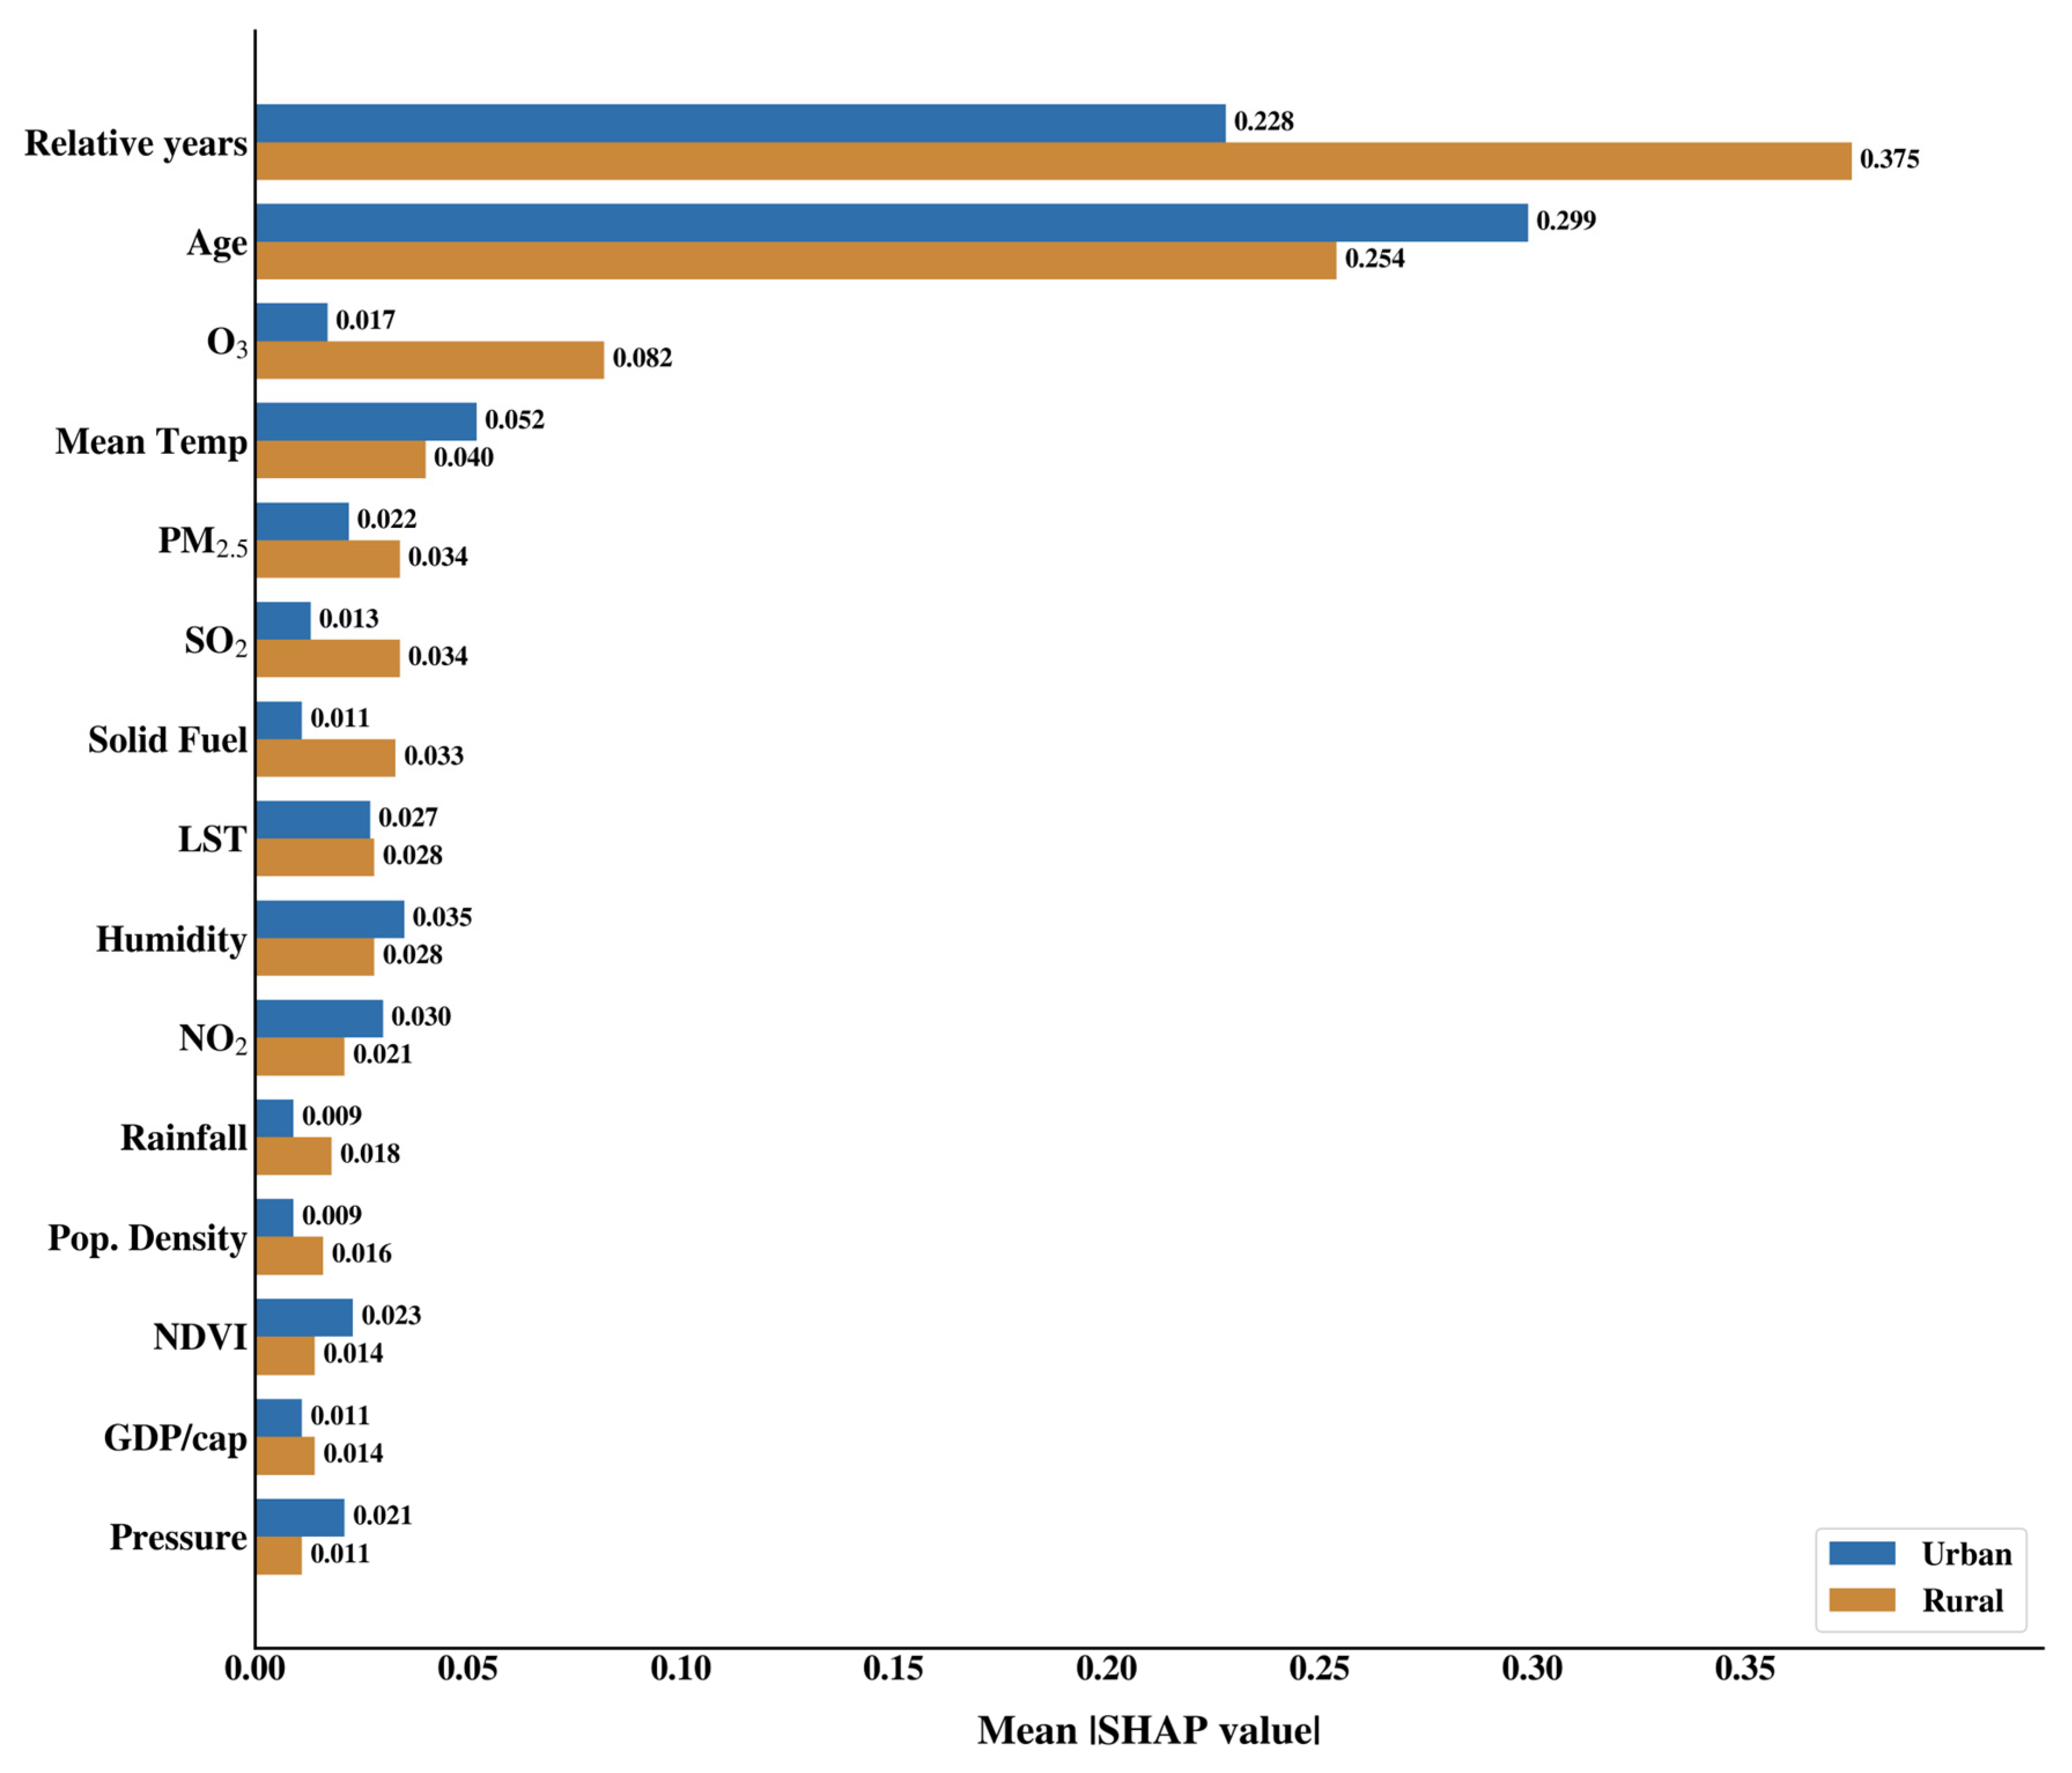
| Numbers | Urban Sub-Model | Rural Sub-Model | Main Differences | ||||
|---|---|---|---|---|---|---|---|
| Features | |SHAP| | Position | Feature | |SHAP| | Position | ||
| 1 | Relative years | - | 1 | Relative Years | - | 1 | 1 on both sides, showing the universality of the time trend |
| 2 | Age | 0.314 | 2 | Age | 0.271 | 2 | The urban age effect is slightly stronger |
| 3 | O3 | 0.054 | 5 | O3 | high | 3 | Rural O3 ranks higher (protection direction) |
| 4 | Average monthly temperature | 0.078 | 4 | Average monthly temperature | 0.083 | 4 | The temperature effect is similar between urban and rural areas |
| 5 | Relative humidity | 0.056 | 8 | PM2.5 | 0.085 | 5 | PM2.5 Rural > Urban (1.68 times) |
| 6 | Normalized Difference Vegetation Index (NDVI) | 0.058 | 3 | SO2 | 0.073 | 6 | SO2 sources in rural areas are associated with coal burning |
| 7 | PM2.5 | 0.051 | 7 | Solid fuel | 0.049 | 7 | Rural indoor fuel exposure is prominent |
| 8 | Land Surface Temperature (LST) | 0.052 | 6 | LST | 0.082 | 8 | Heat exposure is stronger in rural areas |
| 9 | NO2 | 0.049 | 9 | Relative humidity | 0.078 | 9 | |
| 10 | Carbon emissions | 0.045 | 11 | NO2 | 0.085 | 10 | |
| 11 | SO2 | 0.044 | 10 | Rainfall | 0.092 | 11 | The protective effect of rainfall is more pronounced in rural areas |
| 12 | Parents smoke | 0.044 | 13 | Population density | 0.024 | 12 | |
| 13 | Defense Meteorological Satellite Program–Operational Linescan System (DMSP-OLS) | 0.038 | 15 | NDVI | 0.056 | 13 | |
| 14 | Railway density | 0.034 | 14 | Per capita GDP | 0.058 | 14 | |
| 15 | Gender | 0.033 | 16 | Air pressure | 0.023 | 15 | |
| Serial Numbers | Cluster I High Temperature and High Humidity | Cluster II Megacities | Cluster III High PM2.5 | Cluster IV Warm Low Town | Cluster V Low-Temperature Rural Areas | Cross-Cluster Patterns |
|---|---|---|---|---|---|---|
| 1 | Age | Age | Age | Age | Age | Five clusters consistent: age is the primary risk factor |
| 2 | Relative years | Relative Years | Relative Years | Relative Years | Relative Years | Time trends rank second |
| 3 | Monthly average temperature | NO2 | PM2.5 | SO2 | Average monthly temperature | The differentiated environmental driving factors of each cluster have emerged |
| 4 | O3 | PM2.5 | SO2 | NDVI | LST | Cities/high pollution clusters are dominated by pollutants |
| 5 | Rainfall | Carbon emissions | NO2 | PM2.5 | Rainfall | PM2.5 ranking: 3rd in Cluster III and 5th in Cluster I |
Disclaimer/Publisher’s Note: The statements, opinions and data contained in all publications are solely those of the individual author(s) and contributor(s) and not of MDPI and/or the editor(s). MDPI and/or the editor(s) disclaim responsibility for any injury to people or property resulting from any ideas, methods, instructions or products referred to in the content. |
© 2026 by the authors. Licensee MDPI, Basel, Switzerland. This article is an open access article distributed under the terms and conditions of the Creative Commons Attribution (CC BY) license.
Share and Cite
Wang, D.; Dai, X.; Zhou, L. Research on the Impact of PM2.5 Pollution and Climate Change on Respiratory Diseases in Chinese Children Based on XGBoost-SHAP. Atmosphere 2026, 17, 391. https://doi.org/10.3390/atmos17040391
Wang D, Dai X, Zhou L. Research on the Impact of PM2.5 Pollution and Climate Change on Respiratory Diseases in Chinese Children Based on XGBoost-SHAP. Atmosphere. 2026; 17(4):391. https://doi.org/10.3390/atmos17040391
Chicago/Turabian StyleWang, Donger, Xiaoyan Dai, and Liguo Zhou. 2026. "Research on the Impact of PM2.5 Pollution and Climate Change on Respiratory Diseases in Chinese Children Based on XGBoost-SHAP" Atmosphere 17, no. 4: 391. https://doi.org/10.3390/atmos17040391
APA StyleWang, D., Dai, X., & Zhou, L. (2026). Research on the Impact of PM2.5 Pollution and Climate Change on Respiratory Diseases in Chinese Children Based on XGBoost-SHAP. Atmosphere, 17(4), 391. https://doi.org/10.3390/atmos17040391