1. Introduction
Buildings account for a significant portion of global energy consumption, with Heating, Ventilation, and Air Conditioning (HVAC) systems being the primary energy consumers [
1]. The main objective of the HVAC systems is to provide indoor thermal comfort for occupants [
2,
3]. According to the American Society of Heating Refrigeration and Air Conditioning Engineers (ASHRAE), thermal comfort is defined as the condition of mind that expresses satisfaction with the thermal environment [
4]. Achieving thermal comfort is essential not only for occupants’ well-being but also for maintaining high productivity in office environments and educational buildings [
5,
6].
Thermal comfort has been evaluated using conventional models, most notably Fanger’s Predicted Mean Vote (PMV)/Predicted Percentage of Dissatisfied (PPD) model [
7]. Conventional models calculate thermal comfort based on physics and physiology, relying heavily on environmental factors (air temperature, mean radiant temperature, air speed, and relative humidity) and personal factors (metabolic rate and basic clothing insulation) [
7]. However, because these models are static, they often fail to reflect real-world conditions accurately. To address this, the Adaptive Thermal Comfort (ATC) model was developed by the researchers [
8,
9]. This model suggests that occupants are not passive recipients of their environment; instead, they actively adapt to it through behavioral, physiological, and psychological adjustments [
8,
9].
While environmental and physiological parameters are widely studied, the psychological dimension of the adaptive comfort model is frequently overlooked. Human perception of temperature is not only a physical reaction, but it is deeply influenced by mental states, stress levels, and emotional well-being [
10,
11]. For instance, Rohles (2007) [
12] has highlighted the connection between human psychology and thermal preference. The research demonstrated that participants who were explicitly informed about an active heater in the room reported feeling significantly warmer than those exposed to the same heat without their knowledge. This clearly illustrates that mental awareness and state of mind may directly change thermal perception [
12].
Several studies have utilized self-report psychological questionnaires, such as the Profile of Mood States (POMS) [
13] and the Positive and Negative Affect Schedule (PANAS) [
14], to evaluate mood variations. These studies demonstrate that negative emotions or high stress levels can significantly alter a person’s thermal perception, meaning people in different moods require different temperature settings to feel thermally comfortable. For instance, Ibrahim et al. [
15] utilized virtual environments and the PANAS-X questionnaire to specifically investigate how these emotional states influence thermal evaluations. Their findings revealed that negative moods, particularly anger, significantly heightened the participants’ perception of warmth. Conversely, positive emotional states, such as happiness, resulted in more accurate and neutral thermal assessments [
15]. In another study, Lin and Zhang [
16] investigated the effects of broader psychological factors, including depression and stress, utilizing the Patient Health Questionnaire, Perceived Stress Questionnaire, and PANAS. Their results indicated that individuals experiencing stress exhibit heightened sensitivity to warmth, frequently reporting higher Thermal Sensation Votes (TSV) than conventional PMV calculations would suggest. Conversely, participants in a depressed state demonstrated reduced temperature sensitivity, tolerating a notably wider thermal range [
16].
Recent studies have further dissected emotional states in detail to understand their granular impacts by also using the POMS questionnaire. Özbey and Turhan [
17] explored the influence of specific mood subscales on thermal sensation of the occupants. The result revealed that vigor (VIG) was the most influential parameter, whereas confusion (CON) and fatigue (FAT) negatively affected thermal sensation, making individuals feel cooler [
17]. Expanding on the complexity of these interactions, Özbey et al. [
18] conducted a mediation analysis using Hayes’ PROCESS tool to evaluate how these mood subscales interact. Their findings revealed significant gender-specific nuances in thermal perception: confusion partially mediated the effect of depression on the PMV-TSV discrepancy in males (accounting for 38.44% of the total effect), while it mediated the effect of vigor in females (8.92%) [
18]. This result underscores the intricate and individualized nature of psychological impacts on thermal comfort.
Recognizing the systematic discrepancies caused by these emotional variations, researchers have begun attempting to adjust traditional models. For instance, Turhan et al. [
19] proposed a novel Mood State Correction Factor (MSCF) (a.k.a. Turhan and Özbey coefficients) to quantify and correct mood-related deviations in thermal sensation predictions. By applying an MSCF of −0.125 for pessimistic states and +0.114 for optimistic conditions on a conventional seven-point scale in the PMV model, their approach enabled the calibration of PMV outcomes according to mood changes. To further validate and analytically support this correction factor, subsequent research modeled the MSCF using a data mining algorithm known as Multivariate Adaptive Regression Splines (MARS) [
20]. In this advanced approach, mood state was explicitly integrated as a primary thermal sensation parameter alongside conventional environmental variables. When comparing the MARS analytical model with the initial black-box model and the results demonstrated remarkable consistency. The algorithm achieved high accuracy, with correlation coefficients (r) exceeding 0.94 for both the training and testing phases. This robust validation confirms that psychological states can be reliably quantified and analytically integrated into predictive thermal comfort models [
20].
When the HVAC systems ignore these psychological variations, occupants frequently experience thermal dissatisfaction, even if the indoor environment meets standard physical requirements. This dissatisfaction often produces energy-wasting behaviors, such as the use of personal space heaters, desk fans, or the frequent manual overriding of thermostats to extremely high or low temperatures [
21,
22,
23]. Consequently, the HVAC systems operate inefficiently, leading to substantial energy waste. In the context of global climate change, the energy consumed by commercial buildings is a major contributor to greenhouse gas emissions. Therefore, minimizing this unnecessary energy consumption is crucial for decarbonizing the building sector. Recognizing the psychological factors of thermal comfort is no longer just a matter of occupant well-being; it has become a necessary strategy for reducing carbon footprints and achieving sustainable building operations.
Despite the clear connection between psychology, thermal comfort, and energy efficiency, there remains a critical gap in modern building operations. Current intelligent building management and the HVAC control systems are fundamentally ignoring human psychology and current mood state. While recent advancements have integrated Internet of Things (IoT) devices and occupancy sensors, they continue to rely almost exclusively on physical, environmental, and basic physiological data. They do not yet consider capturing and responding to the dynamic, real-time mood variations in the occupants.
The primary novelty of this study lies in addressing this exact limitation by transitioning from a static and environment-focused control approach to a more human-centered system. To the best of our knowledge, no existing HVAC control mechanism actively translates real-time psychological feedback into automated temperature adjustments using a multi-modal approach. Furthermore, while many adaptive comfort studies rely primarily on computer simulations to estimate energy savings, this research stands out by physically measuring the actual impact of a mood-adaptive control system on energy consumption and CO2 reduction in a real-world operational setting.
To bridge this gap, this study introduces a next-generation, mood-adaptive behavioral modeling approach for the HVAC control systems. This research also proposes a novel control system that integrates real-time psychological feedback to dynamically adjust the HVAC setpoints. By utilizing a dual artificial intelligence system, comprising a Convolutional Neural Network (CNN) for facial expression analysis and an Artificial Neural Network (ANN) for processing facial temperatures via thermal imaging, the system accurately predicts the current mood state of the occupant. Transmitted through a custom-designed wearable necklace, this personalized data allows the HVAC system to operate more intelligently. Ultimately, this human-centered approach aims to optimize perceived thermal comfort while effectively reducing energy consumption and carbon (CO2) emissions in office buildings.
2. Materials and Methods
This section introduces a novel control system that takes psychological factors into account for control settings of the HVAC systems.
2.1. Case Building
The experiments were conducted in Ankara, Türkiye, which is a region characterized by a Csb climate under the Köppen–Geiger climate classification [
24]. Climatological data for this location indicate that the minimum average temperature occurs in January at 0.9 °C, while the maximum average temperature peaks in August at 24.3 °C [
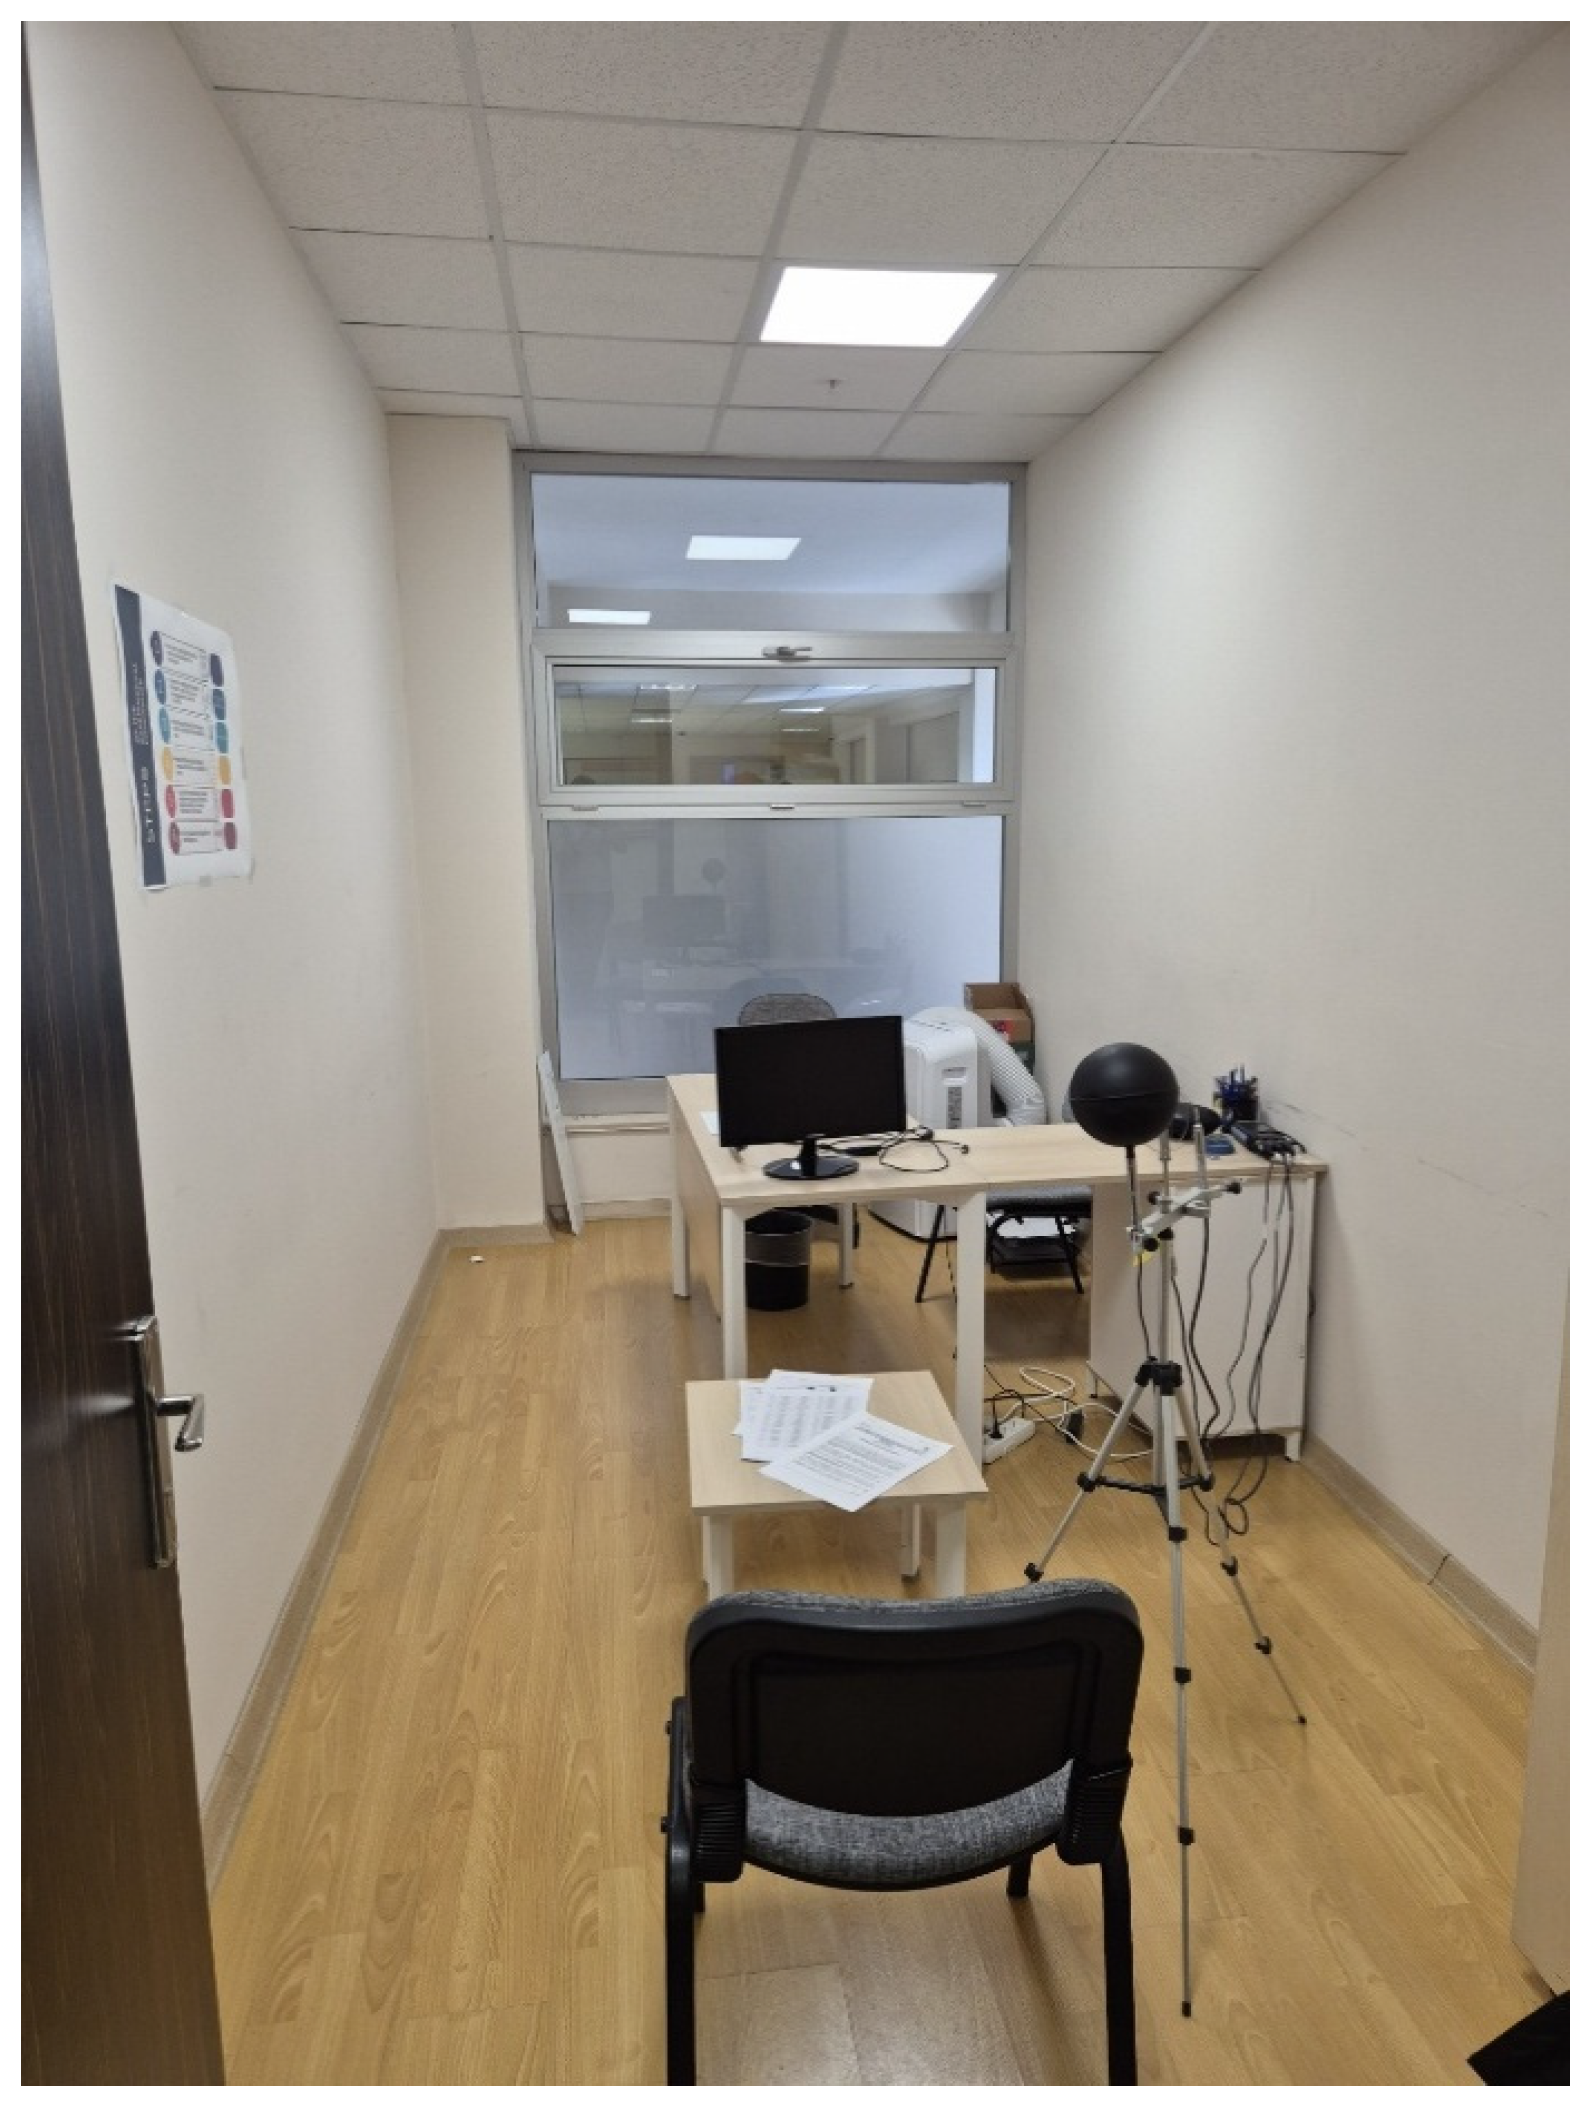
25]. The physical experiments were carried out in a specially designed experimental chamber constructed as a rectangular room with dimensions of 4.90 m in length, 2.27 m in width, and 3.50 m in height. To ensure highly stable thermal conditions and eliminate external disturbances during the experiments, the floor, ceiling, and walls of the chamber are extensively insulated to minimize any potential heat loss. Notably, the room is entirely situated within the interior of the host building; consequently, all its walls are adiabatic, completely isolating the test environment from direct outdoor weather fluctuations. The layout and physical setup of this experimental room are illustrated in
Figure 1.
2.2. Experimental Setup and Procedure
To ensure the validity of the psychological and physiological assessments, strict criteria were applied during participant recruitment. Individuals who had used antidepressant medications within the past three months were excluded to prevent confounding effects on the Profile of Mood States (POMS) outcomes [
26,
27]. Furthermore, to avoid any substance-induced alterations to the central nervous system, mood, or physiological baselines, participants were required to abstain from caffeine, alcohol, and nicotine for 12 h prior to the session [
28,
29,
30]. Finally, to maintain stable baseline body temperatures, heart rates, and metabolic rates, individuals who had engaged in intense physical activity within the preceding 12 h were also excluded from the study.
Upon arrival, participants underwent a 15 min acclimatization period within the experimental room to stabilize their physiological baselines. During this adaptation phase, general personal information (gender, age, weight and height), and specific garment details to determine basic clothing insulation were collected via survey. Participants also completed an initial Profile of Mood States (POMS) questionnaire and reported their baseline thermal sensation votes (
Appendixes A and B). Since the participants remained seated throughout the experiment, their metabolic rate was assumed to be a standard 1.2 met [
31]. Furthermore, although no active HVAC setpoint adjustments were made during the experiments, the room’s environmental conditions consistently remained within the optimal Predicted Mean Vote (PMV) comfort range of −0.5 to +0.5, ensuring a naturally thermally neutral baseline. This range corresponds to the standard comfort level (Category II/IEQ II) as defined by international standards [
32,
33,
34], ensuring a naturally thermally neutral baseline throughout the study.
Following the adaptation phase, the main experimental session was started as the training of the control logic. A structured mood induction protocol was initiated using standardized video and image stimuli to elicit six distinct emotional states (the selection and validation of these stimuli are detailed in
Section 2.3). Participants watched a total of six video clips evoking six subscales of the POMS questionnaire (Anger (ANG), Confusion (CON), Depression (DEP), Fatigue (FAT), Tension (TEN), Vigor (VIG)), each lasting approximately 5 min, resulting in a cumulative video viewing time of 30 min. Factoring in the initial acclimatization period and the data collection intervals between the visual stimuli, the total experimental duration averaged 55 min per participant. Throughout the visual presentations, participants’ real-time facial expressions were captured using a high-resolution camera integrated with a custom-developed automated recording system to ensure analytical redundancy. Immediately after each 5 min stimulus block, participants reported their thermal sensation votes and completed the POMS questionnaire to provide subjective ratings across the targeted subscales.
The experimental protocol was reviewed and approved by the Atılım University Ethics Committee (Protocol Number: E-59394181-604.01-83833 and Date of Approval: 2 April 2024). Prior to the study, all participants were provided with a detailed briefing regarding the data collection process, including the recording of facial and thermal images for AI model training. Written informed consent was obtained from each participant. To protect privacy, a strict data governance framework was followed: all images were anonymized using non-identifiable ID codes, and raw visual data were stored on an encrypted, offline local server. In alignment with privacy-by-design principles, the proposed real-time inference pipeline does not store raw images; it processes them locally and transmits only aggregated emotional vectors, ensuring that the occupants’ visual identities are never compromised in real-world applications.
To monitor the physical environment, indoor air temperature (T
a), mean radiant temperature (T
r), relative humidity (RH), and air velocity (v
a) were continuously collected at one-minute intervals. Concurrently, to objectively validate physiological reactions to the induced moods, the inner and outer nasal temperatures, as well as the inner and outer tympanic temperatures and forehead temperature, were recorded both prior to the overall session and immediately after the conclusion of each video clip. The technical specifications and accuracies of all well-calibrated measurement instruments utilized in this study are summarized in
Table 1. Finally, to establish a robust dataset for training the Convolutional Neural Network (CNN) and Artificial Neural Network (ANN) models (which are described in detail in
Section 2.6 and
Section 2.7), the outputs from the facial recognition algorithms were cross-validated against both the subjective POMS scores and these objective thermal measurements. It is vital to indicate that the emissivity was set to 0.98, which is the widely accepted standard for human skin [
35].
2.3. Mood Induction and Psychological Assessment
To systematically elicit the target mood states, visual stimuli were carefully curated from three standardized databases: the International Affective Picture System (IAPS), the Geneva Affective Picture Database (GAPED), and the Open Affective Standardized Image Set (OASIS). The selection process relied on established valence (pleasantness) and arousal (activation) ratings to ensure mood clarity and minimize cultural bias [
39]. Specifically, 30 images were selected for each mood category (180 images in total) based on the following strict thresholds: Tension and Anger required low valence (≤3.0) and high arousal (≥6.0) to elicit strong negative and high-activation responses, Depression utilized low valence (≤3.0) and low arousal (≤4.0) to capture sadness and reduced motivational energy, Fatigue was represented by neutral-to-low valence (~4.0–5.0) and low arousal (≤4.0); Confusion involved ambiguous valence (~4.5–5.0) and moderate arousal (4.5–5.5) to induce cognitive disorientation, and Vigor was induced using high valence (≥6.0) and high arousal (≥6.0) to evoke alertness and enthusiasm.
The visual stimuli were presented to the participants as automated slideshows, effectively functioning as continuous 5 min video clips for each mood state. To prevent order effects while standardizing the induction process, the presentation sequence was strictly organized as follows: Confusion, Tension, Depression, Fatigue, Vigor, and Anger. Each 5 min block followed a precise chronological sequence: it commenced with a single fixation dot displayed for 500 ms, followed by a blank gray screen for 1500 ms. Subsequently, the 30 affectively relevant images for the target mood were displayed for 7500 ms each in a randomized order.
Concurrently with the visual presentations, facial responses were continuously monitored in the study. A high-resolution camera system, positioned precisely at the participants’ eye level, was utilized to optimize the capture of expressive features. To ensure comprehensive data collection, recordings commenced 200 ms prior to the onset of fixation and continued until the conclusion of each block.
Following each induction block, psychological assessments were conducted using the standard 65-item Profile of Mood States (POMS) questionnaire. As the experiments were conducted entirely in English, the original English version of the POMS was administered. To validate the success of the mood induction, variations in the total raw scores of the individual subscales, alongside changes in the Total Mood Disturbance (TMD) index, were rigorously evaluated via using Equation (1) [
40].
Raw TMD scores were converted to standardized T
scores using Equation (2) to facilitate consistent evaluations across the entire cohort. By design, this standardization adjusts the dataset to yield a fixed average of 50 alongside a standard deviation of 10 [
41].
Here, n, m, and s correspond to the individual’s raw score, the normative mean, and the standard deviation, respectively. The interpretative categories for these calculated T-scores are presented in
Table 2.
2.4. Mood Recognition and Adaptive HVAC Control Framework
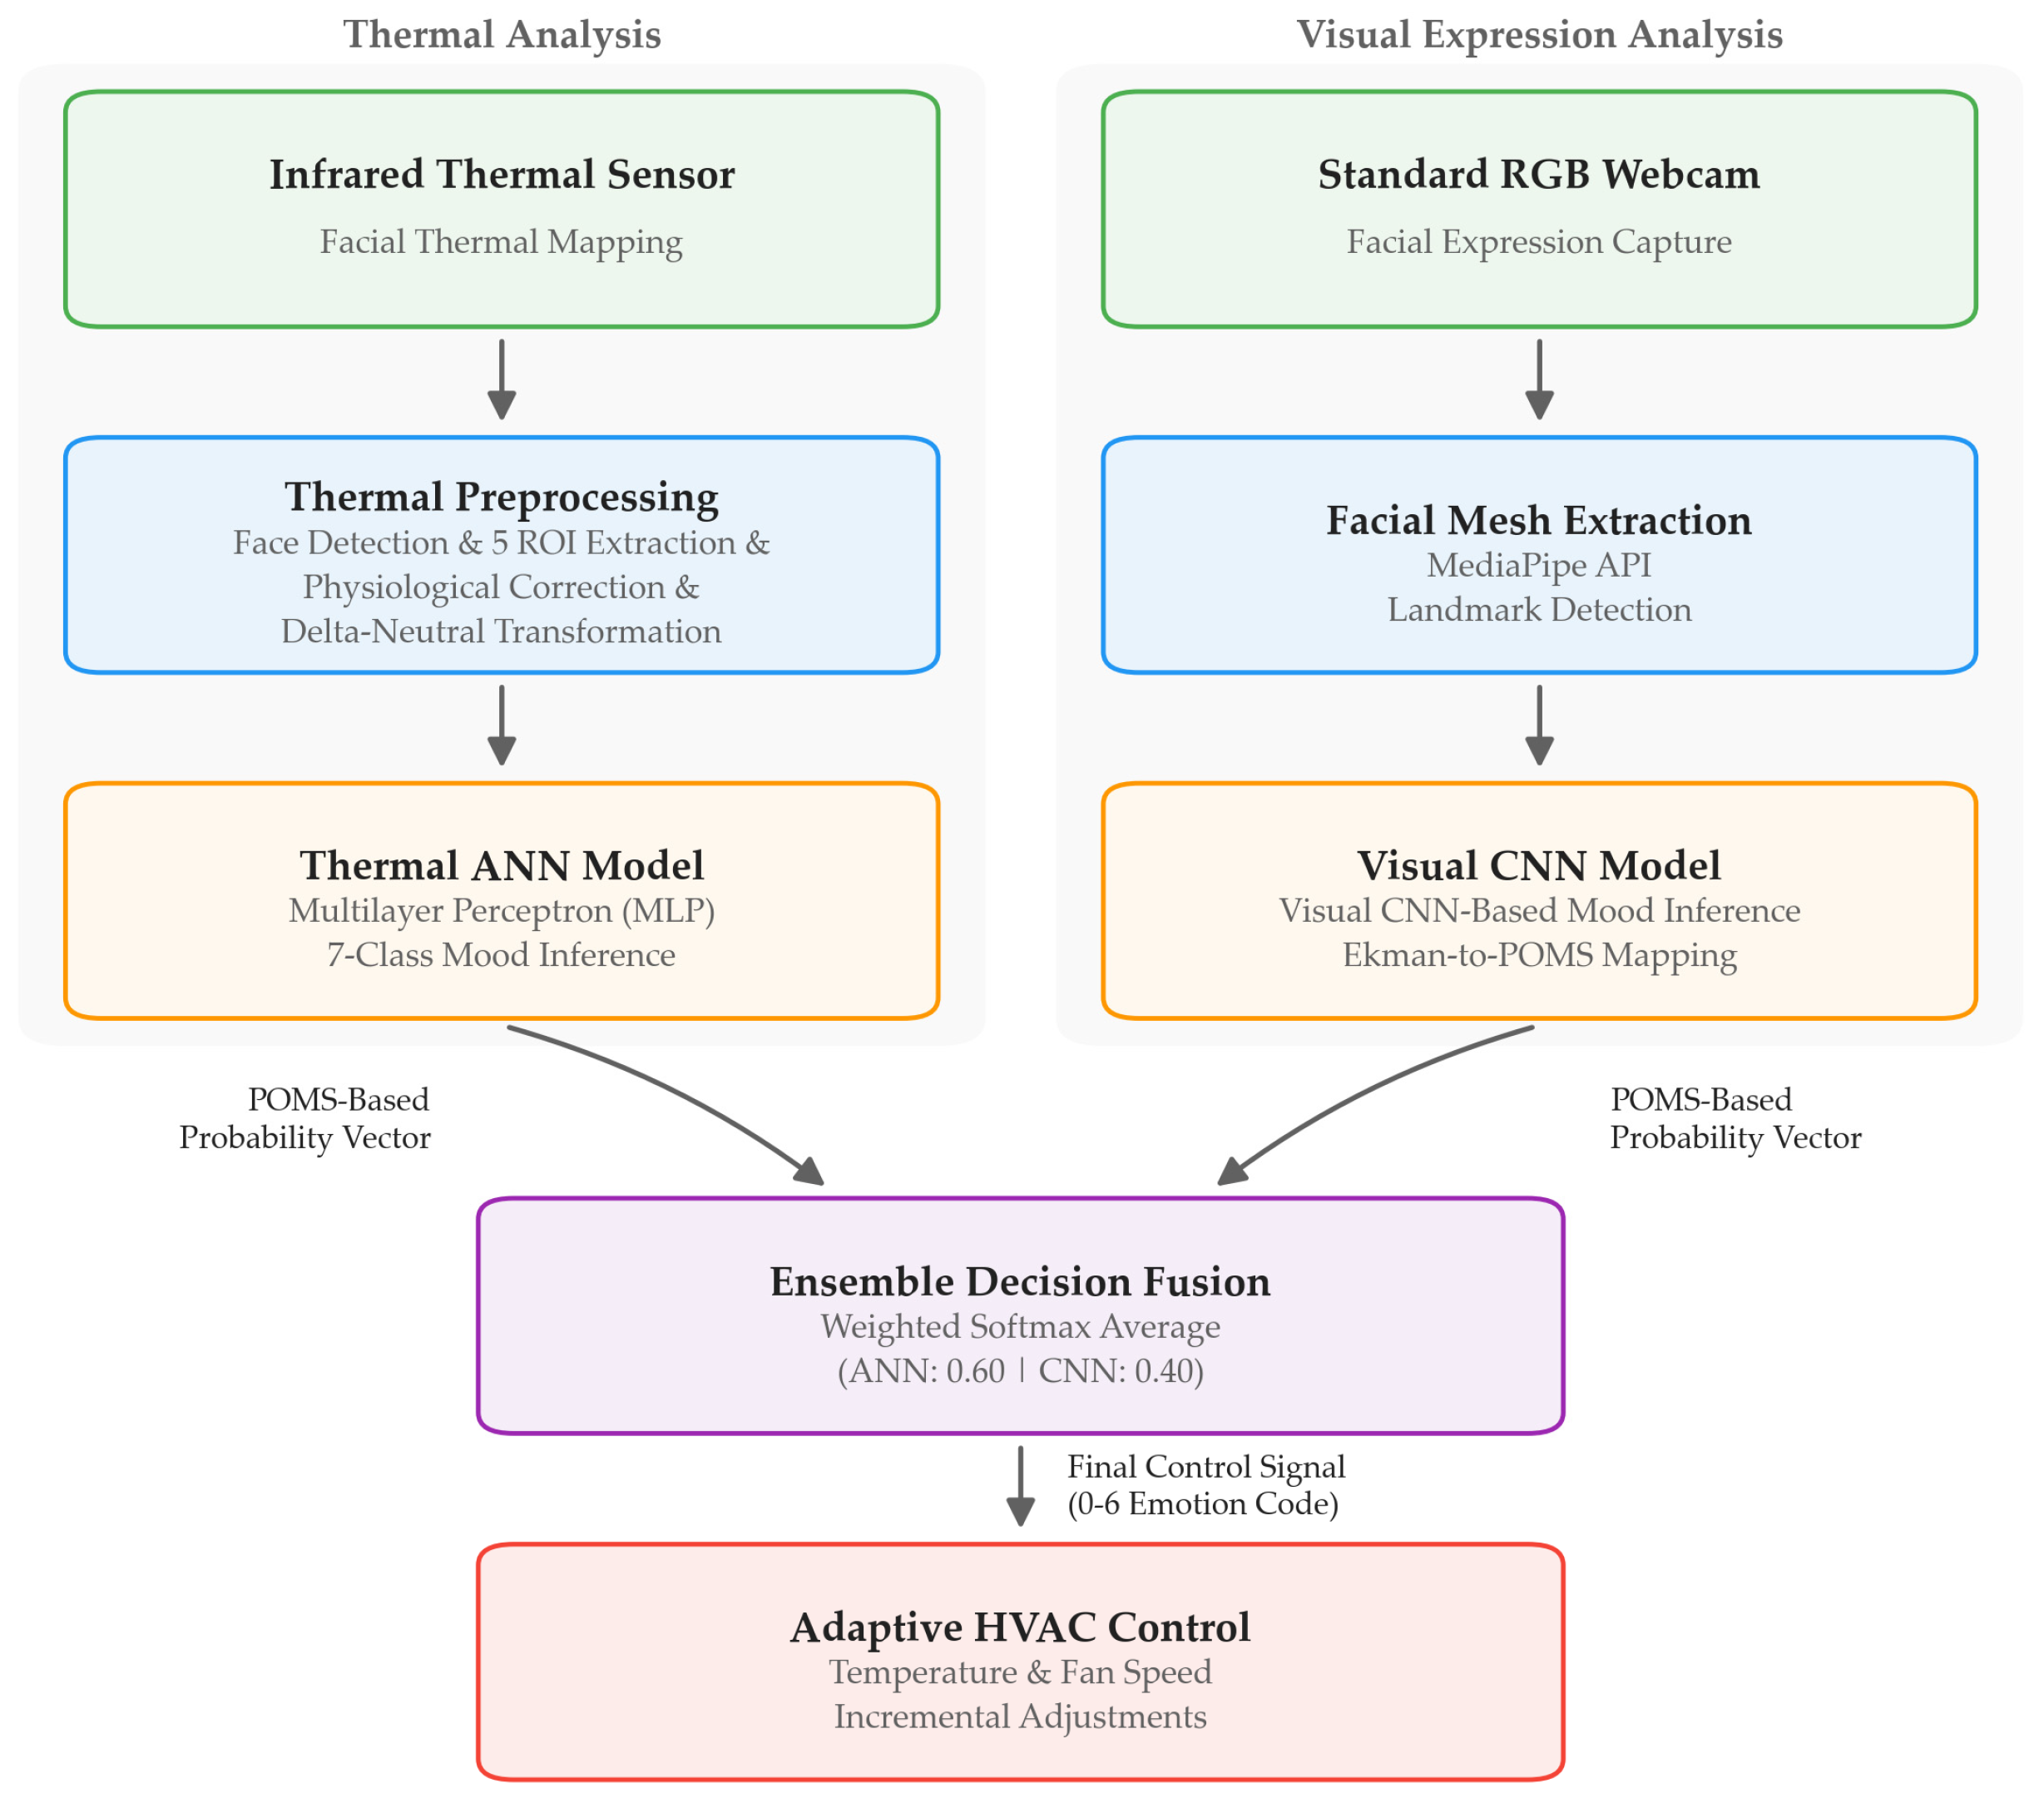
The proposed framework integrates two complementary sensing modalities, namely thermal infrared imaging and visible-spectrum facial expression analysis, to infer occupant mood state and translate it into adaptive HVAC control actions in real time. The overall system architecture is illustrated in
Figure 2. The system architecture comprises five functional stages arranged in a sequential pipeline:
- (i)
Sensing: A low-resolution thermal microbolometer array (Heimann HTPA 80 × 64) continuously captures facial surface temperature distributions, while a standard RGB webcam simultaneously records facial expressions. Both sensors operate in a contactless, non-intrusive manner suitable for continuous occupancy monitoring.
- (ii)
Thermal processing: Thermal frames are processed to detect the facial region, extract five anatomical regions of interest (ROI), apply physiological correction coefficients, and compute delta-neutral temperature features (
Section 2.5).
- (iii)
Dual-model inference: An ANN model classifies thermal feature vectors into seven POMS-based mood state categories (
Section 2.6), and a CNN model independently classifies facial expressions captured by the webcam into the same seven categories via an Ekman-to-POMS mapping (
Section 2.7).
- (iv)
Ensemble fusion: The probability distributions produced by the two models are combined through weighted averaging (ANN: 60%, CNN: 40%) to yield a single mood state prediction with enhanced robustness (
Section 2.8).
- (v)
Adaptive control: The predicted mood state label is transmitted to an ESP32 microcontroller, which issues infrared commands to the HVAC unit, applying bounded incremental temperature adjustments within a user-defined comfort range (
Section 2.9).
Figure 2.
Overall architecture of the proposed mood recognition and adaptive HVAC control framework. Thermal and visual branches are jointly processed through five stages and fused by weighted averaging (ANN: 0.60, CNN: 0.40) to generate the final HVAC control signal.
Figure 2.
Overall architecture of the proposed mood recognition and adaptive HVAC control framework. Thermal and visual branches are jointly processed through five stages and fused by weighted averaging (ANN: 0.60, CNN: 0.40) to generate the final HVAC control signal.
It is significant to note that the final mood classification is achieved through a weighted ensemble fusion of the ANN and CNN probability distributions. To maximize the robustness of the system against potential input volatility, a weighted averaging scheme was implemented, assigning 60% weight to the ANN (Thermal Analysis) and 40% to the CNN (Visual Analysis).
The rationale for prioritizing the ANN output is rooted in the authenticity of physiological signals. While the CNNs are highly effective at capturing macro and microexpressions through image processing, visual expressions are susceptible to voluntary manipulation; individuals can consciously mask their true mood state (i.e., forced smiling during anger).
In contrast, the thermal signatures processed by the ANN reflect autonomous physiological responses such as subcutaneous blood flow and localized temperature shifts, which are governed by the sympathetic nervous system and are significantly more difficult to suppress or fabricate. By skewing the weights toward the thermal data, the model prioritizes these non-manipulable biomarkers, thereby enhancing the overall reliability and truthfulness of the multi-modal mood recognition system.
2.5. Thermal Data Processing
Prior to mood classification, the raw thermal frames acquired by the Heimann HTPA 80 × 64 sensor [
43] (see
Table 3 for specifications) undergo a three-stage preprocessing pipeline: face detection and extraction of anatomical regions of interest, physiological correction to estimate internal tissue temperatures from surface measurements, and delta-neutral transformation to eliminate inter-individual baseline differences.
2.5.1. Face Detection and ROI Extraction
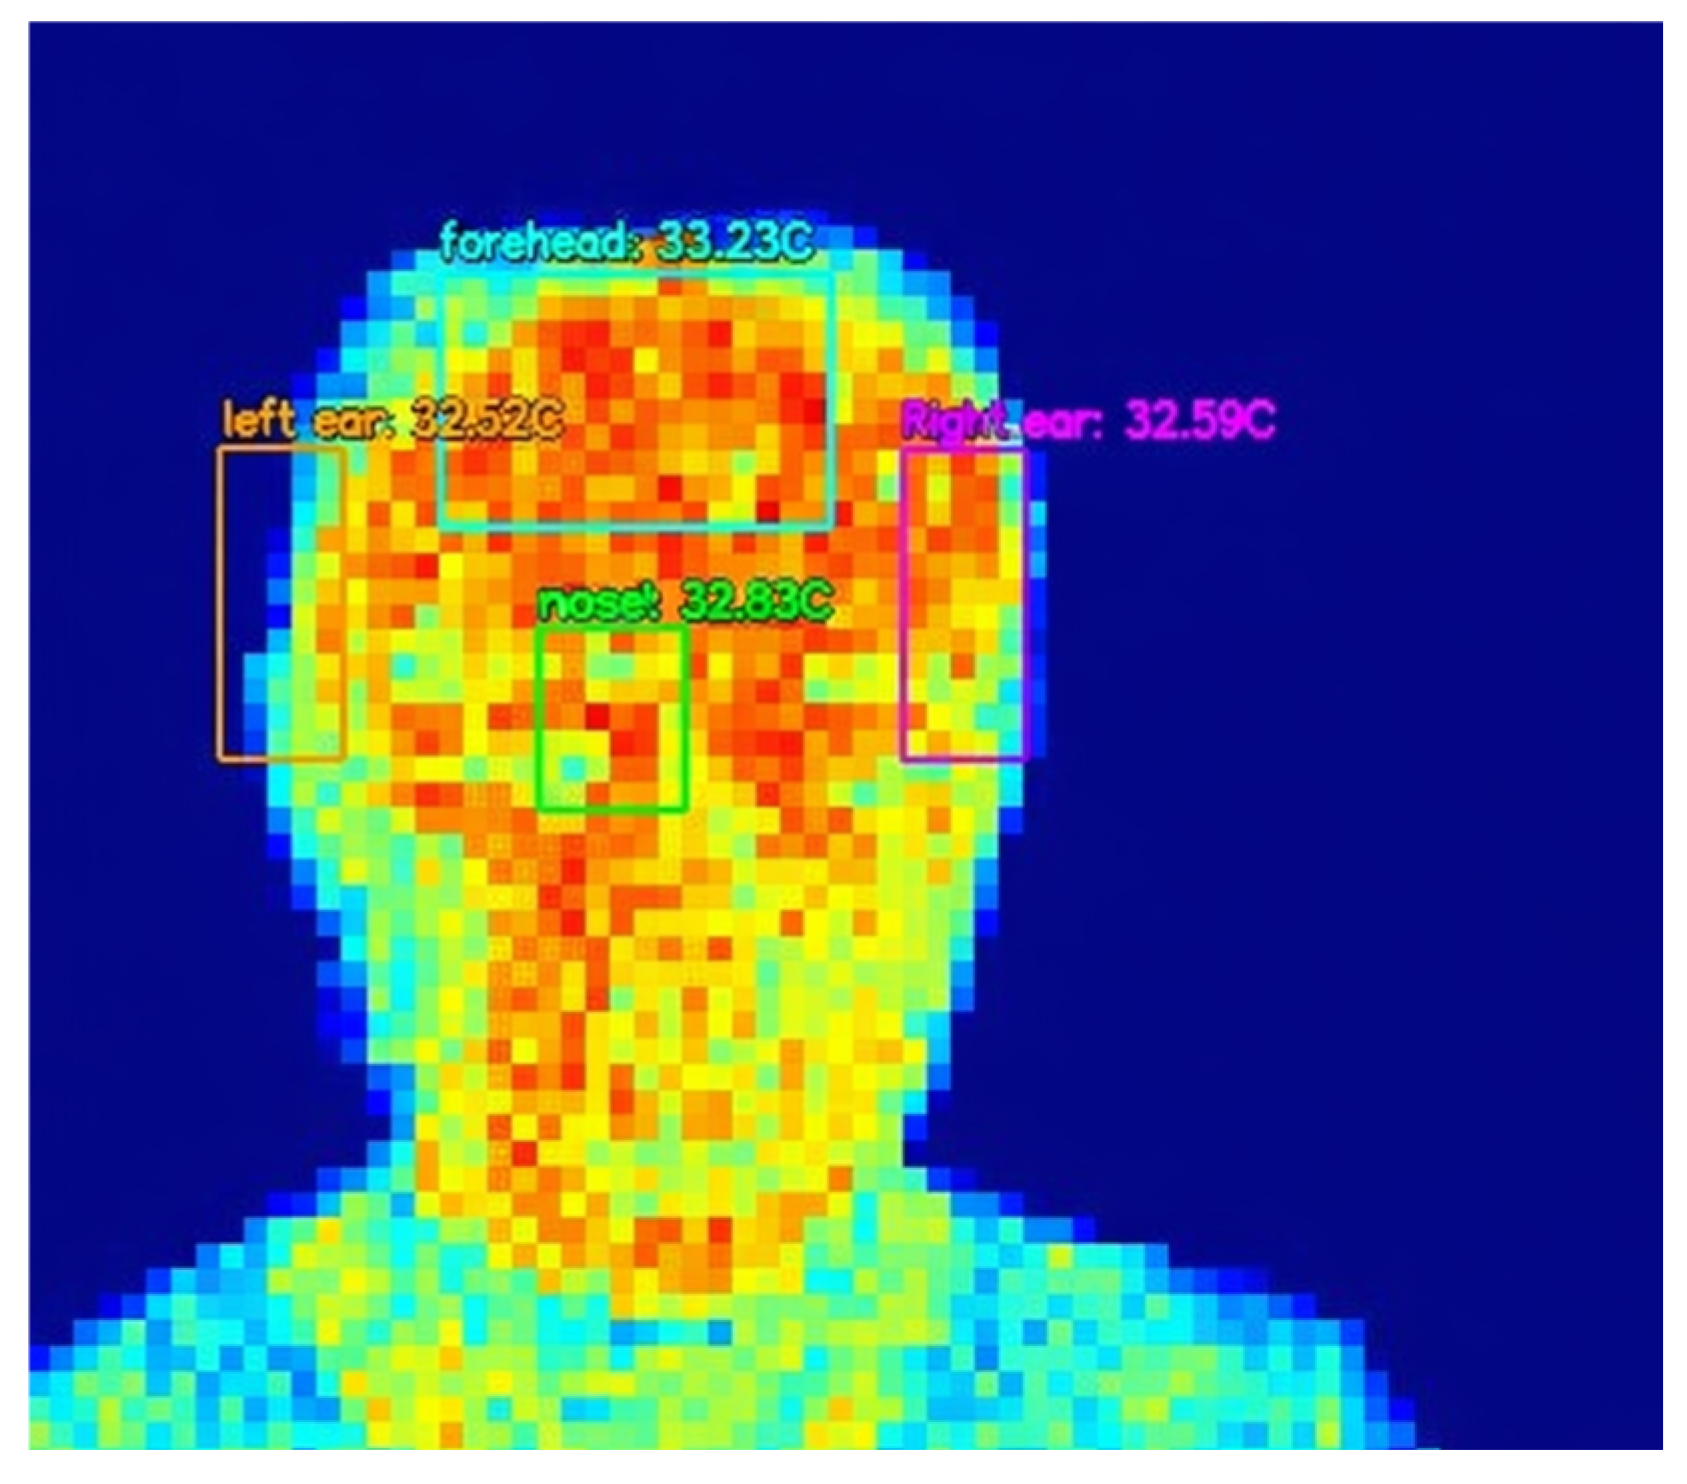
Each thermal frame was first converted from raw digital counts to absolute temperature values in degrees Celsius. Facial region detection was then performed using a temperature-threshold approach (
Figure 3): pixels above the 75th percentile of each frame’s temperature distribution were identified as candidate face pixels. Morphological filtering was applied to remove noise and fill gaps, and the largest connected region exceeding a minimum area threshold was extracted as the facial bounding box. An exponential smoothing filter (α = 0.4) was applied across consecutive frames to stabilize the bounding box position.
Four rectangular regions of interest (ROIs) were subsequently defined relative to the detected face bounding box (
Table 4).
For the forehead and nasal ROIs, a minimum face mask coverage threshold is enforced to ensure that the extracted region overlaps with actual facial tissue rather than background pixels. The nasal ROI is further refined using a thermal hotspot detection step: the warmest pixels within the initial nasal region are identified, and the ROI center is shifted toward their centroid to improve anatomical alignment with the nasal vasculature.
To compensate for brief occlusions of the ear regions caused by head movement, a temporal hold mechanism retains the most recent valid ear temperature for up to 10 consecutive frames. When both ear ROIs yield valid measurements, their mean value is computed as the periauricular temperature; when only one ear is observable, its value is used directly.
The mean temperature within each ROI is computed, yielding three independent surface temperature values per frame: forehead (T_forehead), external nasal (T_ext_nasal), and external tympanic (T_ext_tympanic), derived from the left–right ears average. These three surface observations are subsequently expanded to five temperature variables through the application of physiological correction coefficients (
Section 2.5.2).
2.5.2. Physiological Correction Coefficients
Raw thermal camera measurements reflect skin surface temperature rather than internal tissue temperature, as infrared thermography captures emitted radiation exclusively from the outermost skin layer and cannot penetrate into deeper anatomical structures [
44]. This physical constraint becomes operationally significant in the context of the present study because two of the five measurement regions (the internal nasal cavity and the tympanic membrane) are anatomically located beneath or within tissue structures and are therefore inaccessible to direct surface thermography.
During the experiments, internal nasal and tympanic temperatures can be measured using a handheld infrared thermometer. However, in the real-time inference pipeline, where a single Heimann HTPA 80 × 64 thermal camera continuously monitors the participant’s face, only external surface temperatures are available for all five regions. Specifically, the camera captures the external nasal surface temperature and the external tympanic skin temperature, but it cannot observe the internal nasal or the internal tympanic temperatures directly.
Table 5 summarizes the regional correction coefficients and corresponding formulas used to approximate internal nasal and tympanic temperatures from external surface measurements.
After this transformation, the five core temperature variables are placed within a physiologically consistent reference frame, making the internal temperatures of the forehead, nasal, and tympanic regions directly comparable.
2.5.3. Delta-Neutral Transformation
To eliminate inter-individual baseline body temperature differences, a neutral condition reference is computed for each participant. The average temperature recorded during each participant’s neutral session is computed separately for all five regions and subtracted from all of that participant’s records:
This approach focuses the model on change patterns rather than absolute temperatures, enabling the ANN to learn mood classes independently of individual baseline differences.
2.6. ANN Model (Mood Classification by Thermal Camera)
A feedforward fully connected Artificial Neural Network (ANN), specifically a Multilayer Perceptron (MLP), was developed to classify the seven POMS-based mood categories from the delta-neutral temperature features described in
Section 2.5.3. The model takes a 20-dimensional engineered feature vector as input, processes it through three hidden layers with progressively decreasing width, and outputs a probability distribution over the seven mood classes. The following subsections describe the dataset composition, feature engineering pipeline, network architecture, and training strategy.
2.6.1. Dataset Composition
The dataset was compiled from the experimental sessions described in
Section 2.2, in which a standardized mood induction protocol was administered under controlled laboratory conditions. Facial surface temperature measurements were recorded using the thermal imaging instruments detailed in
Table 1 across seven mood state conditions, six induced mood states and one neutral baseline, yielding a total of 7000 records, 1000 per condition.
2.6.2. Feature Engineering
In addition to the five raw delta values, a set of derived features is computed to capture inter-regional relationships and the overall thermal activation profile, resulting in a 20-dimensional feature vector in total.
Table 6 summarizes the complete 20-dimensional feature vector used in the thermal ANN pipeline.
Eight inter-regional gradient features capture pairwise differences between facial regions, reflecting asymmetric autonomic nervous system responses across facial zones. Two ratio features quantify relative internal-to-external temperature changes, where a small constant (ε = 10
−6) is added to both numerator and denominator to prevent division by zero. Five statistical summary features characterize the overall thermal activation level across all regions. All features were standardized using Z-score normalization (zero mean, unit variance) via scikit-learn’s StandardScaler [
45]. To prevent data leakage, the scaler was fitted exclusively on the training partition within each cross-validation fold, with parameters computed independently per fold and refitted on the full dataset for training the final model.
2.6.3. Network Architecture of the Thermal Data Processing
The model is implemented using the PyTorch 2.9.1 deep learning framework [
46]. The network consists of an input layer (20 neurons), three fully connected hidden layers with 128, 64, and 32 neurons respectively, and an output layer producing logits for 7 mood classes, following the topology: 20 → 128 → 64 → 32 → 7. The network comprises a total of 13,255 trainable parameters, reflecting a deliberately compact architecture suited to the dataset size.
The Rectified Linear Unit (ReLU) activation function is applied after each hidden layer to introduce non-linearity while mitigating the vanishing gradient. No activation function is applied at the output layer, raw logits are passed to the cross-entropy loss function during training, which internally applies log-softmax, and to an explicit softmax function during inference to obtain class probabilities.
To prevent overfitting, Dropout (
p = 0.15) is applied after each hidden layer [
47] and L2 weight decay (λ = 5 × 10
−4) is incorporated via the AdamW optimizer [
48], which decouples weight decay from gradient updates for more consistent regularization. A weighted cross-entropy loss addresses class imbalance using class weights computed inversely proportional to category frequency in the training split of each fold. Training is governed by early stopping based on validation loss (patience = 25 epochs, min_delta = 1 × 10
−4), restoring the best-performing weights upon termination. The ANN model hyperparameters are given and explained in
Table 7.
2.6.4. Training and Evaluation Protocol
To reliably estimate generalization performance, Group K-Fold Cross-Validation (GroupKFold, K = 5) is applied. Folds are constructed at the participant level: all records belonging to the same participant appear exclusively in either the training or the test set. This grouping prevents the model from encountering a participant’s neutral baseline during training and subsequently evaluating that same participant’s mood records at test time, which would artificially inflate performance estimates. Therefore, participant-level grouping is used to ensure subject-independent evaluation.
Three performance metrics are computed across folds: Accuracy (proportion of correctly classified samples), Macro-F1 (unweighted average of per-class F1 scores, providing a balanced measure under class imbalance), and Top-2 Accuracy (proportion of cases in which the true label falls within the model’s two highest-probability predictions).
After cross-validation, the final deployment model is trained from scratch on the complete dataset. The number of training epochs is set to the average early-stopping epoch observed across the five CV folds, and early stopping is disabled to avoid using the same data for both training and validation loss monitoring. The trained model weights, scaler parameters, and label encoder are serialized to separate files to ensure consistent preprocessing during inference.
2.6.5. Real-Time Thermal Inference
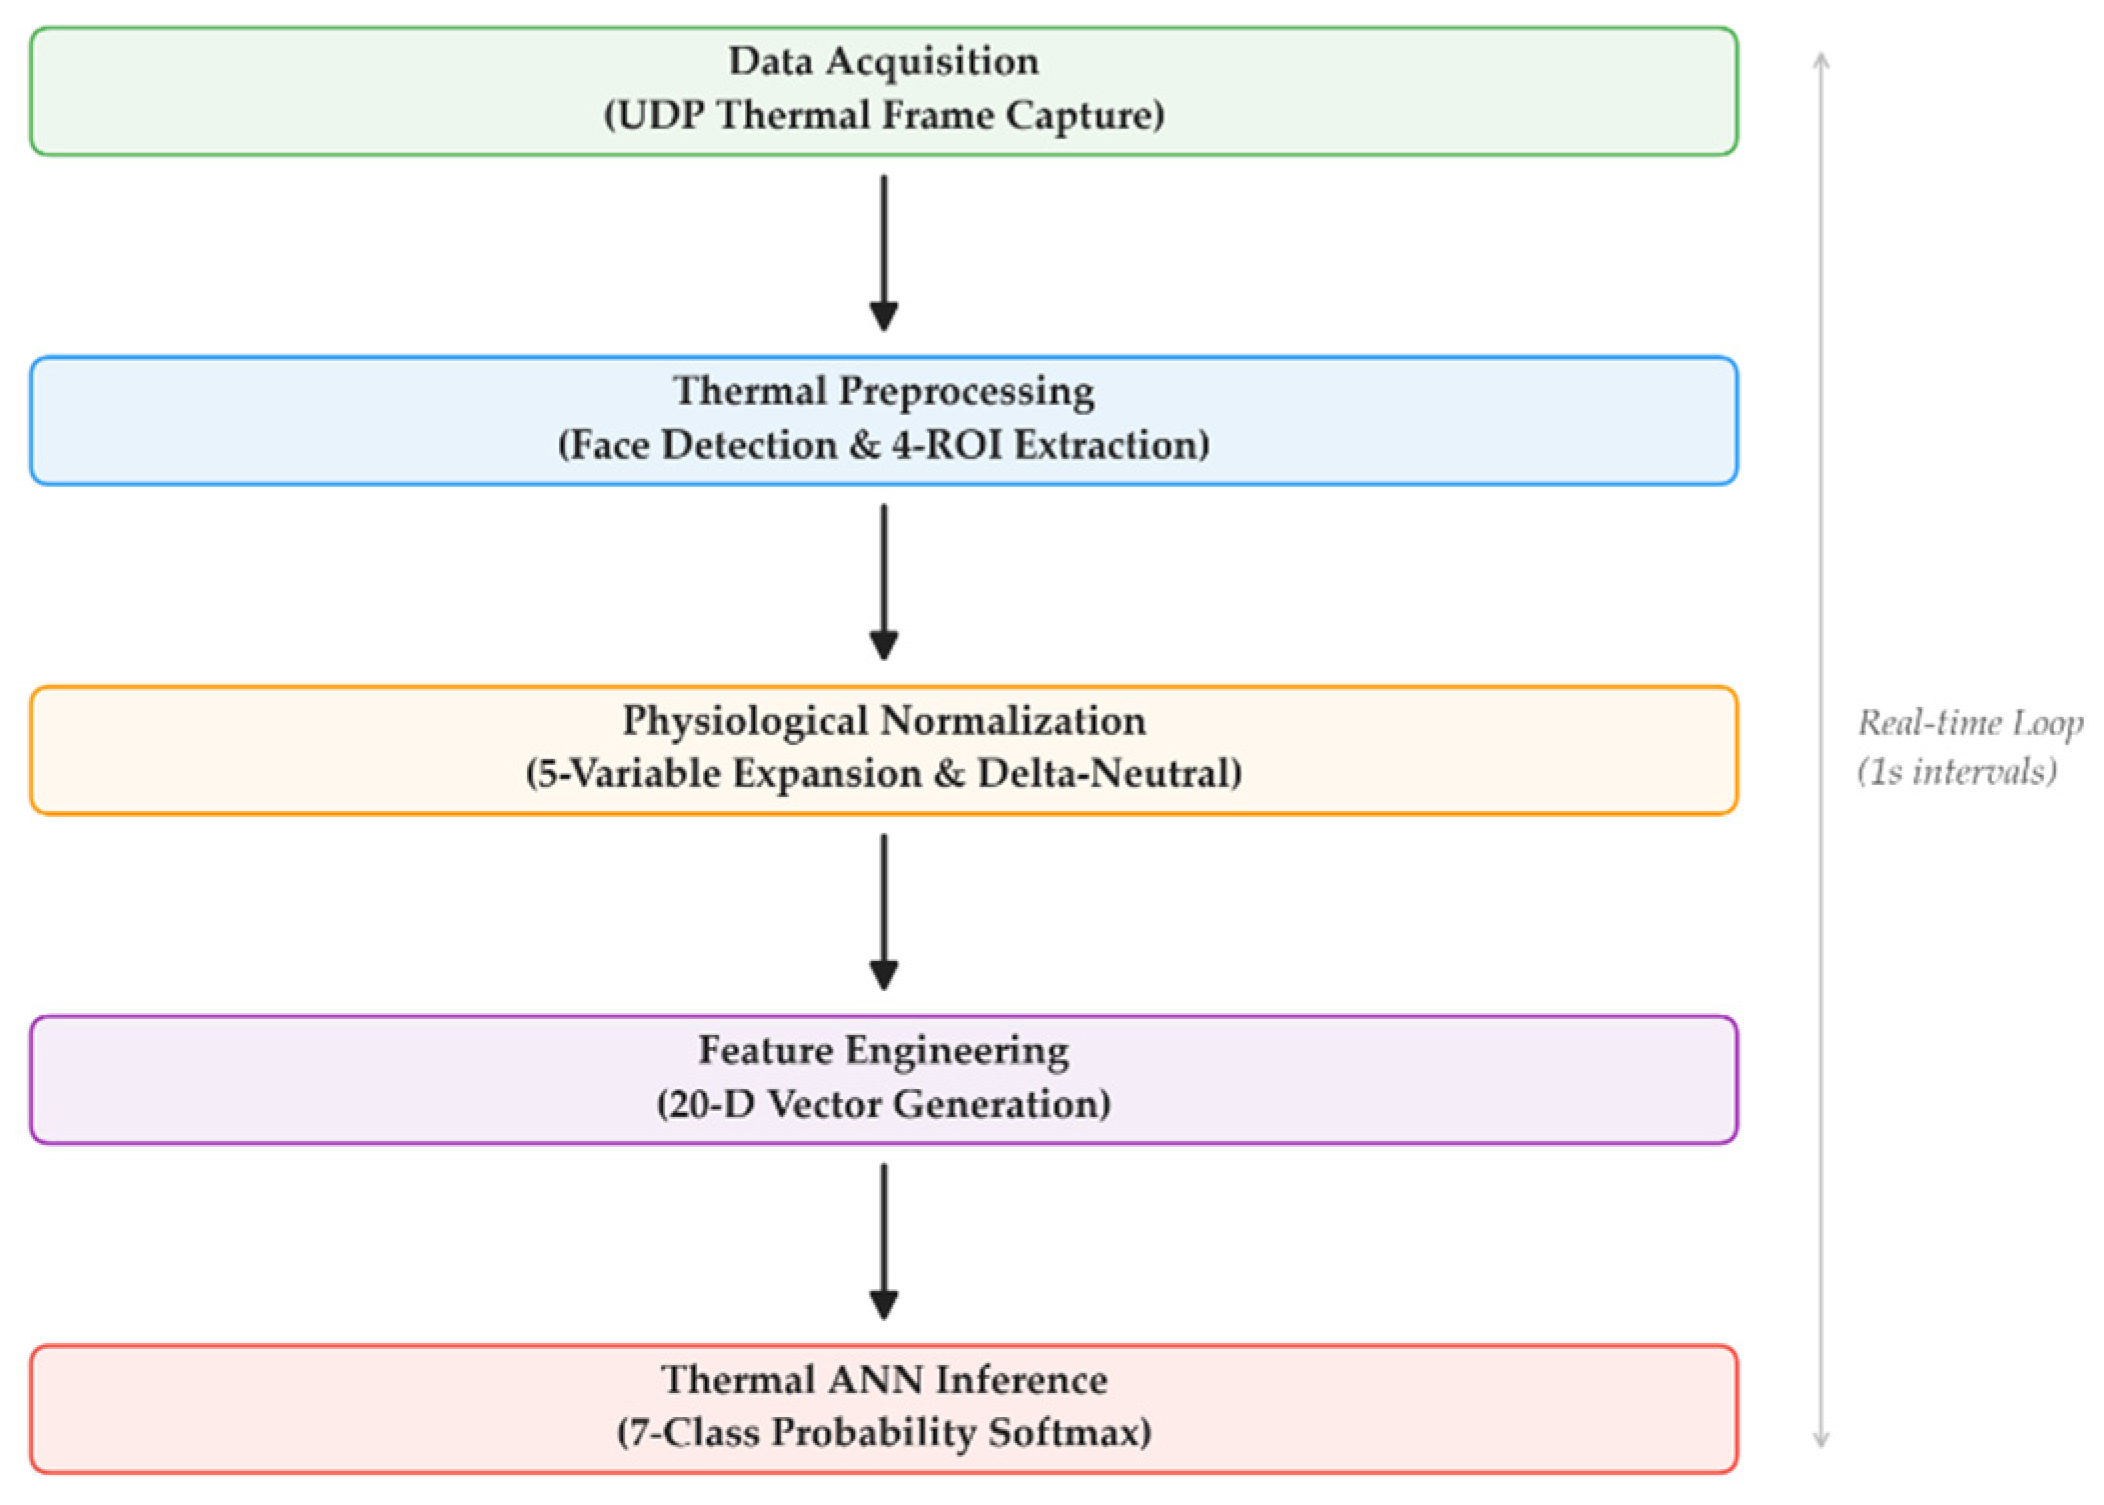
During real-time operation, the trained ANN model is integrated with the Heimann HTPA 80 × 64 sensor to perform continuous mood classification. The real-time thermal inference pipeline is summarized in
Figure 4. The inference pipeline operates as follows: thermal frames are captured via UDP and processed to extract the four ROIs (
Section 2.5.1), the three surface temperatures are expanded to five variables using correction coefficients (
Section 2.5.2); each participant’s neutral baseline, recorded during an initial 10 s calibration period, is subtracted to obtain delta-neutral values (
Section 2.5.3); the 20-dimensional feature vector is computed and normalized using the saved scaler parameters; and the ANN produces a softmax probability distribution over the seven mood classes in a single forward pass. The ANN produces a full seven-class softmax probability distribution at one-second intervals. In standalone operation, predictions with a Top-1 to Top-2 margin below 3 percentage points or a Shannon entropy exceeding 1.75 are flagged as uncertain. However, in the integrated system, the complete probability vector is forwarded to the ensemble fusion module (
Section 2.8), where it is combined with the CNN output before a final decision is made.
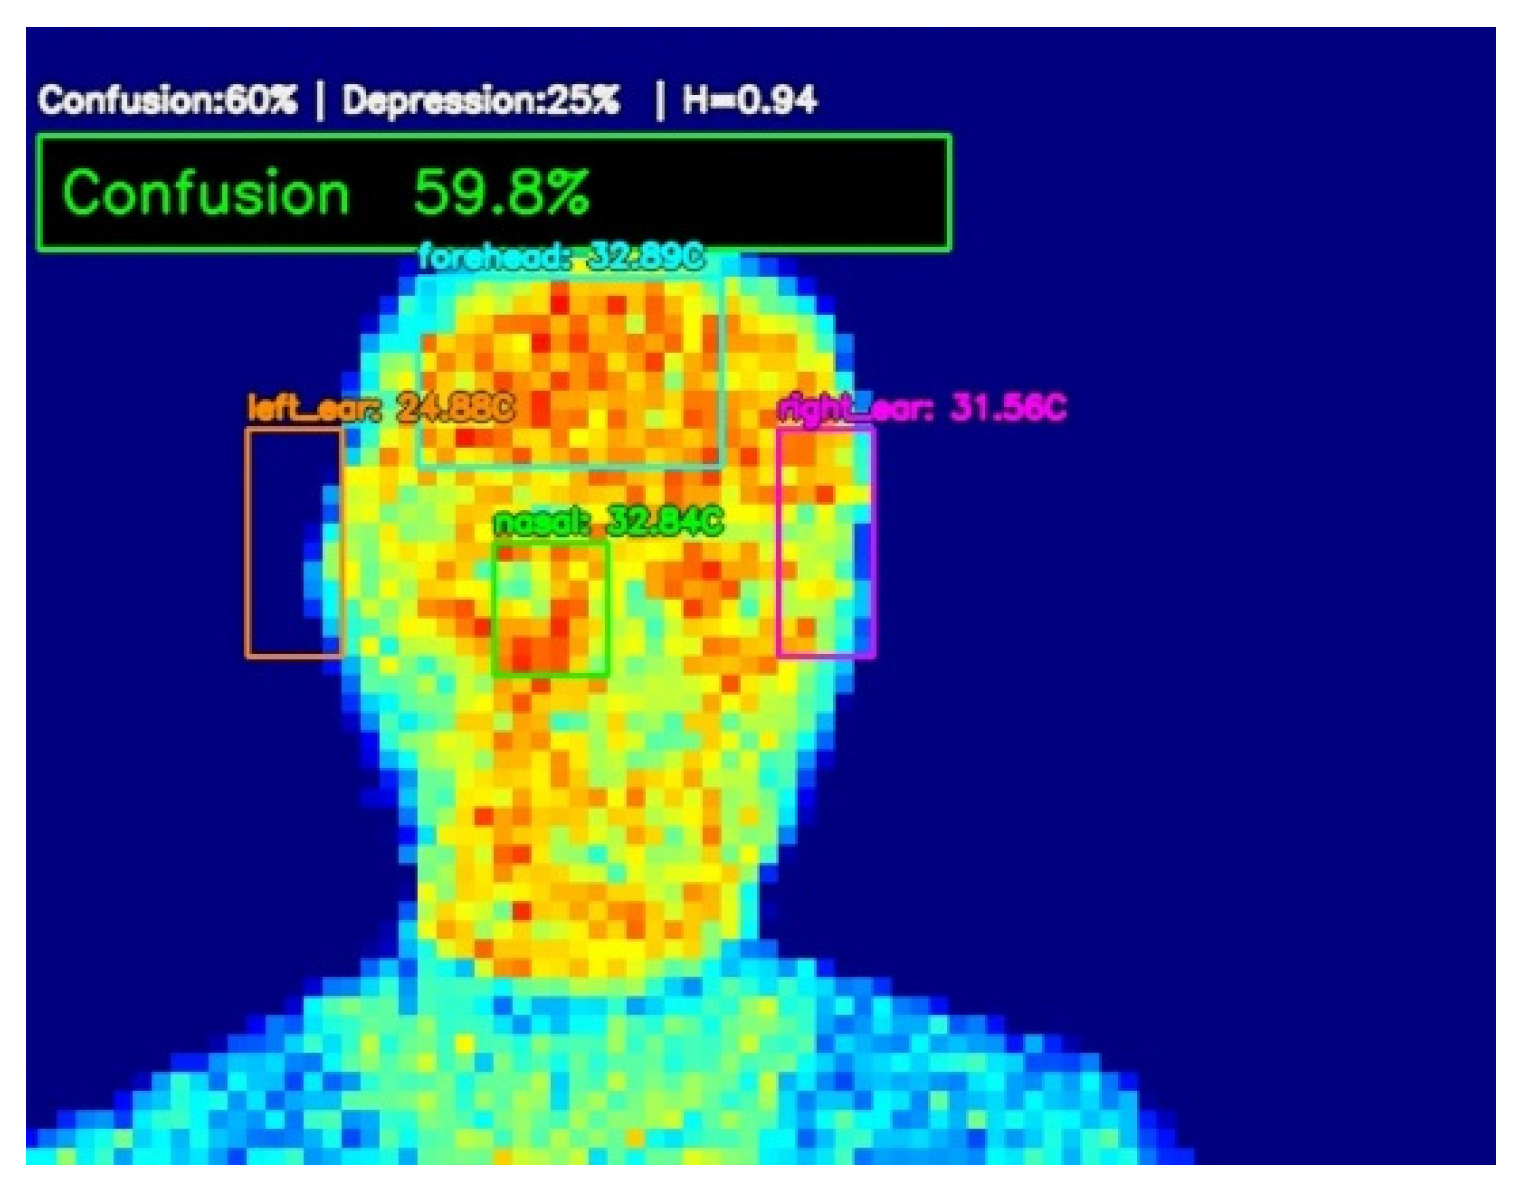
Figure 5 illustrates the real-time interface displaying the four ROIs with their measured surface temperatures and the corresponding ANN mood prediction.
2.7. CNN Model (Mood Classification by High-Resolution Camera)
Facial mood recognition formed one of the core components of the proposed mood state decision architecture, with overall determination features contributing 40% along with thermal camera measurements. In these integrated systems, facial expressions were used as the primary behavioral indicator of psychological state, while thermal imaging provided complementary evidence by enhancing the robustness and durability of mood prediction.
2.7.1. Dataset and Preprocessing
To perform these operations, a convolutional neural network (CNN) based deep learning model capable of real time mood extraction from facial expressions was designed. The model trained with the AffectNet dataset, converted to YOLO format, and class labels were added to Ekman’s seven basic mood categories (anger, disgust, fear, happiness, sadness, surprise, neutral). Images with inconsistent labels or poor visual quality were excluded to maintain the robustness of the data setup.
Face detection was performed with a lightweight YOLO based sensor a MediaPipe supported fallback mechanism was used to ensure stability under varying head positions and lighting conditions. Detected face regions were slightly expanded to preserve contextual cues; then cropped, rescaled to standard input size, and channel based normalization was applied. Moderate data enhancement techniques such as horizontal flipping, slight color changes, and blurring were applied during training to improve generalization ability. Class imbalance was corrected using weighted sampling.
Following the extraction of the seven Ekman emotion probabilities, an empirical mapping layer was implemented to translate these instantaneous facial expressions into broader POMS-related mood dimensions. This was achieved through a non-negative linear transformation matrix, where each facial expression probability is weighted based on its psychometric alignment with corresponding mood constructs (e.g., mapping ‘Happiness’ to the ‘Vigor’ dimension). This mapping serves as an exploratory functional interface to convert real-time affective cues into the sustained mood representations required for the adaptive HVAC control logic, with its parameters refined based on the correlation observed between facial probabilities and subjective POMS scores during the pilot trials.
2.7.2. Network Architecture of the CNN Model
The ResNet-18 architecture was chosen as the feature extraction backbone within the transfer learning framework. Pretrained weights were used, and the final fully connected layer was reconfigured to produce a seven class softmax output. The network architecture consists of successive convolution layers with residual connections, Batch Normalization, ReLU activation functions, and a Global Average Pooling layer before classification. Cross entropy loss and the AdamW optimizer were used together in the optimization process. Training was performed on GPU hardware using mixed precision computation to increase efficiency while maintaining numerical stability.
2.7.3. Probabilistic Stabilization and POMS Mapping
For each frame of the recorded video stream, the network generated a seven dimensional softmax probability distribution over Ekman categories. Two probabilistic control mechanisms were implemented to prevent unstable or unrealistic sentiment transitions under uncertain predictions. A minimum probability mass was assigned to the neutral category before renormalization when no class exceeded a predefined confidence threshold (Neutral Floor). Additionally, the probability of the surprise class was capped to prevent transient perception artifacts from disproportionately affecting sentiment mapping (Surprise Cap).
The stabilized Ekman probability vector was transformed into six POMS dimensions (Tension, Depression, Anger, Fatigue, Confusion, Vigor) by a non-negative linear mixing matrix based on psychometric fit. The resulting distribution was normalized to create a valid mood vector. Exponential moving average smoothing was applied to reduce inter-square variability, thus ensuring temporal stability without sacrificing response speed. The entire inference pipeline was run locally on the device; raw facial images were not stored; only the aggregated POMS vectors were transmitted to the HVAC control module.
2.8. Ensemble Decision Fusion
To leverage the complementary strengths of both sensing modalities, the ANN (thermal) and CNN (facial expression) outputs are combined through a weighted late-fusion strategy operating at the probability level. Both models independently produce a seven-class probability distribution over the shared POMS mood categories (tension, depression, anger, vigor, fatigue, confusion, neutral). The ensemble probability for each mood class is computed as the weighted average of the two model outputs:
The thermal-based ANN is assigned a 60% weight because it provides direct physiological measurements that are less susceptible to voluntary expression masking. Complementarily, the RGB-based CNN, which utilizes a webcam, is assigned a 40% weight to capture the granular, muscular and geometric facial cues that remain invisible to thermal imaging. This distribution ensures that the high-fidelity reliability of physiological signals is balanced with the high-frequency sensitivity of visual data. Therefore, in Equation (4) w_ANN and w_CNN are defined as 0.60 and 0.40, respectively. The resulting distribution is renormalized to ensure the probabilities sum to unity. The mood class with the highest ensemble probability is selected as the final prediction:
The higher weight assigned to the thermal modality reflects its ability to capture involuntary autonomic nervous system responses, which are more difficult for participants to suppress or simulate compared to voluntary facial expressions. The CNN provides complementary behavioral evidence that improves discrimination in cases where thermal signatures alone may be ambiguous—particularly between low-arousal states such as depression and fatigue, which exhibit similar thermal profiles but distinct facial expressions.
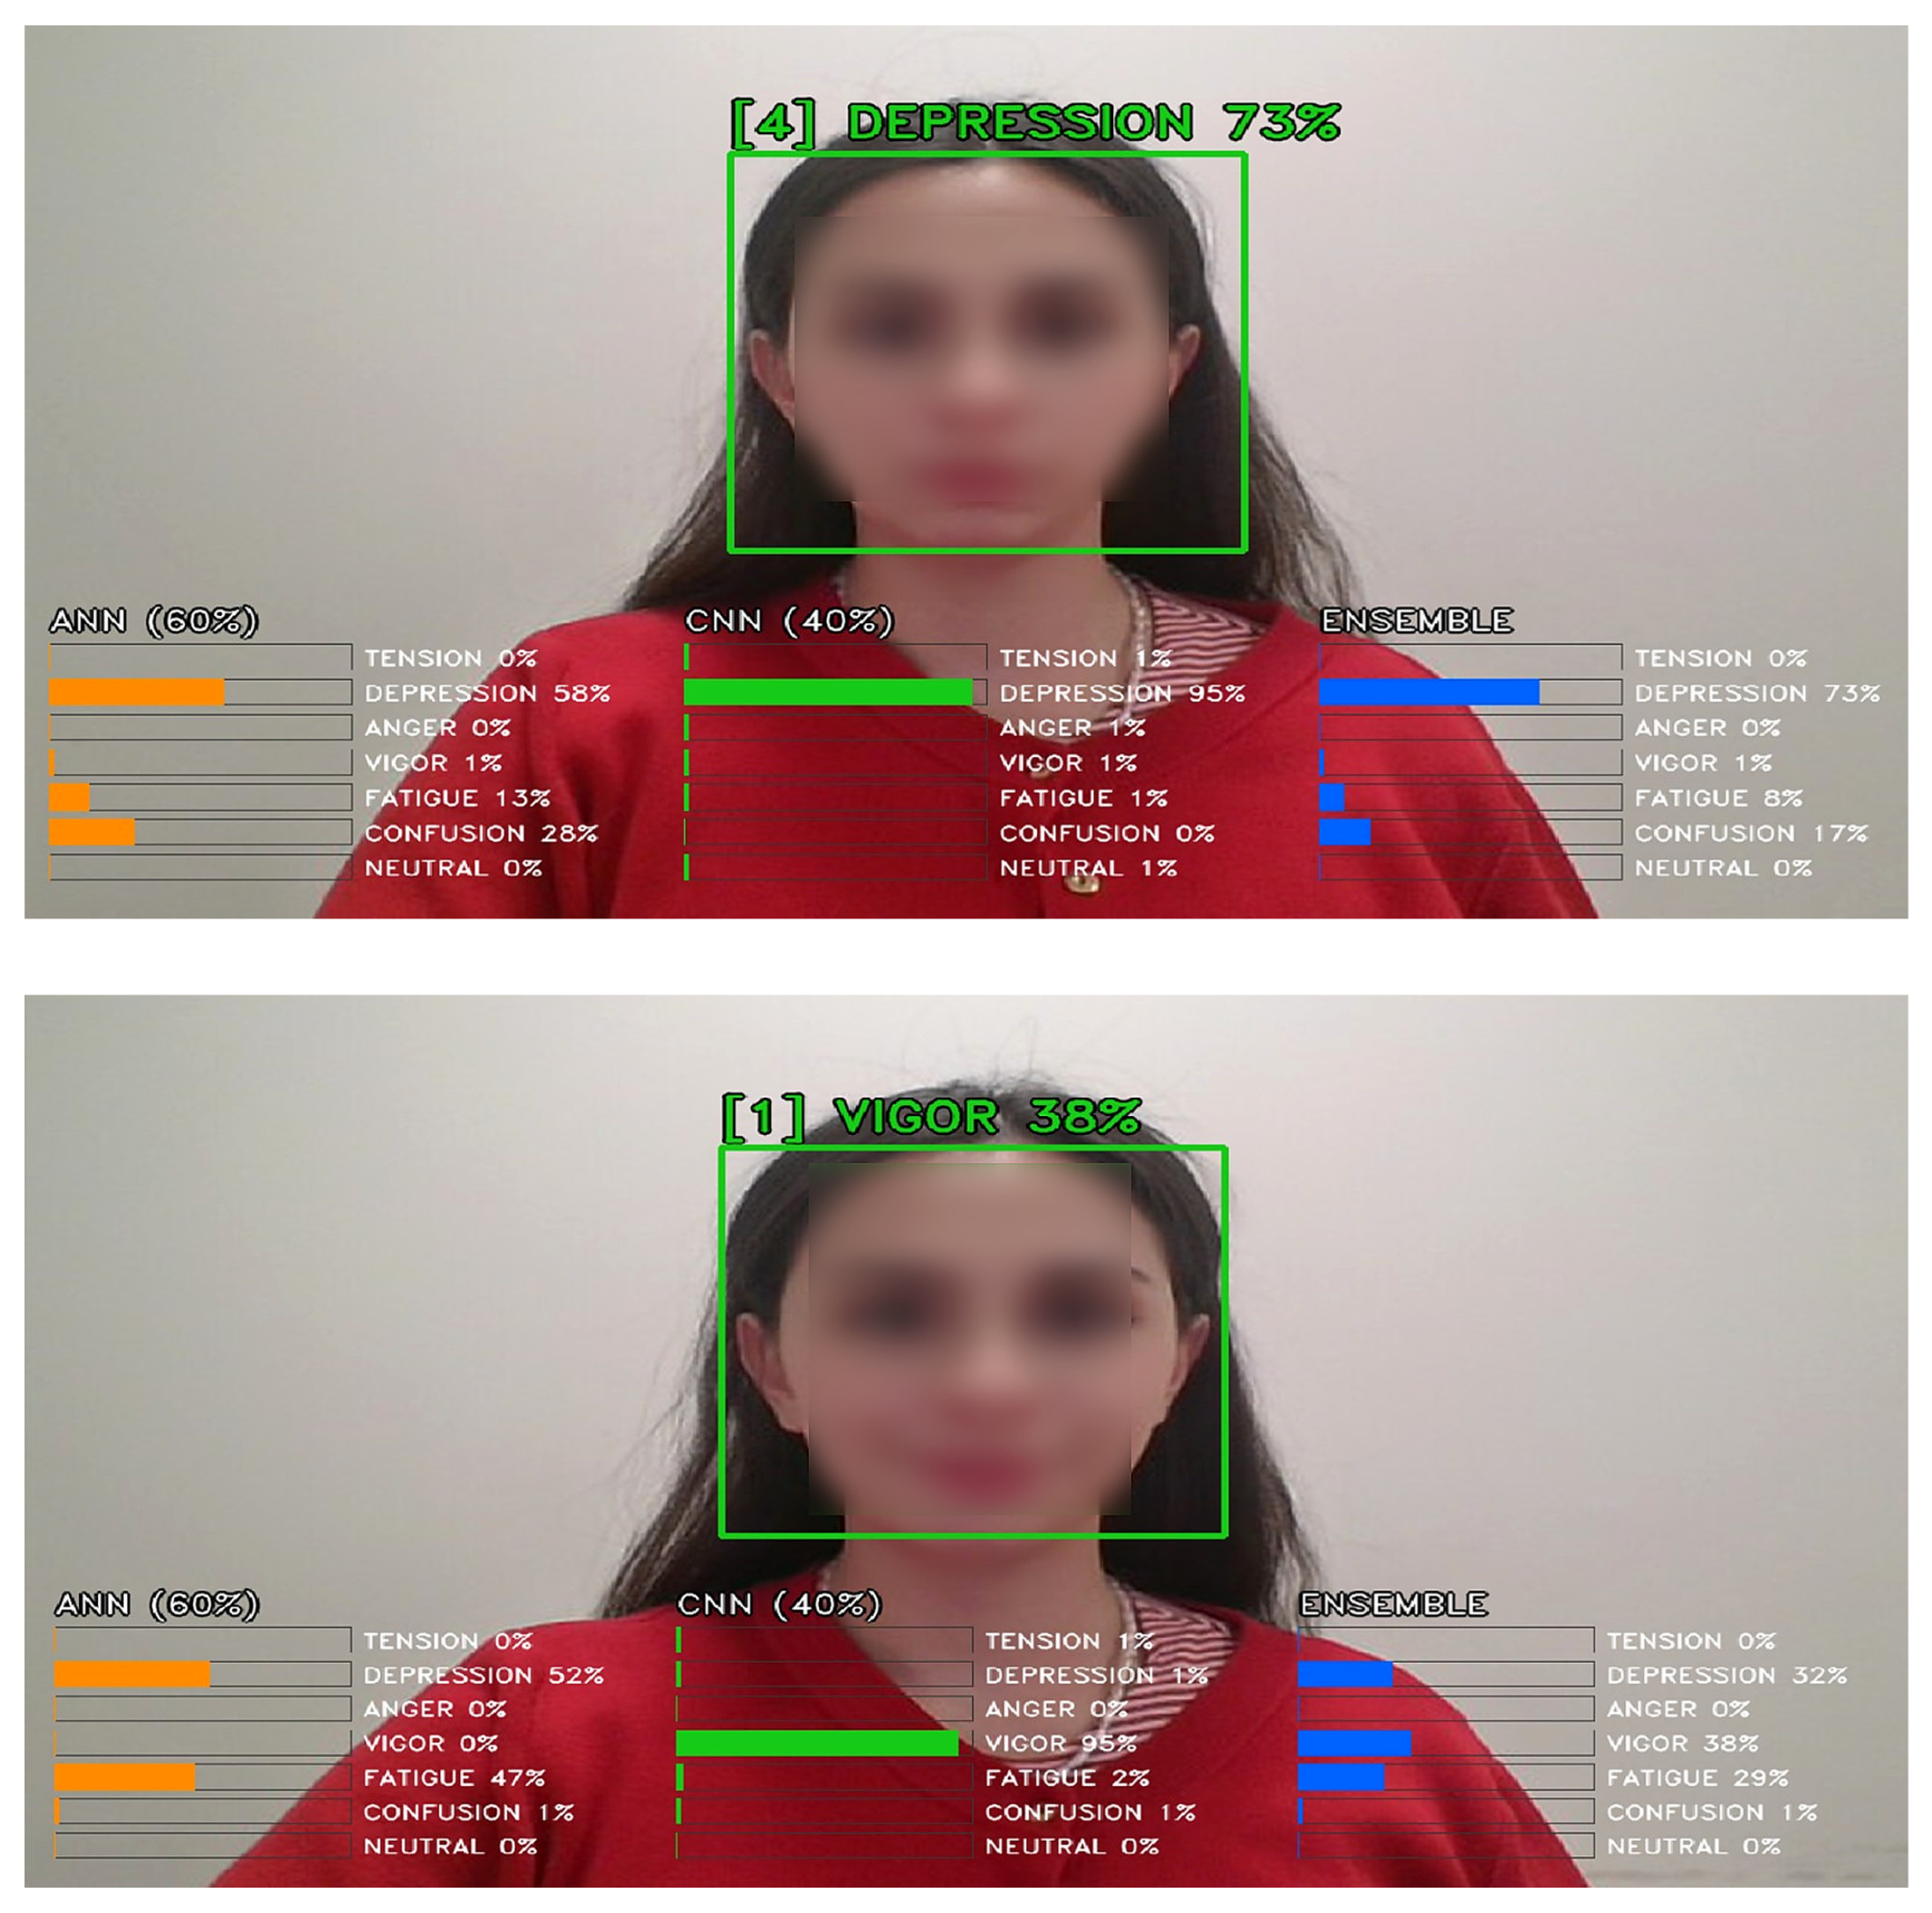
When the ANN thermal data is temporarily unavailable (e.g., due to sensor occlusion or loss of face detection), the system falls back to CNN-only predictions until thermal data is restored. The final ensemble decision is transmitted to the ESP-32 HVAC control module (
Section 2.9) at regular intervals. A real-time example of the ensemble interface under two contrasting scenarios is shown in
Figure 6.
2.9. Embedded Affective Communication and User-Centered Adaptive HVAC Control
After mood recognition by deep learning-based inference is completed, the resulting mood state label is transmitted to the ESP-32 microcontroller in the system to initiate adaptive thermal camera control. At this stage, the system transitions from the computational analysis section to embedded ambient modulation, and the inferred mood state is gradually converted into HVAC set temperature adjustments. The purpose of this layer is not to provide an instantaneous response, but to provide controlled and user-centric thermal adaptation compatible with a personalized comfort zone and energy saving.
2.9.1. Communication and Control Logic
Before switching to autonomous mode, the user manually defines a preferred baseline temperature value (T0). This defined value is used as the baseline reference value for all subsequent changes. The system does not continuously impose a fixed temperature; instead, it calculates based on the baseline temperature value selected by the user. Thus, adaptive control maintains and does not violate the user’s desired comfort zone. The mood state label consists of seven taxonomies: neutral, confusion, tension, depression, fatigue, anger, and vigor. The mood state label is selected from these taxonomies and sent to the ESP-32 from the host computer. The ESP-32 verifies the received information with predefined mood labels and updates the internal control state accordingly. The system reassesses in 15 min periods, so ultra-low latency is not critical; instead, structural simplicity and communication reliability are prioritized. Instead of assigning absolute temperature targets to specific mood states, the system control continuously applies limited incremental changes of ±1 °C in 15 min assessment cycles. Arousal states such as anger, tension, and euphoria cause a slight cooling effect by reducing the current set value by 1 °C. Low-energy moods such as depression and fatigue provide a slight warming effect with a 1 °C increase. In neutral and confusion states, the current temperature is maintained, and the fan speed is increased or decreased to change the airflow circulation for thermal comfort. The 1 °C temperature shifts are calibrated based on documented thermal comfort responses to different mood states, where high-arousal moods trigger a cooling response and low-energy states trigger a warming effect to maintain the user’s perceived comfort zone. All changes are calculated according to the user-defined baseline temperature T0. To prevent excessive deviation and uncontrolled drift in the same ongoing moods during the system’s reassessment process, all incremental updates are limited to a ±2 °C range of the base temperature, so that the operating set value remains within the range T ∈ [T0 − 2, T0 + 2]. This limit stabilizes the environment and restricts unnecessary HVAC load fluctuations. The system operates as a slow adaptive closed-loop controller, with the sensing and inference pipeline reassessing the user’s mood state in 15 min periods and sending the updated mood label to the ESP-32. If the same mood label persists during updates, it is kept within the pre-set limits of the operating set value. If the state changes or returns to neutral, the selected time interval allows time for the environment to stabilize and for the user’s perceptual adjustment before applying a new change.
2.9.2. Wearable IR Transmitter
Control of the HVAC device is achieved via an infrared (IR) command transmission pathway located on the ESP-32. This IR command transmission system is emplaced in a compact, portable necklace. The system only sends an infrared command to the HVAC unit in response to a message from the host computer when a set value change is required. This allows the current HVAC status to be periodically checked to prevent unnecessary transmissions and unnecessary compressor operation.
2.9.3. User Override and Safety
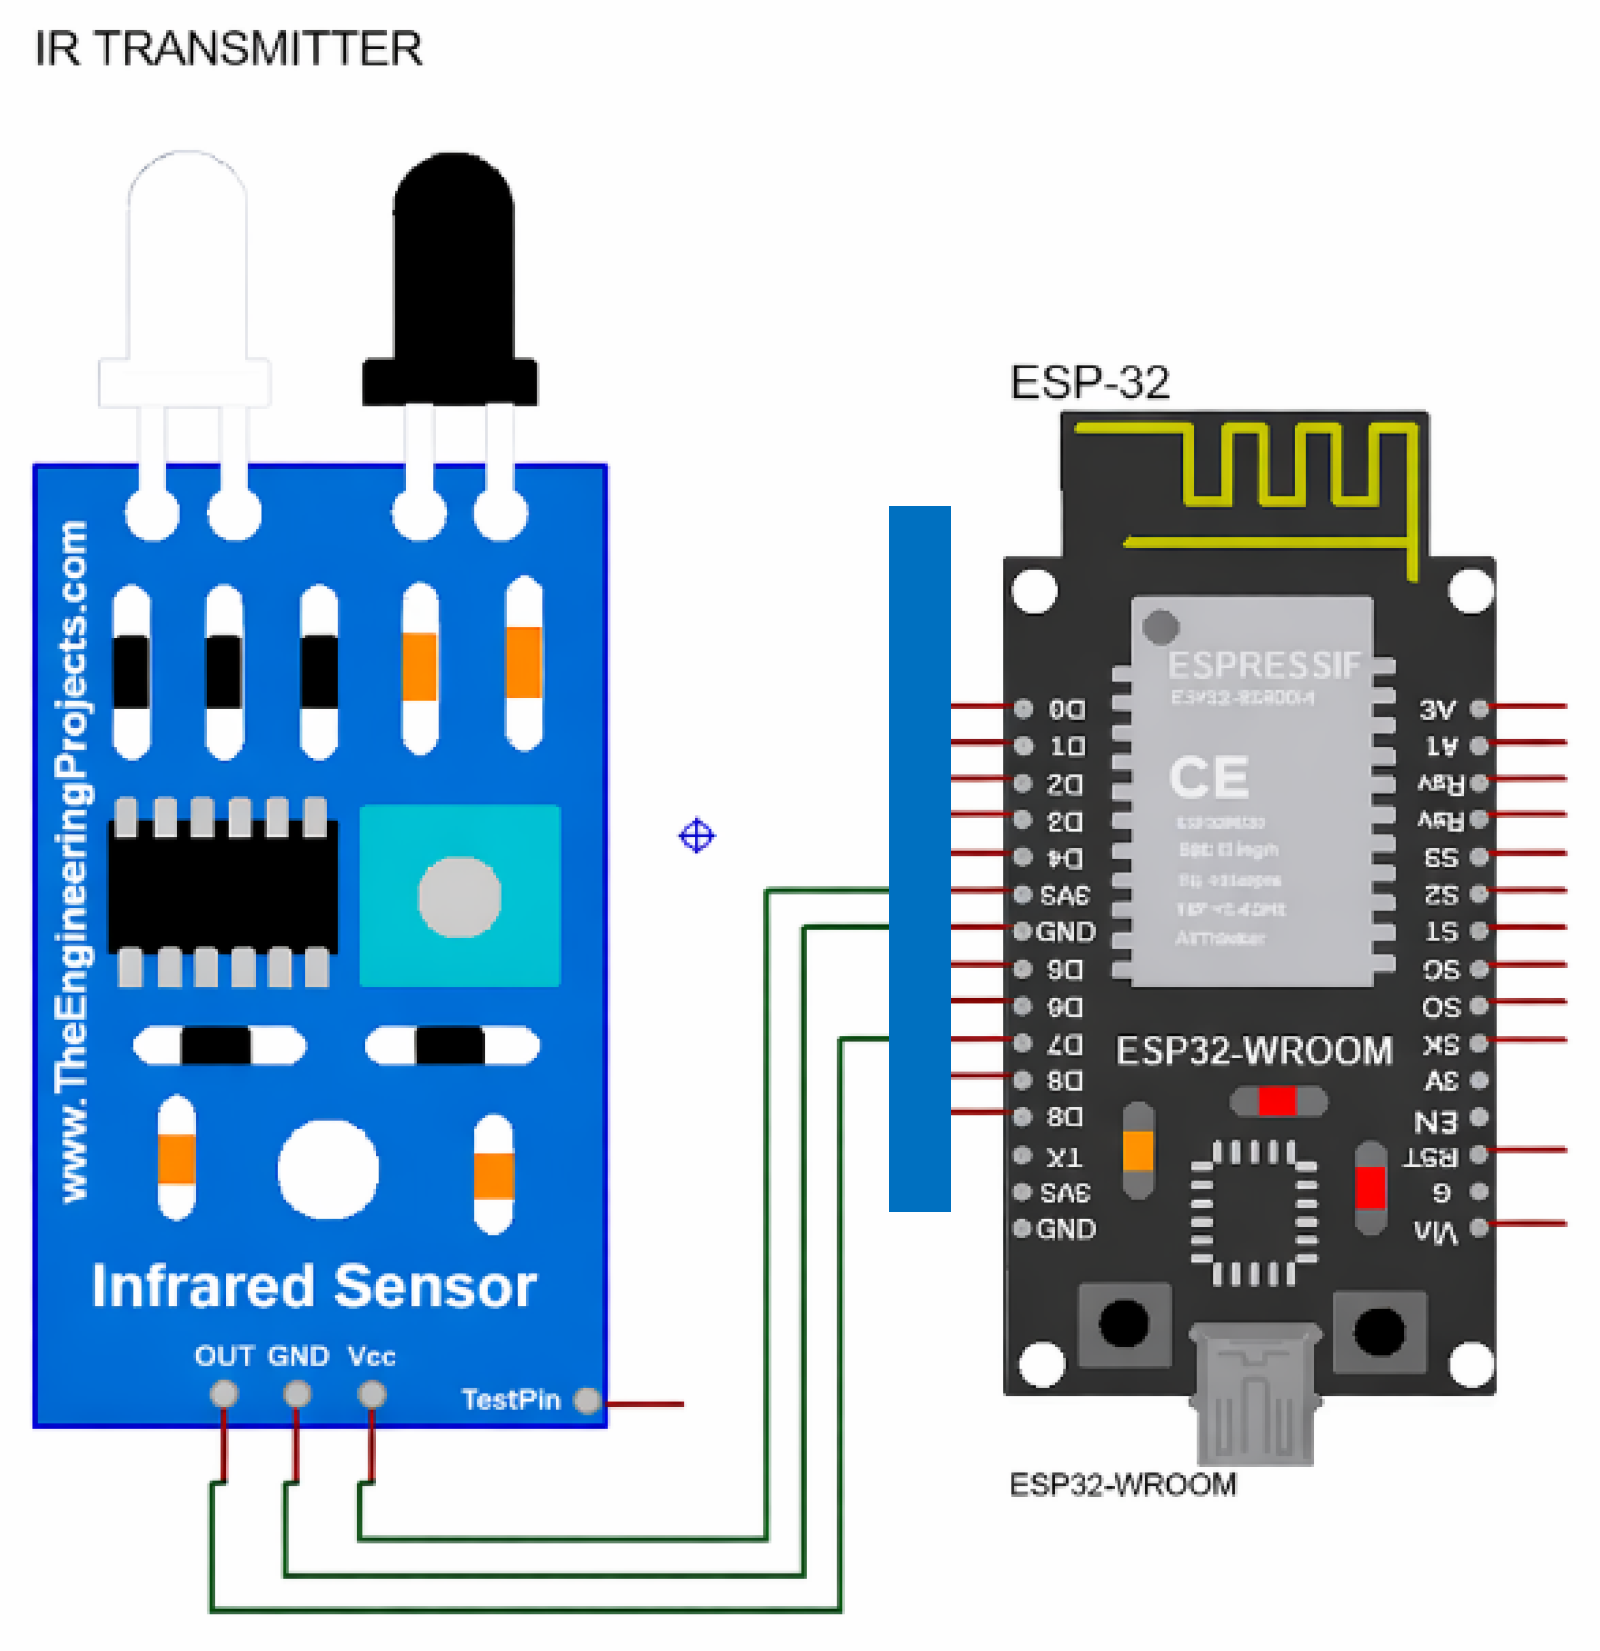
This ESP-32 (
Figure 7) integrated necklace is a wearable module with a manual shut-off mechanism. When this mechanism is used, the mood label-based autonomous control is immediately deactivated. If the user manually changes the HVAC temperature during operation, this is accepted as the newly selected base temperature (T
0) value. This ensures consistency between the user’s preferences and the adaptive control behavior.
The mood-adaptive HVAC control logic (Algorithm 1) was implemented on an ESP32 microcontroller to ensure low-latency response. The system initializes at a baseline of 22 °C and executes 1 °C incremental adjustments depending on the detected emotional state. Specifically, negative-active moods (Angry, Tension) and high-energy states (Vigor) trigger a cooling response, while low-energy states (Depressed, Fatigue) trigger a warming response. In cases of Neutral or Confusion states, the system prioritizes airflow by increasing fan speed. This heuristic approach ensures that thermal adjustments are directly proportional to the occupant’s physiological and psychological needs.
| Algorithm 1 Mood-Based Adaptive HVAC Control Algorithm |
Require: Mood message m received from main computer via Wi-Fi
1: Receive mood message from main computer over Wi-Fi and process it
2: Activate IR transmitter on pin 27
3: Initialize AC state with temperature T = 22 °C, mode = COOL, fan = AUTO, power = ON
4: for each received mood input m do
5: Adjust temperature and fan according to mood:
6: if m = angry then T ← T − 1
7: if m = tension then T ← T − 1
8: if m = vigor then T ←T − 1
9: if m = depressed or fatigue then T ←T + 1
10: if m = neutral then increase fan speed
11: if m = confusion then increase fan speed
12: Update AC parameters (power, temperature, mode, fan)
13: Transmit IR command to HVAC system
14: end for
15: Output: Updated HVAC state with modified temperature and fan settings |
2.10. Hardware Enclosure Design
Two custom enclosures were designed in SolidWorks SP1.0 to house the system’s sensing and control components in a compact, deployment-ready form.
2.10.1. Integrated Sensing Unit
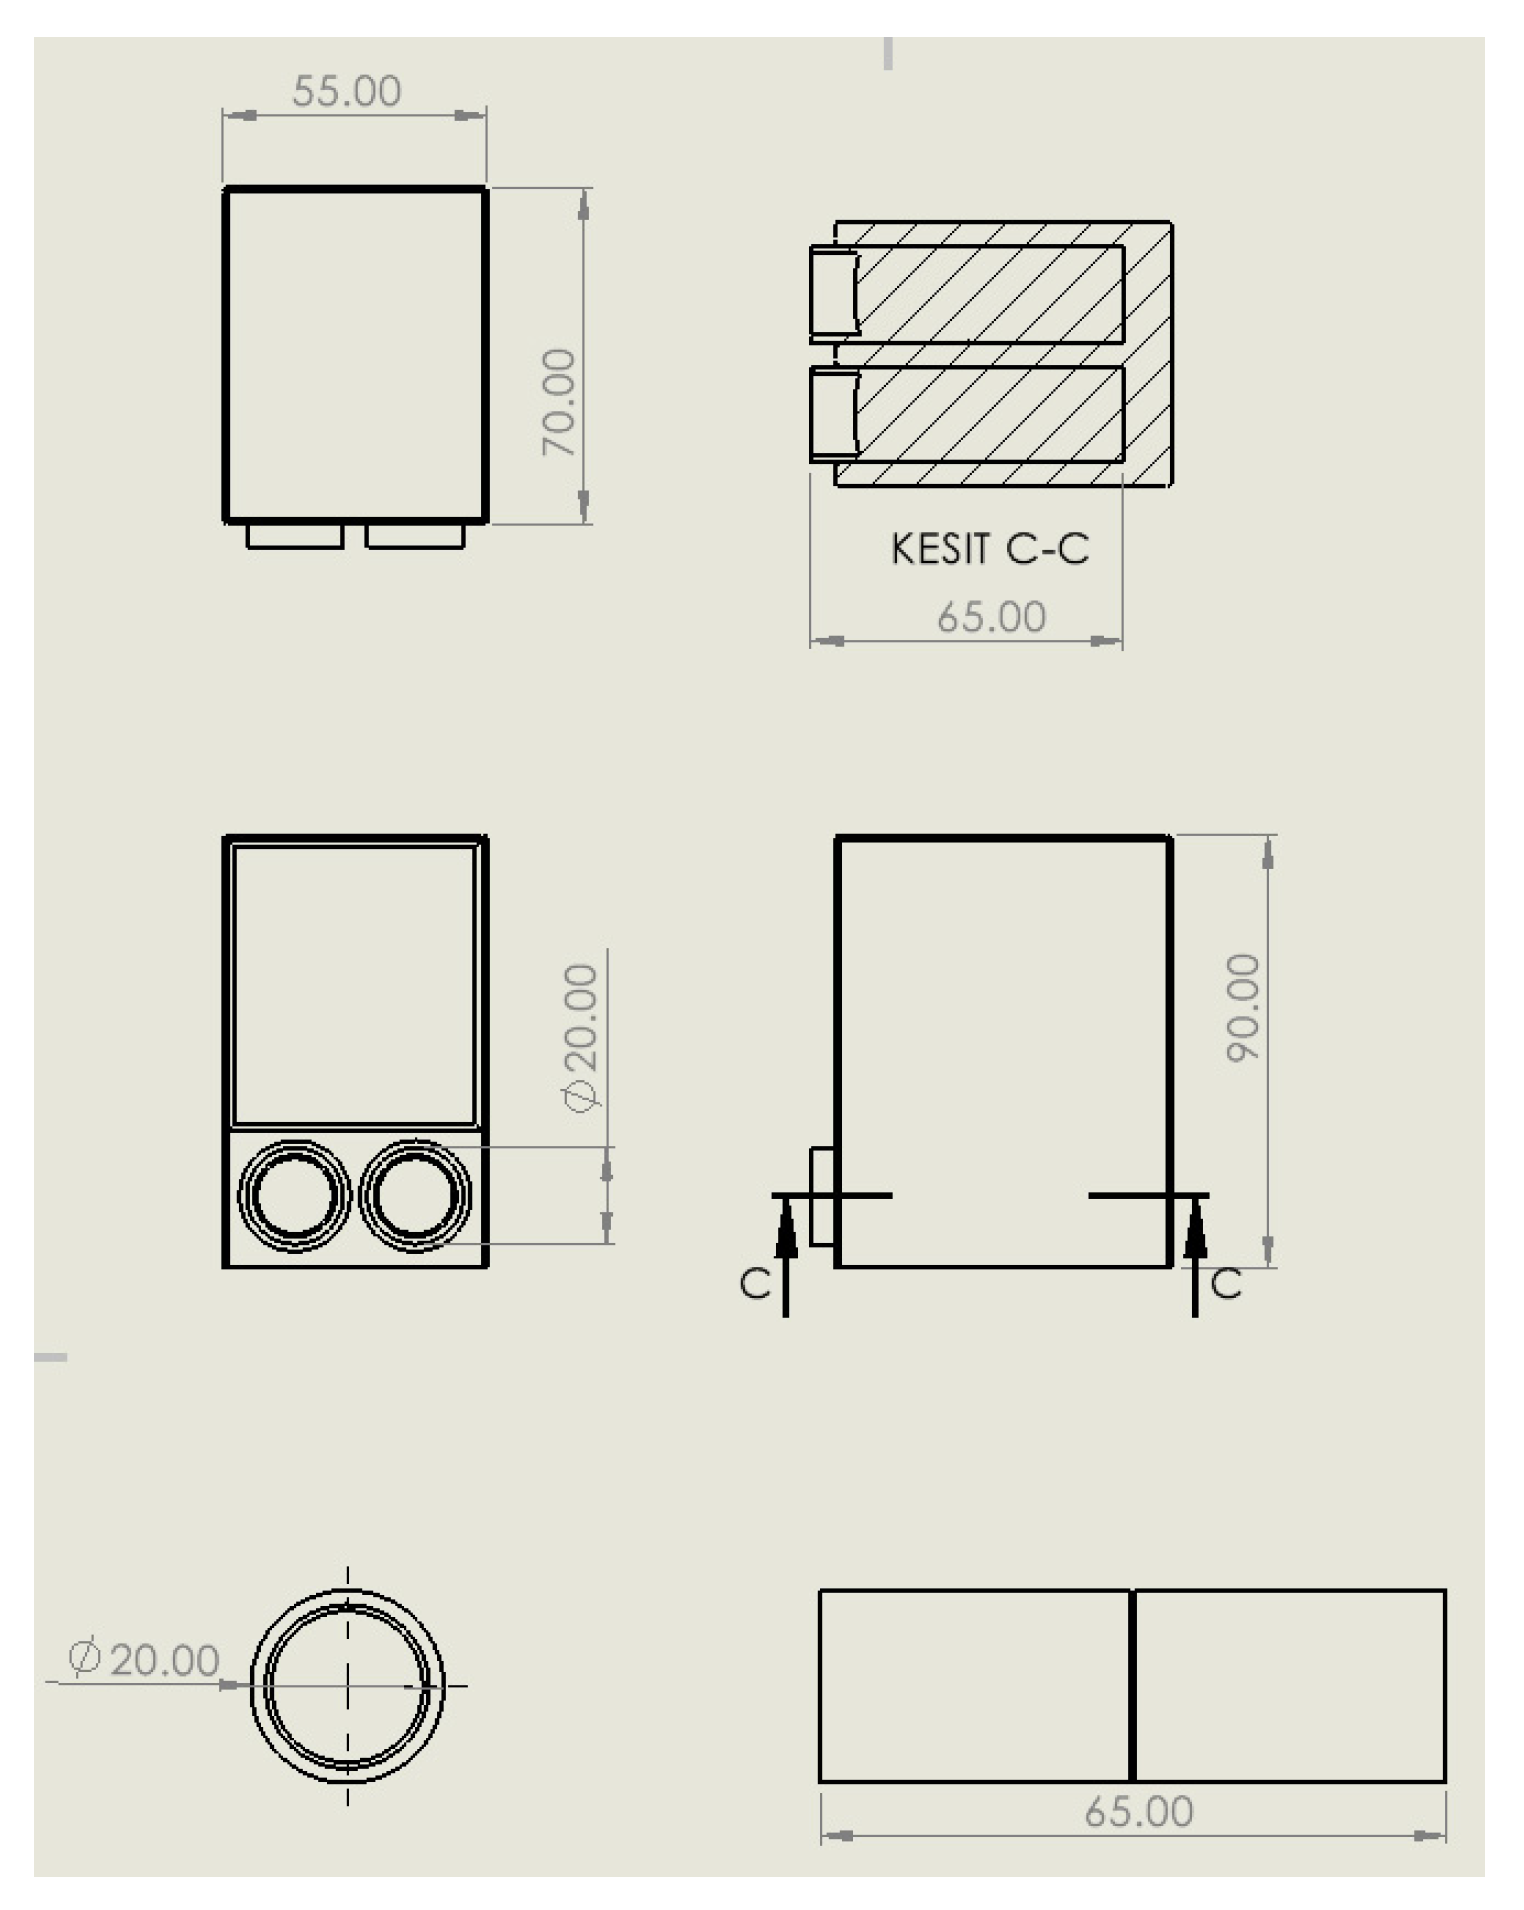
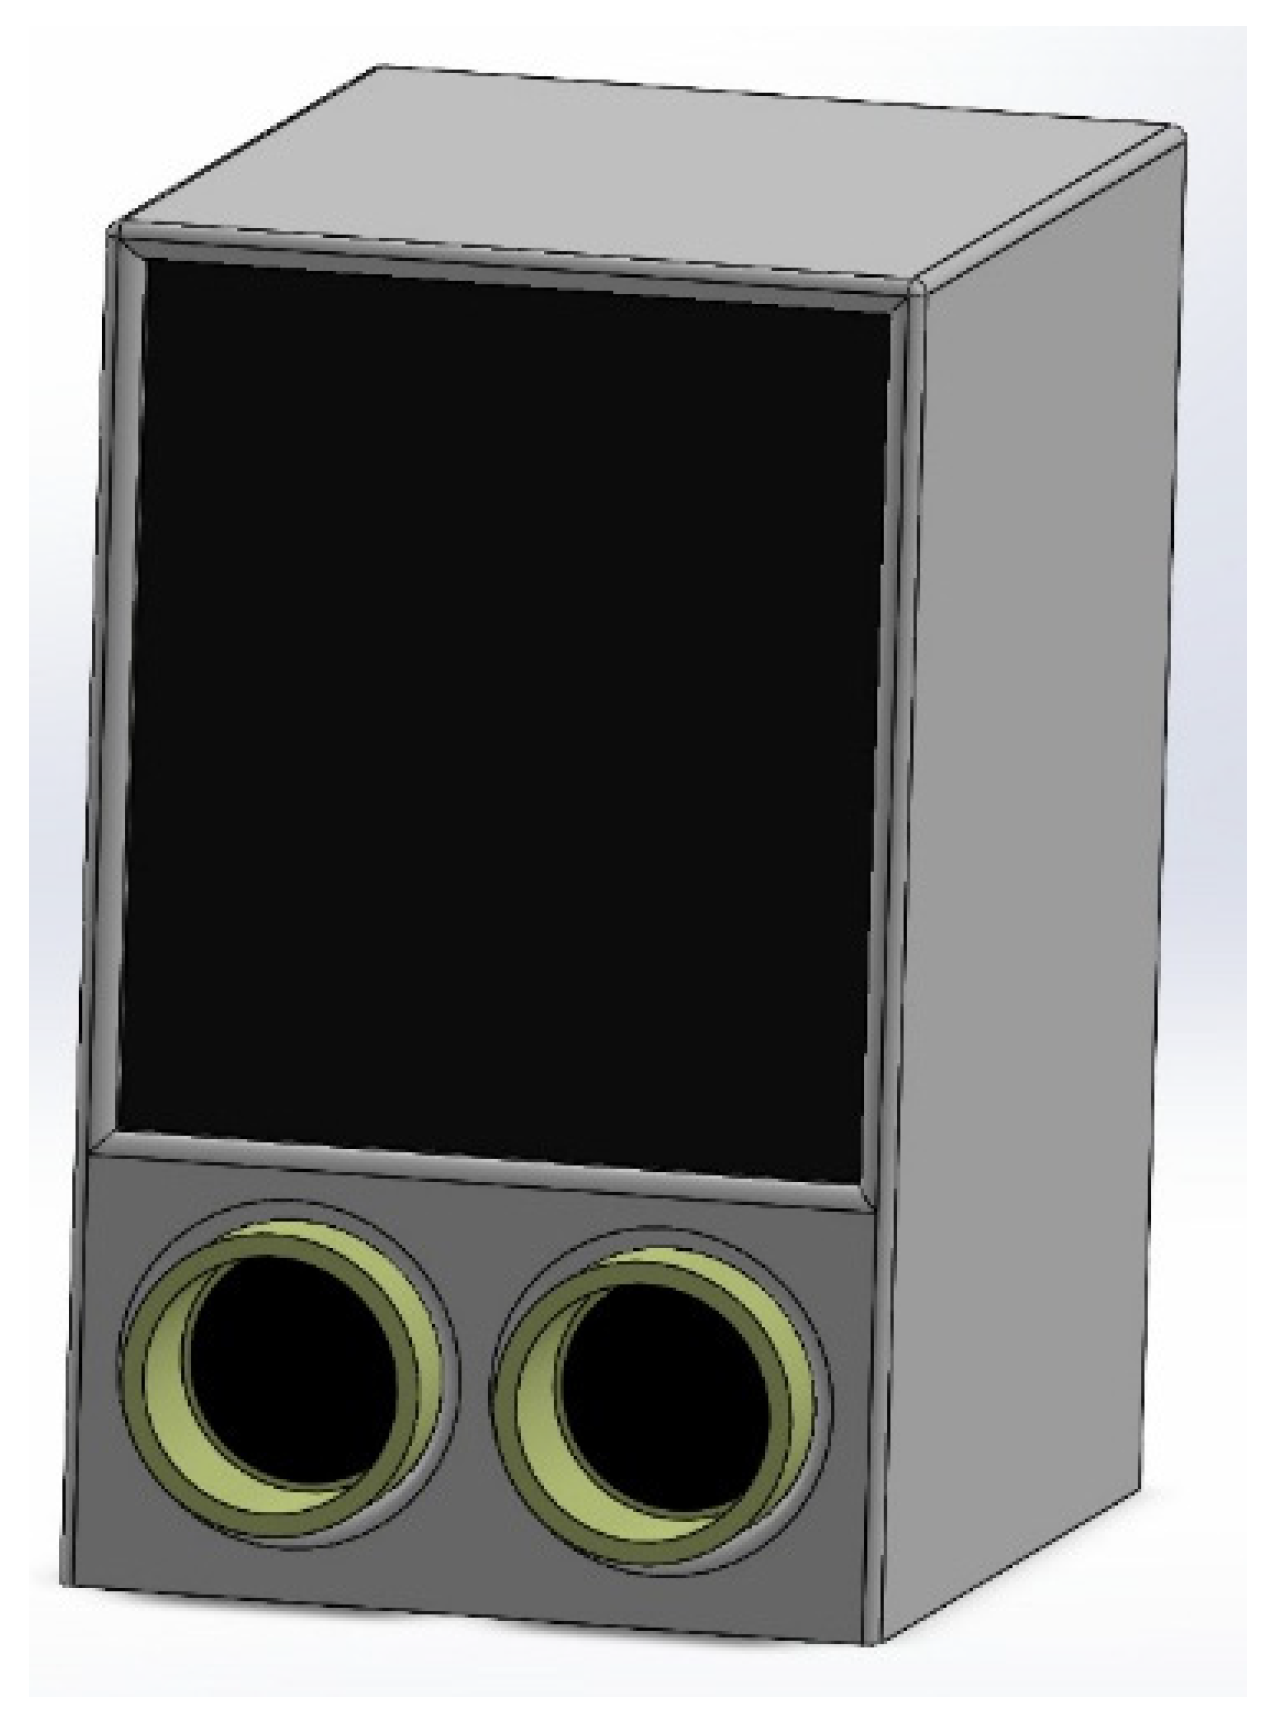
The stationary sensing module consolidates the Heimann HTPA 80 × 64 thermal sensor and an HD RGB webcam into a single enclosure (55 × 65 × 90 mm). The two camera lenses are positioned side by side at the lower front face to ensure co-aligned fields of view, while a display screen is mounted on the upper front panel to provide a real-time graphical interface showing ROI overlays, temperature readings, and the current mood prediction. The unit is intended for permanent integration alongside the HVAC indoor unit. The enclosure design and dimensional layout are illustrated in
Figure 8 and
Figure 9.
2.10.2. Wearable IR Necklace
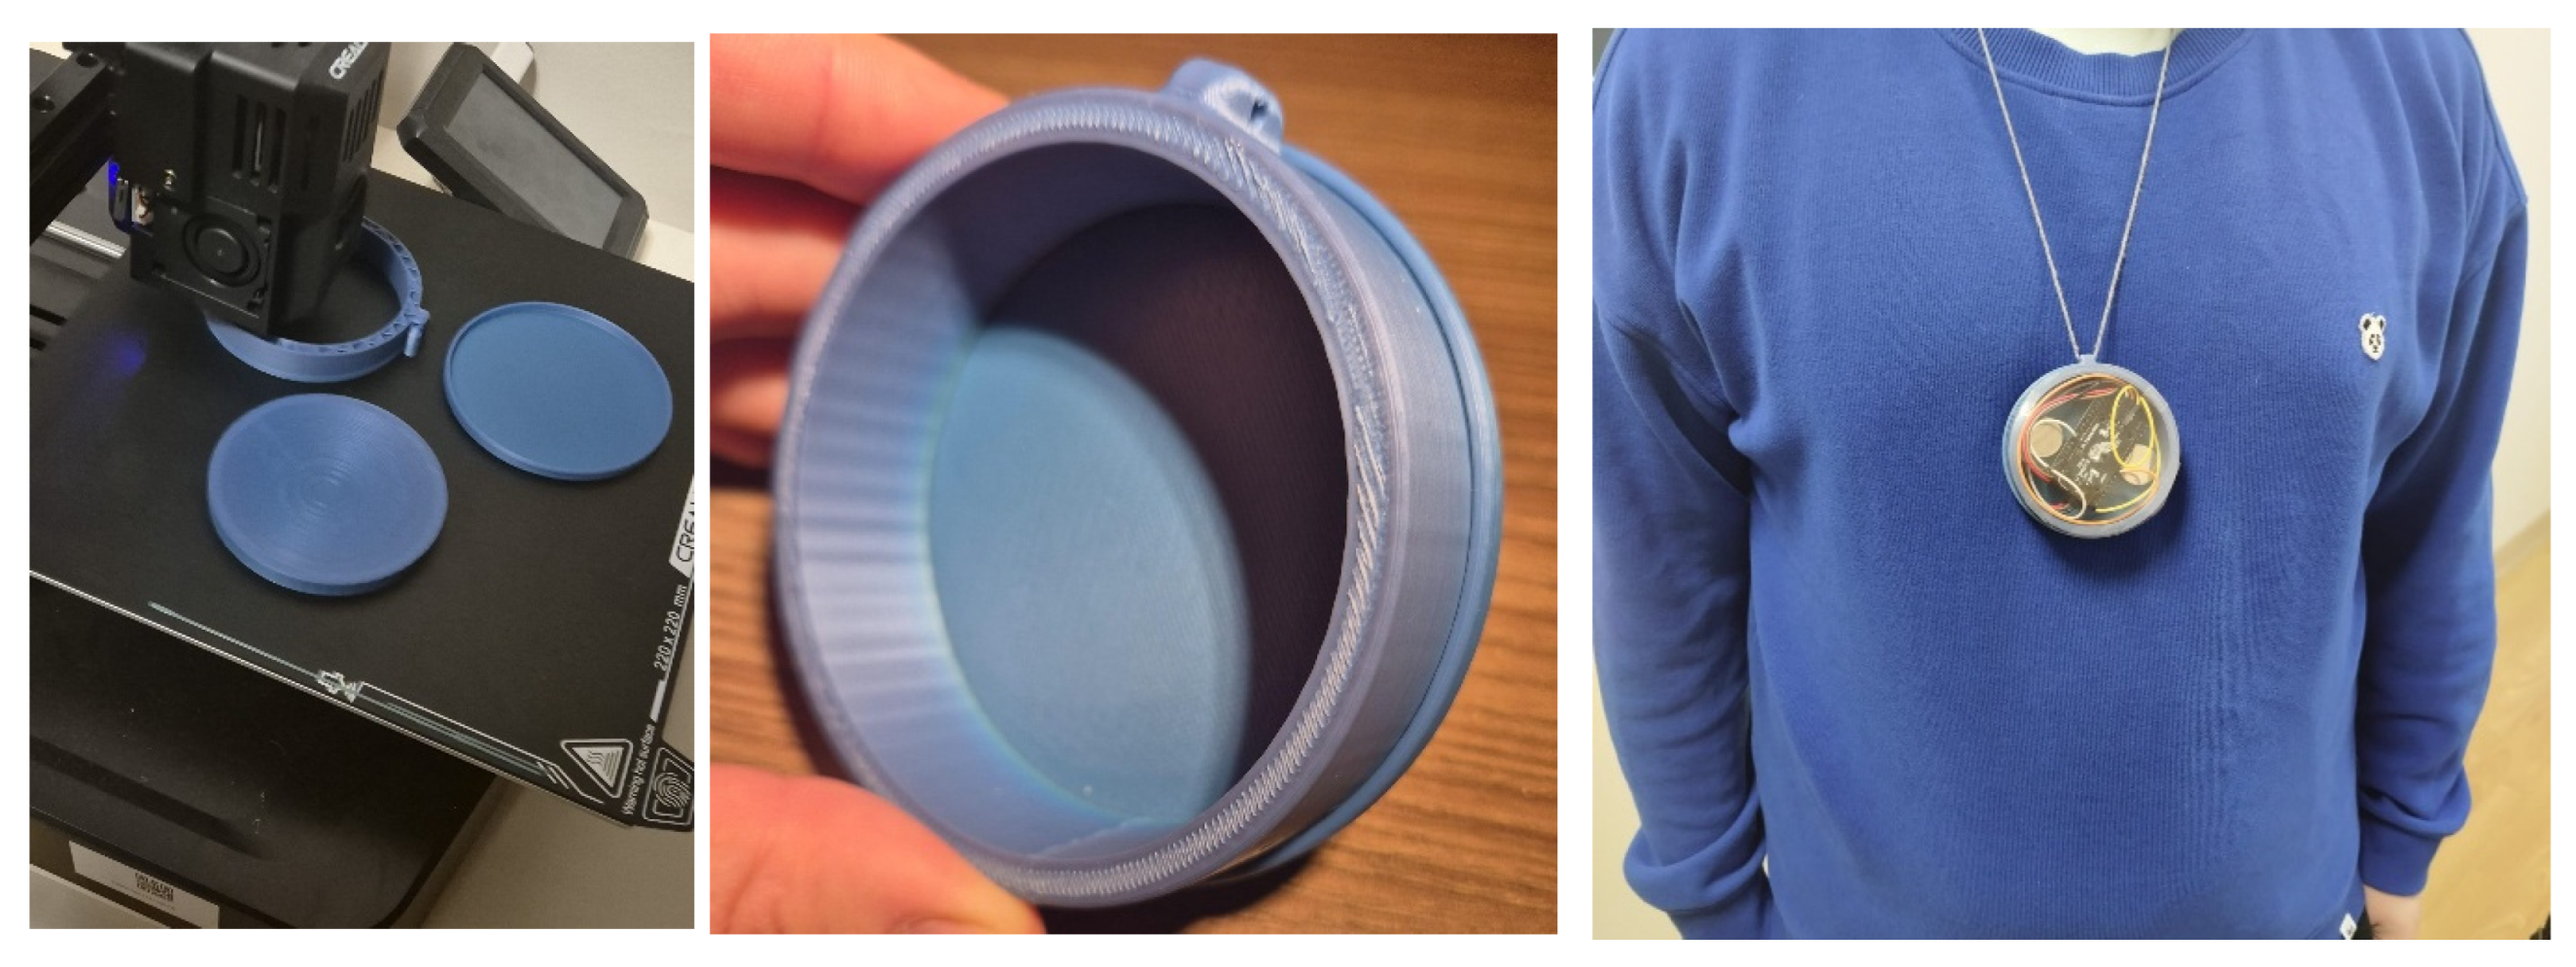
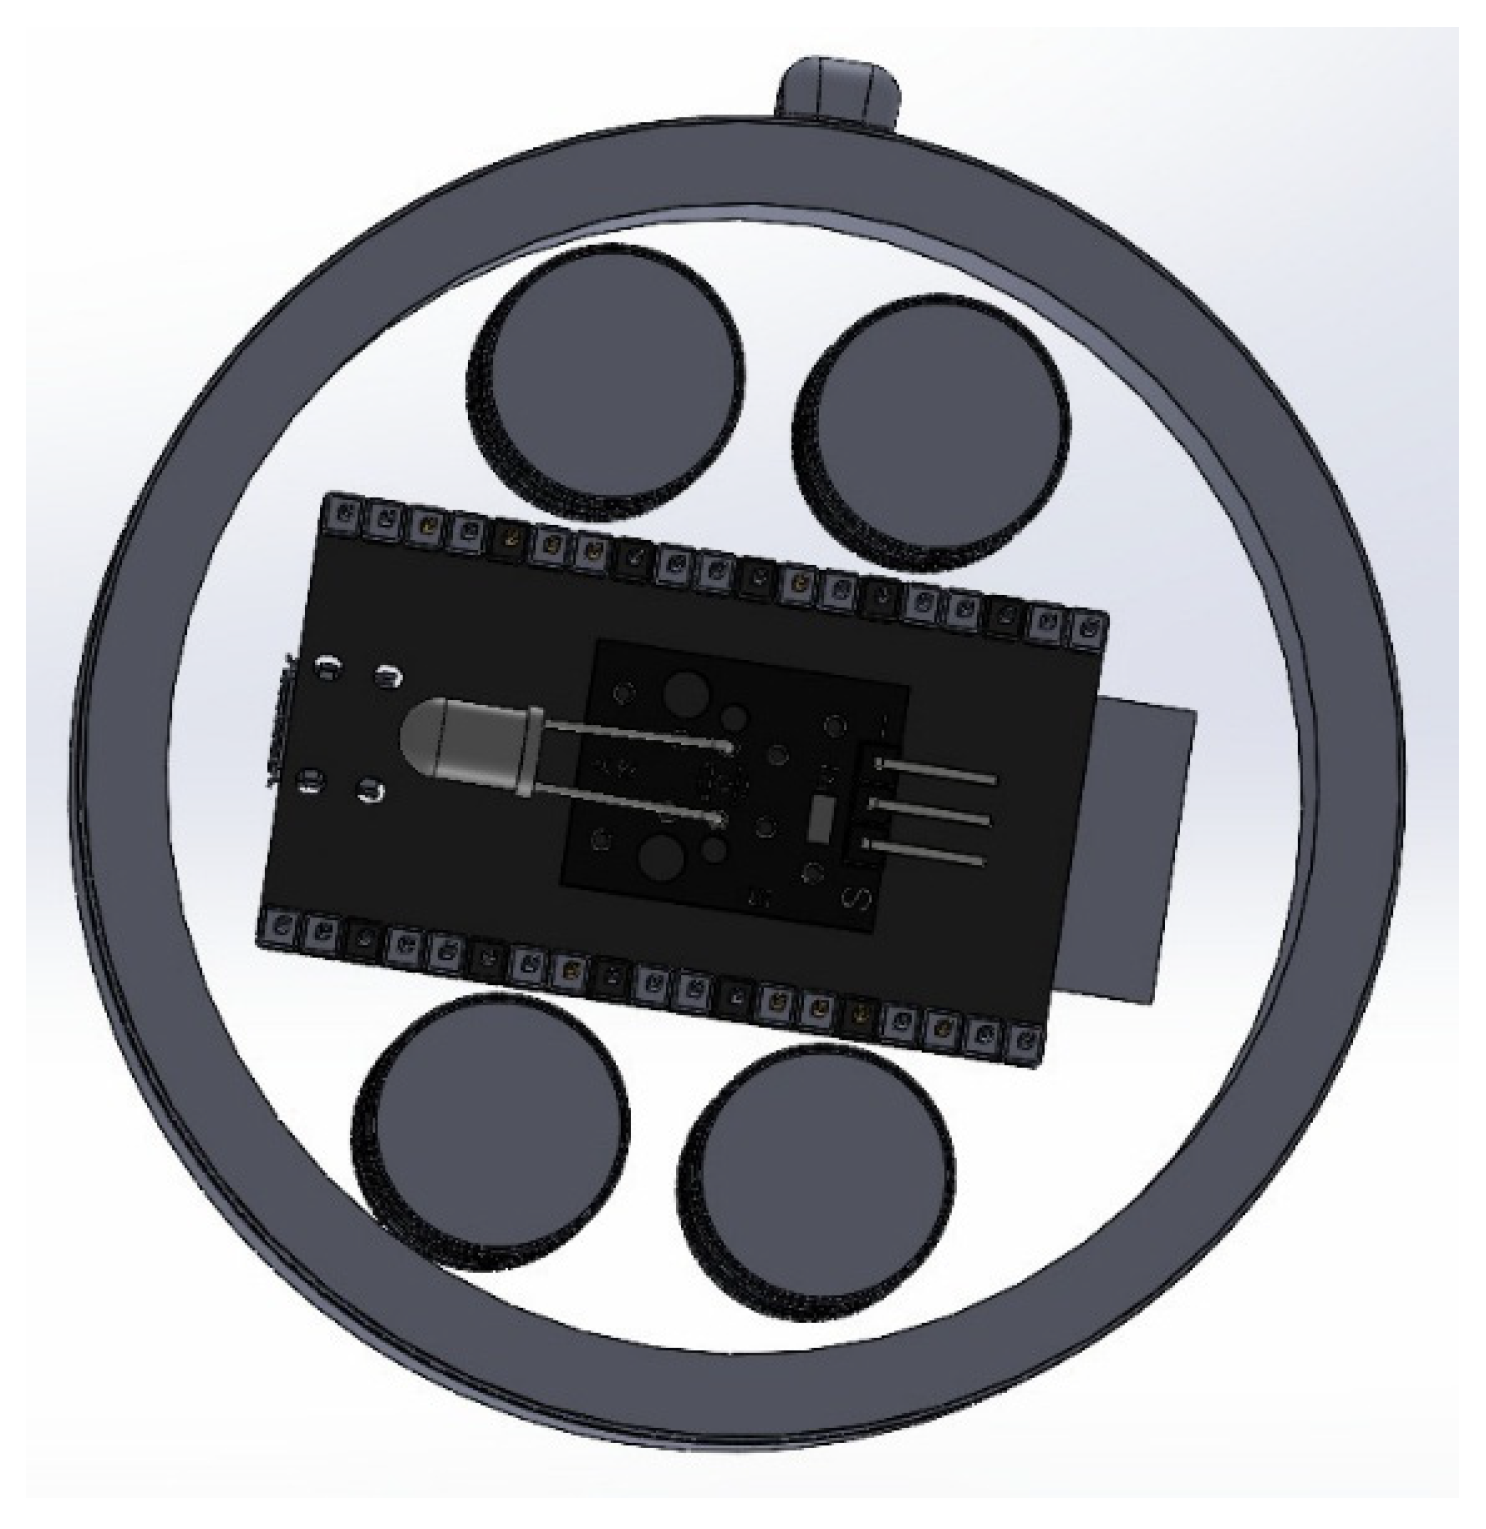
The portable control module is housed within a circular pendant designed to be worn as a necklace. The internal layout accommodates an ESP-32 microcontroller, an infrared LED transmitter directed outward toward the HVAC unit, a manual on/off switch, and a battery, as illustrated in
Figure 10.
3. Results and Discussion
This section presents the empirical findings of the study, beginning with the technical realization of the proposed mood-adaptive system and followed by an in-depth analysis of the classification performance, thermal comfort optimization and CO2 reduction in the system.
Before analyzing the AI model’s performance and energy savings, it is essential to characterize the thermal environment and the physiological baseline of the participants. A total of 34 independent participants (21 males, 13 females) were recruited for this study. During the experimental sessions, continuous high-resolution video and thermal data were recorded. From these recordings, a total of 7000 synchronized image frames were extracted (approximately 205 samples per participant) to form the dataset.
Table 8 presents the mean values and standard deviations of the thermo-hygrometric parameters and occupant-related variables recorded during the testing campaign.
As shown in
Table 8, the experimental sessions were conducted in a highly controlled environment. The average PMV value of 0.001 indicates that the thermal conditions were maintained at a nearly perfect neutral state, providing an ideal baseline for assessing mood-induced changes in thermal comfort. The average clothing insulation of 0.95 clo is consistent with typical indoor office attire, while the average BMI (23.73 kg/m
2) confirms that the participant cohort falls within a healthy and representative physiological range. All indoor measurements were performed at a height of 1.1 m, as specified by ISO 7726 [
49], to accurately capture the conditions at the occupant’s seated breathing and head level.
3.1. Prototype of the Model
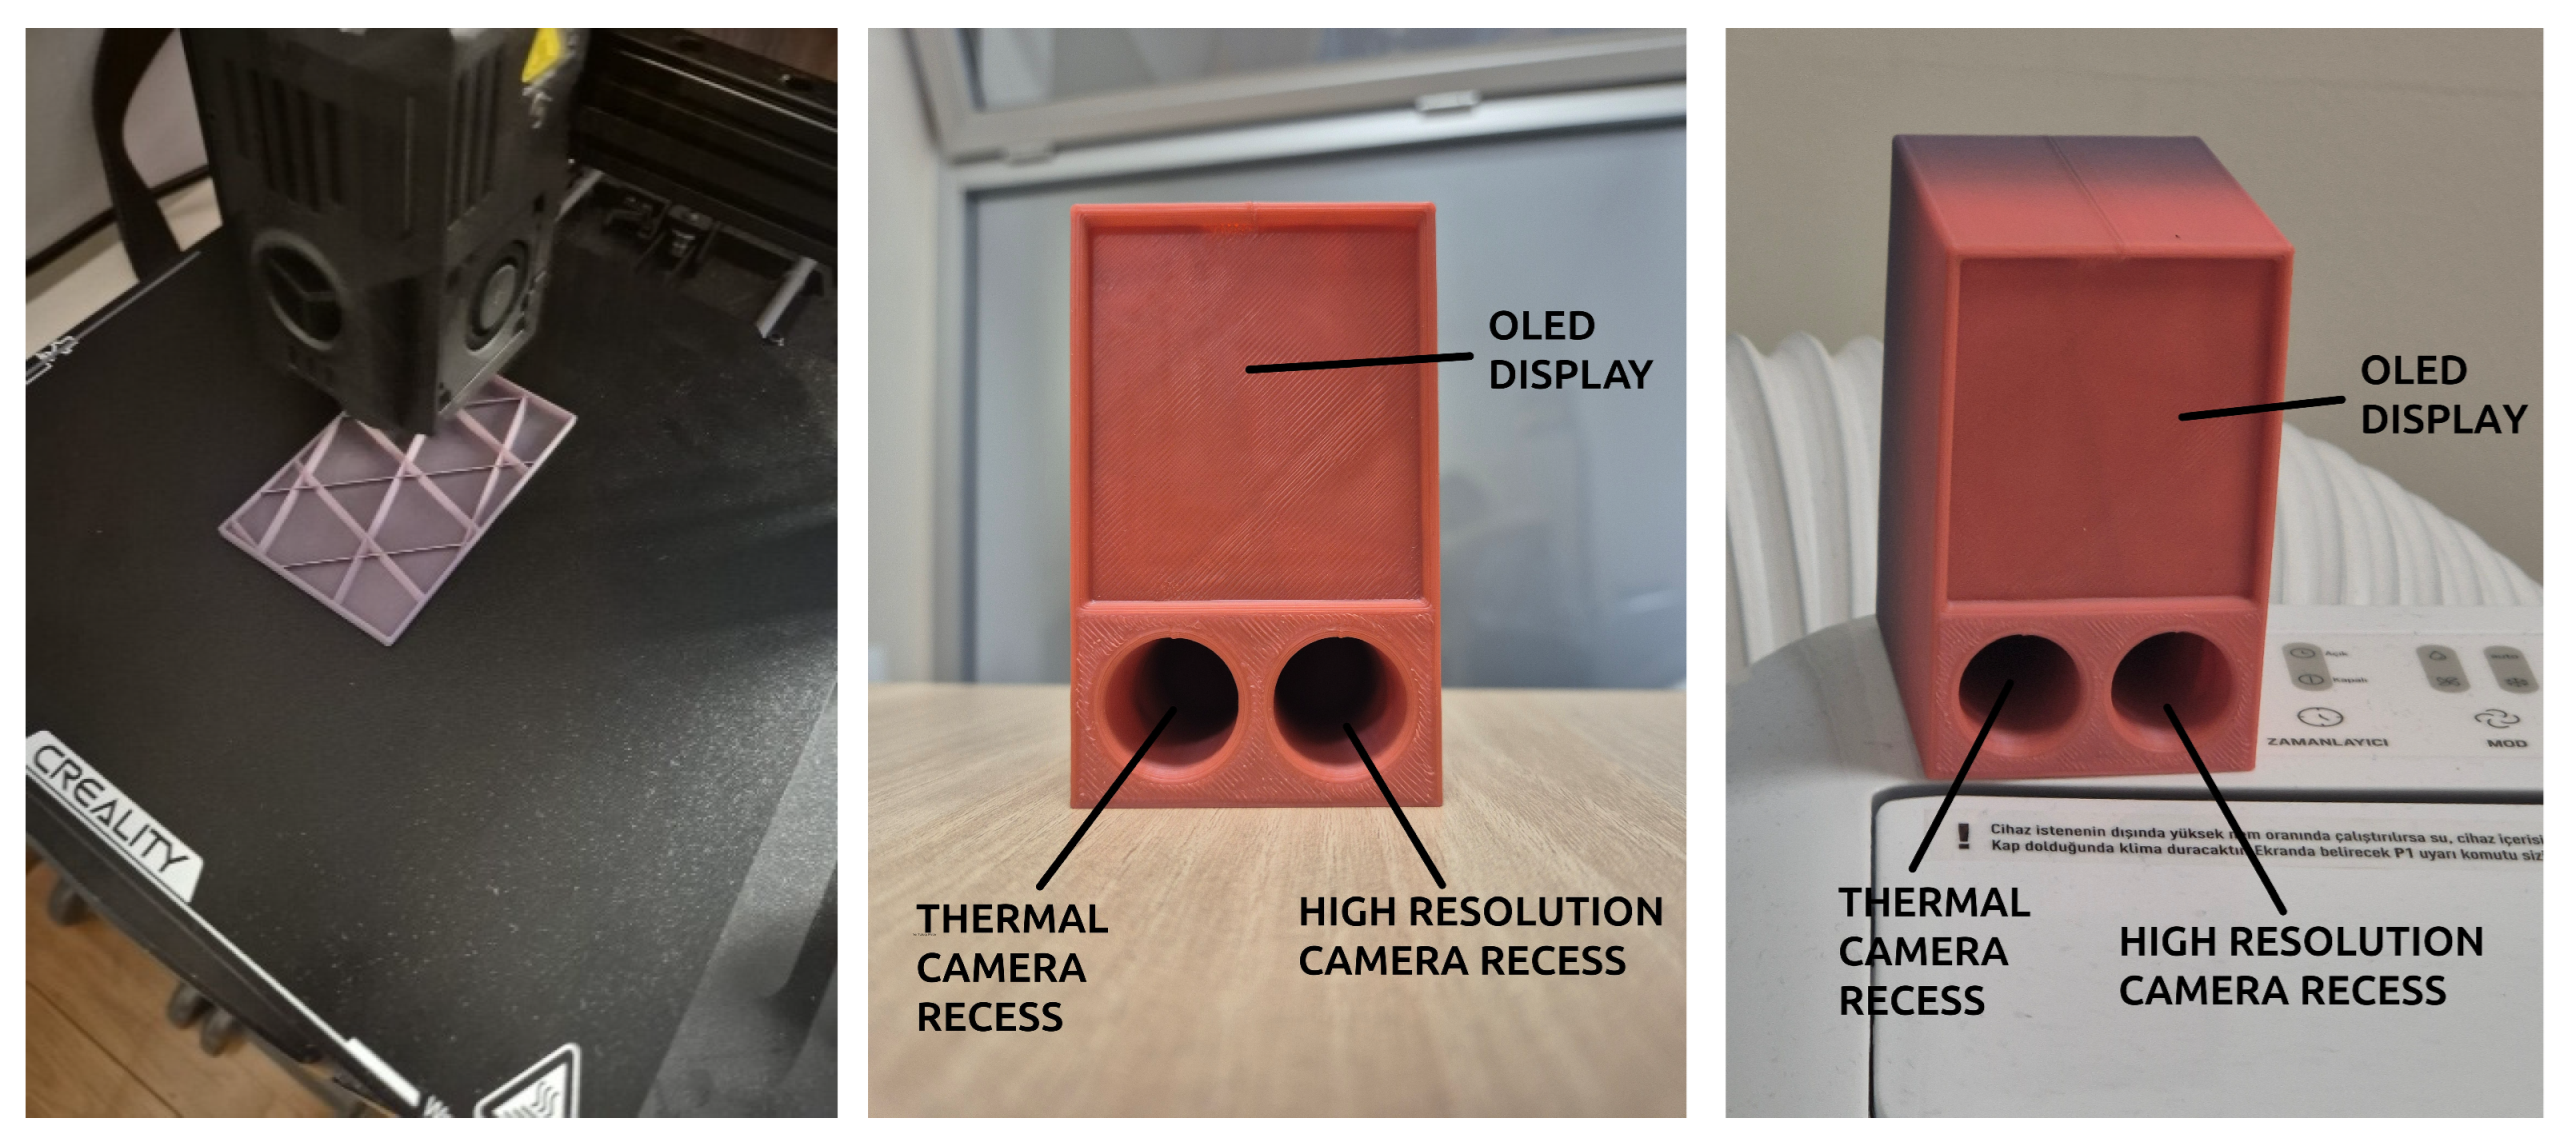
The physical prototype of the mood-adaptive HVAC control system was developed as an integrated solution comprising a stationary sensing unit and a wearable control module. To ensure a professional and compact form factor suitable for office environments, the enclosures for all hardware components were custom-designed using SolidWorks SP 1.0 CAD software and manufactured via 3D printing technology using Polylactic Acid (PLA) filaments (
Figure 11 and
Figure 12).
The stationary sensing unit serves as the primary data acquisition hub, housing a high-resolution Heimann HTPA 80 × 64 thermal sensor alongside a high-definition RGB web camera. These sensors were precision-aligned within a 55 × 65 × 90 mm 3D-printed chassis to ensure co-aligned fields of view for synchronized image processing. An integrated OLED display on the upper panel provides real-time visual feedback, including Region of Interest (ROI) tracking of the user’s face, localized temperature readings, and the current mood classification result generated by the ensemble model.
To bridge the gap between mood recognition and environmental control, a wearable “necklace” module was developed as the system’s execution interface. This module, also housed in a 3D-printed ergonomic casing, contains an ESP-32 microcontroller, a lithium-polymer battery, and an infrared (IR) LED transmitter. Upon receiving a processed mood signal from the central workstation via a local network, the wearable module broadcasts the corresponding IR codes to the HVAC unit to adjust the thermal setpoints. The use of 3D printing allowed for a lightweight, non-intrusive design that enables the user to carry the control interface comfortably while maintaining a direct line-of-sight between the IR transmitter and the air conditioning unit for reliable command execution.
3.2. CNN Model Performance
The performance of the CNN based sentiment prediction model was measured using a participant based cross validation method to assess its participant independent generalization ability. The model achieved a total classification accuracy of 72% across the six mood state categories based on POMS. The class-wise recognition accuracies of the CNN-based mood prediction model are presented in
Table 9.
Performance is stronger in high arousal states, particularly those involving pronounced facial muscle activation. Specifically, the categories of Vitality and Anger were effectively captured by convolutional feature hierarchies. Confusion showed moderate recognition performance. Lower accuracy rates observed in the Depression, Tension, and Fatigue categories stemmed from more subtle and less distinctive facial features characteristic of low arousal states.
Neutral expressions achieved 91% recognition accuracy, highlighting the known difficulty in distinguishing neutral faces from low-intensity mood states. Confusion matrix analysis showed limited overlap between high arousal and low arousal negative categories, suggesting that arousal intensity emerges as a key distinguishing dimension in the learned representational space.
The overall 72% accuracy rate indicates stable inter-participant generalization performance and demonstrates that CNN-based face coding can approximate psychometrically based mood constructs with significant reliability. This result supports the integration of the system into real-time psychology adaptive HVAC control systems.
3.3. ANN Model Performance
The performance of the Artificial Neural Network (ANN), designed to classify mood states from thermographic features, was rigorously evaluated using a 5-Fold Group K-Fold Cross-Validation approach. This method was specifically chosen to ensure that the model’s predictive power remains consistent across different individuals, preventing data leakage by ensuring that the same subject’s data does not appear in both the training and testing sets simultaneously.
The statistical summary of the cross-validation performance is presented in
Table 10. The model achieved a Mean Accuracy of 0.6833 (±0.0171) and a Macro F1-Score of 0.6781 (±0.0176). The low standard deviation across the five folds indicates that the ANN is highly stable and demonstrates strong generalization capabilities across diverse physiological profiles. A significant highlight of the model’s performance is the Top-2 Accuracy of 0.9011. This metric indicates that in over 90% of the cases, the correct mood state is within the model’s top two probability predictions.
3.4. Ensemble Model Validation and Fusion Results
The validation results derived from a systematic ablation study comparing various weighting configurations (e.g., 50/50 and 70/30) confirmed that the 60/40 weighting ratio effectively balances the high-frequency sensitivity of visual data with the high fidelity reliability of thermal data. By integrating these two streams, the system achieves an overall accuracy of 75% (outperforming other tested ratios), which ensures that the subsequent HVAC control commands are triggered by an authentic representation of the occupant’s mood state. This level of precision is critical for the decarbonization goals of the study, as it prevents erroneous temperature adjustments that would lead to unnecessary energy expenditure.
The fusion approach, utilizing a weighting ratio of 60% ANN and 40% CNN, effectively balances the high frequency sensitivity of visual data with the high precision and reliability of thermal data. The validation results were derived from a systematic ablation study comparing various weighting configurations (e.g., 50/50 and 70/30). By integrating these two data streams, the resulting fusion outputs achieved an accuracy of 75% (outperforming other tested ratios), on test data obtained from 8 different participants. This performance level allows HVAC control decisions to reflect the user’s mood state more realistically. Furthermore, this degree of accuracy is of critical importance regarding decarbonization goals, as it contributes to preventing unnecessary energy consumption by reducing erroneous temperature adjustments.
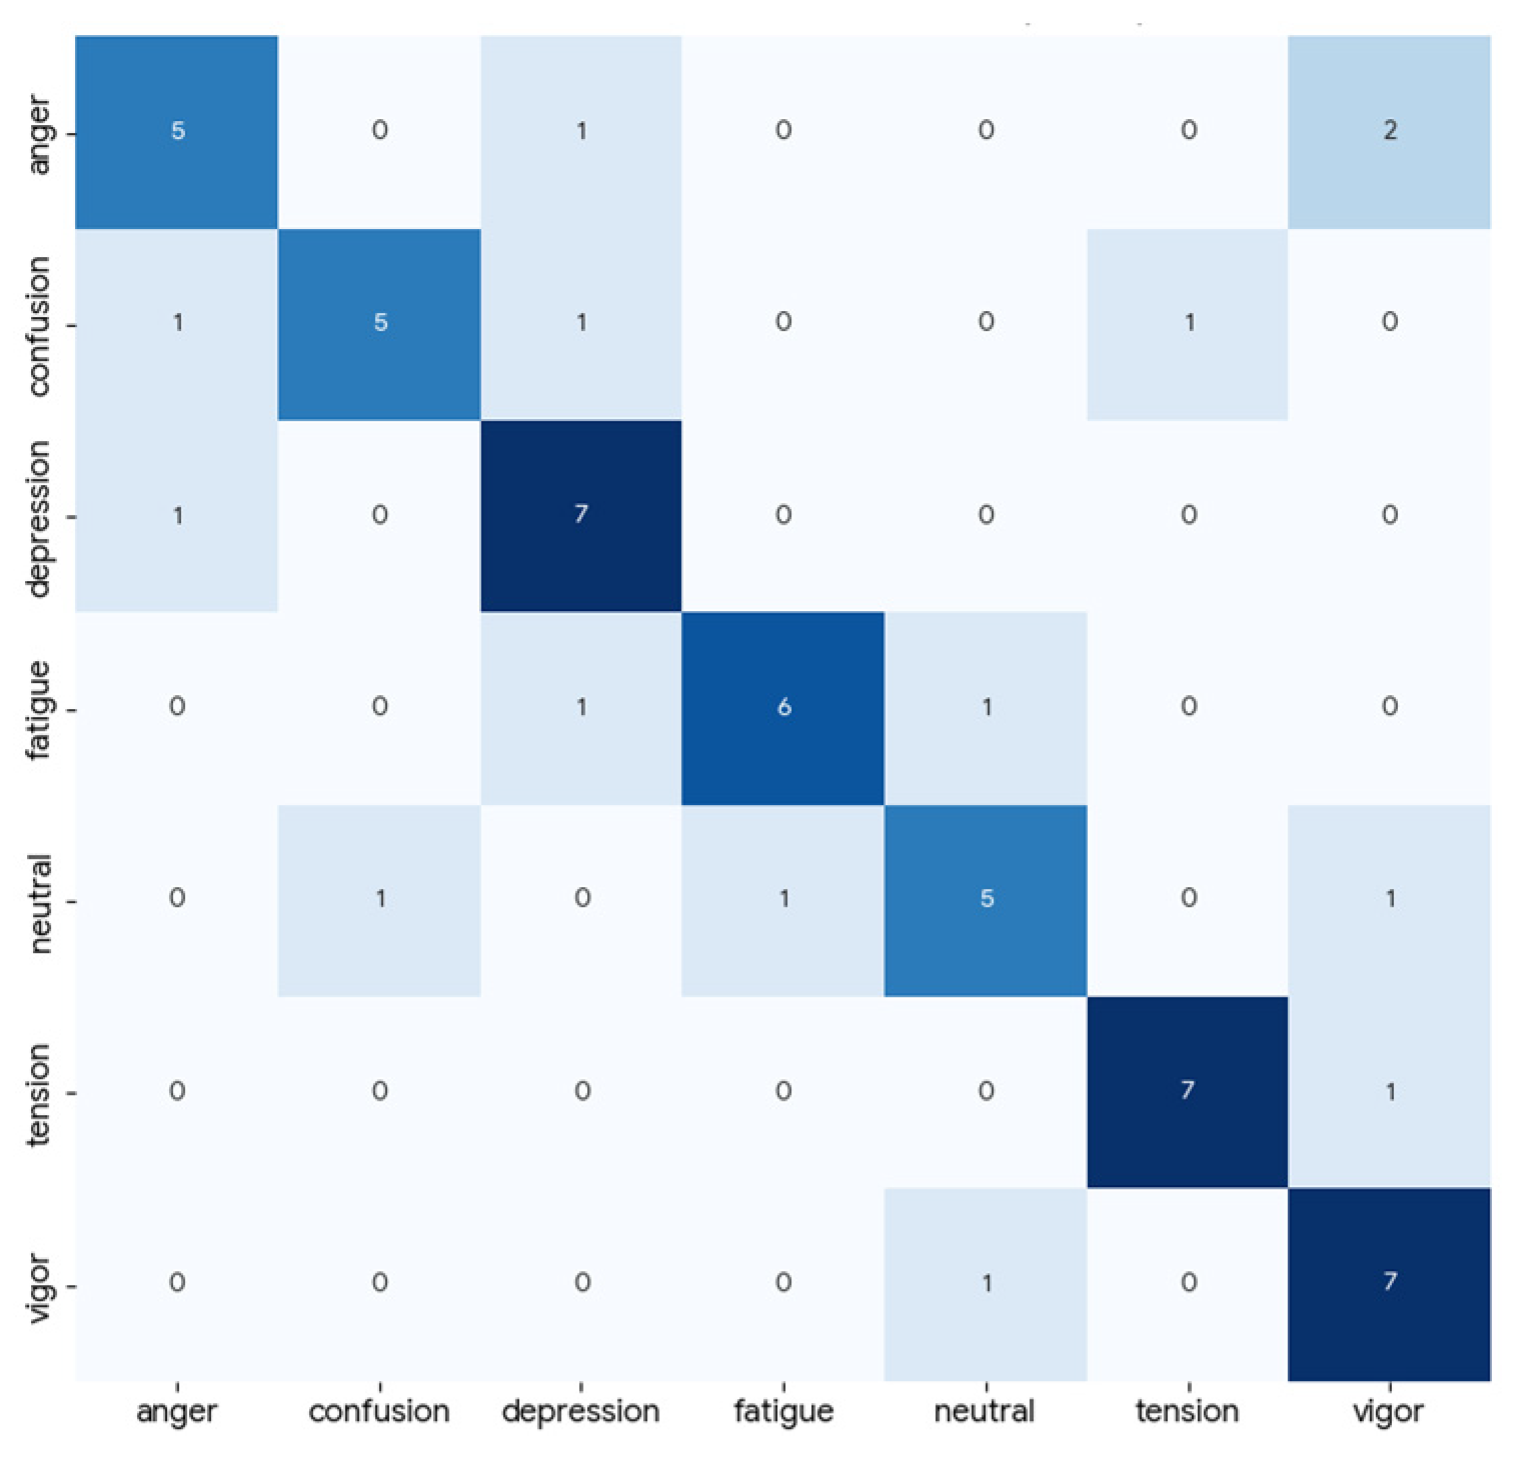
The resulting confusion matrix provides a detailed overview of the model’s class-based performance and error patterns. Upon examining the results, a high accuracy rate was observed, particularly in the depression class (7 correct classifications), with minimal overlap with other categories, as it is seen in
Figure 13. Conversely, more frequent inter-class transitions were noted within the anger and confusion classes. For instance, some samples from the anger class were misidentified as other categories; similarly, a limited degree of misclassification was observed within the confusion class.
Overall, it is evident that while the fusion model can distinguish specific mood states with high accuracy, limited overlaps persist due to shared characteristics between certain classes. While this indicates that the multimodal fusion approach enhances performance, it also highlights the potential for further improvement, particularly in differentiating between similar mood states.
3.5. Thermal Comfort and HVAC Decarbonization Results
The experimental results conducted in the climate chamber under Ankara’s climatic conditions demonstrate that the mood-adaptive HVAC control strategy significantly outperforms conventional fixed-setpoint operations in terms of energy efficiency (
Table 11). The experimental campaign was strategically designed to capture the system’s performance across two distinct climatic extremes of Ankara, Türkiye. To ensure a comprehensive evaluation of the mood-adaptive HVAC control, measurements were conducted during both the peak heating and cooling seasons of the 2025–2026 period. Measurements were carried out between 15 July and 30 August 2025, for the cooling season and between 5 January and 20 February 2026, for the heating season. While the conventional system recorded an average daily energy intensity of 0.233 kWh/m
2·day during the monitored periods, the proposed model reduced this consumption to 0.188 kWh/m
2·day. This reduction corresponds to a 19.3% net energy saving over the observed cooling and heating cycles. The primary driver of this efficiency is the system’s ability to relax thermal setpoints during “neutral” or “relaxed” mood states, preventing over-cooling or over-heating when the occupant’s metabolic and psychological requirements do not necessitate intensive HVAC intervention.
The implications of these energy savings are directly reflected in the building’s carbon footprint. By applying the national grid emission factor for Türkiye (approximately 0.45 kg CO2/kWh), the environmental impact of the system was quantified. The transition from conventional to mood-adaptive control resulted in a reduction in average daily CO2 emissions from 0.105 kg/m2 to 0.084 kg/m2 during the monitored periods. This represents a total decarbonization gain of 20.0%, effectively preventing approximately 0.021 kg of CO2 emissions for every square meter of office space daily. This reduction highlights the system’s immediate environmental impact during peak-load operational cycles.
Furthermore, these environmental gains were achieved without compromising occupant well-being. On the contrary, the thermal comfort analysis showed a substantial improvement, with the thermal dissatisfaction (TSV(%)) occupants dropping from 12% to below 5%. The fact that the system achieves nearly 20% carbon reduction while simultaneously enhancing thermal satisfaction by over 58% underscores the potential of integrating behavioral and physiological modeling into the next generation of smart building management systems.
3.6. Limitations and Discussions
The integration of thermal imaging with visual-based mood recognition marks a significant step toward more robust and honest human-building interfaces. By assigning a higher weight (60%) to the ANN-processed thermal data, this study successfully mitigated the common pitfall of visual-only systems: the susceptibility to volitional facial masking. However, during the experimental phase, it was observed that the system’s performance is sensitive to the user’s distance from the sensors. While the RGB camera maintained high detection rates at varying distances, the thermal sensor’s accuracy in identifying specific regions of interest (ROI), like the perinasal area, decreased as the distance increased due to the sensor’s resolution limits. This suggests that for large-scale office applications, a multi-sensor array or higher-resolution thermal optics might be necessary to maintain consistent accuracy across a larger workspace.
Another critical point of discussion involves the physiological latency of thermal responses. Unlike facial expressions, which are near-instantaneous, subcutaneous blood flow changes and subsequent skin temperature shifts occur with a slight delay after a mood stimulus. In our experiments, this latency was partially compensated by the 15 min HVAC adjustment cycles, which align well with the thermal inertia of indoor environments. Nevertheless, external factors such as the consumption of hot or cold beverages, intense physical activity prior to measurement, or the use of eyeglasses, which are opaque to infrared radiation, can temporarily obscure thermal readings. These “noise” factors represent a challenge for all thermographic behavioral models and highlight the necessity of the hybrid (Ensemble) approach, where the CNN can provide backup data when thermal signals are compromised.
On the other hand, the fixed sequence used during the emotion induction experiments may be considered as another limitation of this study. While a structured order was adopted for practical consistency, the absence of randomization may have introduced order or fatigue effects, potentially affecting the purity of the emotional labels. Although the 15 min adaptation intervals between sessions were intended to mitigate emotional carryover, future research should employ counterbalanced designs to further validate the generalizability of these mood-adaptive responses.
It is vital to emphasize that despite its high accuracy under controlled conditions, the system’s robustness in complex real-world scenarios remains to be fully quantified. Practical factors such as facial occlusions (e.g., eyeglasses), varying head poses, and changes in camera-to-subject distance may influence the individual performance of the CNN and ANN models. However, the multimodal fusion strategy employed in this study serves as an inherent stabilizer; for instance, thermal physiological signatures can still be captured even when visual facial expressions are partially obscured. Future research should focus on stress-testing the system under diverse lighting and multi-person settings to further enhance its engineering feasibility for long-term office deployment.
From a broader perspective, the impact of mood-adaptive HVAC control on building decarbonization is promising. By shifting the control logic from a rigid, thermostat-driven “set-and-forget” model to a dynamic, occupant-centric one, significant energy savings can be achieved without sacrificing comfort. For instance, reducing the cooling load when a user is in a “neutral” or “relaxed” state, while prioritizing cooling only during “stressed” or “high-arousal” states, minimizes unnecessary energy expenditure. Future research should focus on longitudinal studies to quantify the cumulative carbon footprint reduction in multi-occupant office settings, as well as exploring the ethical implications of continuous physiological monitoring in the workplace to ensure user privacy and data security.
It is important to note that the proposed mood-adaptive system is based on a dynamic machine learning framework where each test input effectively functions as a training instance. This continuous learning capability ensures that the model can evolve beyond the initial experimental constraints. While the current study focuses on individual office workers, the system’s ability to autonomously update its parameters suggests high adaptability for diverse and larger-scale office environments in the future.
From an economic perspective, the 19.4% reduction in HVAC energy consumption represents a significant operational saving (OPEX) that justifies the initial investment in thermal sensing and AI processing hardware. Unlike static control systems, the proposed Mood-Adaptive System functions as a continuous learning framework where each operational cycle serves as a training input, iteratively refining the energy-comfort balance without requiring additional capital expenditure (CAPEX) for manual recalibration. This self-evolving nature ensures a competitive payback period, which is further shortened when considering indirect financial benefits such as enhanced occupant productivity and alignment with carbon tax mitigation strategies. By integrating psychological well-being into energy management, the system provides a holistic return on investment (ROI) that supports the long-term economic and environmental sustainability goals of modern office decarbonization.




 ,
,