Seasonal and Botanical Influences on External Thermal Performance near Green Façades: CFD Simulations on a Reference Building Envelope in a Humid Temperate Climate



Abstract
1. Introduction
1.1. LAI for Green Façade Performance
1.2. Leaf Temperatures and Foliage Thickness
1.3. Botanical Species Evaluation for Wall Climbers
2. Aim and Scope
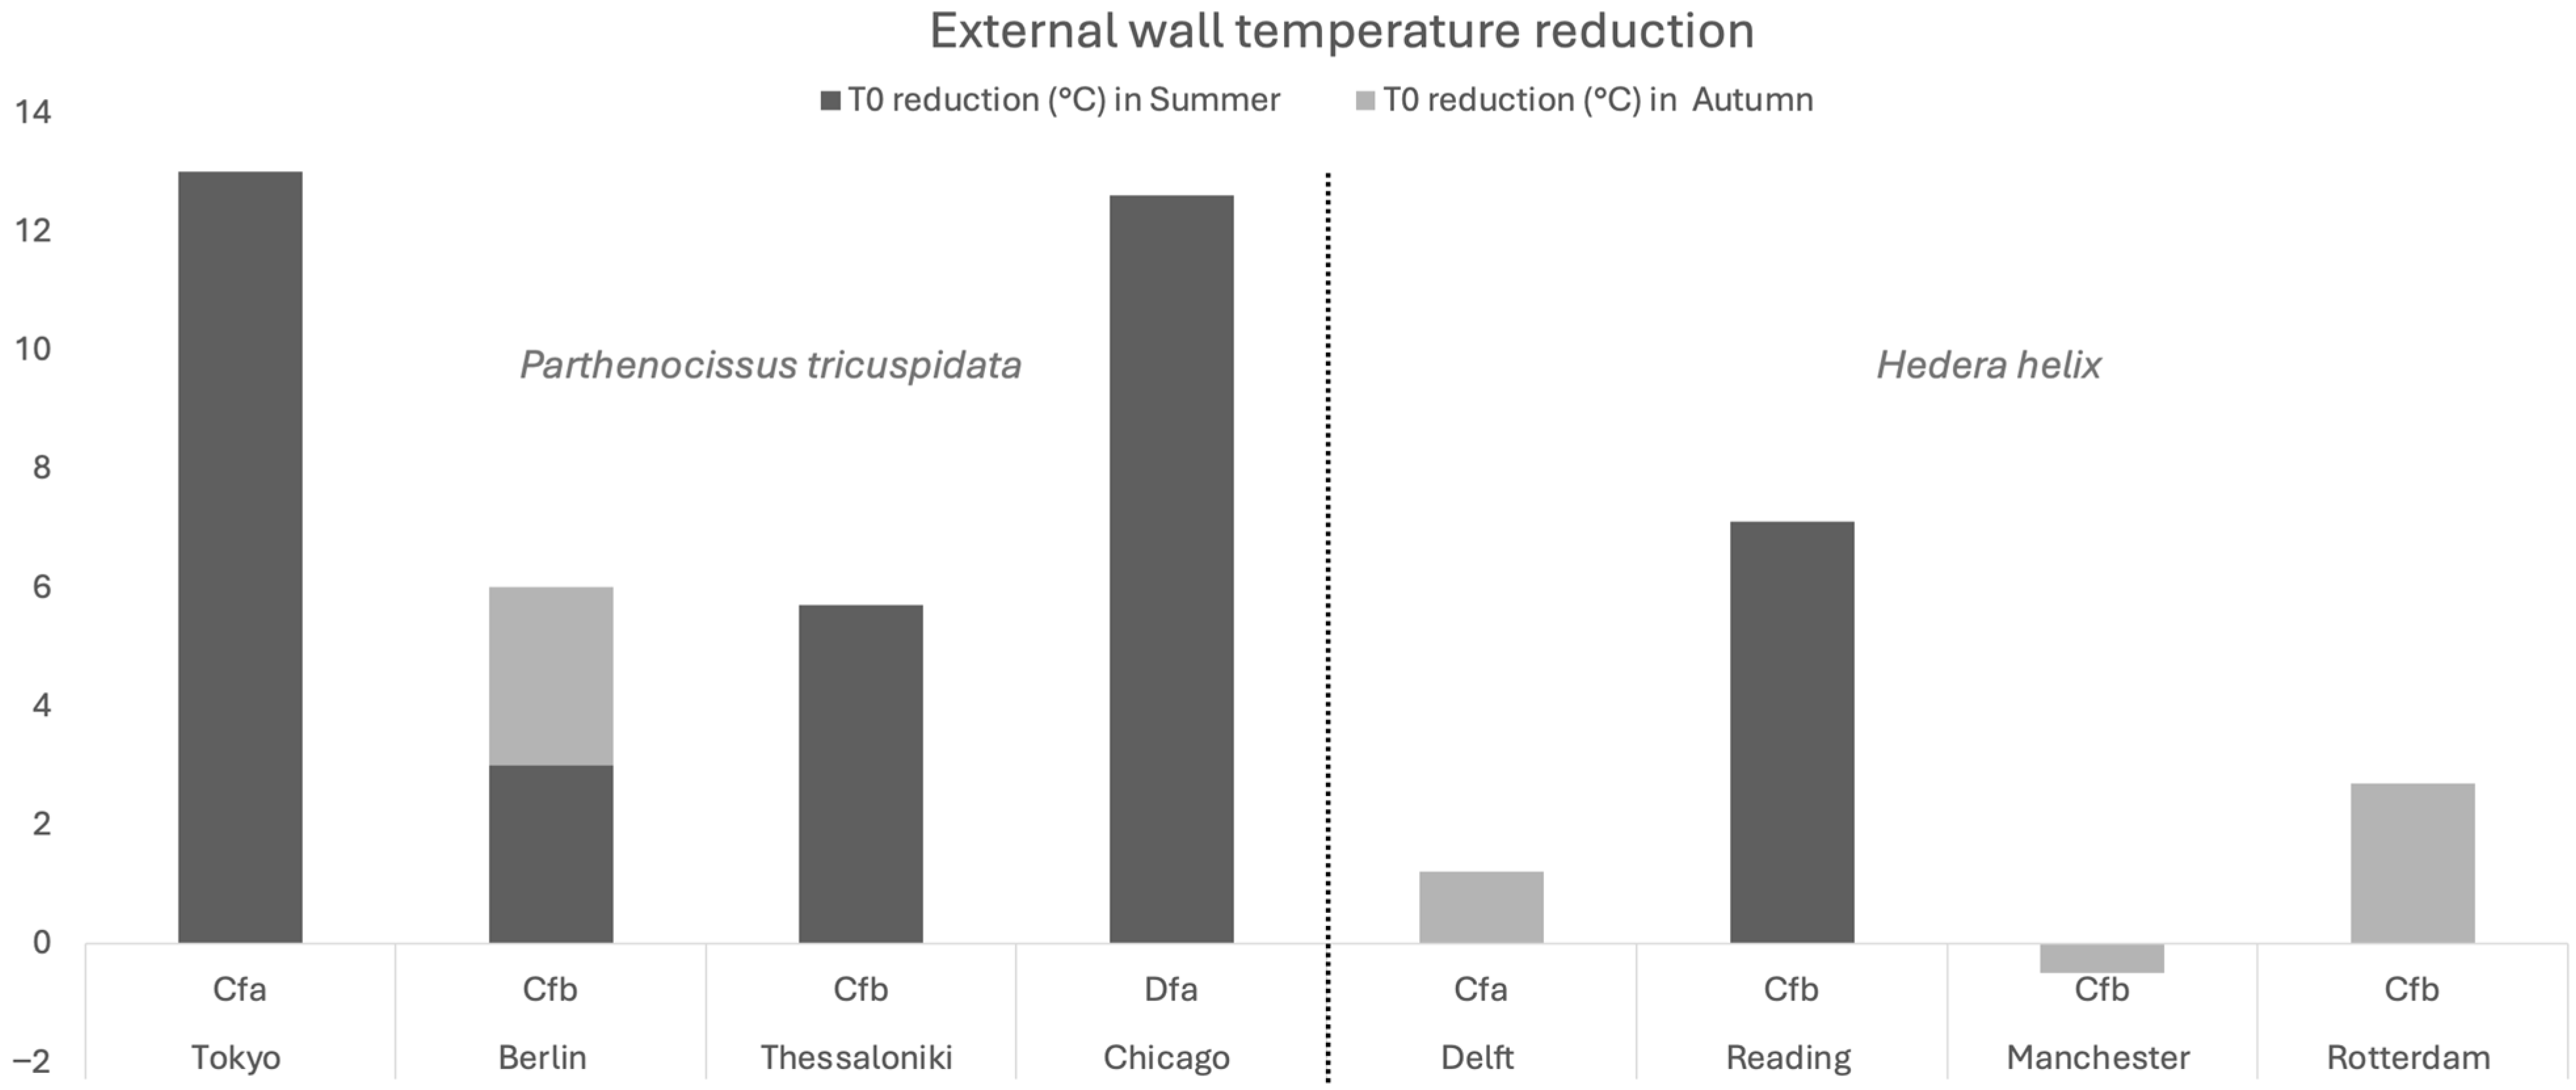
- Quantify the outdoor surface-wall temperature (T0) reduction (absolute difference in °C) provided by the two selected species at different phenological stages across four wall orientations, compared to a bare wall.
- Identify which plant species and foliage density are most effective in reducing wall-surface temperature (T0) across four orientations during the four selected periods.
- Analyze the wall temperature profile after sunset during summer to determine whether green façades retain heat or facilitate heat dissipation.
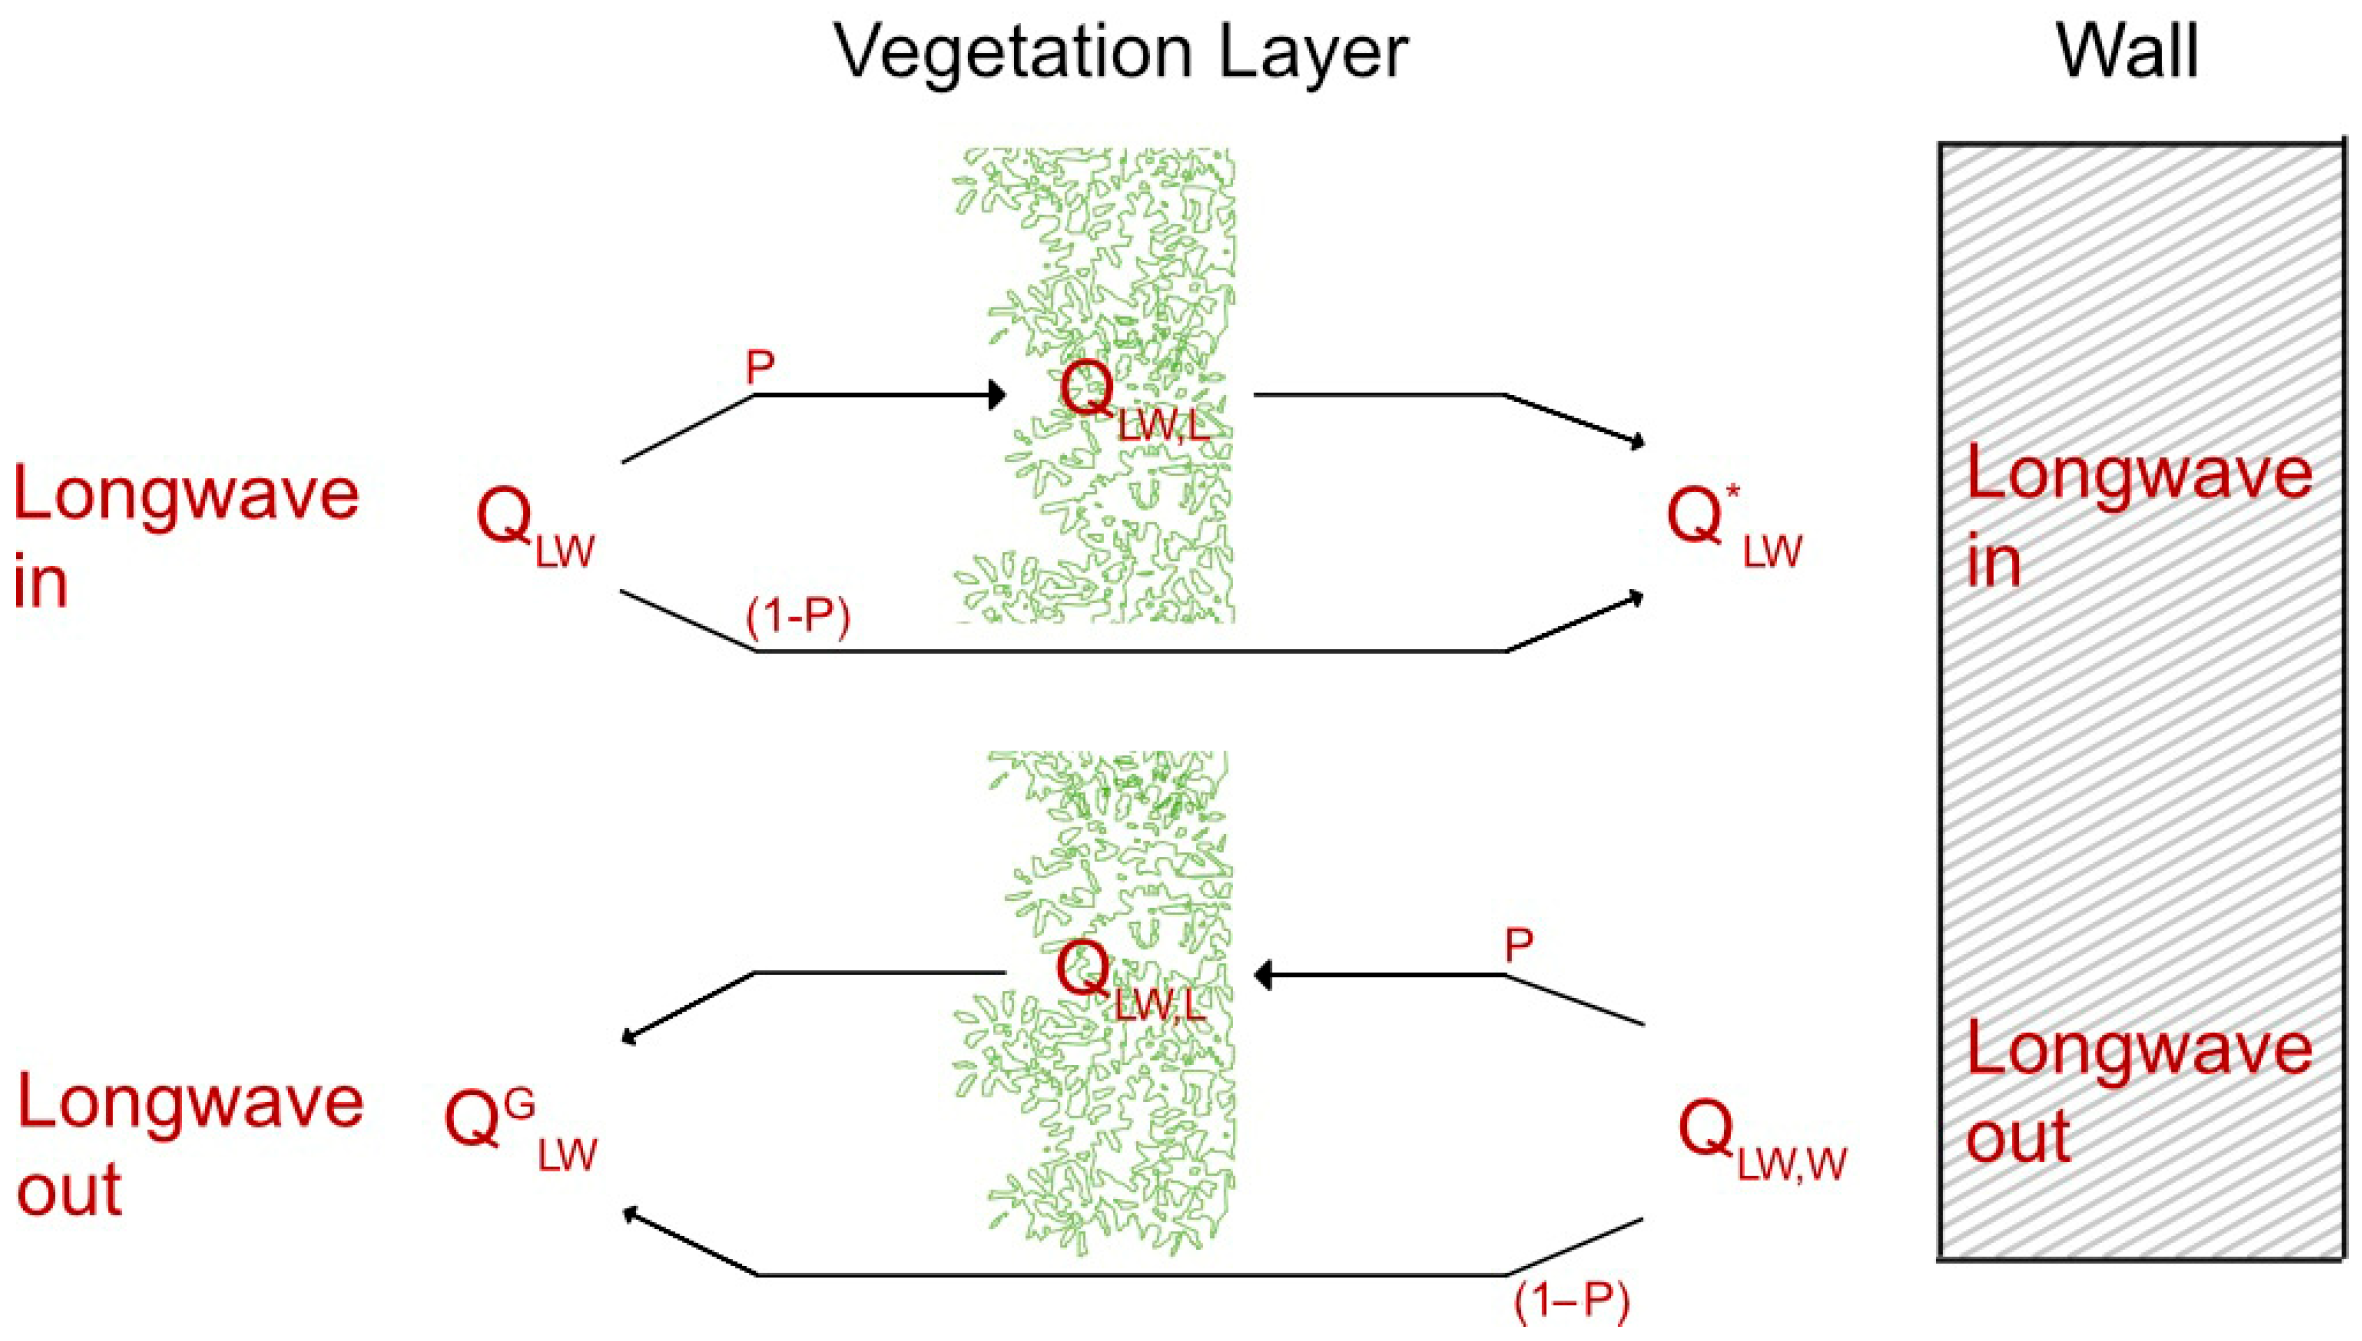
- Assess the impact of longwave radiation in relation to variations in foliage density.
- Evaluate how plant type and wall orientation influence outdoor thermal perception, using Physiological Equivalent Temperature, PET, as an indicator.
3. Methodology
- (i)
- At first, a microclimate assessment for the base-case building and two different green façades and their immediate surroundings was performed, considering four different weeks, connected to the different LAI values of two plant species, with no reference to higher or lower air temperature peaks.
- (ii)
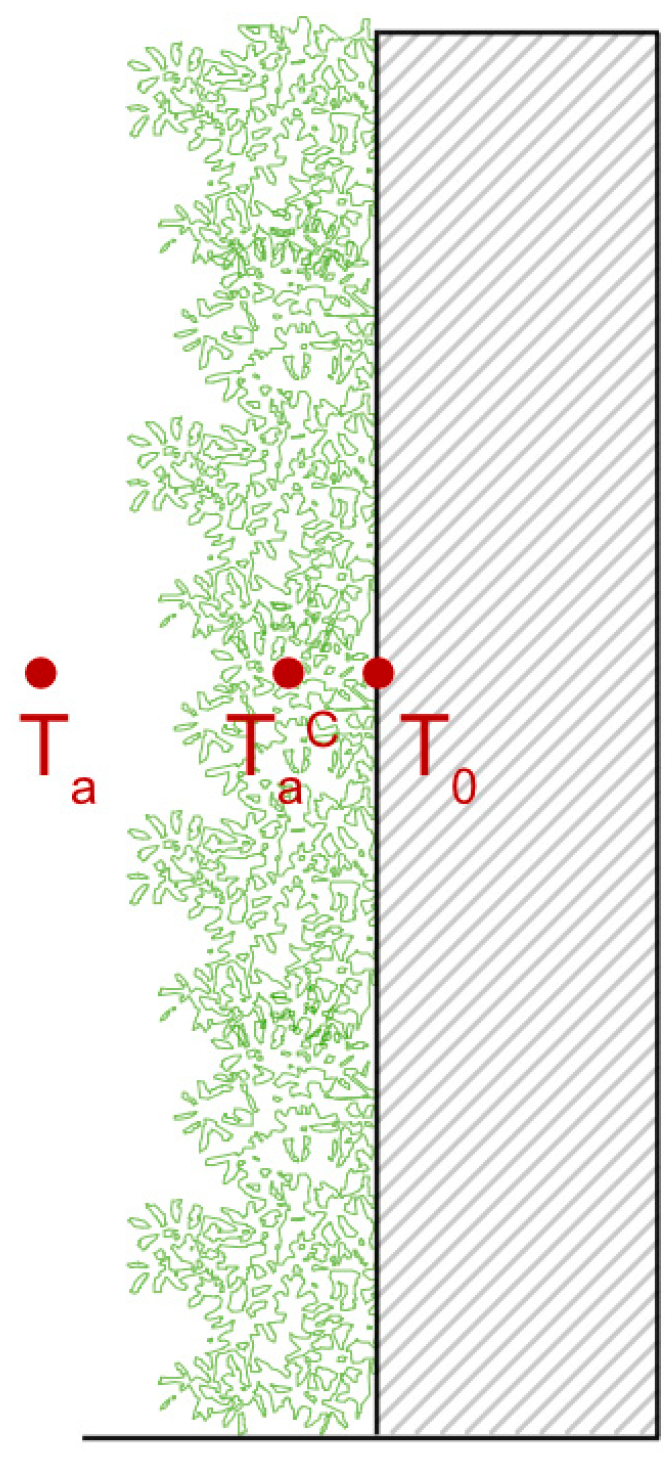
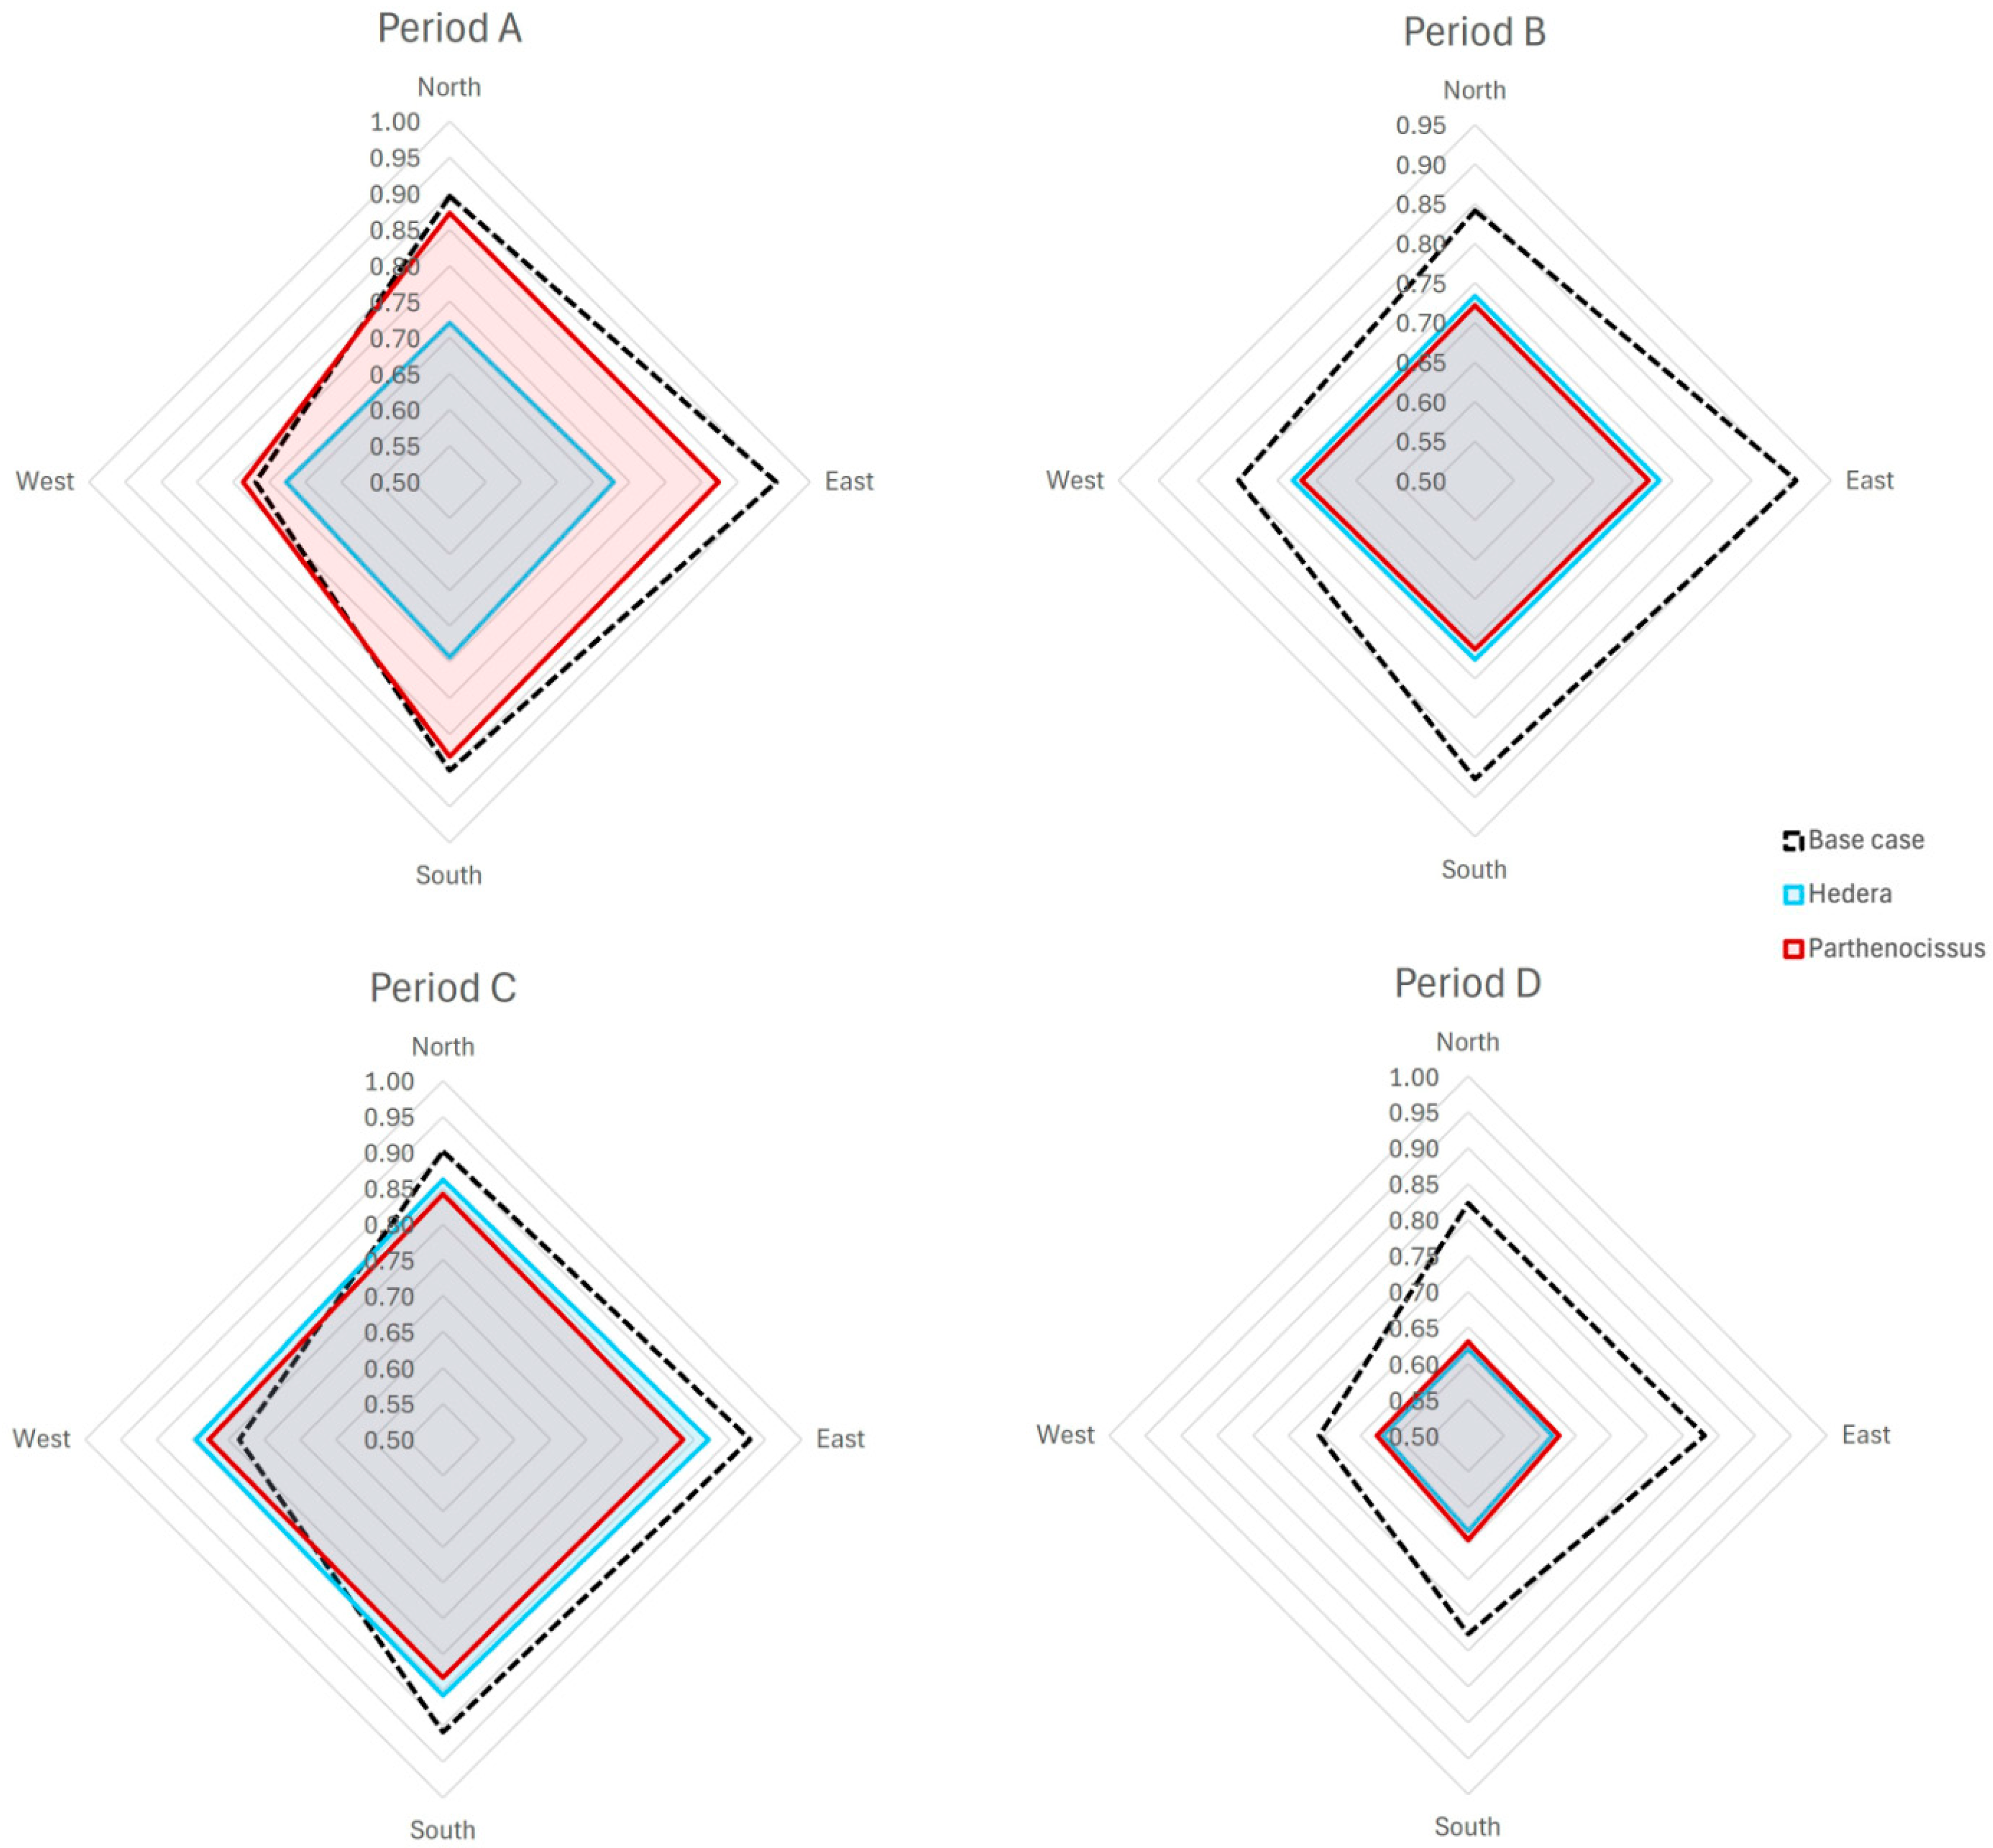
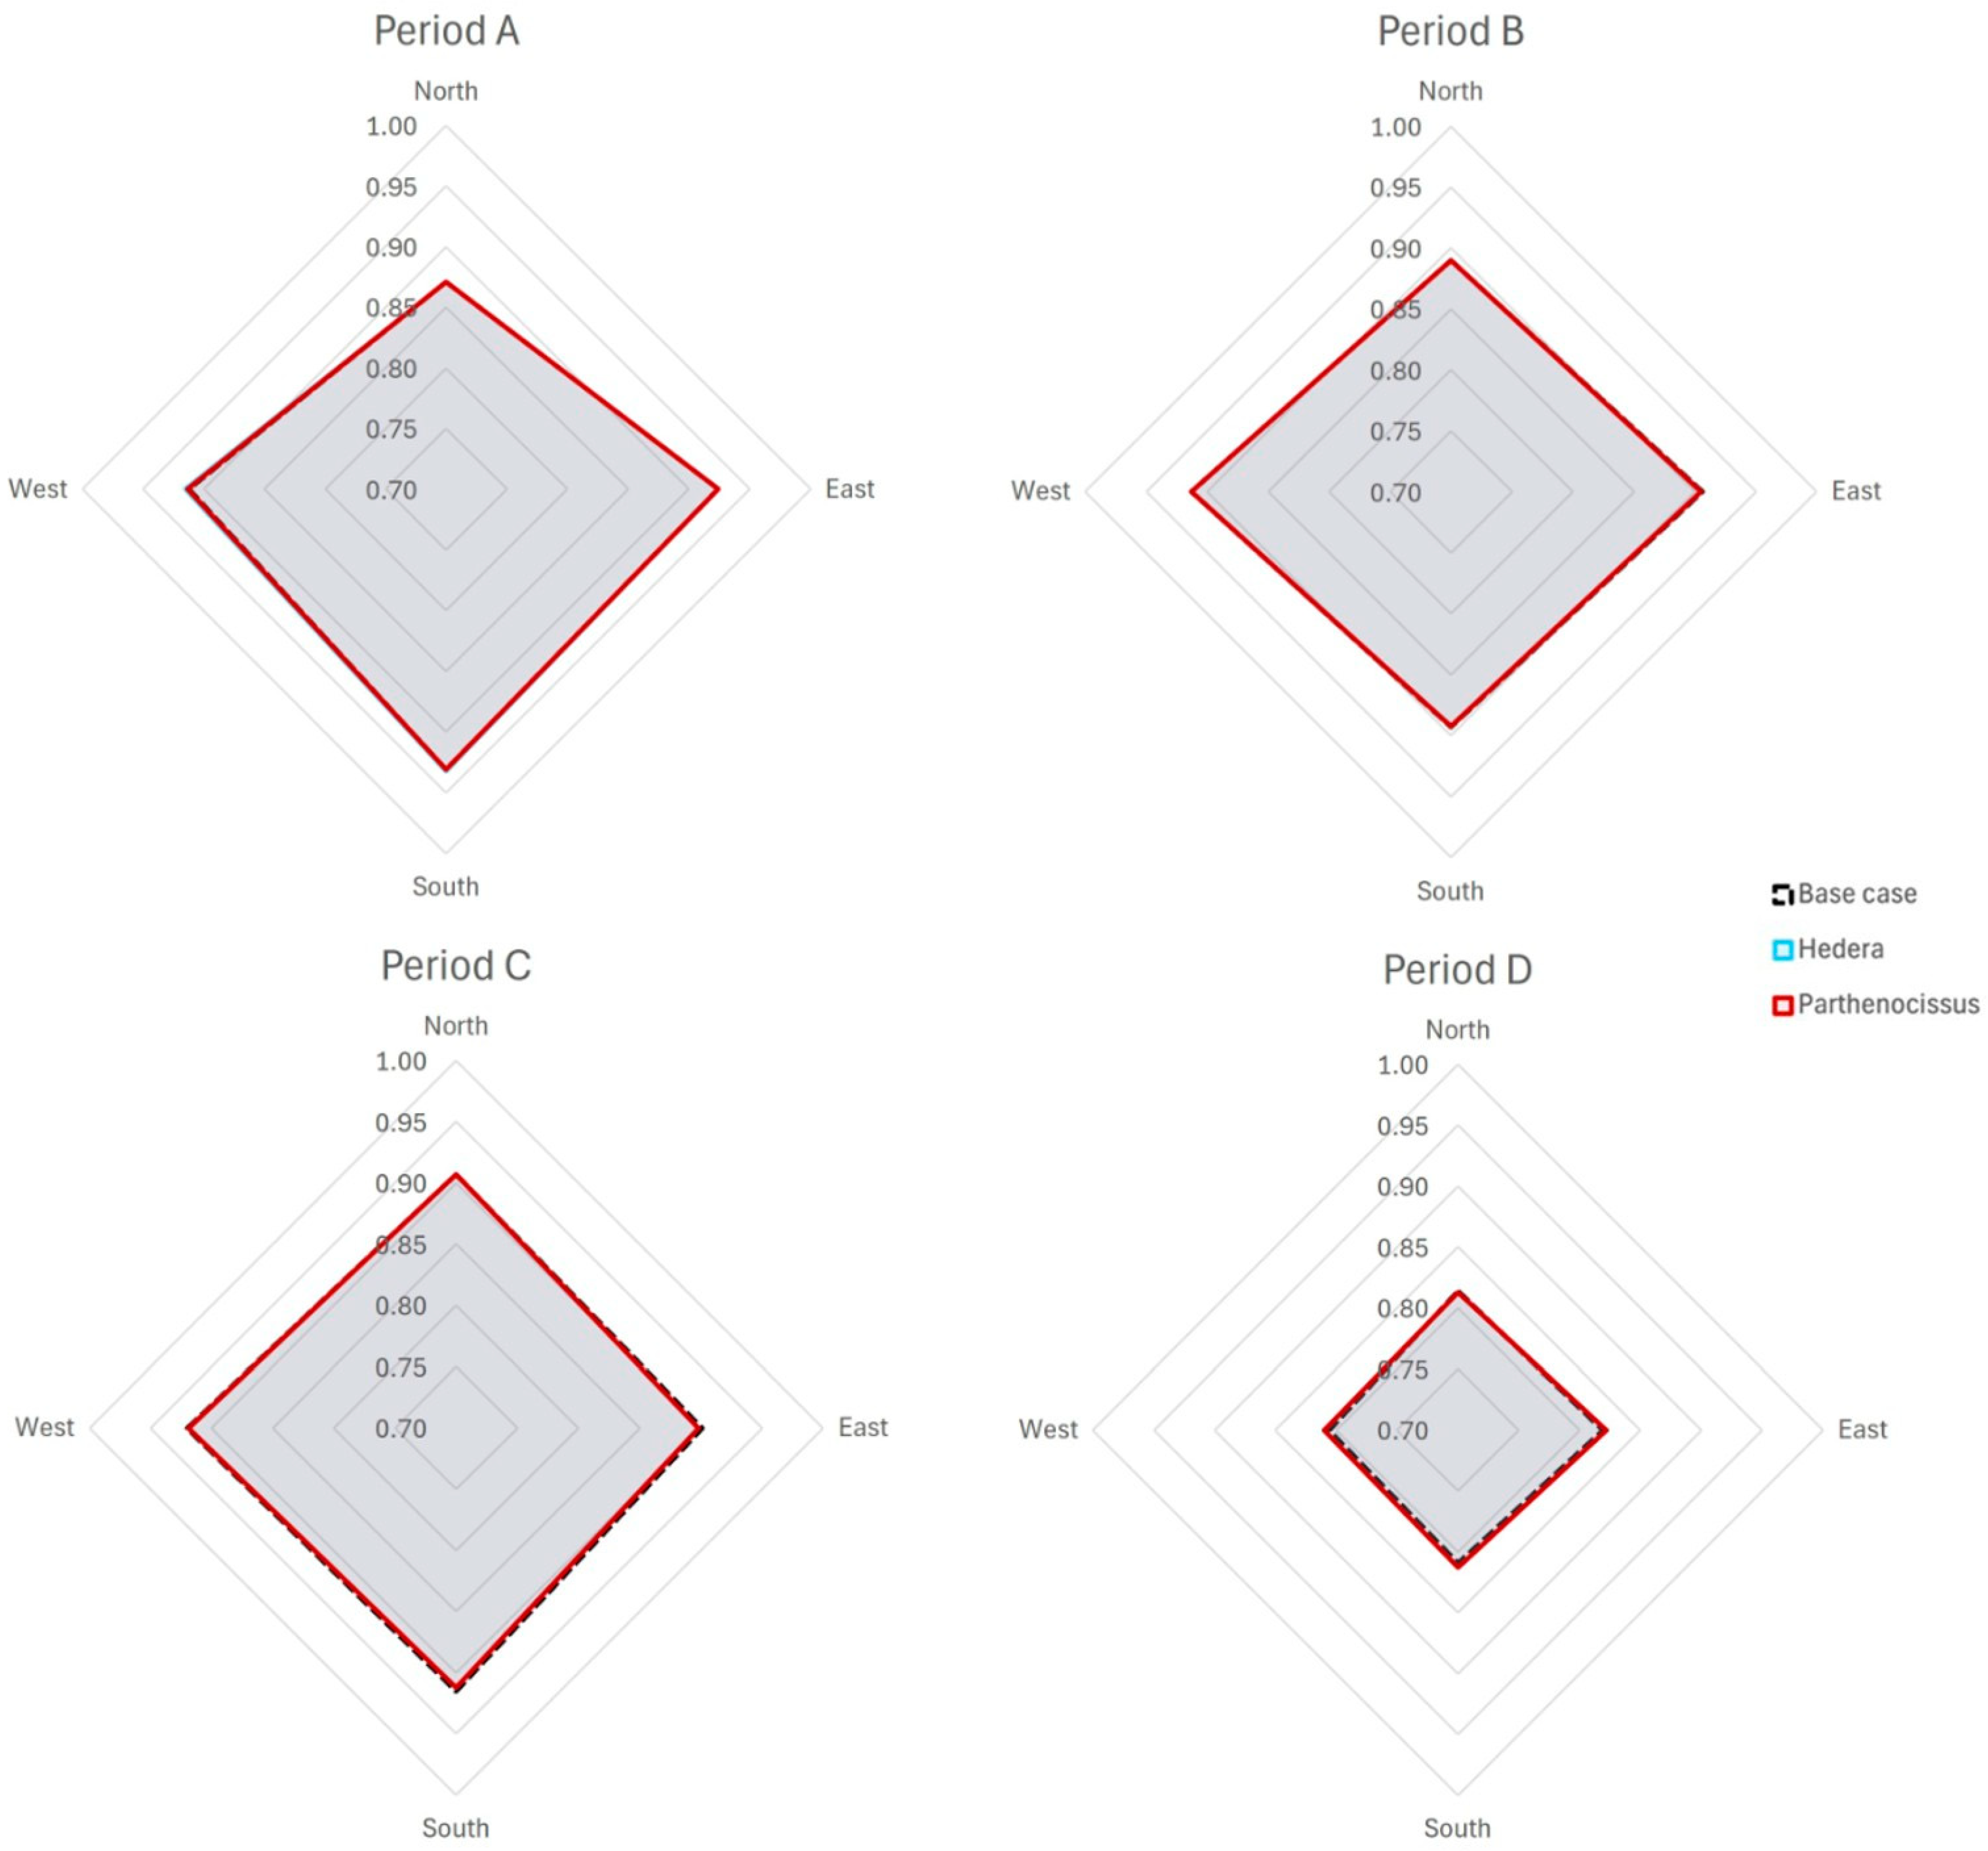
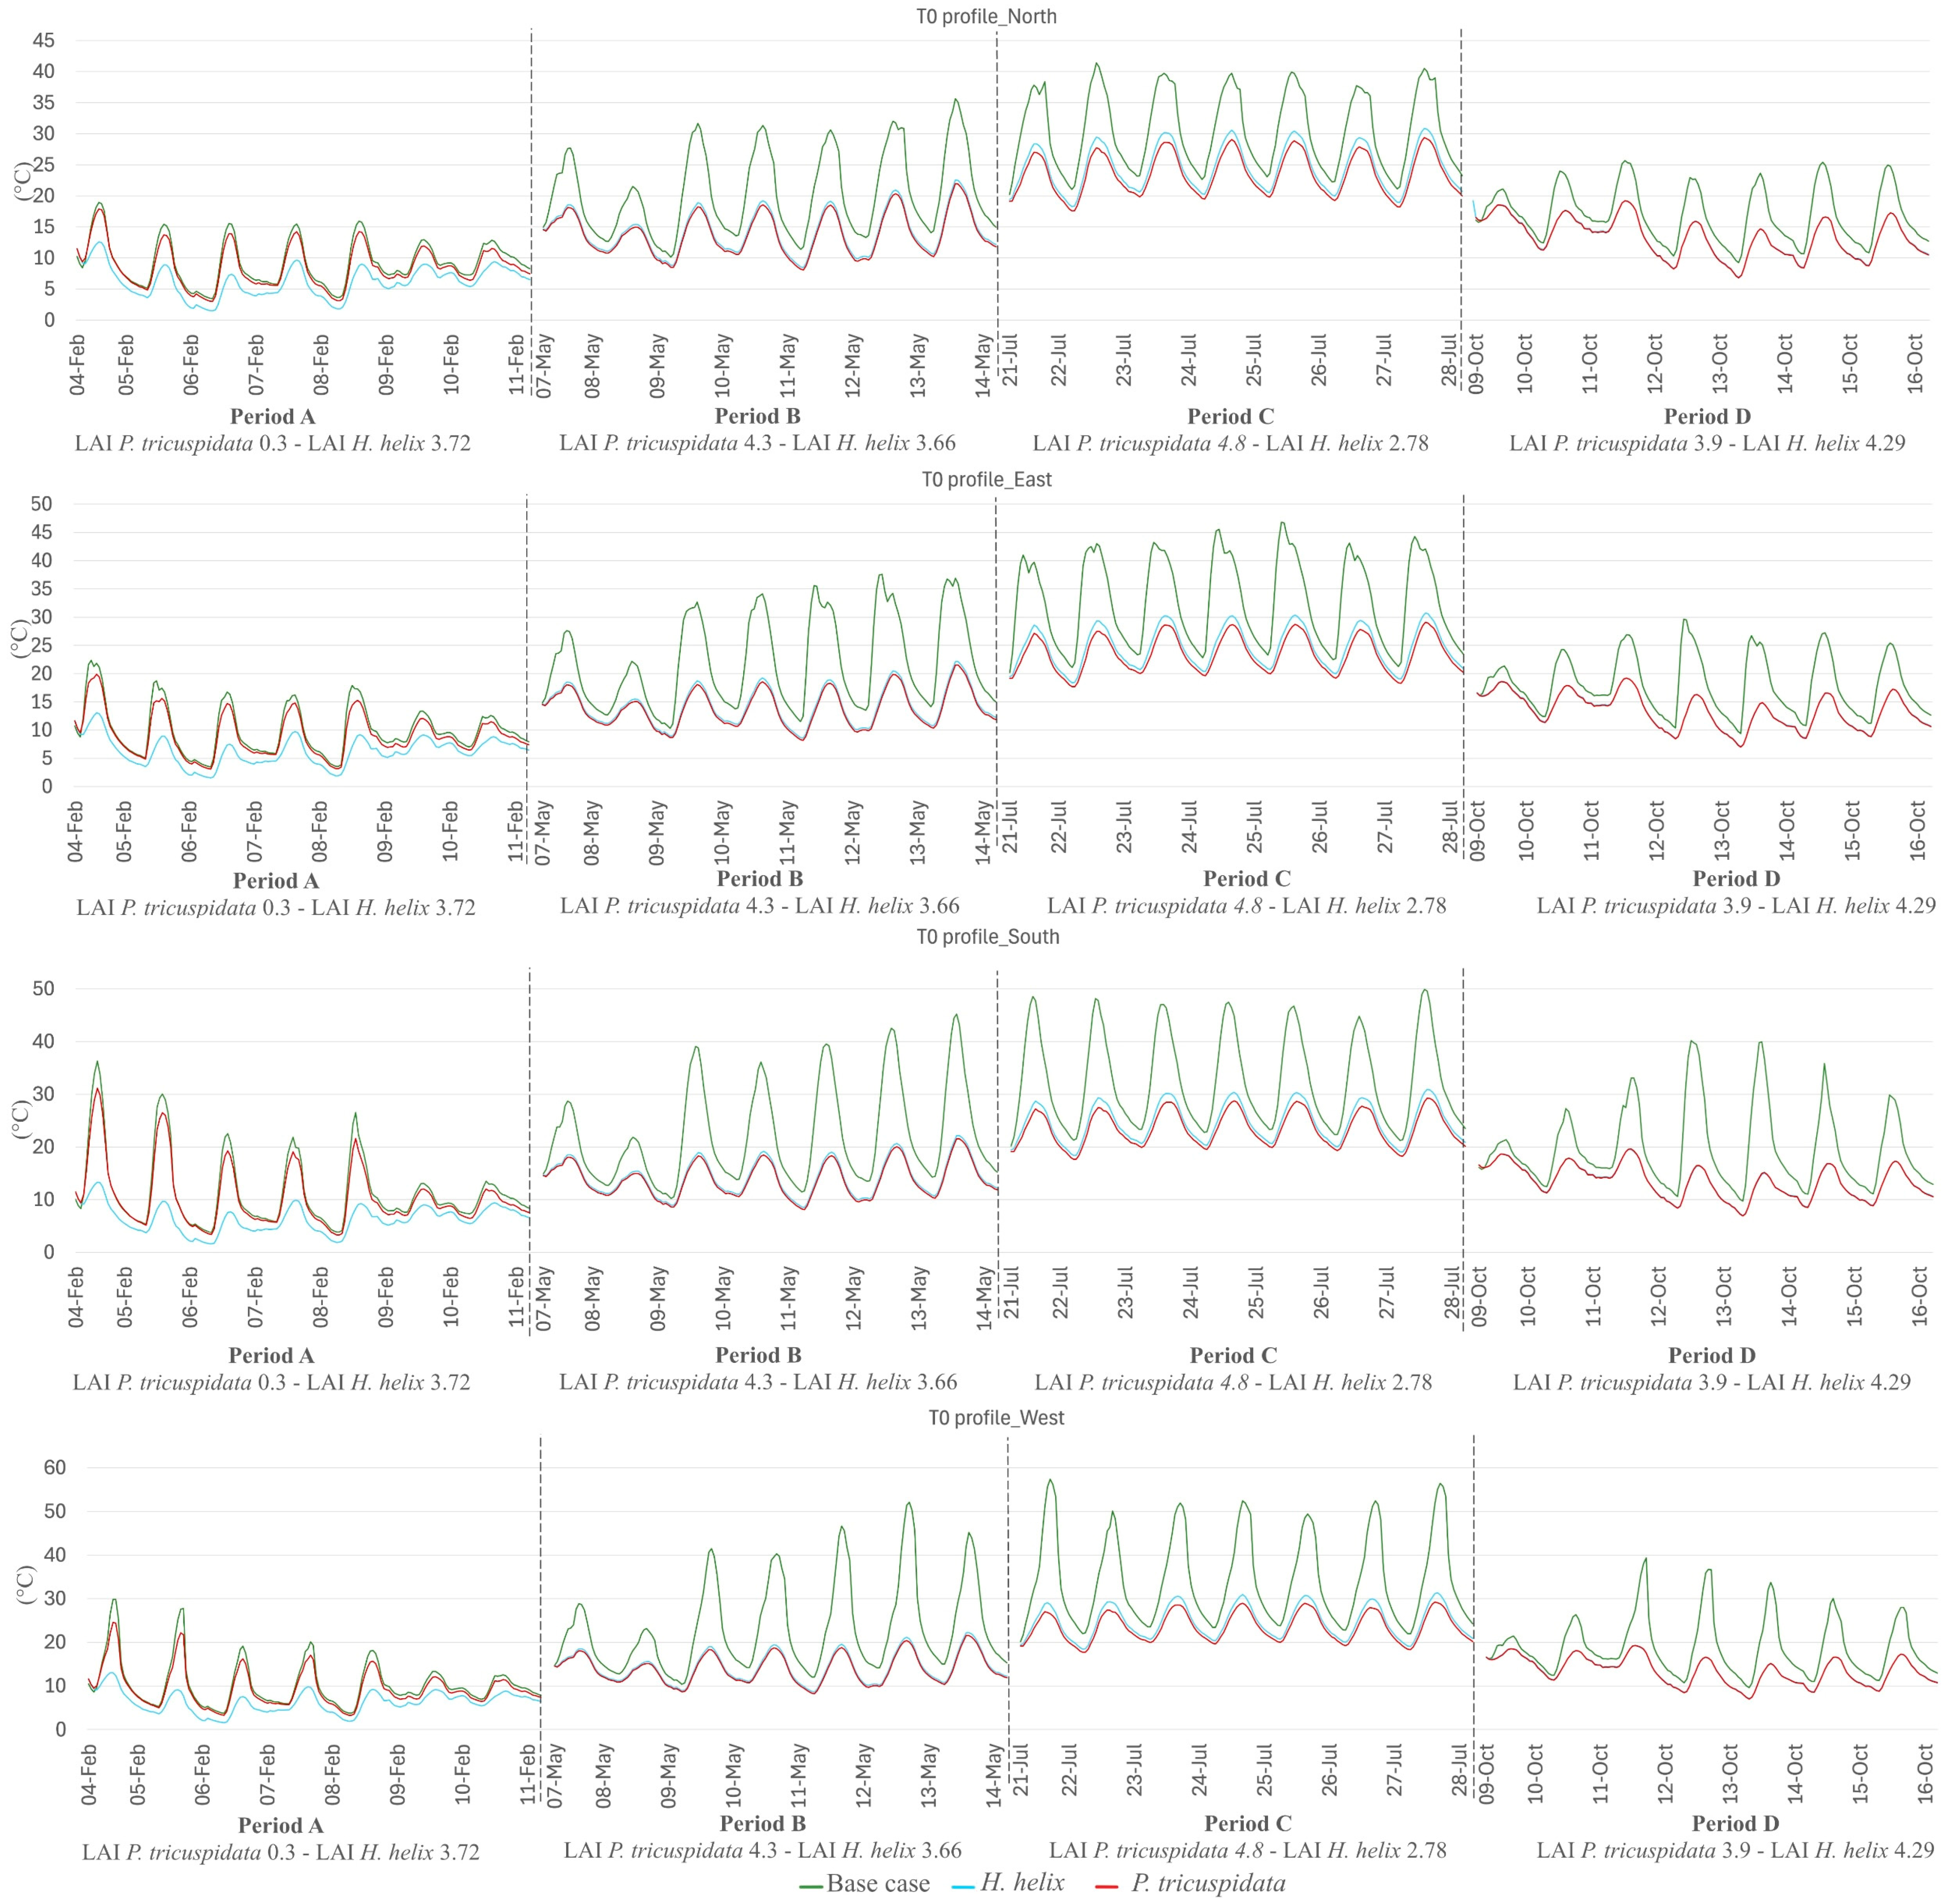
- The results of each simulation were collected into graphs to compare the thermal behavior of the four assessed weeks, with reference to the leaf area index, LAI, of the selected species and their wall temperatures. In this study, the outdoor air temperature (Ta) and surface-wall temperature (T0) were used to compare the thermal resilience of the two different green façades on the four different wall orientations.
- (iii)
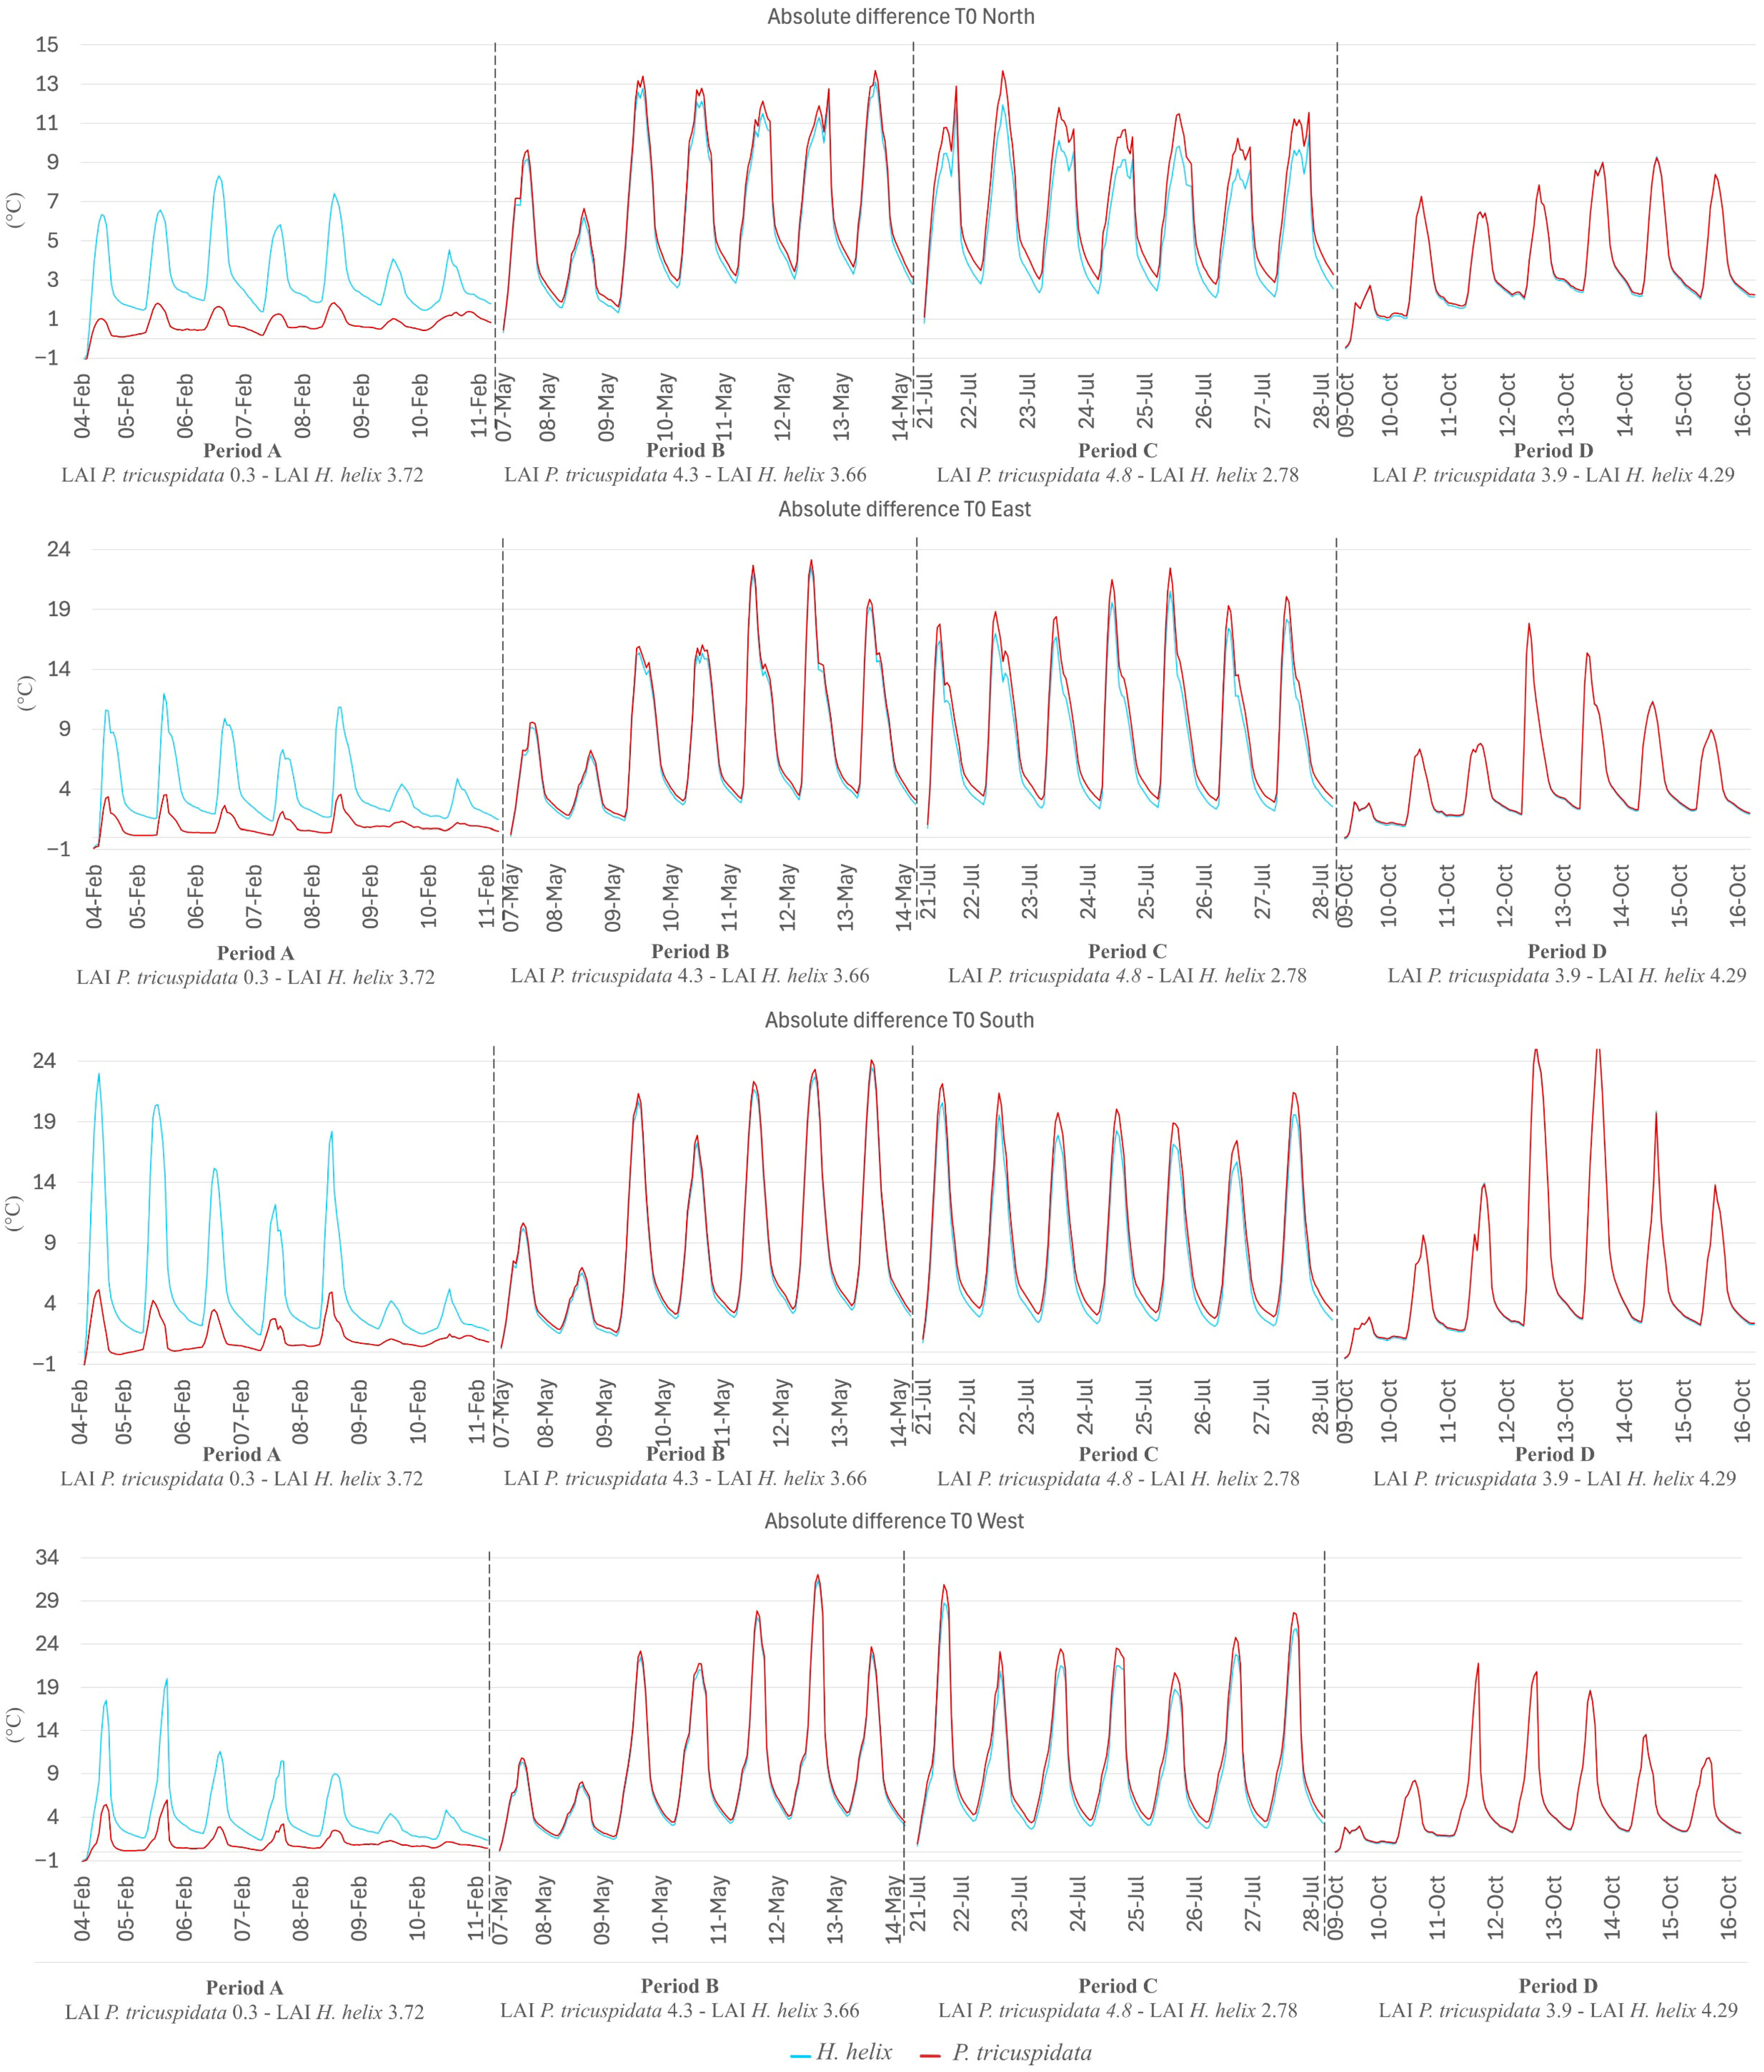
- The absolute difference of wall temperatures (bare wall and covered wall) was assessed and compared over the year-long period.
- (iv)
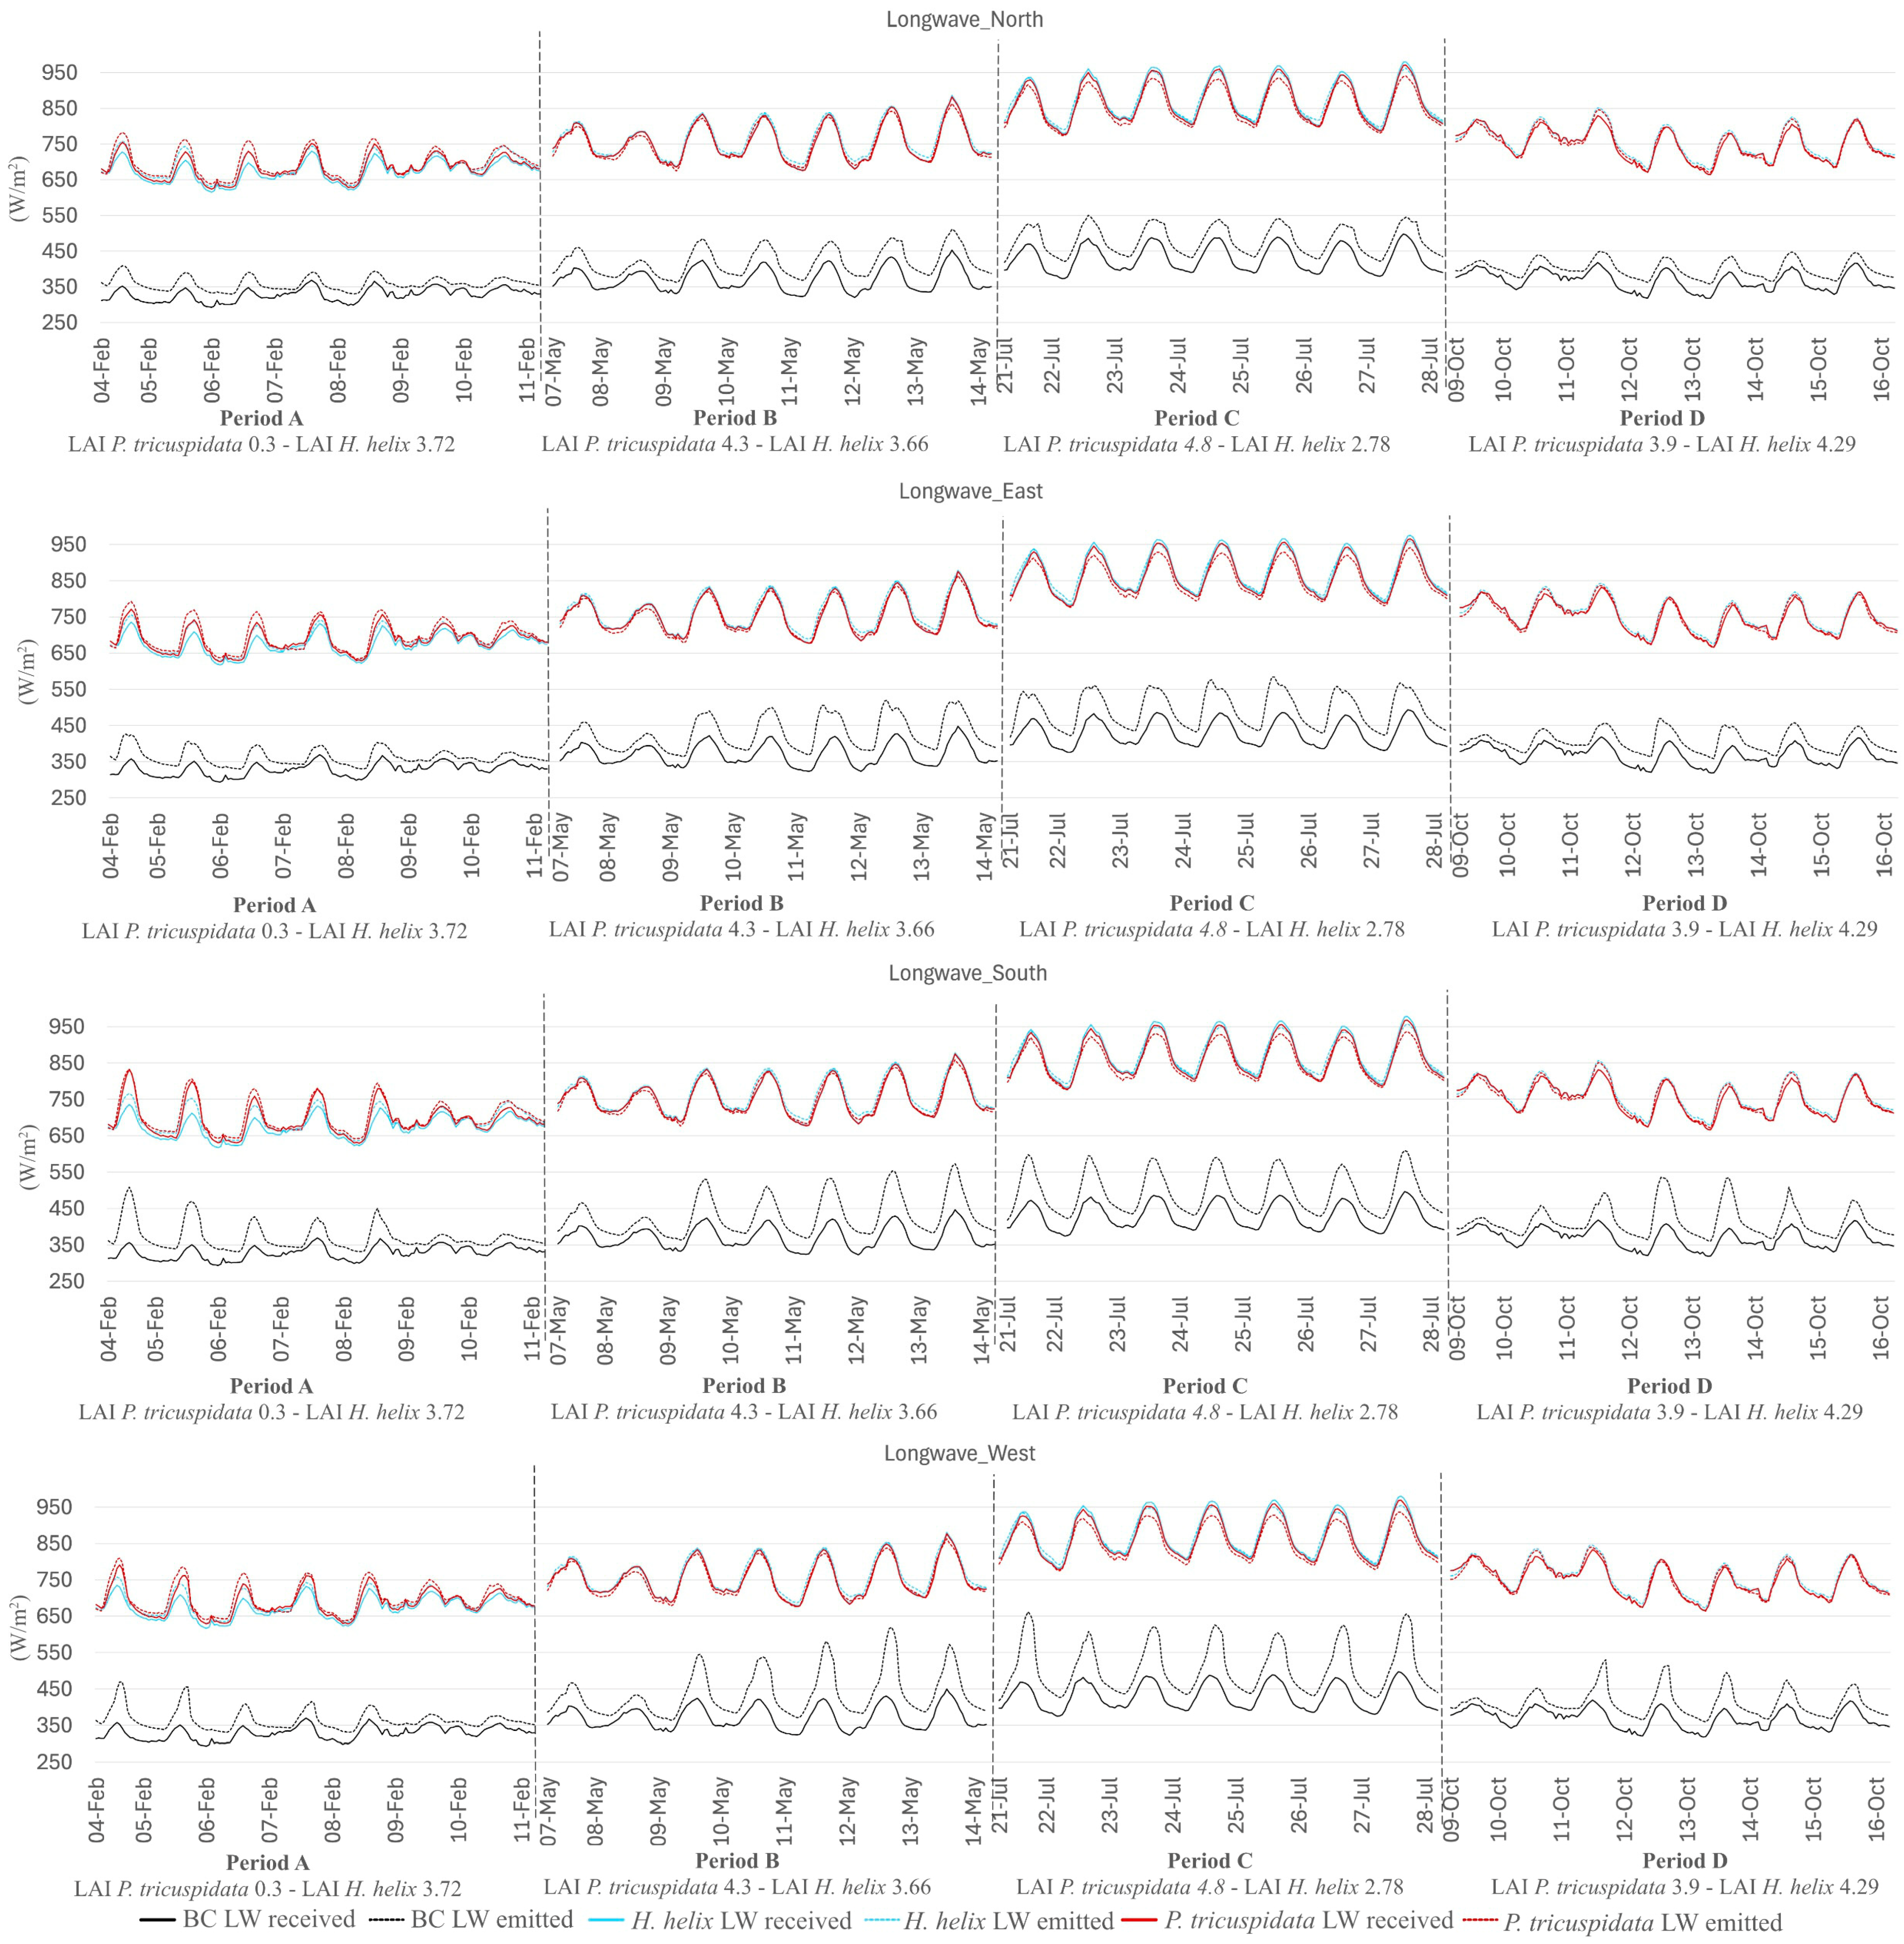
- Longwave radiation was considered to evaluate the role of the foliage coverage in reflecting radiation.
- (v)
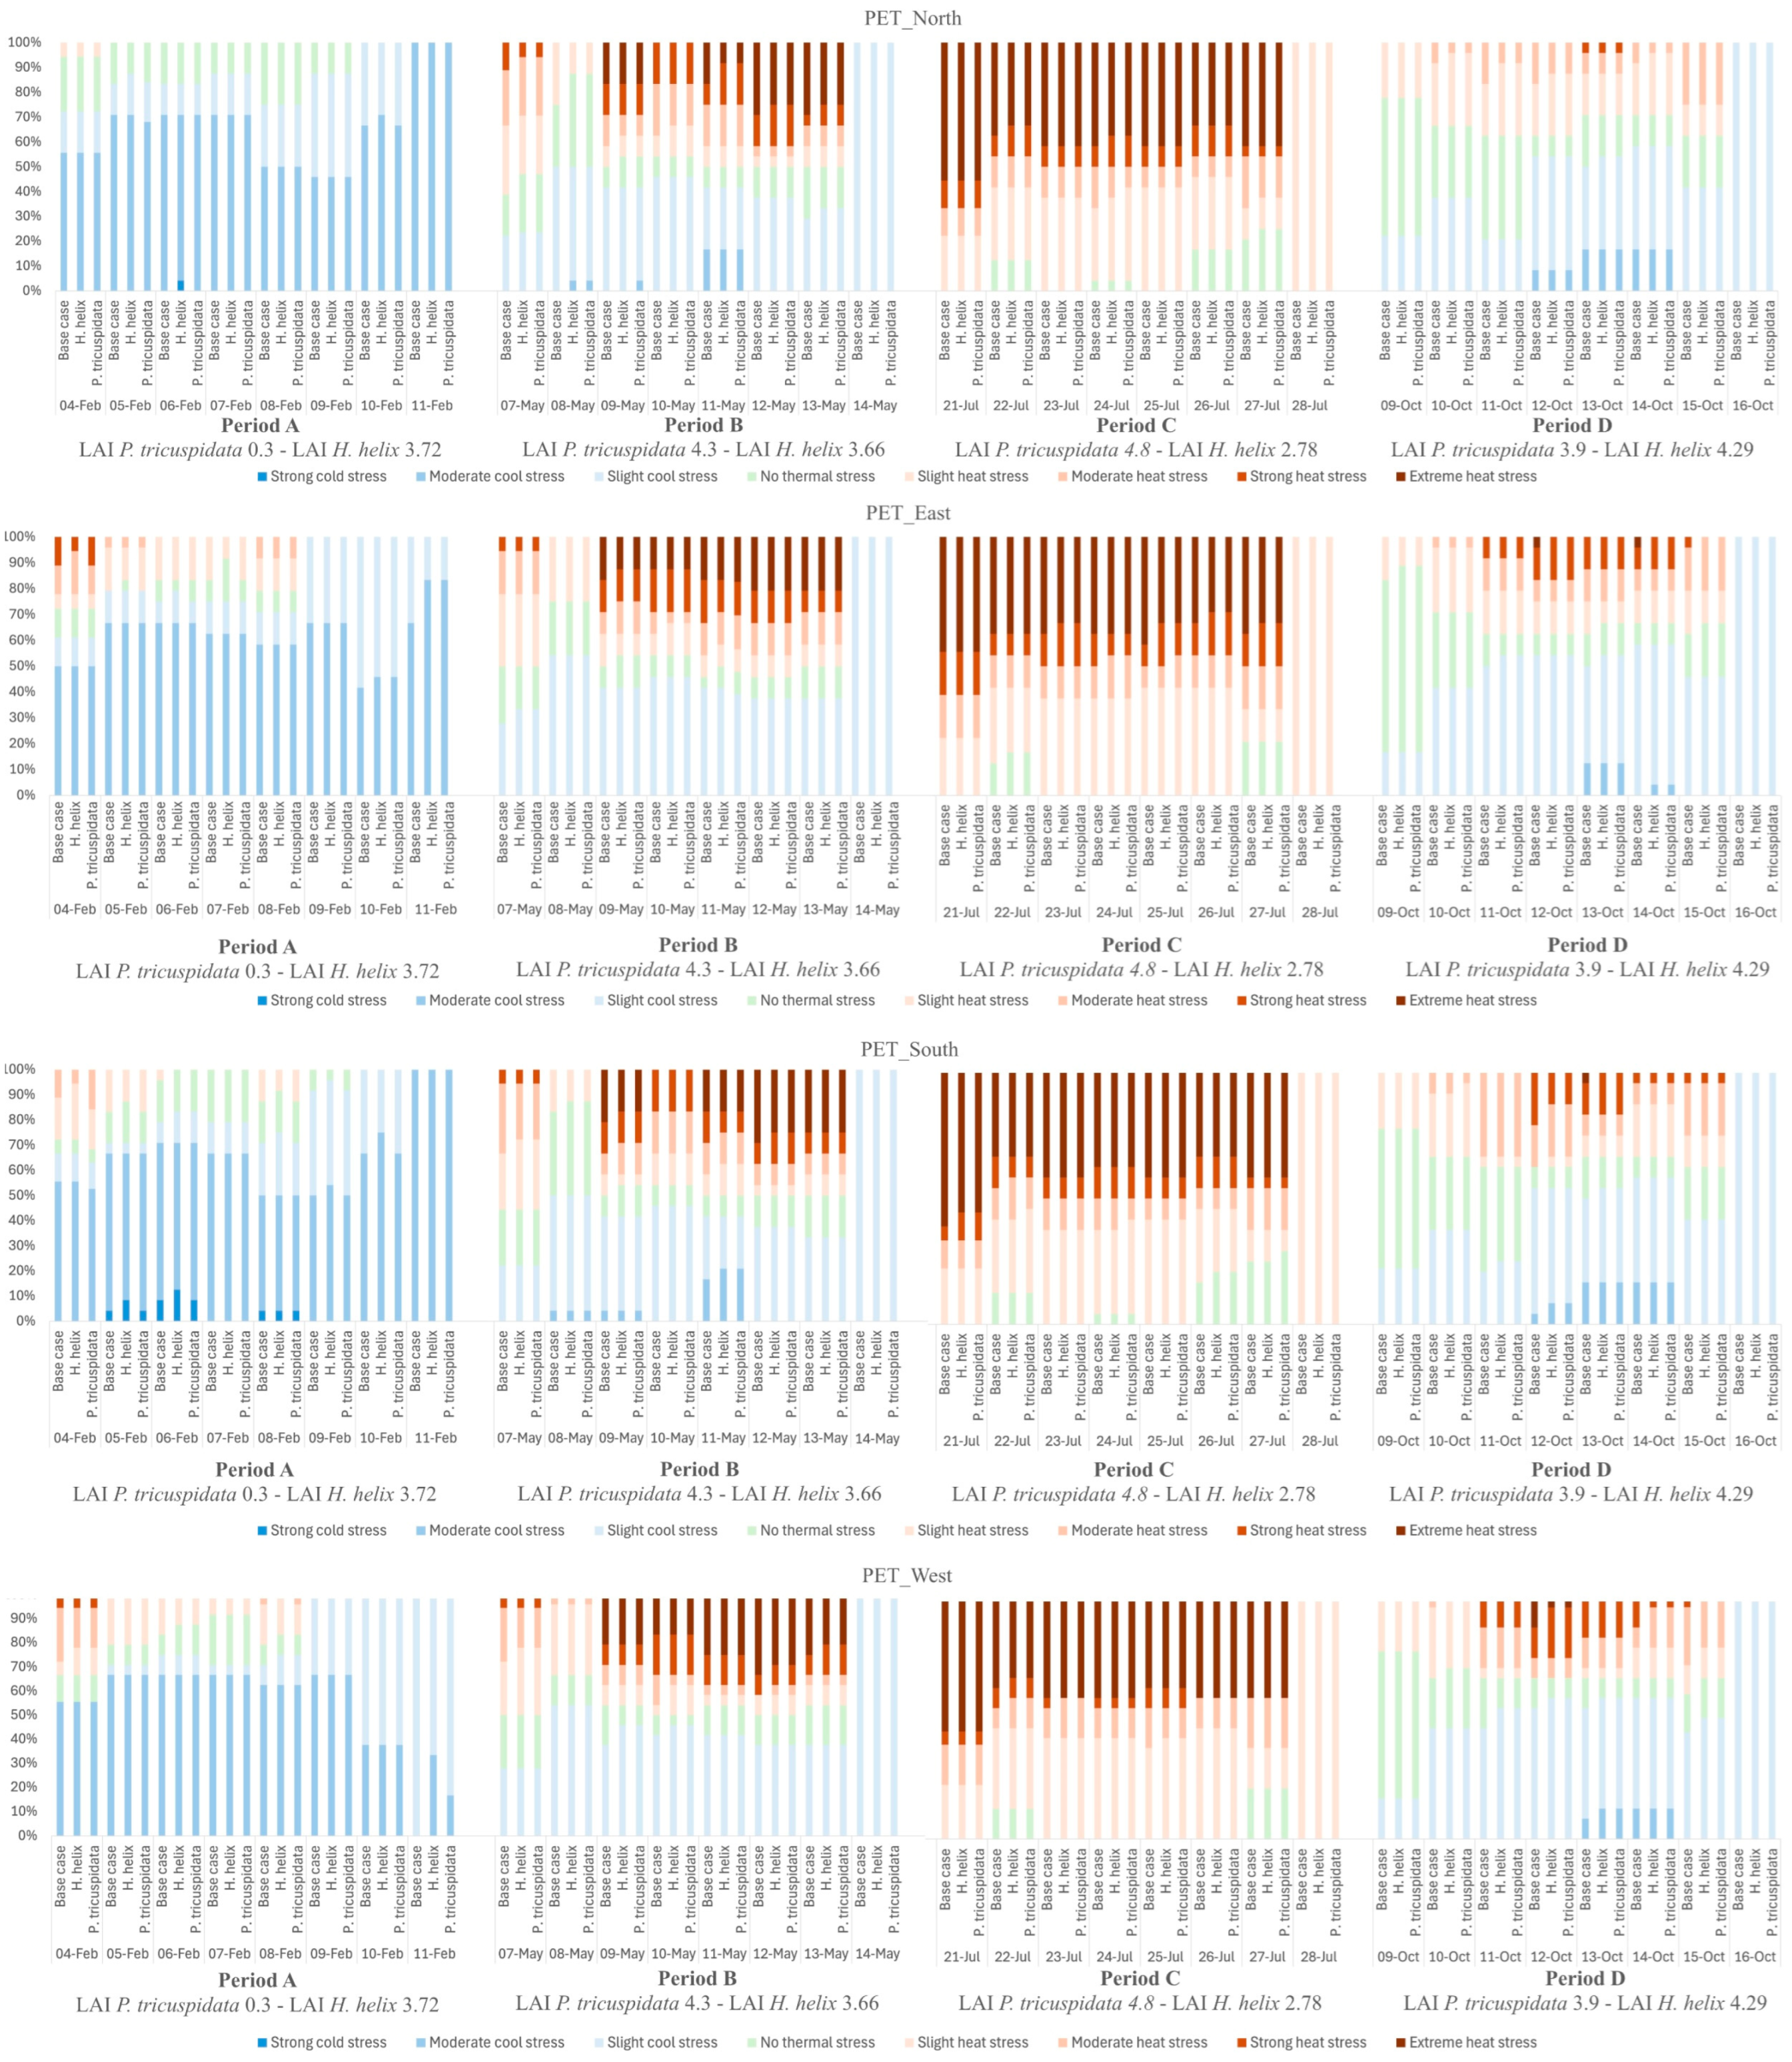
- Lastly, PET values were considered to evaluate the thermal stress mitigation registered near the vegetated wall to assess the thermal stress resilience potential according to period and wall orientation.
3.1. Materials and Methods
- i
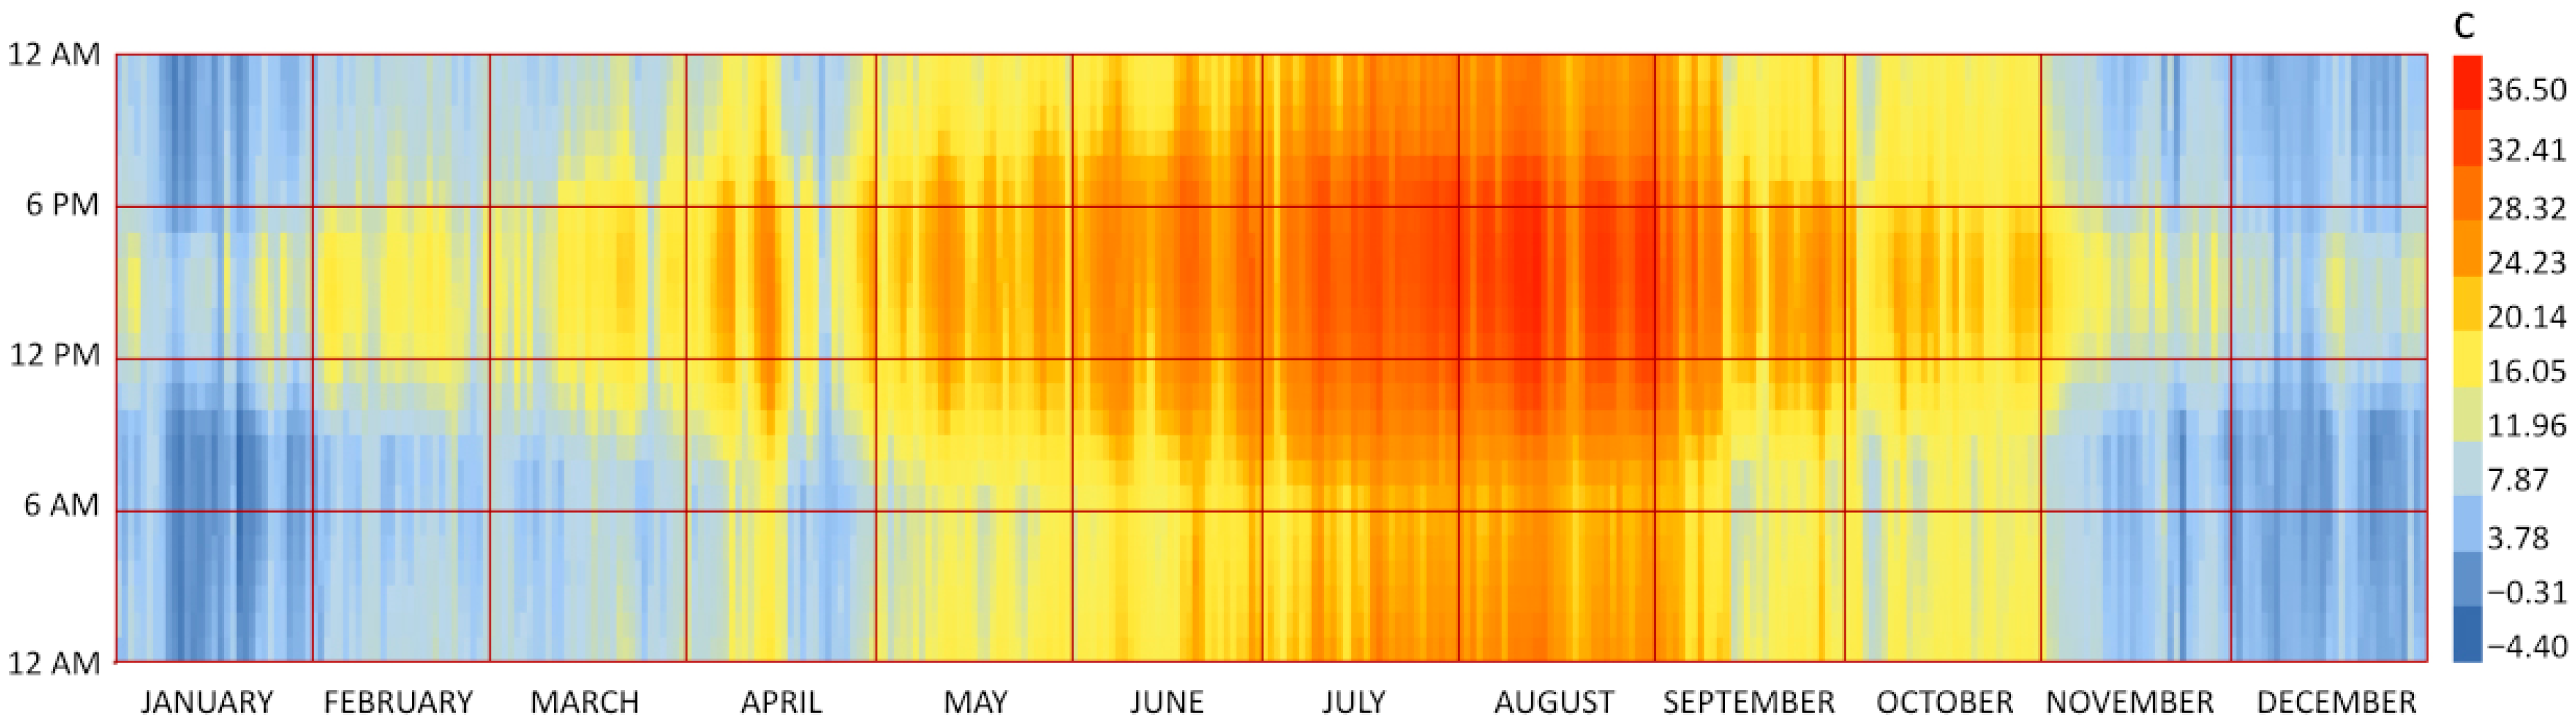
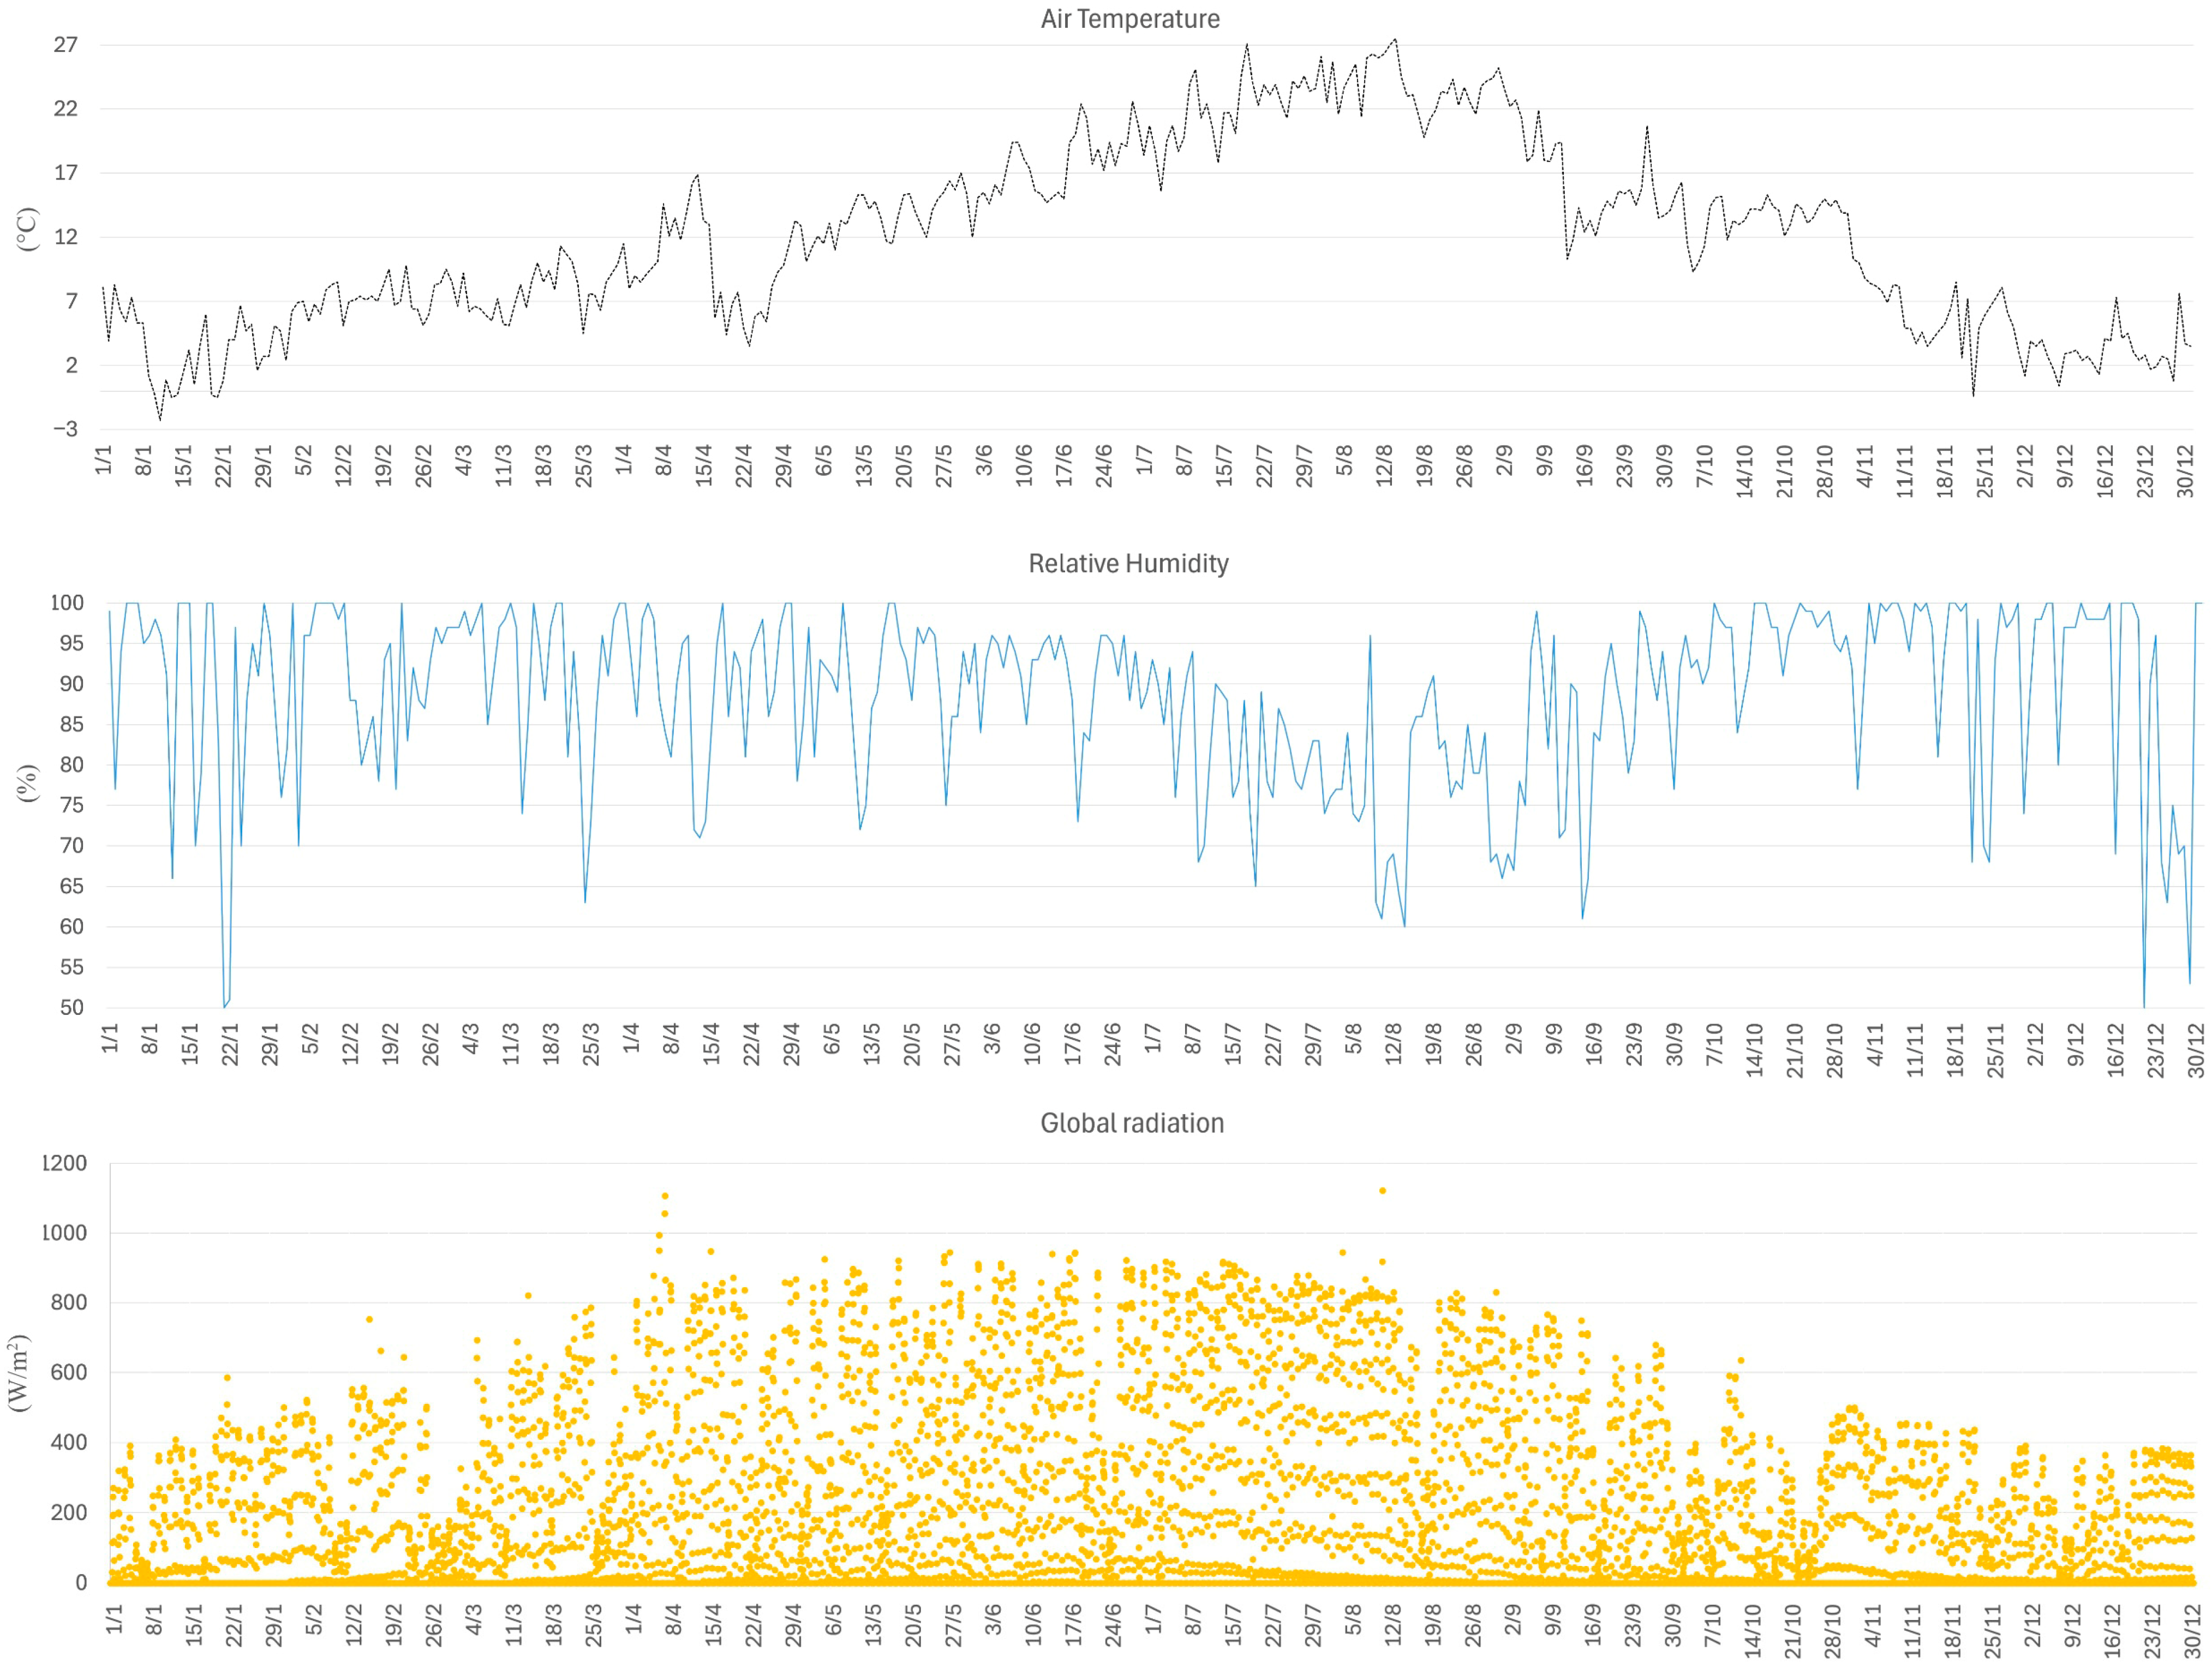
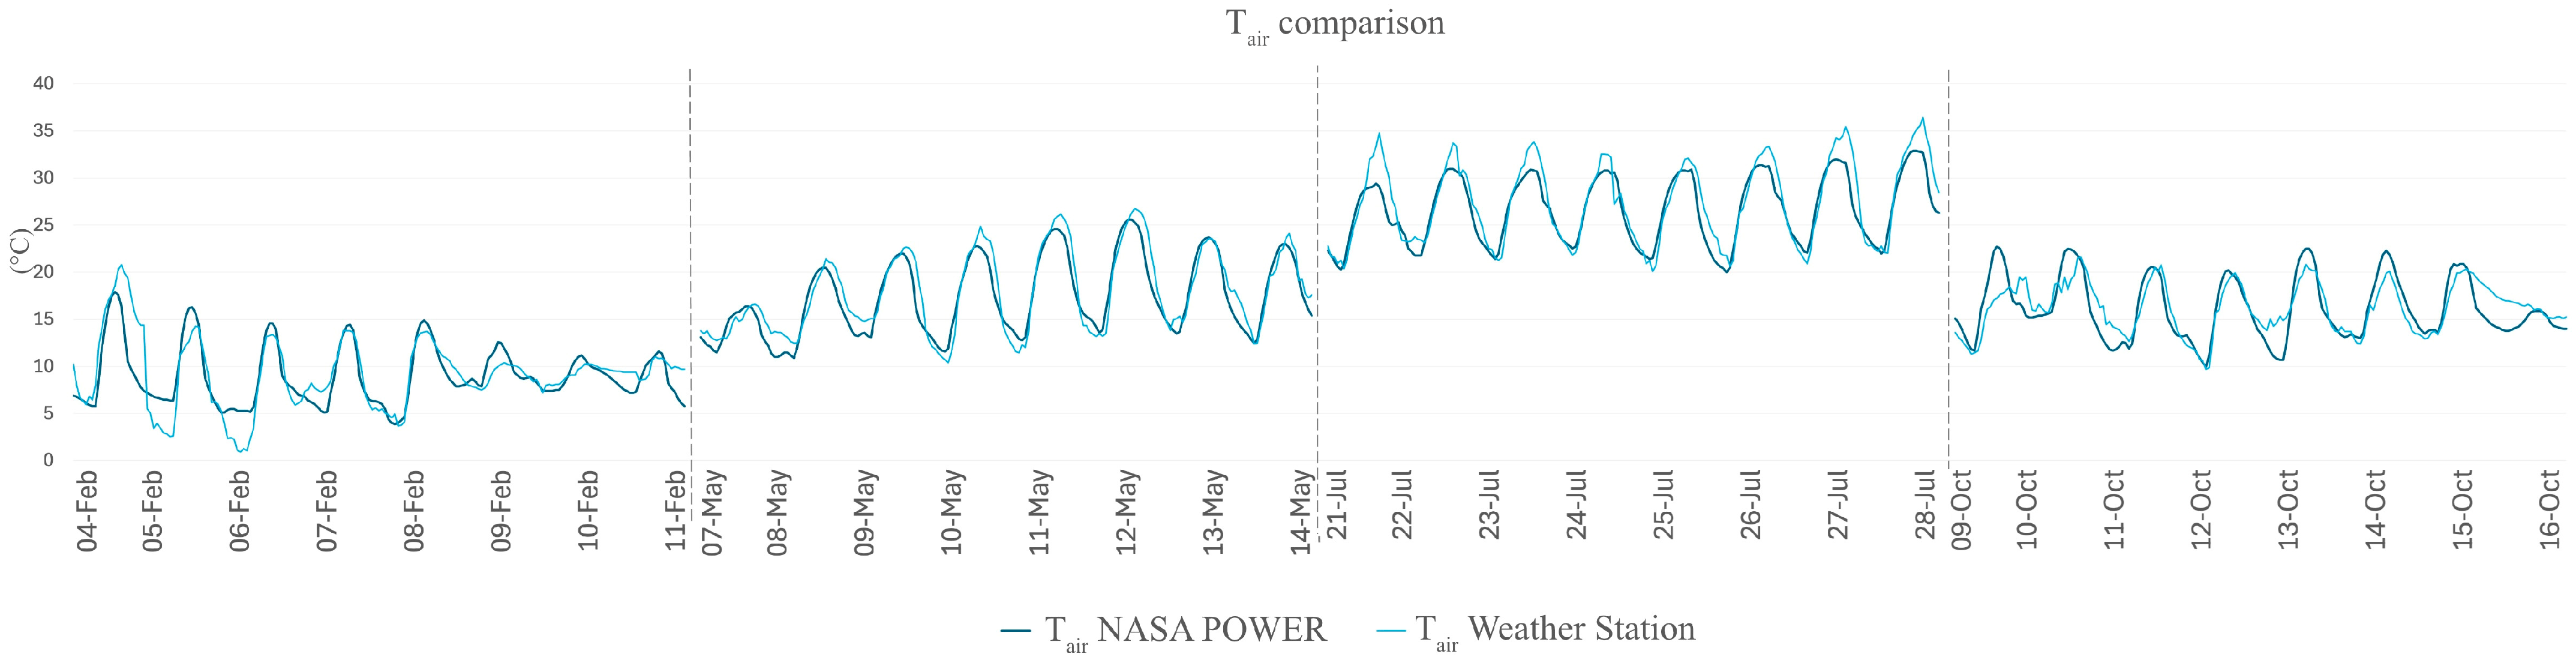
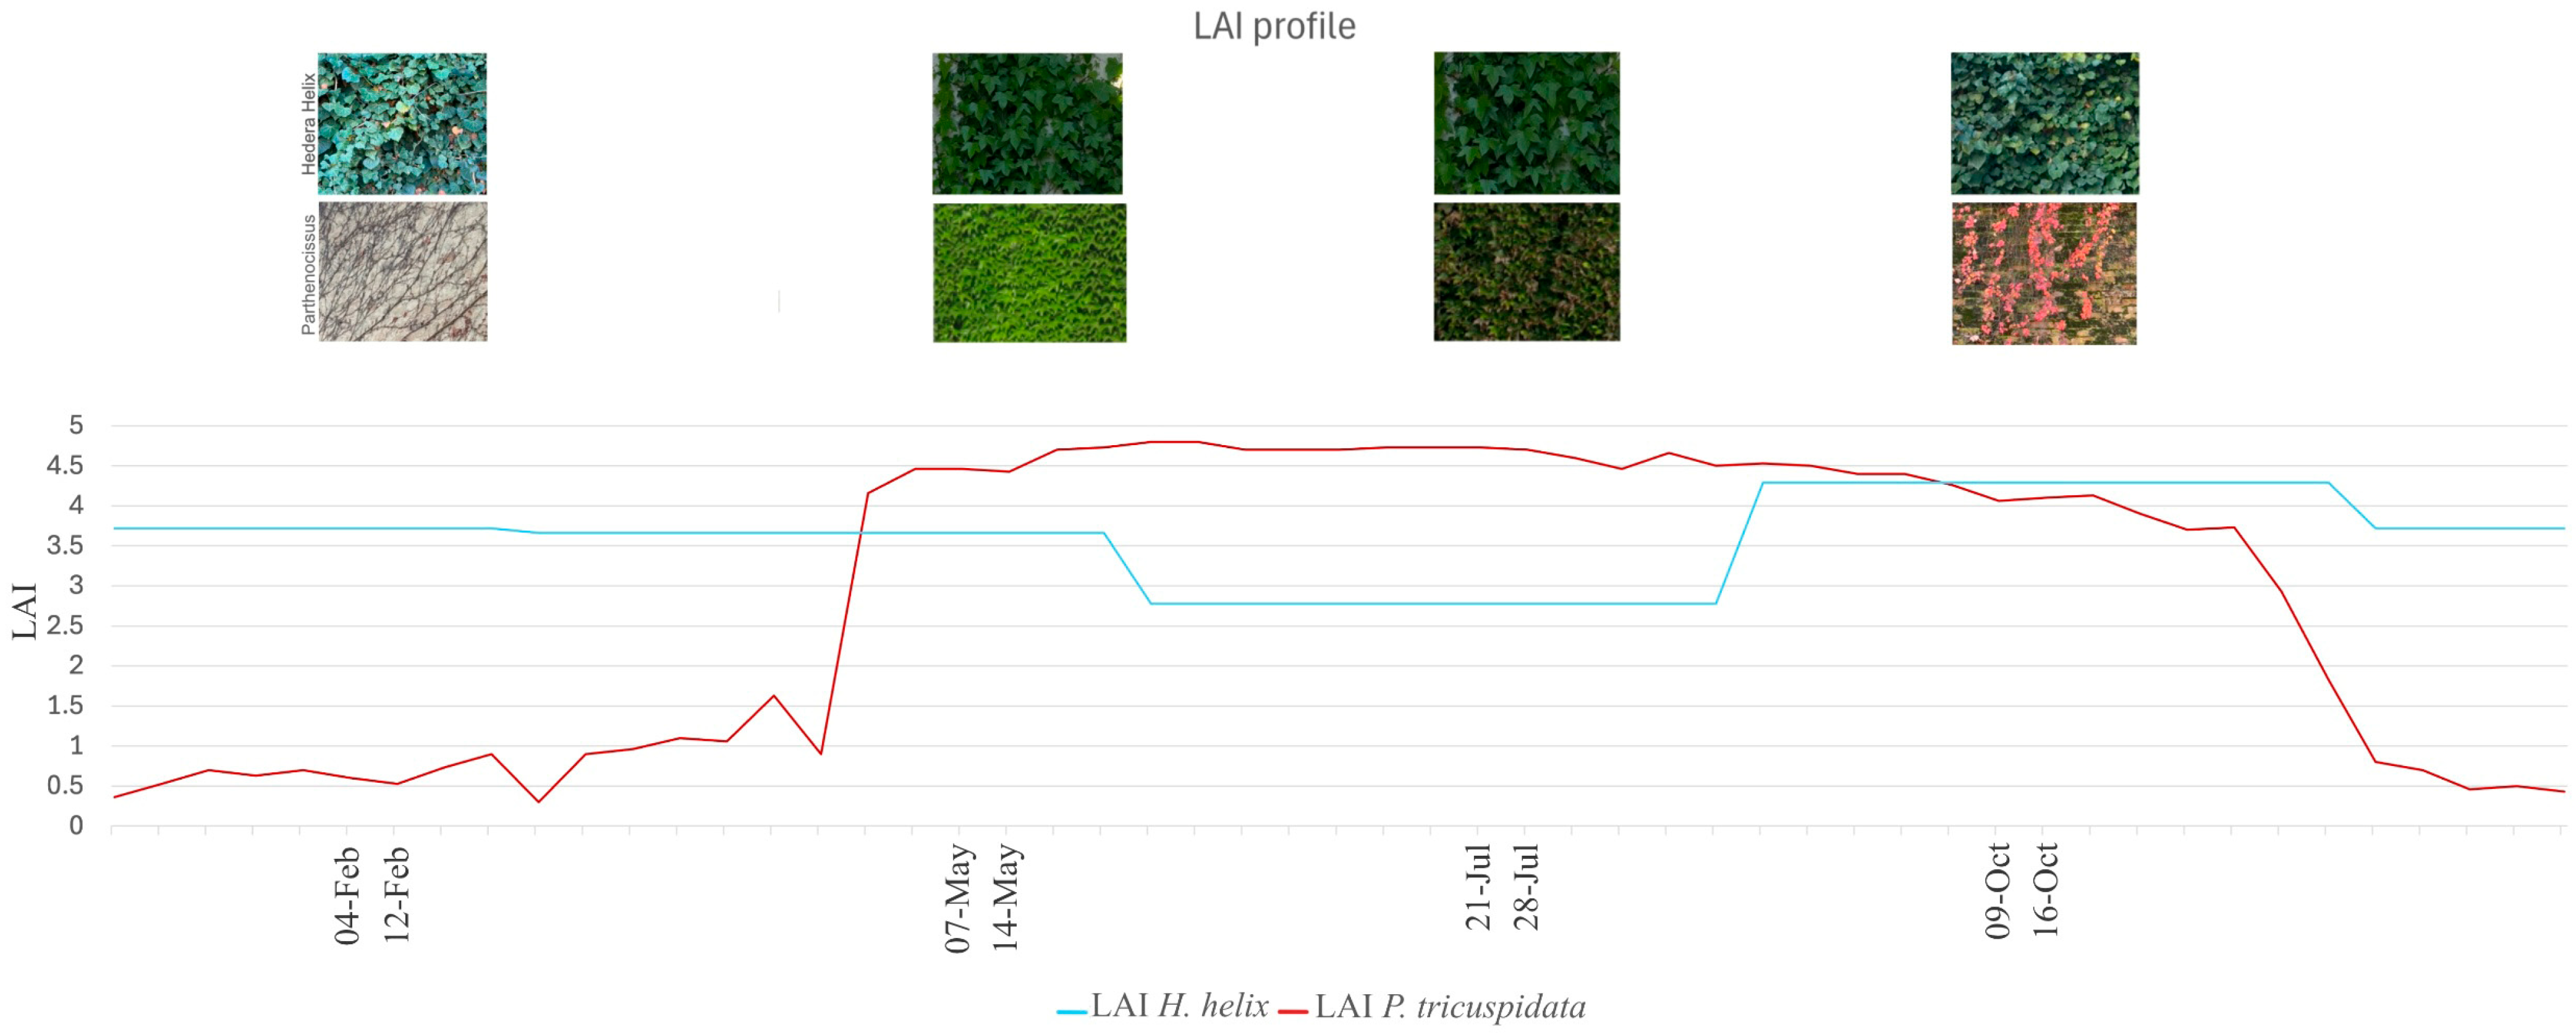
- Meteorological data were obtained from NASA POWER for the entire year 2024 to enable a full forcing evaluation. Simulations were performed for four distinct periods, each spanning 168 h (seven days), corresponding to representative stages of vegetation growth rather than extreme temperature conditions. Considering the complete annual growth cycle of the two selected climbers, four weeks were identified as representative of seasonal variations in leaf area index (LAI), as illustrated in Figure 2 for Hedera helix and Parthenocissus tricuspidata.
- ii
- With regard to the botanical data [40,45,49] (Figure 5), the first selected week (Period A: 4–11 February 2024) corresponded to the minimum LAI for Parthenocissus tricuspidata (approximately 0.40), indicating a stage with minimal foliage, while Hedera helix maintained an average LAI of 3.72. Period B (7–14 May 2024) showed an inverted trend, with Parthenocissus tricuspidata initiating its new foliage season and reaching a higher LAI value of approximately 4.30, while the LAI of Hedera helix remained stable at around 3.66. The third period (21–28 July 2024) registered the lowest LAI values (2.78) for Hedera helix, despite the plant being an evergreen climber. During the hottest season, its LAI decreased, whereas Parthenocissus tricuspidata reached its maximum foliage density, with an LAI of approximately 4.80. The fourth period (9–16 October 2024) showed a decrease in LAI for Parthenocissus tricuspidata as it began to shed its leaves, reducing its LAI to approximately 3.90. In contrast, Hedera helix exhibited an increase in LAI, reaching about 4.29. The building models were assumed to have all four façades fully covered with vegetation, as adopted in previous studies [59], to represent a fully grown scenario.
- iii
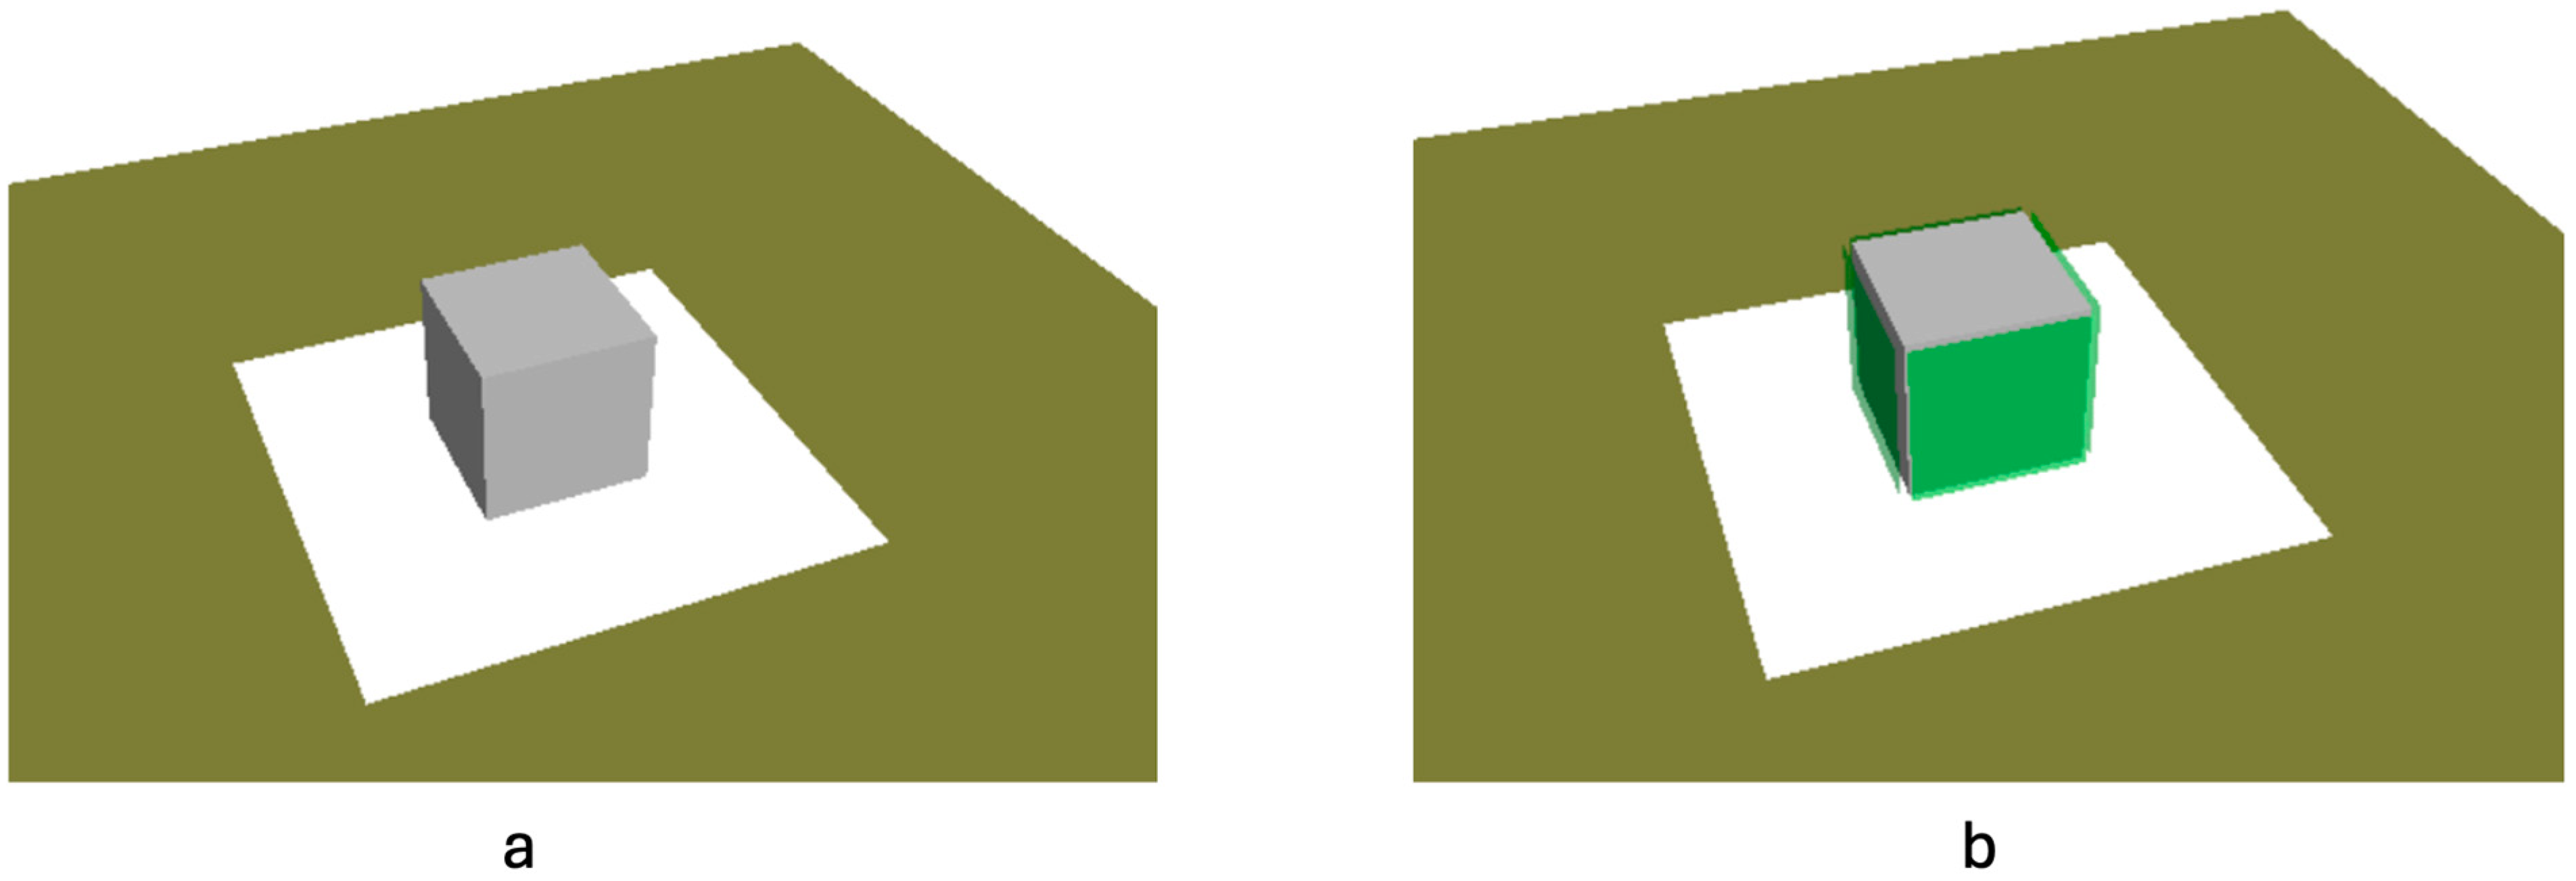
- The building model and simulation settings are summarized in Table 2. Wall and roof material properties were derived from the default ENVI-met database to represent a non-specific building envelope, considered representative of typical U-values and construction characteristics commonly found in buildings located in the northern Italian climate. Soil temperature was estimated using default values and relevant data from the literature. The simulation domain was defined as 9 m × 9 m × 4 m, with a grid resolution of 1 m × 1 m × 1 m. Meteorological boundary conditions were set to full forcing, and each simulation covered a 168 h period (seven days). Additional grid resolutions (2 m × 2 m × 2 m and 3 m × 3 m × 3 m) were also tested; however, no appreciable differences were observed, while computational time increased unnecessarily.
- iv
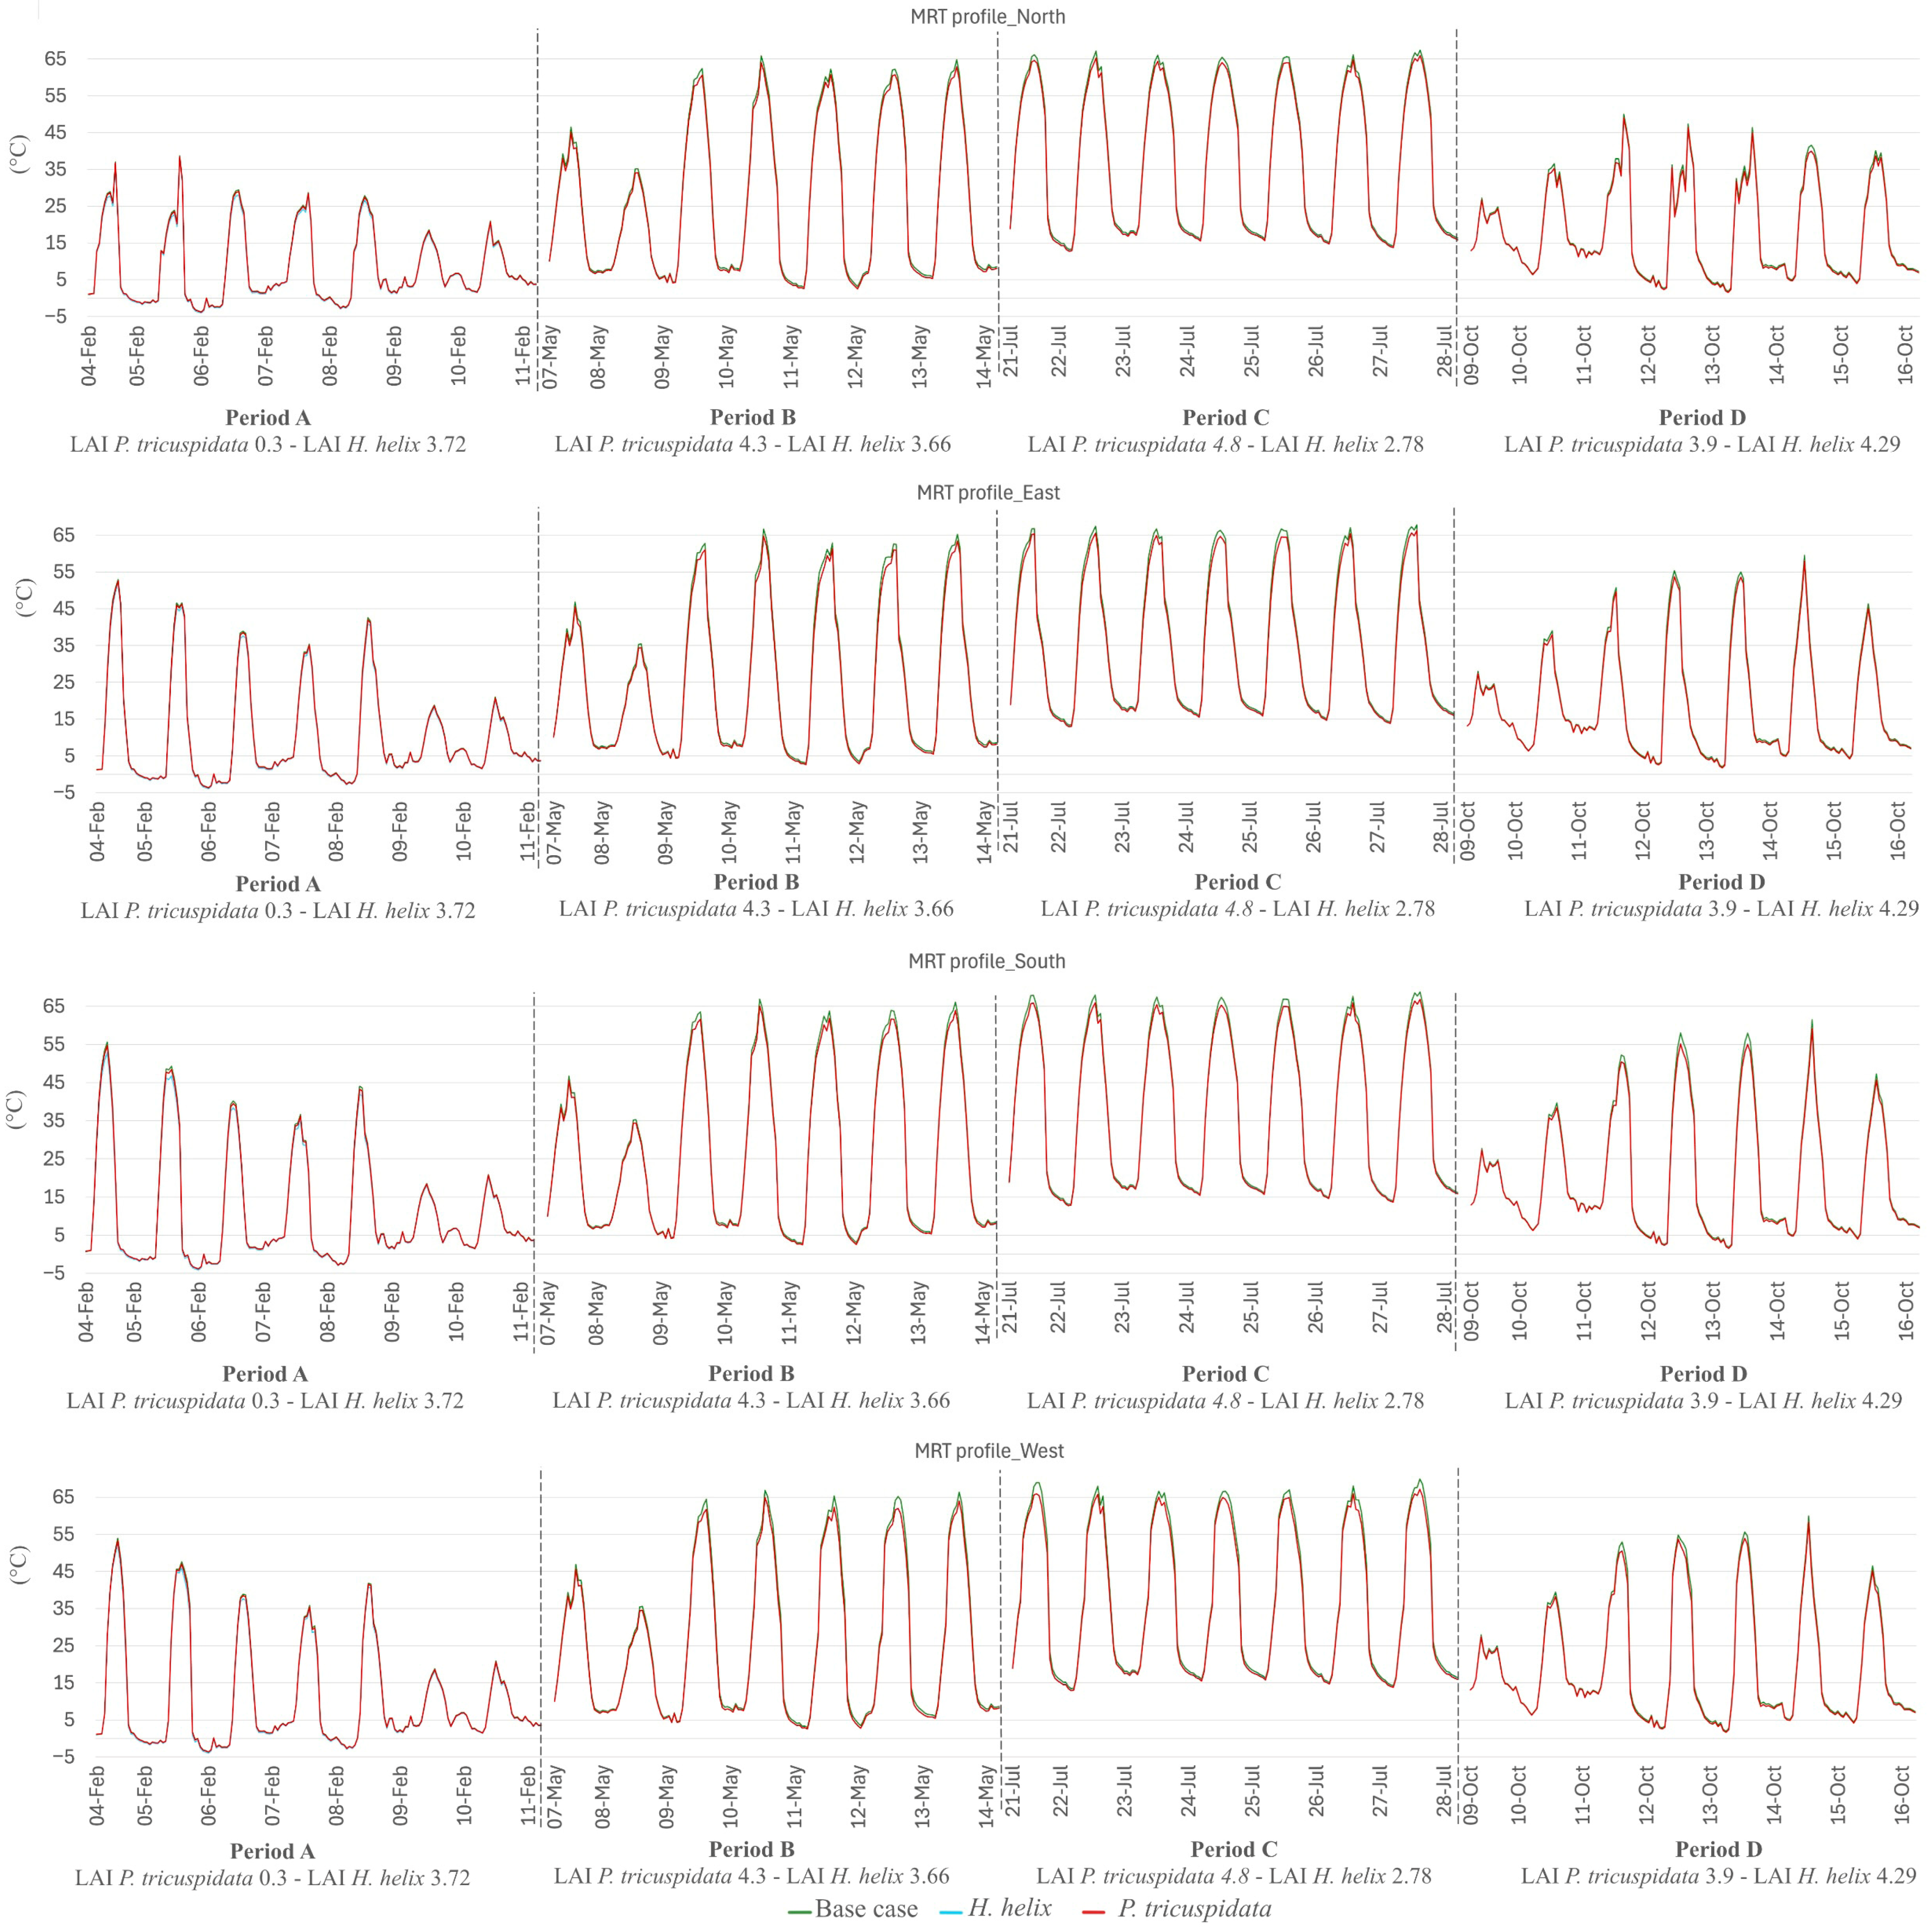
- In outdoor thermal comfort research, the Physiological Equivalent Temperature (PET) and the Universal Thermal Climate Index (UTCI) are among the most widely used indicators [68,69]. UTCI is based on Fiala’s multi-node thermoregulation model [70], which relates the physiological effects of complex thermal environments on the human body to those observed under a standardized air temperature (Ta), emphasizing stress prediction under extreme conditions [71]. Conversely, PET is derived from the Munich Energy Balance Model for Individuals (MEMI) using a two-node approach [72]. It represents the air temperature at which, in a typical indoor setting, the human heat budget is balanced with the same core and skin temperatures as those under the outdoor conditions being assessed. Namely, the PET defines all incoming and outgoing fluxes in the human body; therefore, PET is considered a robust biometeorological parameter because it links physical environmental variables to human thermal perception [73], also involving MRT values. Based on PET’s ability to effectively quantify the relationship between MRT reduction and heat stress levels under different vegetation configurations, PET was selected as the most reliable metric for this study. The calculation of PET requires air temperature, humidity, wind speed, and radiation as input parameters. In this study, PET was computed using ENVI-met software, which, according to the BIO-met model, considers a 35-year-old man with average physiological characteristics. ENVI-met calculates PET values using 3D vegetation models that incorporate plant physiological properties as well as leaf-level characteristics. In addition, ENVI-met applies a complex ray-tracing algorithm to quantify shading (i.e., the reduction in incident solar radiation) and to model longwave radiation exchanges within the vegetation canopy, which constitute primary drivers of PET reduction.
3.2. ENVI-Met Setup and Green Façade Calculation
4. Results
4.1. Wall Temperature T0
4.2. Longwave Radiation
4.3. PET
4.4. Correlation Between Air Temperature, T0, and PET
5. Discussion
6. Limitations
7. Conclusions
Author Contributions
Funding
Institutional Review Board Statement
Informed Consent Statement
Data Availability Statement
Acknowledgments
Conflicts of Interest
References
- Cuce, P.M.; Cuce, E.; Santamouris, M. Towards sustainable and climate-resilient cities: Mitigating urban heat islands through green infrastructure. Sustainability 2025, 17, 1303. [Google Scholar] [CrossRef]
- Berardi, U.; GhaffarianHoseini, A.; Ghaffarian Hoseini, A. State-of-the-art analysis of the environmental benefits of green roofs. Appl. Energy 2014, 115, 411–428. [Google Scholar] [CrossRef]
- De Cristo, E.; Evangelisti, L.; Barbaro, L.; De Lieto Vollaro, R.; Asdrubali, F. A Systematic Review of Green Roofs’ Thermal and Energy Performance in the Mediterranean Region. Energies 2025, 18, 2517. [Google Scholar] [CrossRef]
- Lai, D.; Liu, W.; Gan, T.; Liu, K.; Chen, Q. A review of mitigating strategies to improve the thermal environment and thermal comfort in urban outdoor spaces. Sci. Total Environ. 2019, 661, 337–353. [Google Scholar] [CrossRef]
- Cui, Y.; Tang, J.; He, B.J. Progressive trend, conceptual terminology, and future directions of green façade research: A review of literature in 2010–2023. Int. J. Environ. Sci. Technol. 2025, 22, 10991–11010. [Google Scholar] [CrossRef]
- Janhäll, S. Review on urban vegetation and particle air pollution—Deposition and dispersion. Atmos. Environ. 2015, 105, 130–137. [Google Scholar] [CrossRef]
- Cai, B.; Cheng, H.; Xiang, F.; Wang, H.; Kang, T. Modeling the Effects of Vegetation on Air Purification Through Computational Fluid Dynamics in Different Neighborhoods of Beijing. Buildings 2025, 15, 995. [Google Scholar] [CrossRef]
- Medl, A.; Stangl, R.; Florineth, F. Vertical greening systems—A review on recent technologies and research advancement. Build. Environ. 2017, 125, 227–239. [Google Scholar] [CrossRef]
- Coma, J.; Perez, G.; de Gracia, A.; Burés, S.; Urrestarazu, M.; Cabeza, L.F. Vertical greenery systems for energy savings in buildings: A comparative study between green walls and green façades. Build. Environ. 2017, 111, 228–237. [Google Scholar] [CrossRef]
- Song, X.; Hao, X.; Lin, Y.; Ai, G.; Yin, W.; Hu, J.; Zhang, S. Energy performance assessment on vertical greening systems with green roof in hot summer and cold winter regions based on long-term experimental data. Urban For. Urban Green. 2025, 103, 128597. [Google Scholar] [CrossRef]
- Radić, M.; Brković Dodig, M.; Auer, T. Green façades and living walls—A review establishing the classification of construction types and mapping the benefits. Sustainability 2019, 11, 4579. [Google Scholar] [CrossRef]
- Perini, K.; Ottelé, M.; Haas, E.; Raiteri, R. Greening the building envelope, façade greening and living wall systems. Open J. Ecol. 2011, 1, 1–8. [Google Scholar] [CrossRef]
- Masi, F. Green walls and green roof—Some experiences from the field. In Emerging Developments in Constructed Wetlands; Kumar Yadav, A., Vymazal, J., Zhao, Y., Srivastava, P., Eds.; Elsevier: Amsterdam, The Netherlands, 2025; pp. 447–461. [Google Scholar]
- Manso, M.; Castro-Gomes, J. Green wall systems: A review of their characteristics. Renew. Sustain. Energy Rev. 2015, 41, 863–871. [Google Scholar] [CrossRef]
- Pérez, G.; Rincón, L.; Vila, A.; González, J.M.; Cabeza, L.F. Behaviour of green façades in Mediterranean Continental climate. Energy Convers. Manag. 2011, 52, 1861–1867. [Google Scholar] [CrossRef]
- Djedjig, R.; Belarbi, R.; Bozonnet, E. Experimental study of green walls impacts on buildings in summer and winter under an oceanic climate. Energy Build. 2017, 150, 403–411. [Google Scholar] [CrossRef]
- Bianco, L.; Serra, V.; Larcher, F.; Perino, M. Thermal behaviour assessment of a novel vertical greenery module system: First results of a long-term monitoring campaign in an outdoor test cell. Energy Effic. 2017, 10, 625–638. [Google Scholar] [CrossRef]
- Kumar, P.; Debele, S.E.; Khalili, S.; Halios, C.H.; Sahani, J.; Aghamohammadi, N.; Andrade, M.F.; Athanassiadou, M.; Bhui, K.; Calvillo, N.; et al. Urban heat mitigation by green and blue infrastructure: Drivers, effectiveness, and future needs. Innovation 2024, 5, 100588. [Google Scholar] [CrossRef]
- Teh, C.; Henson, I.E.; Goh, K.; Husni, M. The effect of leaf shape on the interception of solar radiation. J. Plant Physiol. 2006, 1, 12–27. [Google Scholar]
- Pianella, A.; Aye, L.; Chen, Z.; Williams, N.S.G. Substrate Depth, Vegetation and Irrigation Affect Green Roof Thermal Performance in a Mediterranean Type Climate. Sustainability 2017, 9, 1451. [Google Scholar] [CrossRef]
- Xu, H.; Chen, H.; Qian, C.; Li, J. The Evapotranspiration Characteristics and Evaporative Cooling Effects of Different Vegetation Types on an Intensive Green Roof: Dynamic Performance Under Different Weather Conditions. Sustainability 2024, 16, 10812. [Google Scholar] [CrossRef]
- Ascione, F.; De Masi, R.F.; Mastellone, M.; Ruggiero, S.; Vanoli, G.P. Green Walls, a Critical Review: Knowledge Gaps, Design Parameters, Thermal Performances and Multi-Criteria Design Approaches. Energies 2020, 13, 2296. [Google Scholar] [CrossRef]
- Bakhshoodeh, R.; Ocampo, C.; Oldham, C. Exploring the evapotranspirative cooling effect of a green façade. Sustain. Cities Soc. 2022, 81, 103822. [Google Scholar] [CrossRef]
- Li, H.; Zhao, Y.; Sützl, B.; Kubilay, A.; Carmeliet, J. Impact of green walls on ventilation and heat removal from street canyons: Coupling of thermal and aerodynamic resistance. Build. Environ. 2022, 214, 108945. [Google Scholar] [CrossRef]
- Ottelé, K.; Perini, E.; Haas, M. Life cycle assessment (LCA) of green façades and living wall systems. In Eco-Efficient Construction and Building Materials; Pacheco-Torgal, F., Cabeza, L.F., Labrincha, J., de Magalhães, A., Eds.; Woodhead Publishing: Cambridge, UK, 2014; pp. 457–483. [Google Scholar]
- Shafiee, E.; Faizi, M.; Yazdanfar, S.; Khanmohammadi, M.A. Assessment of the effect of living wall systems on the improvement of the urban heat island phenomenon. Build. Environ. 2020, 181, 106923. [Google Scholar] [CrossRef]
- Victorero, F.; Vera, S.; Bustamante, W.; Tori, F.; Bonilla, C.; Gironás, J.; Rojas, V. Experimental study of the thermal performance of living walls under semiarid climatic conditions. Energy Procedia 2015, 78, 3416–3421. [Google Scholar] [CrossRef]
- Salah, G.M.J.A.; Romanova, A. Life cycle assessment of felt system living green wall: Cradle to grave case study. Environ. Chall. 2021, 3, 100046. [Google Scholar] [CrossRef]
- Bustami, R.; Belusko, M.; Ward, J.; Beecham, S. Vertical greenery systems: A systematic review of research trends. Build. Environ. 2018, 146, 226–237. [Google Scholar] [CrossRef]
- Lin, H.; Li, X. The Role of Urban Green Spaces in Mitigating the Urban Heat Island Effect: A Systematic Review from the Perspective of Types and Mechanisms. Sustainability 2025, 17, 6132. [Google Scholar] [CrossRef]
- Manso, M.; Teotónio, I.; Silva, C.M.; Cruz, C.O. Green roof and green wall benefits and costs: A review of the quantitative evidence. Renew. Sustain. Energy Rev. 2021, 135, 110111. [Google Scholar] [CrossRef]
- Eumorfopoulou, E.A.; Kontoleon, K.J. Experimental approach to the contribution of plant-covered walls to the thermal behaviour of building envelopes. Build. Environ. 2009, 44, 1024–1038. [Google Scholar] [CrossRef]
- Priya, U.K.; Senthil, R. Passive cooling of residential buildings in tropical climates using user-preferred plant species in green walls. J. Build. Eng. 2025, 107, 112732. [Google Scholar] [CrossRef]
- He, Y.; Ren, C.; Mak, H.; Lin, C.; Wang, Z.; Fung, J.; Li, Y.; Lau, A.; Ng, E. Investigations of high-density urban boundary layer under summer prevailing wind conditions with Doppler LiDAR: A case study in Hong Kong. Urban Clim. 2021, 38, 100884. [Google Scholar] [CrossRef]
- Carlo, O.C.; Fellini, S.; Palusci, O.; Marro, M.; Salizzoni, P.; Buccolieri, R. Influence of obstacles on urban canyon ventilation and air pollutant concentration: An experimental assessment. Build. Environ. 2024, 250, 111143. [Google Scholar] [CrossRef]
- Jiang, G.; Wu, M.; Li, H.; Wu, Y. Mechanism of Wind and Buoyancy Driving on Ventilation and Pollutant Transport in an Idealized Urban Street Canyon. Buildings 2024, 14, 3168. [Google Scholar] [CrossRef]
- Baş, H.; Andrianne, T.; Reiter, S. City configurations to optimise pedestrian level ventilation and wind comfort. Sustain. Cities Soc. 2024, 114, 105745. [Google Scholar] [CrossRef]
- Lehnert, M.; Kremser, J.; Janků, Z.; Květoňová, V.; Geletič, J. Assessing green walls’ effects on outdoor human thermal exposure in temperate climate cities. Sci. Rep. 2025, 15, 42053. [Google Scholar] [CrossRef]
- Dehghan Lotfabad, A.; Hosseini, S.M.; Dabove, P.; Heiranipour, M.; Sommese, F. Impacts of Vertical Greenery on Outdoor Thermal Comfort and Carbon Emission Reduction at the Urban Scale in Turin, Italy. Buildings 2025, 15, 450. [Google Scholar] [CrossRef]
- Pérez, G.; Coma, J.; Chàfer, M.; Cabeza, F.F. Seasonal influence of leaf area index (LAI) other energy performance of a green façade. Build. Environ. 2022, 207, 108497. [Google Scholar] [CrossRef]
- Poiss, M.; Briefer, A.; Scharf, B.; Spörl, P.; Stangl, R. Vertical greenery as natural shading of glass façades: Bioshading coefficients for 4 climbing plant species for assessment of shading performance. Build. Environ. 2025, 283, 113399. [Google Scholar] [CrossRef]
- Pérez, G.; Coma, J.; Sol, S.; Cabeza, L.F. Green façade for energy savings in buildings: The influence of leaf area index and façade orientation on the shadow effect. Appl. Energy 2017, 187, 424–437. [Google Scholar] [CrossRef]
- Ghasaban, M.; Mirjalili, P.; Yeganeh, M. Integration of building envelope with open spaces and greenery to enhance thermal and visual comfort and energy efficiency in office buildings. Results Eng. 2025, 25, 103660. [Google Scholar] [CrossRef]
- Poddar, D.; Park, S.; Chang, S. Energy performance analysis of a dormitory building based on different orientations and seasonal variations of leaf area index. Energy Effic. 2017, 10, 887–903. [Google Scholar] [CrossRef]
- Ansari, A.Q.; Loomis, W.E. Leaf Temperatures. Am. J. Bot. 1959, 6, 713–717. [Google Scholar] [CrossRef]
- Moss, R.A.; Loomis, W.E. Absorption Spectra of Leaves. I. The Visible Spectrum. Plant Physiol. 1952, 27, 370–391. [Google Scholar] [CrossRef] [PubMed]
- Gates, D.M. Leaf temperature and energy exchange. Arch. Meteorol. Geophys. Bioklimatol. Ser. B 1962, 12, 321–336. [Google Scholar] [CrossRef]
- Cuimin, L.; Wei, J.; Li, C. Influence of foliage thickness on thermal performance of green façades in hot and humid climate. Energy Build. 2019, 199, 72–87. [Google Scholar] [CrossRef]
- Heinrichs, S.; Schmidt, W. Dynamics of Hedera helix L. in Central European beech forests on limestone: Results from long-term monitoring and experimental studies. Plant Ecol. 2015, 216, 1–15. [Google Scholar] [CrossRef]
- Pichlhöfer, A.; Korjenic, A.; Sulejmanovski, A.; Streit, E. Influence of Façade Greening with Ivy on Thermal Performance of Masonry Walls. Sustainability 2023, 15, 9546. [Google Scholar] [CrossRef]
- Setiawan, G.D.; Przybysz, A.; Treesubsuntorn, C.; Popek, R. Effect of simulated rain and rain frequency on particulate matter re-accumulation in roadside climbers Parthenocissus quinquefolia. Environ. Pollut. 2025, 382, 126649. [Google Scholar] [CrossRef]
- Qi, S.; Utaberta, N.; Kiet, A.L.K.; Yanfang, X.; Xiyao, H. Effects of green façade retrofitting on thermal performance and energy efficiency of existing buildings in northern China: An experimental study. Energy Build. 2025, 335, 115550. [Google Scholar] [CrossRef]
- Di Bacco, M.; Scorzini, A.R. Recent changes in temperature extremes across the north-eastern region of Italy and their relationship with large-scale circulation. Clim. Res. 2020, 81, 167–185. [Google Scholar] [CrossRef]
- Chandler, W.S.; Stackhouse, P.W., Jr.; Hoell, J.M.; Westberg, D.; Zhang, T. NASA prediction of worldwide energy resource high resolution meteorology data for sustainable building design. In Proceedings of the Solar 2013 Conference of American Solar Energy Society, Baltimore, MD, USA, 16–20 April 2013. [Google Scholar]
- Rodrigues, G.C.; Braga, R.P. Evaluation of NASA POWER Reanalysis Products to Estimate Daily Weather Variables in a Hot Summer Mediterranean Climate. Agronomy 2021, 11, 1207. [Google Scholar] [CrossRef]
- Aboelkhair, H.; Mostafa, M.; El Afandi, G. Assessment of agroclimatology NASA POWER reanalysis datasets for temperature types and relative humidity at 2 m against ground observations over Egypt. Adv. Space Res. 2019, 64, 129–142. [Google Scholar] [CrossRef]
- Monteiro, A.L.; Sentelhas, P.C.; Pedra, G.U. Assessment of NASA/POWER satellite-based weather system for Brazilian conditions and its impact on sugarcane yield simulation. Int. J. Climatol. 2018, 38, 1571–1581. [Google Scholar] [CrossRef]
- Qin, H.; Zhou, B. Optimizing Vegetation Configurations for Seasonal Thermal Comfort in Campus Courtyards: An ENVI-Met Study in Hot Summer and Cold Winter Climates. Plants 2025, 14, 1670. [Google Scholar] [CrossRef] [PubMed]
- Jim, C.Y. Thermal performance of climber greenwalls: Effects of solar irradiance and orientation. Appl. Energy 2015, 154, 631–643. [Google Scholar] [CrossRef]
- Fang, H.; Baret, F.; Plummer, S.; Schaepman-Strub, G. An overview of global leaf area index (LAI): Methods, products, validation, and applications. Rev. Geophys. 2019, 57, 739–799. [Google Scholar] [CrossRef]
- Campiotti, C.A.; Giagnacovo, G.; Latini, A.; Mariani, S.; Sperandei, M.; Pace, S.; Campiotti, A.; Di Bonito, R.; Marone, A. Gli ecosistemi Vegetali per la Rigenerazione Ecologica Delle Città; Rapporto Tecnico ENEA-RT-2021-13; ENEA: Roma, Italy, 2021. [Google Scholar]
- He, Y.; Lin, E.S.; Yu, Z.; Tan, C.L.; Yok Tan, P.; Hien Wong, N. The effect of dynamic albedos of plant canopy on thermal performance of rooftop greenery: A case study in Singapore. Build. Environ. 2021, 205, 108247. [Google Scholar] [CrossRef]
- Chen, C. Determining the Leaf Emissivity of Three Crops by Infrared Thermometry. Sensors 2015, 15, 11387–11401. [Google Scholar] [CrossRef]
- Liu, Z.; Zheng, S.; Zhao, L. Evaluation of the ENVI-Met Vegetation Model of Four Common Tree Species in a Subtropical Hot-Humid Area. Atmosphere 2018, 9, 198. [Google Scholar] [CrossRef]
- Deardorff, J.W. Efficient prediction of ground surface temperature and moisture with inclusion of a layer of vegetation. J. Geophys. Res. 1978, 83, 1889–1903. [Google Scholar] [CrossRef]
- Jacobs, C.M.J. Direct Impact of Atmospheric CO2 Enrichment on Regional Transpiration. Ph.D. Thesis, Wageningen Agricultural University, Wageningen, The Netherlands, 1994. [Google Scholar]
- Ciacci, C.; Banti, N.; Di Naso, V.; Bazzocchi, F. Evaluating UHI Mitigation and Outdoor Comfort in a Heritage Context: A Microclimate Simulation Study of Florence’s Historic Center. Sustainability 2025, 17, 8760. [Google Scholar] [CrossRef]
- Liu, T.; Wang, Y.; Zhang, L.; Xu, N.; Tang, F. Outdoor Thermal Comfort Research and Its Implications for Landscape Architecture: A Systematic Review. Sustainability 2025, 17, 2330. [Google Scholar] [CrossRef]
- Staiger, H.; Laschewski, G.; Matzarakis, A. Selection of Appropriate Thermal Indices for Applications in Human Biometeorological Studies. Atmosphere 2019, 10, 18. [Google Scholar] [CrossRef]
- Bröde, P.; Fiala, D.; Błazejczyk, K.; Holmér, I.; Jendritzky, G.; Kampmann, B.; Tinz, B.; Havenith, G. Deriving the Operational Procedure for the Universal Thermal Climate Index (UTCI). Int. J. Biometeorol. 2012, 56, 481–494. [Google Scholar] [CrossRef] [PubMed]
- Blazejczyk, K.; Epstein, Y.; Jendritzky, G.; Staiger, H.; Tinz, B. Comparison of UTCI to Selected Thermal Indices. Int. J. Biometeorol. 2012, 56, 515–535. [Google Scholar] [CrossRef] [PubMed]
- Matzarakis, A.; Mayer, H.; Iziomon, M.G. Applications of a universal thermal index: Physiological equivalent temperature. Int. J. Biometeorol. 1999, 43, 76–84. [Google Scholar] [CrossRef]
- Mendes, P.T.; Nouri, A.S.; Matzarakis, A. Evaluating Outdoor Human Thermal Comfort Through Climate-Resilient Adaptation: A Case Study at School of Science and Technology (NOVA FCT) Campus. Atmosphere 2025, 16, 677. [Google Scholar] [CrossRef]
- Qiao, L. Study on the Dynamic Heat Transfer Role of Vertical Greening in Building Microclimate Based on Multi-Objective Coupling. J. Renew. Sustain. Energy 2025, 17, 025101. [Google Scholar] [CrossRef]
- Bruse, M.; Fleer, H. Simulating Surface–Plant–Air Interactions inside Urban Environments with a Three Dimensional Numerical Model. Environ. Model. Softw. 1998, 13, 373–384. [Google Scholar] [CrossRef]
- Simon, H.; Lindén, J.; Hoffmann, D.; Braun, P.; Bruse, M.; Esper, J. Modeling transpiration and leaf temperature of urban trees—A case study evaluating the microclimate model ENVI-met against measurement data. Landsc. Urban Plann. 2018, 174, 33–40. [Google Scholar] [CrossRef]
- Bruse, M.; Helge, S.; Sinsel, T. Development and Implementation of a High-Resolution Dynamical Wall and Roof Model for ENVI-met. Part 2: Vegetated Walls and Roofs. 18 September 2023. Available online: https://doi.org/10.13140/RG.2.2.36020.83842 (accessed on 14 January 2026).





| Period | Simulation Date | LAI P. tricuspidata (*) | LAI H. helix (*) | Average Albedo P. tricuspidata ** | Average Albedo H. helix ** | Emissivity P. tricuspidata | Emissivity H. helix |
|---|---|---|---|---|---|---|---|
| A | 4–11 February 2024 | 0.40 (0.48) | 3.72 (3.73) | 0.30 | 0.20 | 0.95 | 0.97 |
| B | 7–14 May 2024 | 4.30 (4.48) | 3.66 (3.65) | 0.22 | 0.20 | 0.95 | 0.97 |
| C | 21–27 July 2024 | 4.80 (4.90) | 2.78 (2.90) | 0.22 | 0.20 | 0.95 | 0.97 |
| D | 9–16 October 2024 | 3.90 (4.03) | 4.29 (4.23) | 0.18 | 0.20 | 0.95 | 0.97 |
| Simulation area | 44°48′05.3″ N; 10°19′40.8″ E |
| Köppen–Geiger classification | Cfa |
| Modeling area domain | 9 m × 9 m × 4 m |
| Grid dimension | 1 m × 1 m × 1 m |
| Meteorological boundary condition | Full forcing |
| Simulation duration for each period (h) | 168 h |
| Simulation starting time | 05:00 a.m. |
| Thickness of vegetation layer (∆C) | 0.10 m |
| Air gap size between substrate and building wall (∆AG) | 0.00 m |
| Material | Thermal Conductivity | Emissivity | Absorption | Transmission | Reflection |
|---|---|---|---|---|---|
| Default plaster | 0.6 | 0.93 | 0.60 | 0.00 | 0.40 |
| Default insulation | 0.07 | 0.90 | 0.50 | 0.00 | 0.50 |
| Default concrete | 1.6 | 0.90 | 0.70 | 0.00 | 0.30 |
| Period | Orientation | Base Case | Hedera helix | Parthenocissus tricuspidata | ||||||
|---|---|---|---|---|---|---|---|---|---|---|
| T0 Range from 9 am to 5 pm (°C) | T0 Range from 9 am to 5 pm (°C) | Max °T Reduction (°C) | Date with Maximum °T Reduction | Time with °T Reduction > 10 °C (Duration/h) | T0 Range from 9 am to 5 pm (°C) | Max °T Reduction (°C) | Date with Maximum °T Reduction | Time with °T Reduction > 10 °C (Duration/h) | ||
| A | North | 4.5–18.9 | 1.6–12.6 | 8.3 | 6 February | / | 3.8–17.9 | 1.8 | 8 February | / |
| East | 5.0–22.3 | 1.7–13.0 | 11.9 | 5 February | 11:00–12:00 (1) | 4.2–19.9 | 3.6 | 8 February | / | |
| South | 5.1–36.3 | 1.7–13.3 | 23.0 | 4 February | 11:00–17:00 (6) | 4.34–31.2 | 5.1 | 4 February | / | |
| West | 4.7–29.8 | 1.7–13.0 | 20.0 | 5 February | 11:00–17:00 (6) | 4.0–24.5 | 5.9 | 5 February | / | |
| B | North | 15.4–35.6 | 12.0–22.5 | 13.1 | 13 May | 11:00–17:00 (6) | 11.5–22.0 | 13.7 | 13 May | 10:00–17:00 (7) |
| East | 15.3–37.6 | 12.3–22.1 | 22.4 | 12 May | 09:00–17:00 (8) | 11.7–21.5 | 23.1 | 12 May | 09:00–17:00 (8) | |
| South | 15.4–45.2 | 11.9–22.2 | 23.5 | 13 May | 09:00–17:00 (8) | 11.4–21.5 | 24.1 | 13 May | 09:00–17:00 (8) | |
| West | 15.4–52.1 | 11.8–22.2 | 31.3 | 12 May | 09:00–17:00 (8) | 11.3–21.5 | 32.0 | 12 May | 09:00–17:00 (8) | |
| C | North | 27.4–41.4 | 22.0–30.9 | 11.9 | 22 July | 12:00–16:00 (4) | 21.0–29.4 | 13.7 | 22 July | 11:00–17:00 (6) |
| East | 35.6–46.8 | 22.4–30.7 | 20.5 | 25 July | 09:00–16:00 (7) | 21.1–39.1 | 22.4 | 25 July | 09:00–17:00 (8) | |
| South | 28.7–49.9 | 21.9–30.9 | 20.5 | 21 July | 10:00–17:00 (7) | 20.9–29.2 | 22.1 | 21 July | 10:00–17:00 (7) | |
| West | 26.9–57.4 | 21.8–31.3 | 28.7 | 21 July | 13:00–17:00 (4) | 20.9–29.2 | 30.8 | 21 July | 13:00–17:00 (4) | |
| D | North | 13.2–25.7 | 8.5–19.2 | 9.3 | 14 October | / | 8.4–19.2 | 9.2 | 14 October | / |
| East | 16.3–29.6 | 8.7–19.2 | 17.9 | 12 October | 09:00–13:00 (4) | 8.7–19.2 | 17.8 | 12 October | 09:00–13:00 (4) | |
| South | 16.3–40.2 | 8.6–19.5 | 25.8 | 13 October | 10:00–17:00 (7) | 8.5–19.6 | 25.6 | 13 October | 10:00–17:00 (7) | |
| West | 13.1–39.3 | 8.5–19.2 | 21.8 | 11 October | 09:00–17:00 (8) | 8.5–19.2 | 21.8 | 11 October | 09:00–17:00 (8) | |
| Hedera helix | Parthenocissus tricuspidata | ||||||
|---|---|---|---|---|---|---|---|
| Average T0 Diff (°C) | Max T0 Diff (°C) | Min T0 Diff (°C) | Average T0 Diff (°C) | Max T0 Diff (°C) | Min T0 Diff (°C) | ||
| A | North | 2.8 | 5.5 | 1.7 | 0.7 | 1.4 | 0.1 |
| East | 3.1 | 5.8 | 1.9 | 0.7 | 1.3 | 0.2 | |
| South | 4.0 | 14.4 | 1.7 | 0.7 | 2.1 | −0.2 | |
| West | 4.4 | 20.0 | 1.9 | 1.1 | 0.2 | 0.2 | |
| B | North | 4.3 | 7.3 | 1.8 | 4.7 | 7.7 | 2.2 |
| East | 4.3 | 6.4 | 1.9 | 4.7 | 6.8 | 2.2 | |
| South | 4.6 | 7.2 | 1.8 | 5.0 | 7.6 | 2.2 | |
| West | 6.2 | 13.3 | 2.2 | 6.6 | 13.7 | 2.5 | |
| C | North | 3.9 | 5.0 | 3.0 | 4.8 | 5.8 | 3.8 |
| East | 4.1 | 4.6 | 3.3 | 4.9 | 5.5 | 4.1 | |
| South | 4.3 | 5.2 | 3.1 | 5.2 | 6.0 | 3.9 | |
| West | 6.3 | 8.8 | 4.7 | 7.2 | 9.8 | 5.6 | |
| D | North | 2.7 | 4.8 | 0.9 | 2.9 | 4.8 | 1.1 |
| East | 3.0. | 5.5 | 1.0 | 3.1 | 5.5 | 1.1 | |
| South | 3.8 | 8.4 | 1.0 | 3.9 | 8.4 | 1.1 | |
| West | 4.0 | 9.7 | 1.0 | 4.1 | 9.7 | 1.1 | |
| Period | Orientation | Base Case | Hedera helix | Parthenocissus tricuspidata | ||||||
|---|---|---|---|---|---|---|---|---|---|---|
| PET Range from 9 am to 5 pm (°C) | PET Range from 9 am to 5 pm (°C) | Max °T Reduction (°C) | Date with Maximum °T Reduction | Time with °T Reduction > 10 °C (Duration/h) | PET Range from 9 am to 5 pm (°C) | Max °T Reduction (°C) | Date with Maximum °T Reduction | Time with °T Reduction > 10 °C (Duration/h) | ||
| A | North | 10.0–24.1 | 9.9–23.7 | 0.5 | 8 February | / | 9.9–24.0 | 0.2 | 8 February | / |
| East | 10.6–36.7 | 10.5–36.1 | 0.8 | 4 February | / | 10.5–36.5 | 0.3 | 4 February | / | |
| South | 9.6–31.5 | 9.5–30.2 | 1.3 | 4 February | 12:00–15:00 (3) | 9.6–31.0 | 0.5 | 4 February | / | |
| West | 9.8–36.2 | 9.7–35.2 | 1.2 | 4 February | 15:00–16:00 (1) | 9.8–35.8 | 0.5 | 4 February | / | |
| B | North | 20.9–53.5 | 20.7–51.1 | 2.4 | 13 May | 11:00–15:00 (4) | 20.7–51.0 | 2.5 | 13 May | 11:00–16:00 (5) |
| East | 18.4–50.4 | 18.2–49.4 | 1.7 | 12 May | 09:00–13:00 (4) | 18.2–49.4 | 1.7 | 12 May | 09:00–13:00 (4) | |
| South | 20.4–52.4 | 20.2–50.9 | 1.5 | 13 May | 11:00–15:00 (4) | 20.2–50.9 | 1.5 | 13 May | 11:00–15:00 (4) | |
| West | 18.7–54.2 | 18.5–50.3 | 3.9 | 12 May | 13:00–17:00 (4) | 18.5–50.3 | 3.9 | 12 May | 13:00–17:00 (4) | |
| C | North | 36.9–57.9 | 36.5–57.7 | 2.5 | 23 July | 14:00–17:00 (3) | 36.5–57.7 | 2.7 | 23 July | 14:00–17:00 (3) |
| East | 39.6–58.1 | 38.9–57.9 | 6.0 | 24 July | 09:00–11:00 (2) 16:00–17:00 (1) | 38.8–57.9 | 6.9 | 24 July | 09:00–11:00 (2) 16:00–17:00 (1) | |
| South | 36.7–58.2 | 36.3–58.1 | 2.9 | 23 July | 12:00–14:00 (2) | 36.1–58.0 | 2.9 | 23 July | 12:00–14:00 (2) | |
| West | 34.6–58.3 | 34.2–58.0 | 4.8 | 26-Jul | 13:00–17:00 (4) | 34.2–58.0 | 4.8 | 26 July | 13:00–17:00 (4) | |
| D | North | 17.2–38.2 | 17.1–37.4 | 0.8 | 13 October | / | 17.1–37.4 | 0.8 | 13 October | / |
| East | 20.2–41.3 | 20.1–40.5 | 1.4 | 12 October | 09:00–10:00 (1) | 20.1–0.5 | 1.5 | 12 October | 09:00–10:00 (1) | |
| South | 17.1–41.2 | 17.01–39.6 | 1.6 | 11:00–16:00 (5) | 17.0–39.6 | 1.6 | 13 October | 11:00–16:00 (5) | ||
| West | 19.3–42.0 | 19.0–41.3 | 1.6 | 12 October | 09:00–17:00 (8) | 19.0–41.3 | 1.7 | 12 October | 09:00–17:00 (8) | |
| Period A | Period B | Period C | Period D | ||||||||
|---|---|---|---|---|---|---|---|---|---|---|---|
| Air T (°C) | Air T (°C) | Air T (°C) | Air T (°C) | ||||||||
| North | |||||||||||
| T0 | Base case | 0.896 *** | T0 | Base case | 0.841 *** | T0 | Base case | 0.902 *** | T0 | Base case | 0.823 *** |
| H. helix | 0.721 *** | H. helix | 0.734 *** | H. helix | 0.862 *** | H. helix | 0.621 *** | ||||
| P. tricuspidata | 0.873 *** | P. tricuspidata | 0.722 *** | P. tricuspidata | 0.842 *** | P. tricuspidata | 0.630 *** | ||||
| PET | Base case | 0.871 *** | PET | Base case | 0.890 *** | PET | Base case | 0.907 *** | PET | Base case | 0.814 *** |
| H. helix | 0.871 *** | H. helix | 0.890 *** | H. helix | 0.907 *** | H. helix | 0.813 *** | ||||
| P. tricuspidata | 0.871 *** | P. tricuspidata | 0.890 *** | P. tricuspidata | 0.907 *** | P. tricuspidata | 0.813 *** | ||||
| East | |||||||||||
| T0 | Base case | 0.953 *** | T0 | Base case | 0.906 *** | T0 | Base case | 0.928 *** | T0 | Base case | 0.829 *** |
| H. helix | 0.728 *** | H. helix | 0.733 *** | H. helix | 0.870 *** | H. helix | 0.617 *** | ||||
| P. tricuspidata | 0.929 *** | P. tricuspidata | 0.719 *** | P. tricuspidata | 0.835 *** | P. tricuspidata. | 0.627 *** | ||||
| PET | Base case | 0.924 *** | PET | Base case | 0.906 *** | PET | Base case | 0.901 *** | PET | Base case | 0.819 *** |
| H. helix | 0.924 *** | H. helix | 0.905 *** | H. helix | 0.898 *** | H. helix | 0.822 *** | ||||
| P. tricuspidata | 0.924 *** | P. tricuspidata | 0.905 *** | P. tricuspidata | 0.898 *** | P. tricuspidata | 0.822 *** | ||||
| South | |||||||||||
| T0 | Base case | 0.900 *** | T0 | Base case | 0.877 *** | T0 | Base case | 0.909 *** | T0 | Base case | 0.776 *** |
| H. helix | 0.743 *** | H. helix | 0.726 *** | H. helix | 0.857 *** | H. helix | 0.633 *** | ||||
| P. tricuspidata. | 0.881 *** | P. tricuspidata | 0.713 *** | P. tricuspidata. | 0.832 *** | P. tricuspidata. | 0.645 *** | ||||
| PET | Base case | 0.931 *** | PET | Base case | 0.893 *** | PET | Base case | 0.915 *** | PET | Base case | 0.809 *** |
| H. helix | 0.932 *** | H. helix | 0.892 *** | H. helix | 0.912 *** | H. helix | 0.813 *** | ||||
| P. tricuspidata | 0.931 *** | P. tricuspidata | 0.892 *** | P. tricuspidata | 0.912 *** | P. tricuspidata | 0.813 *** | ||||
| West | |||||||||||
| T0 | Base case | 0.769 *** | T0 | Base case | 0.798 *** | T0 | Base case | 0.785 *** | T0 | Base case | 0.707 *** |
| H. helix | 0.726 *** | H. helix | 0.730 *** | H. helix | 0.846 *** | H. helix | 0.619 *** | ||||
| P. tricuspidata | 0.786 *** | P. tricuspidata | 0.719 *** | P. tricuspidata | 0.827 *** | P. tricuspidata | 0.627 *** | ||||
| PET | Base case | 0.912 *** | PET | Base case | 0.913 *** | PET | Base case | 0.920 *** | PET | Base case | 0.806 *** |
| H. helix | 0.915 *** | H. helix | 0.913 *** | H. helix | 0.919 *** | H. helix | 0.810 *** | ||||
| P. tricuspidata | 0.913 *** | P. tricuspidata | 0.913 *** | P. tricuspidata | 0.919 *** | P. tricuspidata | 0.810 *** | ||||
Disclaimer/Publisher’s Note: The statements, opinions and data contained in all publications are solely those of the individual author(s) and contributor(s) and not of MDPI and/or the editor(s). MDPI and/or the editor(s) disclaim responsibility for any injury to people or property resulting from any ideas, methods, instructions or products referred to in the content. |
© 2026 by the authors. Licensee MDPI, Basel, Switzerland. This article is an open access article distributed under the terms and conditions of the Creative Commons Attribution (CC BY) license.
Share and Cite
Gherri, B.; Rovetta, L.; Matoti, S.; Petraglia, A. Seasonal and Botanical Influences on External Thermal Performance near Green Façades: CFD Simulations on a Reference Building Envelope in a Humid Temperate Climate. Atmosphere 2026, 17, 342. https://doi.org/10.3390/atmos17040342
Gherri B, Rovetta L, Matoti S, Petraglia A. Seasonal and Botanical Influences on External Thermal Performance near Green Façades: CFD Simulations on a Reference Building Envelope in a Humid Temperate Climate. Atmosphere. 2026; 17(4):342. https://doi.org/10.3390/atmos17040342
Chicago/Turabian StyleGherri, Barbara, Lisa Rovetta, Sara Matoti, and Alessandro Petraglia. 2026. "Seasonal and Botanical Influences on External Thermal Performance near Green Façades: CFD Simulations on a Reference Building Envelope in a Humid Temperate Climate" Atmosphere 17, no. 4: 342. https://doi.org/10.3390/atmos17040342
APA StyleGherri, B., Rovetta, L., Matoti, S., & Petraglia, A. (2026). Seasonal and Botanical Influences on External Thermal Performance near Green Façades: CFD Simulations on a Reference Building Envelope in a Humid Temperate Climate. Atmosphere, 17(4), 342. https://doi.org/10.3390/atmos17040342