Article

Numerical Modelling of Urban Air Pollution from Residential Heating: A Case Study of Skopje

Faculty of Mechanical Engineering in Skopje, Ss. Cyril and Methodius University in Skopje, 1000 Skopje, Republic of North Macedonia
*
Author to whom correspondence should be addressed.
Atmosphere 2026, 17(3), 291; https://doi.org/10.3390/atmos17030291
Submission received: 31 January 2026 / Revised: 3 March 2026 / Accepted: 9 March 2026 / Published: 13 March 2026
(This article belongs to the Section Air Quality)

Abstract

Urban air pollution during winter is a major challenge in many cities, where emissions from residential heating lead to elevated particulate matter levels. Atmospheric dispersion modelling supports the understanding of spatial and temporal pollution behavior and enables the assessment of source contributions relevant for targeted mitigation. In this study, the ADMS-Urban dispersion model was applied to simulate hourly PM2.5 and PM10 concentrations across the city of Skopje, North Macedonia. Residential heating was the focus of the analysis, while emissions from road traffic and industrial activities were also included to ensure a realistic representation of the urban emission environment. A representative winter day was analyzed to examine the influence of wind patterns and diurnal boundary-layer height variability on particulate matter dispersion. Modelled concentrations were evaluated against measurements from urban air quality monitoring stations and showed good agreement in reproducing both night-time accumulation and daytime dispersion. The results indicate that household heating using biomass is the dominant contributor to wintertime particulate matter emissions, with PM10 prevailing over PM2.5. These findings underline the need for targeted emission reduction measures in the residential heating sector and demonstrate the usefulness of short-term dispersion modelling for supporting air quality management strategies in Skopje.

1. Introduction

Air pollution is one of the most significant environmental and health challenges of the 21st century. According to WHO estimates, around 99% of the world’s population is exposed to air pollution levels above recommended guideline values, with the greatest burden falling on low- and middle-income countries [1]. The observed mortality results from exposure to fine particulate matter, a major risk factor for cardiovascular and respiratory diseases and certain cancers [2,3]. Epidemiological research reports mortality associated with fine particulate matter (PM2.5) in both urban and rural areas. In China, the fraction of all-cause mortality attributable to PM2.5 was estimated at 2.89% in cities compared with 0.61% in rural areas, and annual mortality attributable to PM2.5 was also higher in urban areas (with an average of 16.5 deaths per 100,000) than in rural areas (3.4 per 100,000) [4]. In the United States, analyses of ambient PM2.5 concentrations across census tracts from 2010 to 2019 show that urban tracts consistently had higher mean PM2.5 levels (9.56 μg/m3 in 2010 and 7.51 μg/m3 in 2019) than rural tracts (8.51 μg/m3 in 2010 and 6.41 μg/m3 in 2019), indicating a greater pollutant burden in urban environments [5]. National air quality data from the United States show that mean annual PM2.5 concentrations decrease from approximately 11.15 µg/m3 in the most urban counties to about 8.87 µg/m3 in the most rural counties over the period 2008–2012, and the number of days with PM2.5 above standards declines similarly from urban to rural areas [6]. In global modelling of household and ambient PM2.5, national average personal exposure to PM2.5 from polluting fuels in 2020 was 151 µg/m3 overall, with rural households averaging about 171 µg/m3 and urban households about 92 µg/m3; corresponding estimates of attributable premature mortality per 100,000 population were 82 in rural and 66 in urban settings for polluting fuels, and 68 against 52 for clean fuel use [7]. Emissions in urban air pollution are heterogeneous and predominantly human-driven, from traffic and industrial facilities to individual domestic heating. Recent source apportionment research for fine particulate matter (PM2.5) in global cities shows that the contribution of within-city emissions varies widely, with an average of 37% (±22%) of PM2.5 exposure caused by emissions originating within the city itself in a sample of 96 cities. Across those cities, the largest city-internal contributors to PM2.5 exposure were industry and energy sectors, which were ranked as the dominant source in 43% and 30% of cities respectively, while surface transportation was the largest within-city source in only 13% of cities [8].
To effectively manage air quality and design effective mitigation measures, precise modelling tools for predicting pollutant concentrations are necessary. Atmospheric dispersion modelling uses mathematical equations, describing the atmosphere, dispersion and chemical and physical processes within the plume, allowing for understanding how pollutants are transported, dispersed and chemically transformed. A range of dispersion models is available, spanning from simple box models to advanced computational fluid dynamics models, each being appropriate for specific applications depending on spatial scale, environmental complexity, and the pollutants and concentration parameters [9]. Box models represent the simplest type of dispersion model, treating a defined volume of the atmosphere as a single well-mixed compartment in which pollutant concentrations are assumed spatially uniform. These models require minimal input data and computational resources but are limited in spatial resolution and are typically used for screening assessments or large-scale estimates. Lagrangian models simulate pollutant dispersion by following the trajectories of individual particles or puffs as they move through the atmosphere under advection and turbulent diffusion. They are stochastic in nature and can represent complex plume behaviours across a range of scales, making them suitable for regional and local assessments that account for variable meteorology. Eulerian models solve the advection–diffusion equation on a fixed spatial grid, calculating concentration fields as continuous scalar quantities across the domain, explicitly representing transport, dispersion, and chemical transformation processes, and are widely used for both regional and urban-scale simulations. Finally, computational fluid dynamics (CFD) models use numerical solutions of the Navier–Stokes equations coupled with turbulence closure schemes to resolve flow and dispersion at high spatial resolution, allowing detailed simulation of pollutant transport around complex terrain and built environments; these models are computationally intensive but offer the most detailed representation of fluid dynamics and dispersion processes [10,11]. Among these, Gaussian models are widely accepted by regulatory authorities in both Europe and the United States for air quality assessment and permitting purposes [12]. On this basis, a range of operational software tools has been developed, including AERMOD and ISCST3 in the United States and OML and UK-ADMS in Europe, as well as POLYPHEMUS for broader applications. Extensions of the Gaussian framework, such as ADMS-Urban, incorporate parameterisations for urban boundary layers, surface roughness, street-scale effects, and chemical transformation, enabling their application to complex urban environments while retaining the core assumptions of Gaussian dispersion theory [13]. Enhancements to ADMS-Urban introduced an urban canopy module and an advanced street canyon module to improve neighbourhood-scale flow and street-level dispersion. Validation using monitoring data in central London showed improved representation of wind-dependent in-canyon concentrations, with correlation coefficients between modelled and observed values typically increasing by around 10–30% compared with previous model versions [14]. Urban morphology parameterisation applied to Greater London enabled city-scale implementation of these modules while maintaining practical computational performance [15]. Validation against monitoring data in an asymmetric street canyon in Prague, Czech Republic showed that the advanced street canyon configuration of ADMS-Urban significantly improved short-term pollutant predictions, achieving high spatiotemporal performance for hourly NOx and PM10 concentrations and increasing overall model accuracy by up to 34% compared with the basic canyon formulation [16]. ADMS-Urban was applied to model urban PM2.5 concentrations from residential heating emissions in Wrocław, Poland. Validation against regulatory monitoring stations showed good performance, with the model reproducing over 50% of hourly concentrations within a factor of two of the measured values, indicating reliable agreement between modelled and observed data [17]. In Novi Sad, Serbia, ADMS-Urban was applied together with in situ measurements at five construction sites to model PM10 and PM2.5 concentrations during urban transformation, and comparison with observations showed that modelled values required correction coefficients of approximately 2.5 for PM10 and around 1.0 for PM2.5 to align with measured concentrations [18]. The ADMS-Urban climate model was applied at neighbourhood scale in Birmingham, UK, and its performance was validated through comparison with multiple observational datasets, including ground-based meteorological measurements and satellite-derived land surface temperature, showing good agreement (moderate to strong correlation R ≈ 0.6–0.8) in both temporal variability and spatial patterns [19]. ADMS-Urban was used to model street-scale road-traffic emissions in Hanoi, Vietnam, producing high-resolution CO, PM10 and PM2.5 concentration fields and identifying traffic pollution hotspots along major roadways [20]. In the West Midlands, UK, ADMS-Urban was similarly applied to assess traffic reduction scenarios, with model output evaluated against hourly monitoring data showing good overall performance in representing traffic-related pollutant concentrations [21]. Overall, available studies show that ADMS-Urban provides a robust and well-established framework for assessing urban air quality across a range of emission sources and spatial scales.
Despite persistent and severe air quality challenges in Skopje, few scientific studies have systematically quantified the sources and dynamics of urban air pollution in the city. Much of the available evidence has comprised public awareness and citizen science efforts, such as the “Home Heating of Skopje in a glance” monitoring initiative, which has highlighted spatiotemporal patterns of particulate matter but has not provided comprehensive source apportionment or modelling [22]. Among formal academic investigations, a source apportionment study by the AMBICON Laboratory at Goce Delčev University, implemented within a UNDP-led project in partnership with the Ministry of Environment and Physical Planning and the City of Skopje, applied receptor-based PMF-type modelling supported by chemical speciation of particulate matter. Internal evaluation using statistical diagnostics and seasonal consistency identified biomass combustion as the dominant wintertime source (36–57% in Novo Lisiche and 27–59% in Karpoš), alongside contributions from mineral dust, fuel oil combustion, and open burning [23]. This scarcity of peer-reviewed, quantitative source characterisation underscores the need for additional research using complementary approaches such as dispersion modelling to support evidence-based air quality management in Skopje. However, to date, no spatially resolved dispersion-based assessment has quantified the contribution of residential heating emissions to ambient particulate matter concentrations in Skopje under representative high-pollution winter conditions.
Therefore, this study applies the ADMS-Urban dispersion model to develop a spatially resolved assessment of ambient PM2.5 and PM10 concentrations arising from residential heating in Skopje, with the aim of quantifying its contribution to wintertime pollution episodes. A representative winter day was selected to capture conditions associated with elevated pollution levels, including stable atmospheric stratification and reduced dispersion. Modelled hourly average concentrations of PM2.5 and PM10 were evaluated against measurements from urban air quality monitoring stations to assess model performance, while meteorological characteristics such as wind patterns and boundary-layer conditions were analysed to support interpretation of the results. This integrated approach combining emission inventory development, dispersion modelling, and statistical evaluation enables source-specific spatial attribution under representative winter high-pollution conditions.

2. Materials and Methods

To investigate the spatial and temporal distribution of particulate matter concentrations arising from residential heating in the city of Skopje, the ADMS-Urban dispersion model, developed by Cambridge Environmental Research Consultants (CERC), version 5.1, was applied [24]. Residential heating emissions, which form the main focus of the analysis, were modelled primarily as area sources, while road traffic and industrial facilities were included as line and point sources, respectively, to provide a complete urban emission context.
The modelling methodology is structured into three main components: (i) the mathematical background of dispersion modelling for area sources in ADMS-Urban, (ii) data collection and processing, and (iii) model configuration and simulation setup.

2.1. Gaussian Dispersion Modelling of Area Sources in ADMS-Urban

In ADMS-Urban, pollutant dispersion is simulated using a Gaussian framework. Area sources are modelled as convex polygons, defined by the location of vertices of their base which is assumed to be in a horizontal plane positioned at a certain height. Residential heating emissions were represented as area sources to reflect the diffuse nature of household combustion within the urban environment. Each residential area source was internally decomposed by ADMS-Urban into a small number of finite crosswind line-source elements, and total concentrations at receptors were calculated by summing the contributions from all elements within the region of influence.
The concentration contribution C ¯ ( x , y , z ) from a finite crosswind line source of length L s is given by the Gaussian solution implemented in ADMS-Urban [24]:
C ¯ ( x , y , z ) = Q ¯ s 2 2 π   σ z x   U e x p ( ( z z s ) 2 2 σ z 2 ( x ) ) e r f y + L s / 2 2 σ y ( x ) e r f y L s / 2 2 σ y ( x ) + reflection   terms
where Q ¯ s is the source strength per unit length, U is the mean wind speed at release height, σ y ( x ) and σ z ( x ) are the crosswind and vertical dispersion parameters, z s is the effective release height, x , y , and z denote the downwind, crosswind, and vertical receptor coordinates, respectively.
Dispersion parameters σ y and σ z are derived from the boundary-layer variables (expressed as functions of boundary-layer height and Monin–Obukhov length), which represent atmospheric stability and temperature inversion effects, while the reflection terms account for ground effects.
For residential heating sources, emissions were released at the level of the building stack, and no buoyant plume rise was applied, consistent with low-height domestic chimneys and diffuse emissions. The modelled PM2.5 and PM10 concentrations therefore represent the combined effects of local dispersion from residential heating area sources, governed by atmospheric stability, wind conditions, and boundary-layer mixing, with deposition processes implicitly accounted for within the ADMS-Urban framework.

2.2. Data Collection: Providers of Data

The data necessary for household heating emissions’ calculations were collected from two state institutions, the State Statistical Office (STAT) in North Macedonia and the Spatial Planning Agency (SPA), part of the City of Skopje. STAT provided information about the total energy consumed in all households in the country spread by regions, including 8 regions: Vardar region, East region, South-east region, South-west region, Pelagonia region, Polog region, North-east region and Skopje region [25]. From all the abovementioned regions only the Skopje region was taken into analysis. SPA supplied data about the spatial (location-based) and areal (area-based) characteristics of each city district contained in the General Urban Plan of the city of Skopje 2022–2032. Spatial information was derived from the geographic position of each district, while areal information was obtained from the surface extent, both defined in the General Urban Plan of the city of Skopje 2022–2032 [26]. However, district-level data on the type of energy carrier used for residential heating were not publicly available. This information was extracted from a study titled “Home Heating of Skopje in a glance” conducted by United Nations Development Program (UNDP), the city of Skopje, Ministry of Finance of Slovak Republic and Ministry of Labor and Social Policy of North Macedonia [22]. Additionally, these data were checked and compared with the data regarding heating and gas infrastructure network coverage contained in the abovementioned General Urban Plan. The heating network coverage provided information about the share of households that use central heating from public heating plants as energy source. The total emissions originating from household heating using biomass were divided into emissions from area sources specific to each city district.
The data collection process for establishing industrial emission sources involved collaboration with two institutions in the country, the Ministry of Environment and Physical Planning (MOEPP) and the City of Skopje. These institutions are mandated to issue, amend, and revoke environmental permits and therefore maintain the most comprehensive official datasets on industrial installations. MOEPP is supervising the bigger industrial installations possessing A-Integrated environmental permits [27], whereas the City of Skopje supervises the medium and small industrial installations containing B-Integrated Environmental Permits [28].
Road traffic data were obtained through collaboration with two national institutions responsible for traffic monitoring in the City of Skopje: the Traffic Control Center (CUKS) and the Ministry of Interior (MoI). Hourly vehicles count data were collected from 79 monitored locations equipped with inductive loop detectors, recording traffic volumes at entry and exit points. Additional traffic information on vehicle classification and speed was obtained from a network of advanced traffic cameras at 24 locations across Skopje.

2.3. Data Processing

Energy consumption data for household heating were reported in different units depending on the energy carrier and the source of information. Electrical energy and district heating were expressed in kilowatt-hours, natural gas in normal cubic meters, heating oil in liters, liquefied petroleum gas in kilograms, coal in tons, and biomass fuels (wood and wood-based products) in either volumetric or mass-based units [29]. As electricity, biomass, and central heating accounted for the largest share of household energy use, the corresponding datasets were prioritized in the emission calculations.
To ensure consistency with emission factors defined on an energy basis, all fuel consumption data were converted to annual energy consumption expressed in gigajoules per year. For biomass fuels reported in volumetric units, the first step involved converting fuel volumes to mass using representative bulk density values. Representative bulk density values were selected to reflect typical moisture content and storage conditions, based on ranges reported in the EMEP/EEA Air Pollutant Emission Inventory Guidebook and national energy statistics [30].
Subsequently, biomass fuel consumption expressed in mass units was converted to energy units using fuel-specific lower heating values. The lower heating value was preferred over the higher heating value, as it more accurately represents the usable energy released during residential combustion by accounting for energy losses associated with fuel moisture. This harmonization process ensured that all biomass fuels, regardless of their original reporting units, were expressed on a consistent energy basis, enabling direct comparison between energy carriers and the application of energy-based emission factors in the emission assessment.
All environmental permits were reviewed individually, and relevant technical and operational data were extracted and compiled into a structured spreadsheet database covering industrial installations within the territory of the City of Skopje, subsequently defined as point sources. During data extraction, consistency of units, completeness of mandatory parameters, and compliance with ADMS input format requirements were systematically verified.

2.4. Model Configuration in ADMS Urban: Input

Diffuse emission activities were represented using the ADMS-Urban area-source structure. The modelling domain was subdivided into 159 city districts based on the General Urban Plan of the City of Skopje (2022–2032) [26]. This spatial resolution was selected to balance representation of neighborhood-scale variability with computational efficiency. District boundaries were imported into the ADMS Mapper environment as polygon geometries, with each polygon defined as an individual area source identified by a unique district name and corresponding X and Y coordinates. The import interface automatically recognized polygon-based inputs and generated the associated area sources within the model. All imported geometries were subsequently reviewed in the Mapper panel to verify the correctness of polygon shape, location, and calculated area.
Following spatial validation, emission characteristics were assigned to each area source. Relevant pollutant species, including particulate matter fractions, were defined, and emission rates were specified as surface-based fluxes (g·m−2·s−1) derived using Tier 2 methodology from the EMEP/EEA Air Pollutant Emission Inventory Guidebook (2023), under the category Small combustion [30]. This approach ensures direct compatibility between emission inventory calculations and the spatial representation required by the Gaussian area-source formulation. Details of the emission calculations are provided in Section 3. Temporal variation was incorporated by applying diurnal and seasonal profiles based on the Copernicus Atmosphere Monitoring Service temporal profiles (CAMS-TEMPO), ensuring a realistic representation of activity patterns [31].
Industrial installations were implemented as point sources using the ADMS-Urban point-source structure. For each installation, source attributes including coordinates, stack height, stack diameter, exhaust gas velocity, and exhaust gas temperature were defined. Installations comprising multiple stacks were represented by separate point sources while maintaining a consistent reference to the parent facility. Once formatted according to ADMS input specifications, the point-source dataset was imported using the dedicated interface.
All point sources were visually inspected in the ADMS Mapper environment, where their spatial distribution was overlaid on background maps to confirm correct positioning within the modelling domain. For each stack, the relevant pollutant species were assigned, typically ranging from one to four pollutants depending on the industrial activity and data availability. Emission rates were specified based on permitted emission limit values and available measurement data reported in the environmental permits.
Traffic-related emissions were represented using the ADMS-Urban road-source structure. Road links were defined by their spatial geometry and associated traffic activity data, including traffic flow, vehicle composition, and average speeds, while emissions were calculated using emission factors consistent with the applied inventory methodology. Relevant pollutant species were assigned to each road source.
This Table 1 summarizes the key input parameters used to represent industrial point sources, transport-related road sources, and household area sources in the ADMS-Urban modelling framework [24]. Parameters are grouped by geometry, physical properties, activity or traffic characteristics, and emission data, highlighting both common and source-specific inputs required for accurate spatial and emission representation.
Meteorological input data for the selected winter day were obtained from the nearest representative meteorological station and included hourly wind speed, wind direction, temperature, and boundary-layer parameters. These inputs were pre-processed according to ADMS-Urban requirements to ensure consistency between observed atmospheric conditions and model parameterization.

2.5. Emission Calculation Methodology for Residential Biomass Combustion

Emissions from household biomass combustion were calculated using a Tier 2 methodology, as defined by the EMEP/EEA air pollutant emission inventory guidebook 2023 [30]. Tier 2 represents an intermediate level of methodological complexity which differentiates emissions by combustion technology, such as fireplaces, conventional stoves, improved stoves, or pellet appliances. In the absence of nationally disaggregated statistics on appliance type distribution, the technology split was adopted from representative distributions provided in the EMEP/EEA Guidebook. The percentage of different appliances used as heating sources in the households in the city of Skopje were as follows: heating stoves with 89%, automatic single house boilers 1%, manual single house boilers 4%, automatic medium boilers 1% and manual medium boilers 4%. This assumed distribution reflects a conservative estimate of prevailing combustion technologies and was applied consistently across all residential districts. This distinction is particularly important for particulate matter, as PM2.5 emission factors may vary by more than an order of magnitude between uncontrolled and modern biomass appliances.
In the Tier 2 approach, pollutant emissions are estimated as a function of fuel-specific energy consumption and technology-dependent emission factors:
E p = i E i · E F p , i
where E p is the annual emission of pollutant p (g·year−1), E i is the annual energy consumption of fuel and technology category i (GJ·year−1), and E F p , i is the corresponding emission factor (g·GJ−1).
In the present study, technology-specific emission factors were selected to represent average urban residential combustion conditions, reflecting a mixture of appliance types rather than extreme or worst-case technologies. This choice aligns with the objective of estimating population-relevant exposure rather than maximum possible emissions.
Annual emissions derived using the Tier 2 methodology were converted to average emission rates expressed in grams per second to ensure compatibility with the dispersion modelling framework. These annual-average emission rates provided the basis for the spatial allocation of emissions and for the application of temporal modulation within the model.
For the representation of residential biomass heating as area sources in ADMS-Urban, the total emission rate was normalized by the corresponding emitting surface area. The emitting area was defined as the area of each city district and was extracted directly from the ADMS-Urban model geometry to maintain full consistency between the emission inventory and the dispersion model. This normalization resulted in average area-based emission fluxes expressed per unit surface area, ensuring that the sum of emissions released from all area sources exactly reproduced the total calculated city-wide emission rate.

3. Problem Description

Skopje, the capital city of the Republic of North Macedonia, had a population of 526,502 residents according to the 2021 national census [32]. Over recent decades, the city has experienced continuous population growth due to internal migration driven by greater employment opportunities, access to healthcare, and other public services. This demographic pressure has resulted in intensive urban expansion, increased housing density, and a significant rise in road traffic, all of which have contributed to growing air quality challenges.
Air pollution has become one of the most critical environmental issues in Skopje, with the city frequently ranked among the most polluted urban areas in Europe during winter [33]. Household heating is predominantly based on the combustion of solid biomass fuels, primarily firewood and pellets, which leads to elevated concentrations of particulate matter. In addition, the vehicle fleet is relatively old, contributing to increased exhaust emissions, while industrial facilities that were historically located outside the urban core are now enclosed within the expanded city boundaries. The geographical setting of Skopje further aggravates air pollution, as the city is situated in a valley, which limits atmospheric dispersion and favors pollutant accumulation, particularly under stable meteorological conditions.
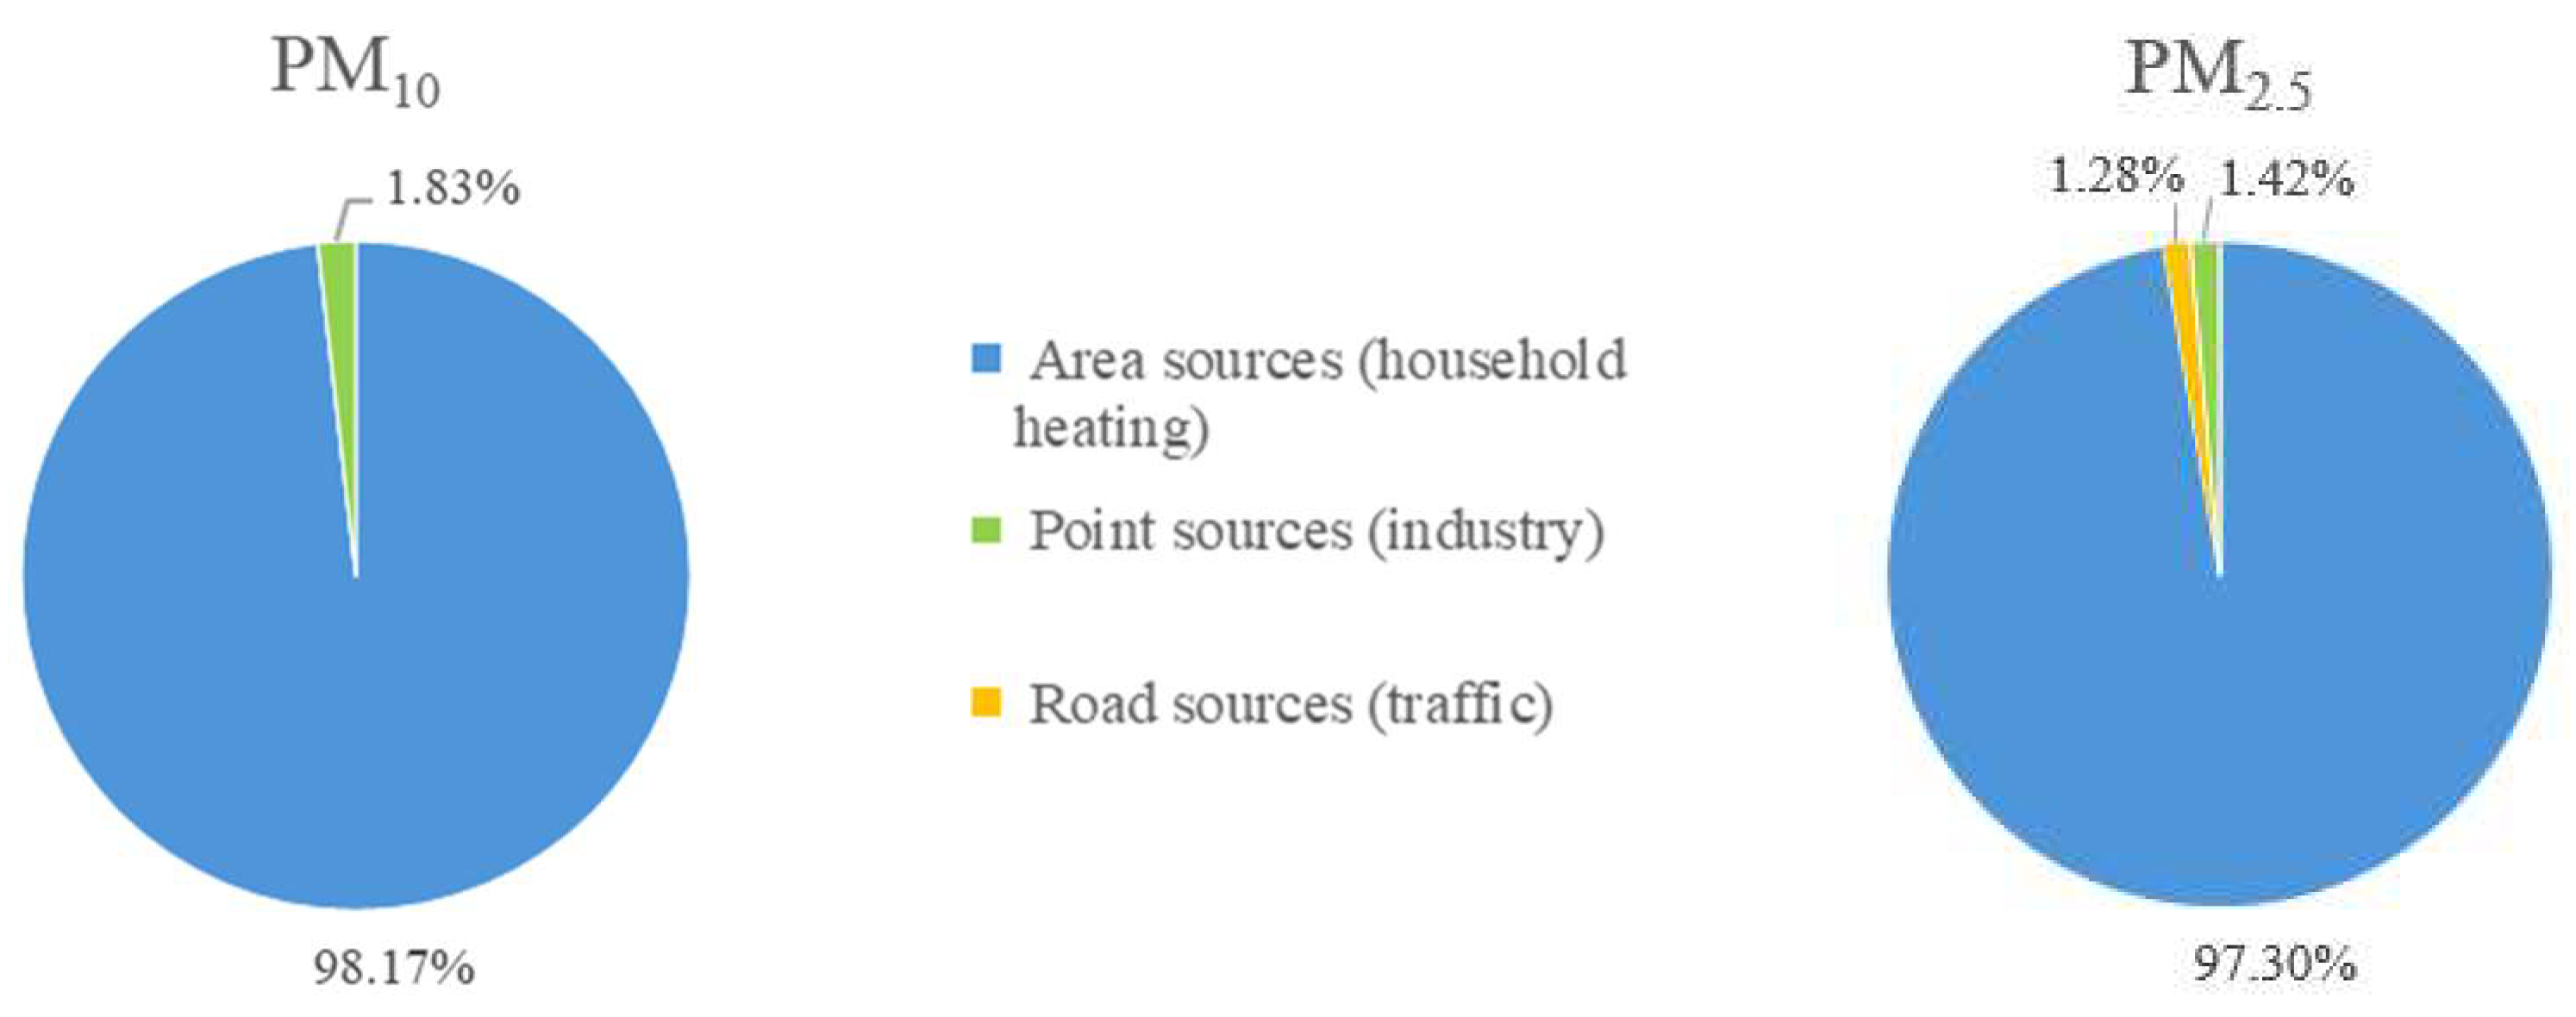
Figure 1 shows the contribution of each pollution source to the total pollution from particulate matters measured by all the six receptors in the city.
The contribution analysis of particulate matter sources indicates a highly unbalanced emission structure, with household heating being the dominant source, accounting for approximately 97–98% of total PM emissions. This overwhelming share reflects the extensive use of solid fuels and inefficient combustion technologies in the residential sector, particularly during the heating season. In contrast, industrial activities contribute only about 1.4–1.8%, suggesting a comparatively limited role of regulated point sources in overall PM levels. Transport-related emissions represent the remaining minor fraction, despite their local importance along major road corridors. These results clearly highlight residential heating as the primary driver of particulate matter pollution and therefore justify the selection of this sector as the focus of the subsequent, more detailed analysis.

3.1. Region Definition and Temporal Scope

Given the dominant role of residential heating in particulate matter emissions, this study focuses primarily on emissions originating from household biomass combustion. The modelling domain was defined according to the General Urban Plan (GUP) of the City of Skopje, covering a total area of approximately 95.9 km2. The domain boundaries and grid resolution were implemented in ADMS-Urban to ensure adequate spatial coverage and representation of emission sources across the city.
The analysis was conducted for a single representative day in 2023, namely 15 February, selected to characterize winter conditions associated with the highest air pollution levels in Skopje. The winter period is known to be critical due to intensified household heating activities and generally unfavorable dispersion conditions. The selected day falls within the upper decile of winter PM concentrations recorded in 2023 and reflects meteorological characteristics representative of inversion episodes. Meteorological data corresponding exclusively to this day were used as model inputs and were obtained from the National Hydrometeorological Service, including wind speed and direction, cloud cover, surface temperature, and relative humidity. This approach ensured temporal consistency between emission inputs and atmospheric conditions during a worst-case pollution scenario.

3.2. Input Parameters

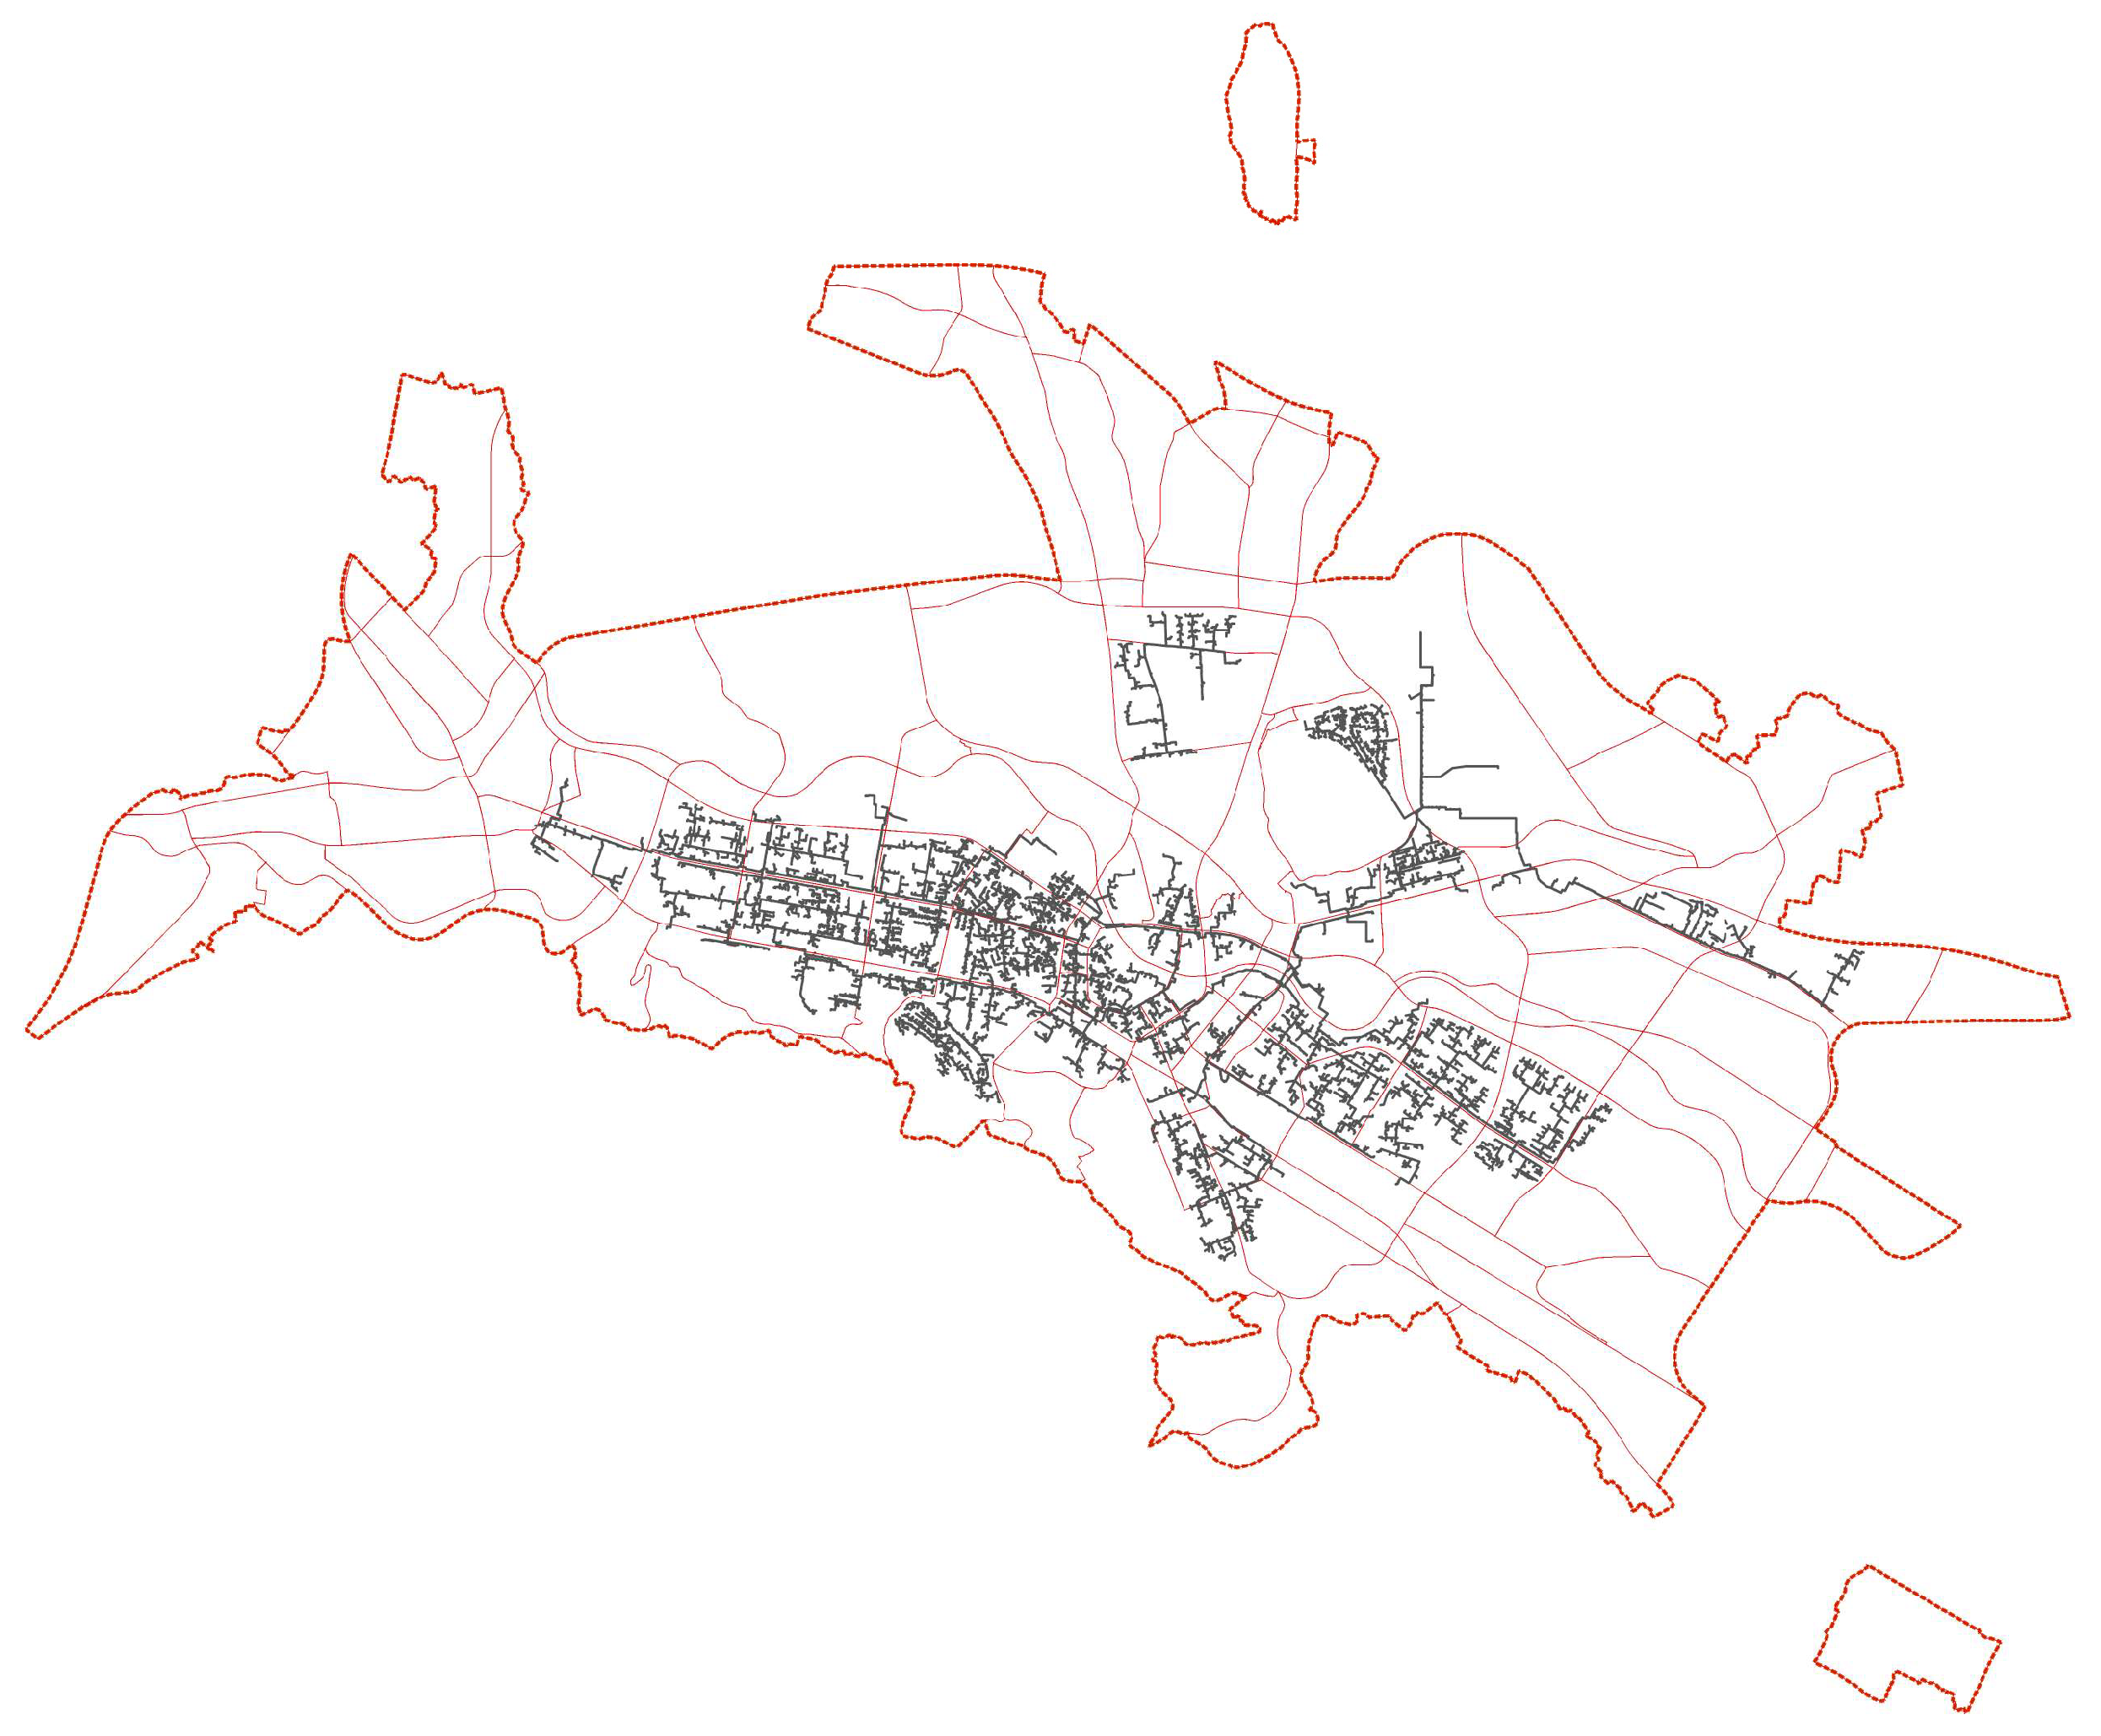
Residential heating emissions were represented as area sources corresponding to 159 city districts distributed across eight municipalities: Gjorce Petrov, Karpos, Centar, Cair, Aerodrom, Kisela Voda, Butel, and Gazi Baba. For each district, the share of dominant energy carriers, electricity, central heating, and biomass fuels, was defined. The district heating network currently covers approximately 30% of the city area, mainly within the municipalities of Karpos, Kisela Voda, Aerodrom, Centar, Cair, and parts of Gazi Baba and Gjorce Petrov. The spatial extent of the district heating system is illustrated in Figure 2 with gray lines.
Emissions related to household heating using electricity consumption were not included in the local emission inventory, as electricity is produced at centralized power plants located outside the Skopje urban area and does not have local impact on the air quality. In contrast, emissions from district heating systems were included because they originate from local boiler plants within or near the city and directly affect urban air quality. These emissions were modelled exclusively as point sources representing the heating plants, considering that no combustion occurs at the household and including these emissions would result in double counting. Consequently, only emissions from the combustion of wood and pellets in residential heating systems were considered for area-source modelling. Average exhaust release heights for residential sources were adopted from the General Urban Plan and applied uniformly within each district.
To enable a focused and robust assessment, the municipalities of Aerodrom and Gjorce Petrov were selected for detailed analysis based on the availability, completeness, and internal consistency of the underlying energy and emission datasets. Aerodrom was chosen due to the inclusion of the Lisice settlement, one of the most polluted areas in the city, while Gjorce Petrov was selected as a contrasting case characterized by limited coverage of the district heating network. Together, these municipalities provided the most reliable and spatially resolved information on household heating practices and energy carrier distribution, allowing for consistent emission estimation and model implementation. Aerodrom comprises 18 city districts with a total area of approximately 10.3 km2, whereas Gjorce Petrov includes 27 districts covering about 12.1 km2. The analysis of other municipalities was therefore considered beyond the scope of the present study.
The analysis focused on particulate matter emissions, specifically PM10 and PM2.5, as these pollutants are the main contributors to air pollution in Skopje and are characteristic emissions from biomass combustion.
Industrial and traffic emissions were included to provide a comprehensive representation of background pollution levels. Industrial sources were derived from national registers of installations with A- and B-integrated environmental permits, resulting in 50 installations located within the city boundaries and a total of 125 individual emission stacks. Based on the national registers of A- and B-integrated environmental permits and municipal records, industrial facilities within the City of Skopje can be grouped into several main activity types. These include food and beverage processing, metal processing and fabrication, construction and building materials production (e.g., concrete and aggregates), machinery and engineering workshops, and service facilities with stationary combustion units such as boilers. Traffic emissions were represented using 93 major road links across the city, covering main boulevards and arterial roads.
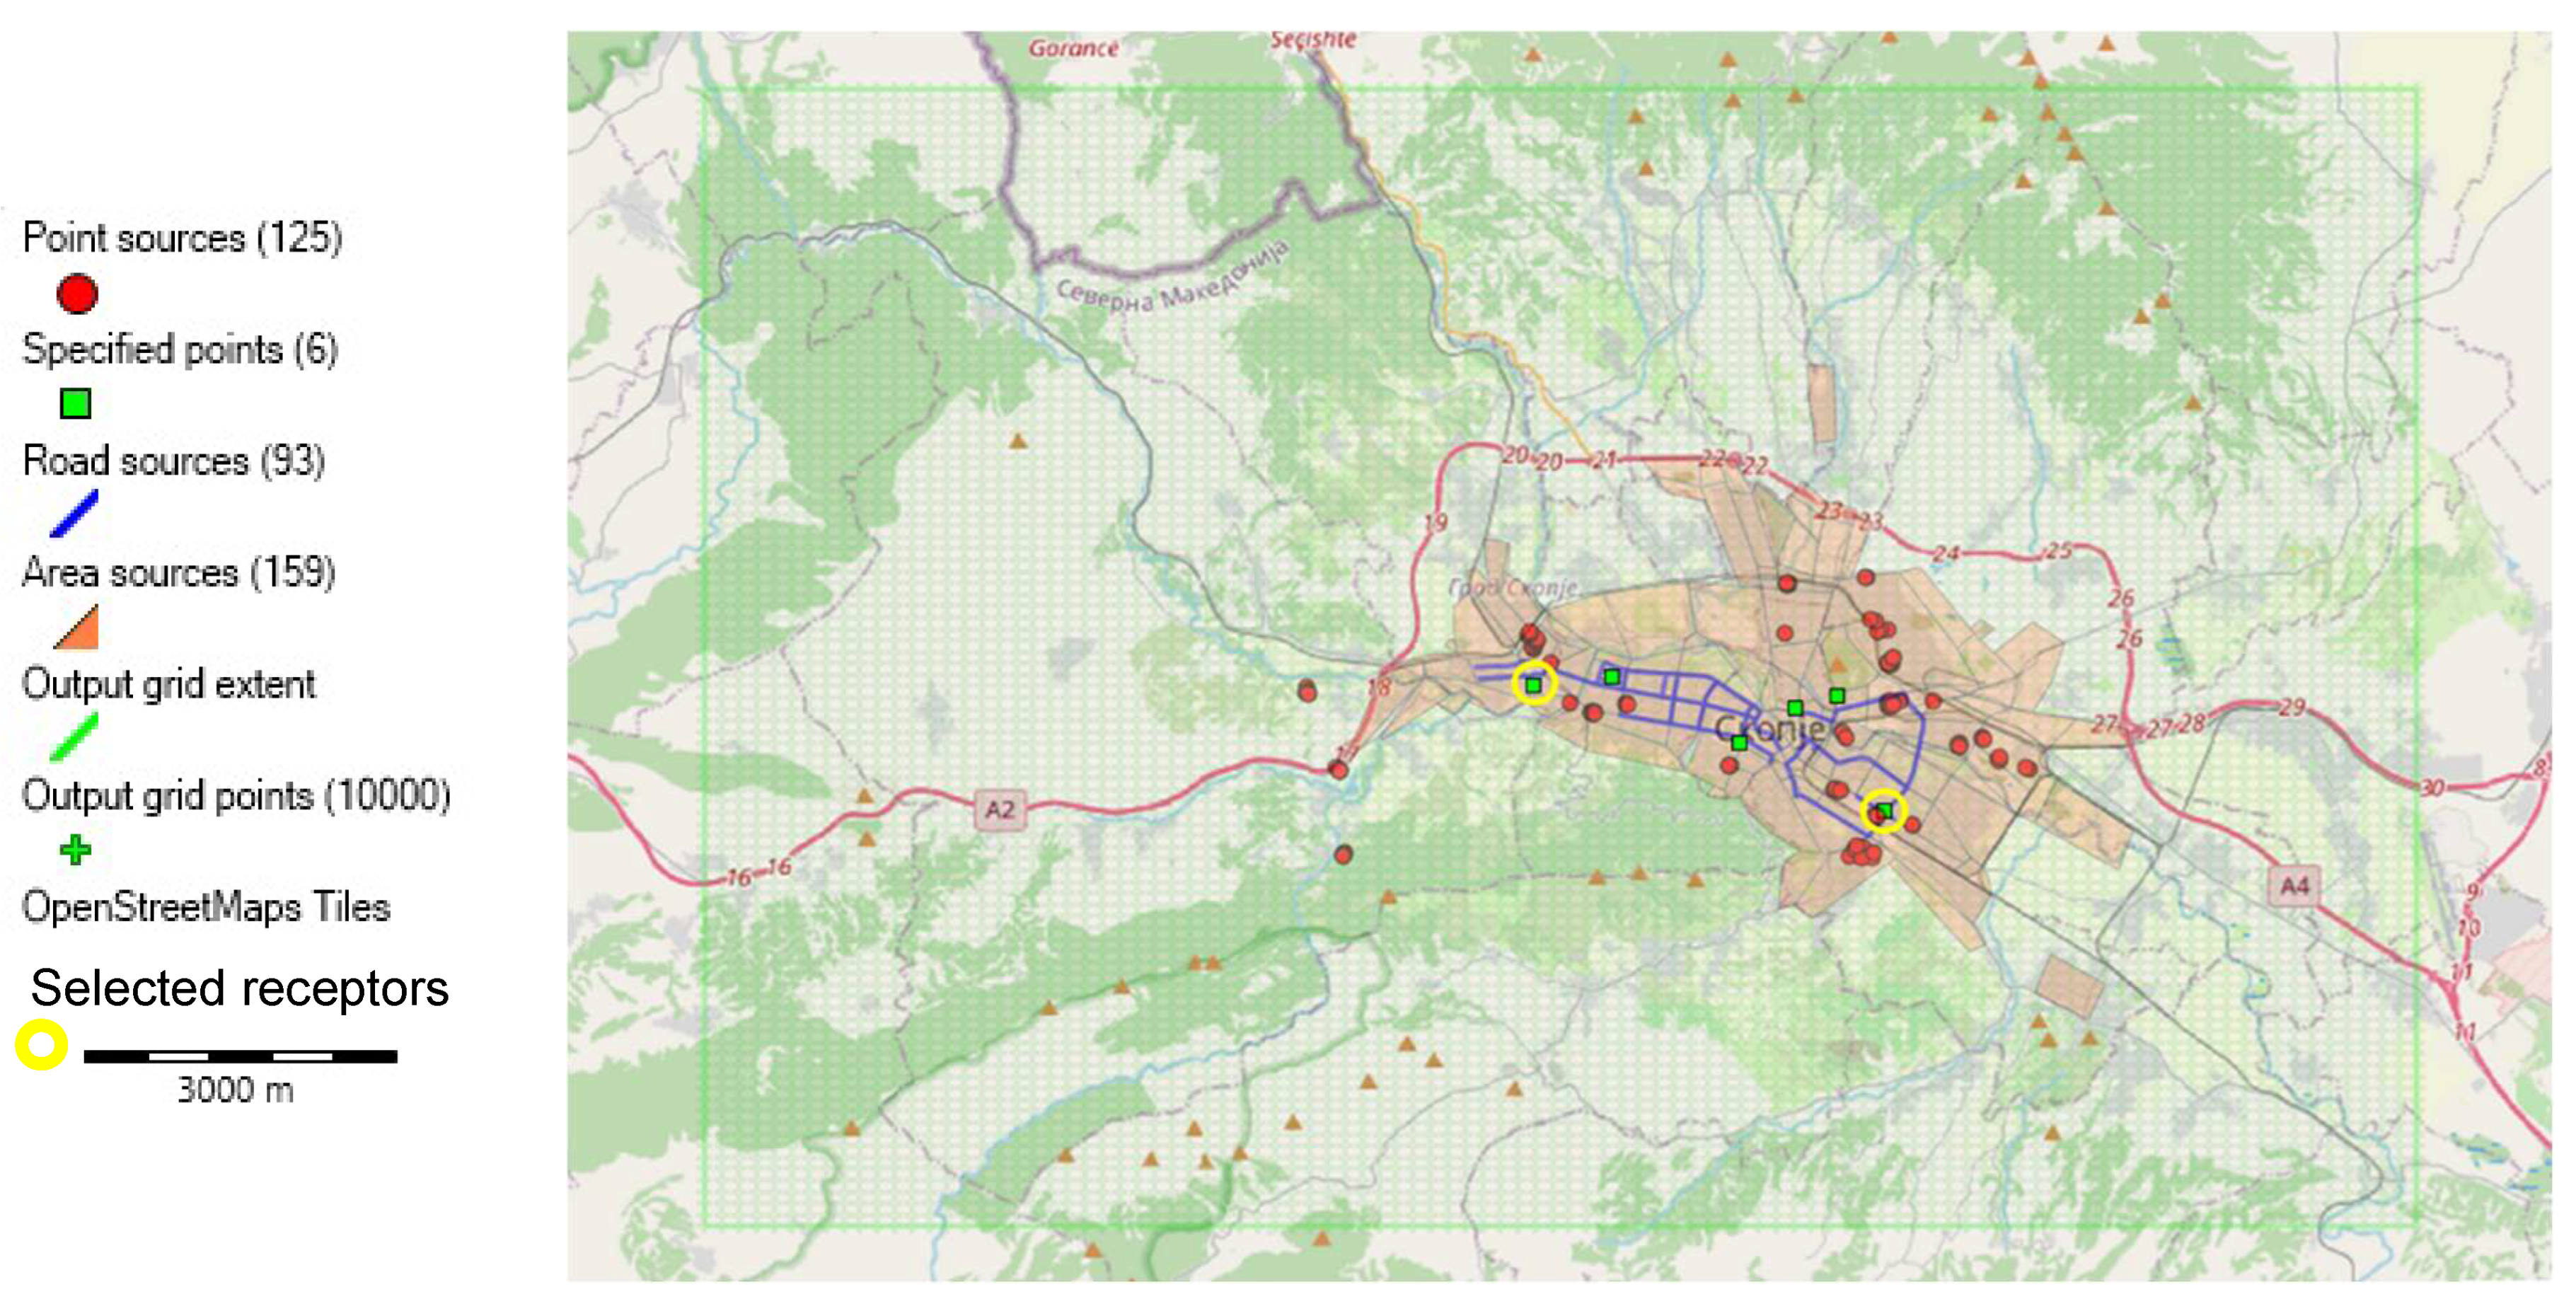
For model evaluation purposes, six air quality receptors were included at locations corresponding to existing monitoring sites: Gjorce Petrov, Karpos, Centar, Rektorat, Lisice, and Gazi Baba. Validation was performed using data from the receptors located in Gjorce Petrov and Lisice, corresponding to the two municipalities selected for detailed analysis. The spatial distribution of all emission sources and receptors is shown in Figure 3.

4. Results and Discussion

4.1. Meteorological Conditions

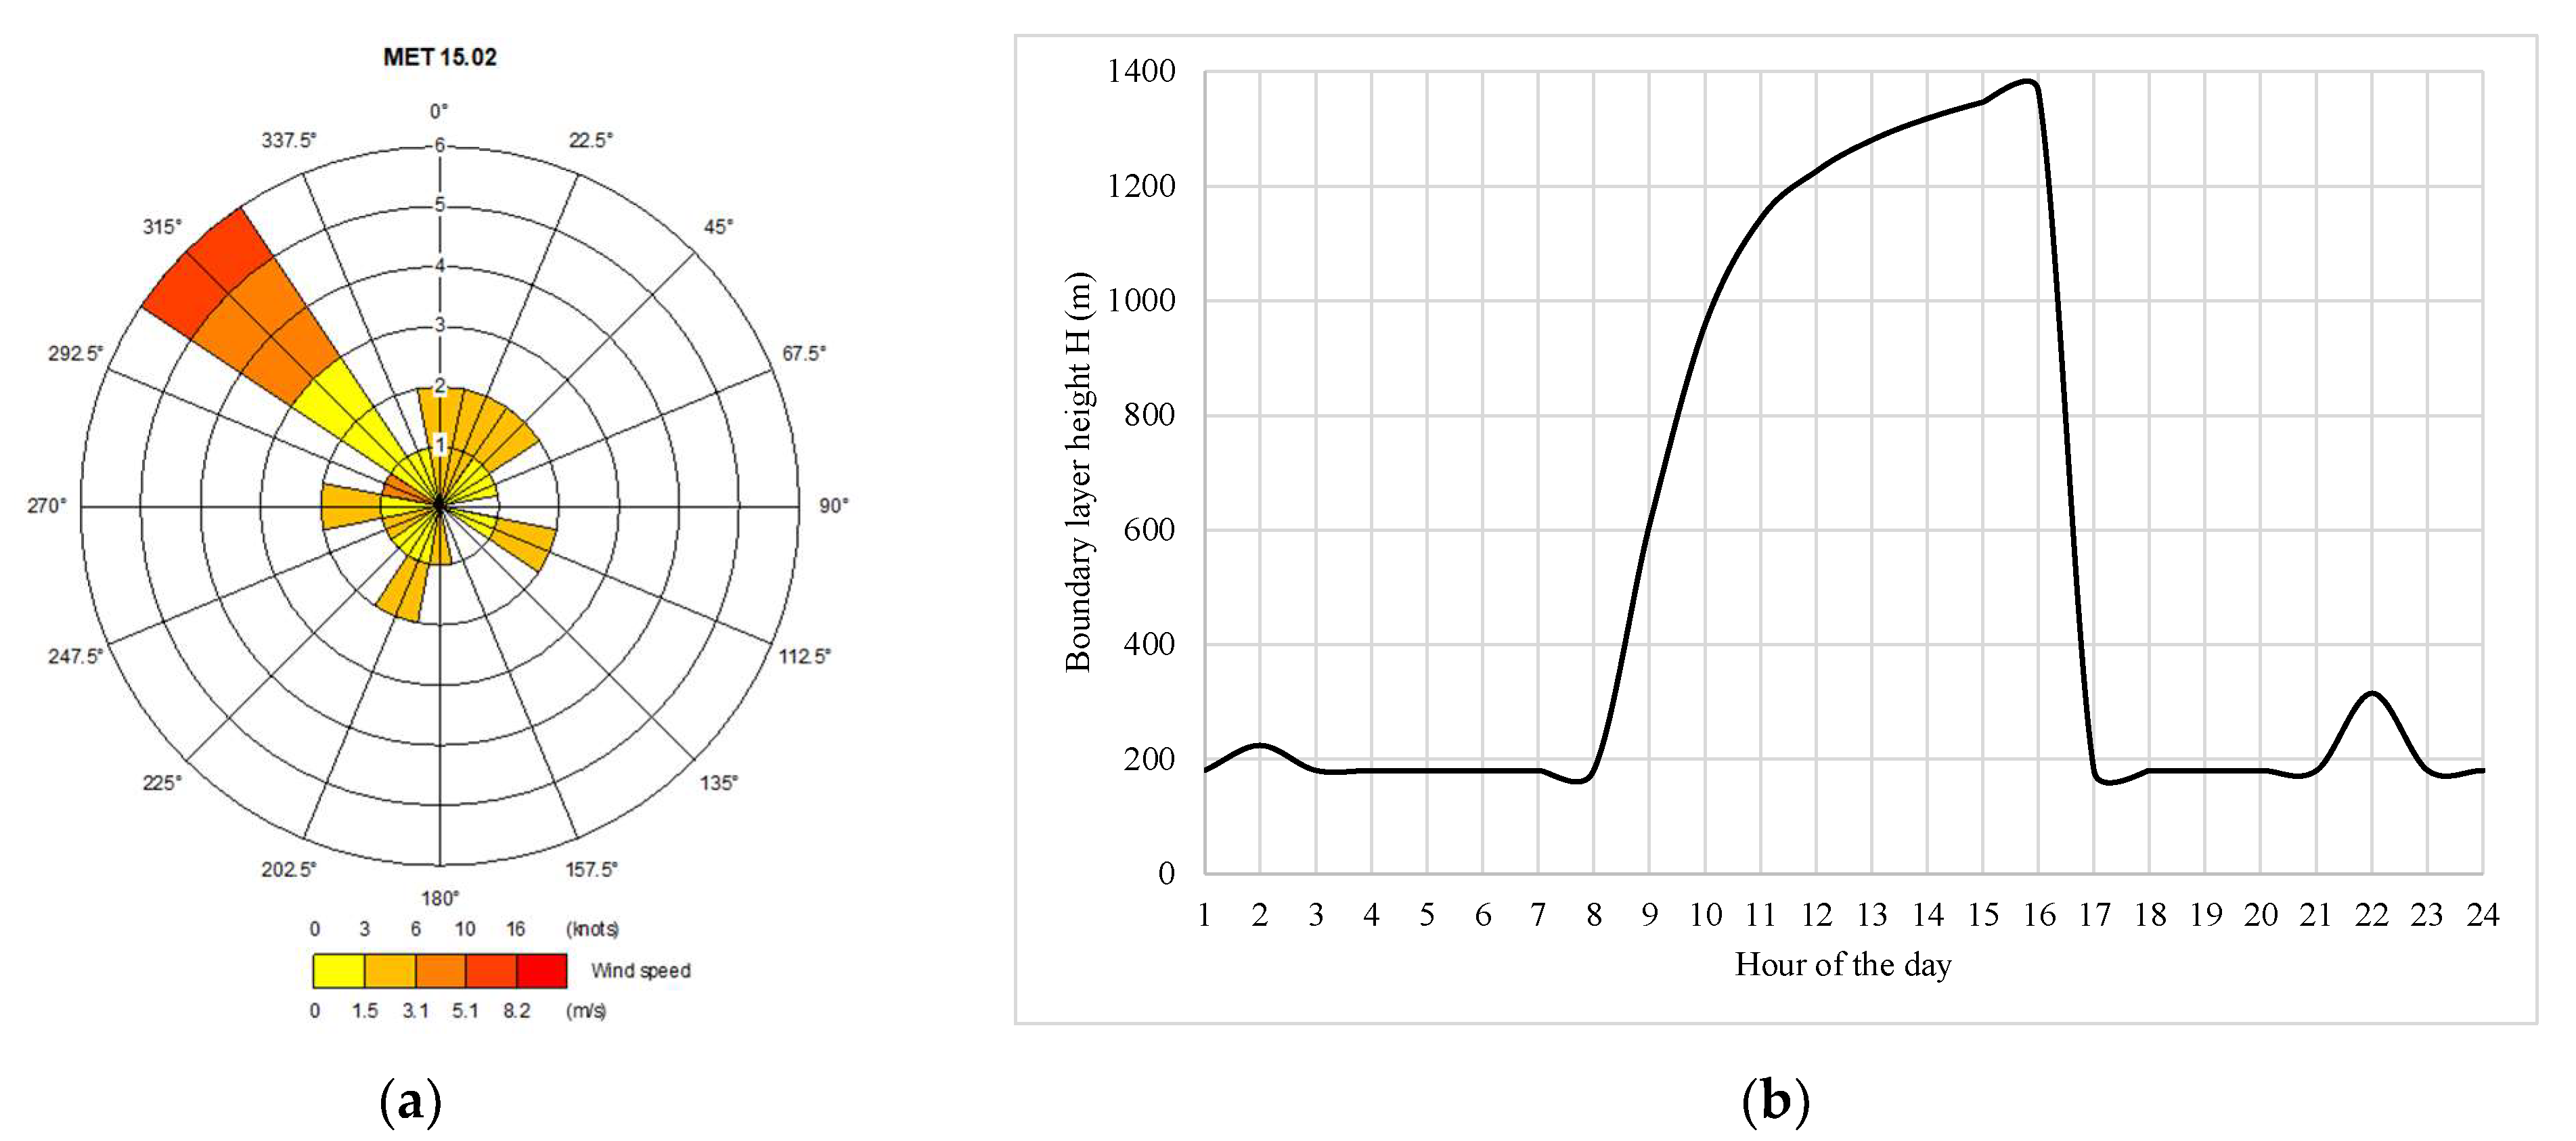
Figure 4a presents the daily wind rose for the analysed winter day, summarising wind direction and speed conditions that govern pollutant transport across the study area. The daily wind rose indicates that wind conditions over the analysed day were dominated by north-westerly to northerly flows, with the highest frequencies occurring between approximately 300° and 360°. Wind speeds are mostly low to moderate (0–5.1 m/s), with a noticeable contribution of higher wind speeds (5.1–8.2 m/s) from the north-west sector, while other directions occur less frequently and are associated mainly with lower wind speeds (below 3.1 m/s). This pattern suggests that, over the course of the day, pollutant transport was most often directed towards the south-eastern and southern parts of the city, although short-term deviations occurred at specific hours.
The obtained boundary layer height profile for the winter day analysed is shown in Figure 4b. During the nighttime and early morning hours (01:00–08:00), the boundary layer height remains very low, around 180–220 m. These conditions correspond to the poorest air quality conditions of the day since reduced turbulence and limited boundary-layer height suppress vertical mixing, leading to increased near-surface concentrations from residential heating area sources. As surface heating intensifies in the morning hours (08:00–10:00), a rapid increase in boundary layer height up to 950 m is observed, indicating the onset of convective conditions, allowing pollutants to disperse vertically. In the midday and early afternoon (10:00–16:00), the boundary layer height reaches 1200–1400 m corresponding to a well-mixed convective boundary layer. Atmospheric conditions are unstable and lowest concentrations near the ground are expected during this period. In the late afternoon and evening hours (16–18), the boundary layer height abruptly collapses back to around 200 m, suggesting the re-establishment of stable atmospheric conditions and a secondary temperature inversion. Dispersion is limited and pollutants start accumulating again unless wind disperses them. In the night hours (18–24), the boundary layer height remains low with small fluctuations implying stable stratification and persistent pollutant retention overnight.

4.2. Model Evaluation and Validation

Model evaluation was performed by comparing ADMS-Urban model-predicted data with 24 h mean concentrations measured data of PM2.5 and PM10 in two municipalities in the city of Skopje for the year 2023. The receptors from the State Automatic Ambient Air Quality Monitoring System measure hourly concentrations of several pollutants, including the pollutants of interest, such as particulate matters (PM2.5 and PM10). The measured data were obtained from the publicly available database of the Ministry of Environment and Physical Planning (MOEPP) for the receptors located in Gjorce Petrov and Lisice. These two locations were selected due to their geographic representativeness within the urban area of Skopje, as they are situated in different zones and directions of the city, allowing the spatial variability of emissions and dispersion conditions to be captured. Gjorce Petrov, located in the north-western part of the city, and Lisice, located in the south-eastern part, are influenced by different urban structures, land-use characteristics, and dominant emission sources, such as traffic, residential heating, and background urban pollution. In addition, their distinct positions within the city basin expose them to varying meteorological conditions, including prevailing wind directions, wind speeds, and atmospheric stability, which directly affect pollutant transport and dispersion. The use of these two receptors therefore enables a more comprehensive assessment of the relationship between emissions, meteorological parameters, and observed concentrations, while also providing a robust basis for model evaluation and validation across different urban environments.
Model performance was evaluated using fraction of predictions within a factor of two of observations (FAC2) using the following equation:
F A C 2 = 0.5 y i x i 2.0
where x i is the modelled concentration in ADMS-Urban and y i is the measured concentration from the receptor [17]. The performance of the statistical model evaluation metric FAC2, used for comparing modelled and measured concentrations of PM2.5 and PM10, is presented in Table 2.
The results indicate that the model performance satisfies the FAC2 acceptance criterion during the winter and spring seasons for both particulate matter fractions and at both monitoring locations. This means that in those seasons there is more reliable model performance. For the autumn season, acceptable performance is obtained only for PM2.5 at Lisice, whereas all other FAC2 values fall outside the accepted validation range. During the summer season, acceptable agreement is achieved only for the Lisice site, while a pronounced disagreement between modelled and measured data is observed at Gjorce Petrov. These values observed for PM10 and PM2.5 at the Gjorce Petrov site are primarily attributable to the strongly reduced contribution of residential heating during warm months, which substantially lowers the modelled primary PM signal from the dominant winter source. Under these conditions, observed concentrations are increasingly influenced by processes and contributions not explicitly represented in the current modelling configuration, including resuspended dust, secondary aerosol formation, and regional background/long-range transport. In addition, the Gjorce Petrov site is less affected by major local point sources and dense traffic corridors than the Lisice area, so the remaining locally modelled emissions can be relatively small, increasing the sensitivity of ratio-based metrics such as FAC2. When absolute concentrations are low, even moderate absolute deviations can therefore translate into very large FAC2 values. Based on these results, the winter season was selected for further analysis, as it demonstrates the most consistent model performance across both particulate matter fractions and monitoring locations. In addition to the statistical validation, the selection of the winter period is justified by increased emissions from residential heating and unfavourable meteorological conditions. Lower wind speeds, enhanced atmospheric stability, frequent temperature inversions, and reduced mixing heights limit pollutant dispersion lead to higher and more stable PM2.5 and PM10 concentrations. Consequently, the winter season provides a conservative and representative scenario for model evaluation under conditions of elevated pollution and reduced dispersion.
A representative winter day was therefore identified, and a detailed comparison between modelled and measured concentrations was conducted for 15 February 2023, covering a continuous 24 h period. For both monitoring locations, the 24 h mean relative error (RE), mean bias (MB), normalized mean bias (NMB) and root mean square error (RMSE) were calculated separately for PM2.5 and PM10 according to
R E = x i y i y i
M B = i = 1 n x i y i n
N M B = i = 1 n x i y i i = 1 n y i
R M S E = i = 1 n x i y i 2 n
where n is the number of paired data points. The specific values obtained are provided in Table 3.
The selected day falls within the upper decile of winter PM concentrations recorded in 2023 and is characterized by low nocturnal boundary-layer heights (~150–200 m) and rapid daytime growth, consistent with typical winter inversion dynamics in the Skopje basin, as it can be seen from Figure 4b. While detailed statistical evaluation was performed for this episode, seasonal performance indicators from Table 2 demonstrate consistent model behaviour across winter conditions. The findings should therefore be interpreted within the context of representative high-pollution scenarios rather than as a comprehensive long-term assessment.
At the Lisice monitoring station, the relative error for PM10 was −0.136, indicating a moderate deviation and a tendency of the model to slightly underestimate the measured concentrations. This is further reflected by the MB = −25.96 µg/m3 and NMB = −0.27, confirming a systematic underestimation of PM10 concentrations. This corresponds to a systematic deviation of approximately 27% relative to observed levels. Such a magnitude of bias is considered moderate and remains within ranges commonly reported for urban-scale dispersion modelling under winter conditions in complex environments. The root mean square error (RMSE = 28.56 µg/m3) indicates a moderate overall error magnitude, reflecting the influence of larger hourly deviations during peak concentration periods. Such a magnitude of bias and overall error is considered moderate and remains within ranges commonly reported for urban-scale dispersion modelling under winter conditions in complex environments.
In contrast, the relative error for PM2.5 was 0.02, demonstrating very good agreement between modelled and observed values for the selected winter day. The corresponding MB = −5.51 µg/m3 and NMB = −0.08 indicate stable reproduction of fine particulate concentrations with only a minor underestimation. The RMSE value of 30.19 µg/m3 suggests that, although systematic bias is small, short-term fluctuations and peak concentrations contribute to the overall dispersion of residual errors.
At the Gjorce Petrov station, relative errors of 0.224 for PM10 and −0.172 for PM2.5 were obtained, indicating moderate discrepancies between modelled and measured concentrations. The bias indicators show a small systematic deviation for PM10 (MB = 5.46 µg/m3; NMB = 0.12), corresponding to approximately 12% relative difference, which reflects good proportional agreement between modelled and observed concentrations. The RMSE for PM10 (12.21 µg/m3) indicates a comparatively lower overall error magnitude than at the Lisice site, suggesting a more stable hourly agreement for this location. For PM2.5, the MB (−7.45 µg/m3) and NMB (−0.25) indicate a moderate but still acceptable systematic deviation [34,35], while the RMSE value (12.09 µg/m3) confirms moderate overall variability between modelled and observed concentrations. In dispersion modelling applications, |NMB| values below 0.30 are generally considered indicative of satisfactory performance, particularly for short-term simulations during winter inversion conditions. In this case, the model exhibited a tendency to overestimate PM10 concentrations, while slightly underestimating PM2.5 levels.
Overall, the magnitude of the relative errors and RMSE at both monitoring locations remains within ranges typically considered acceptable for urban-scale air quality dispersion modelling, particularly for short-term (24 h) evaluations under winter conditions [36,37]. The observed differences between PM10 and PM2.5 performance are physically plausible, as PM10 concentrations are more strongly influenced by local sources and short-term variability, whereas PM2.5 typically exhibits more regional behavior and may therefore display different bias characteristics.
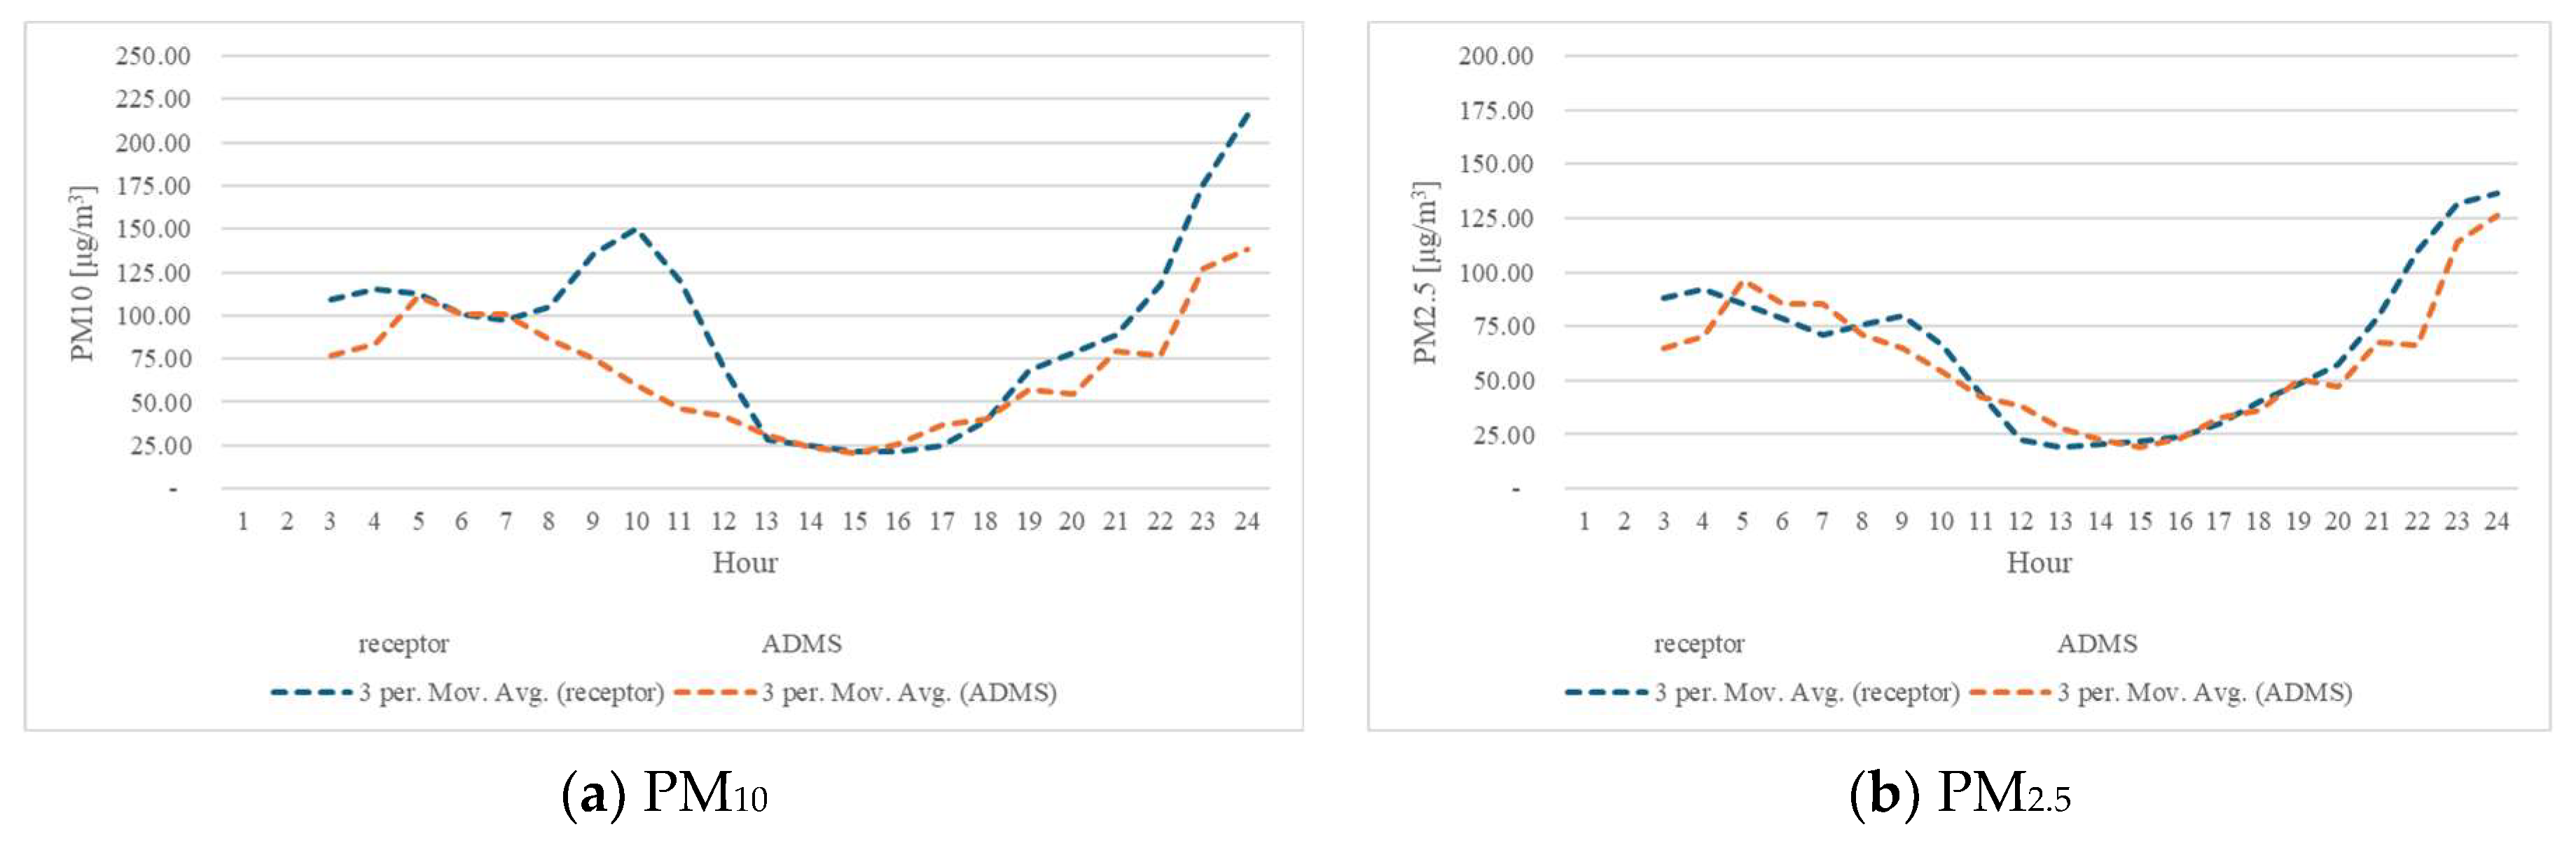
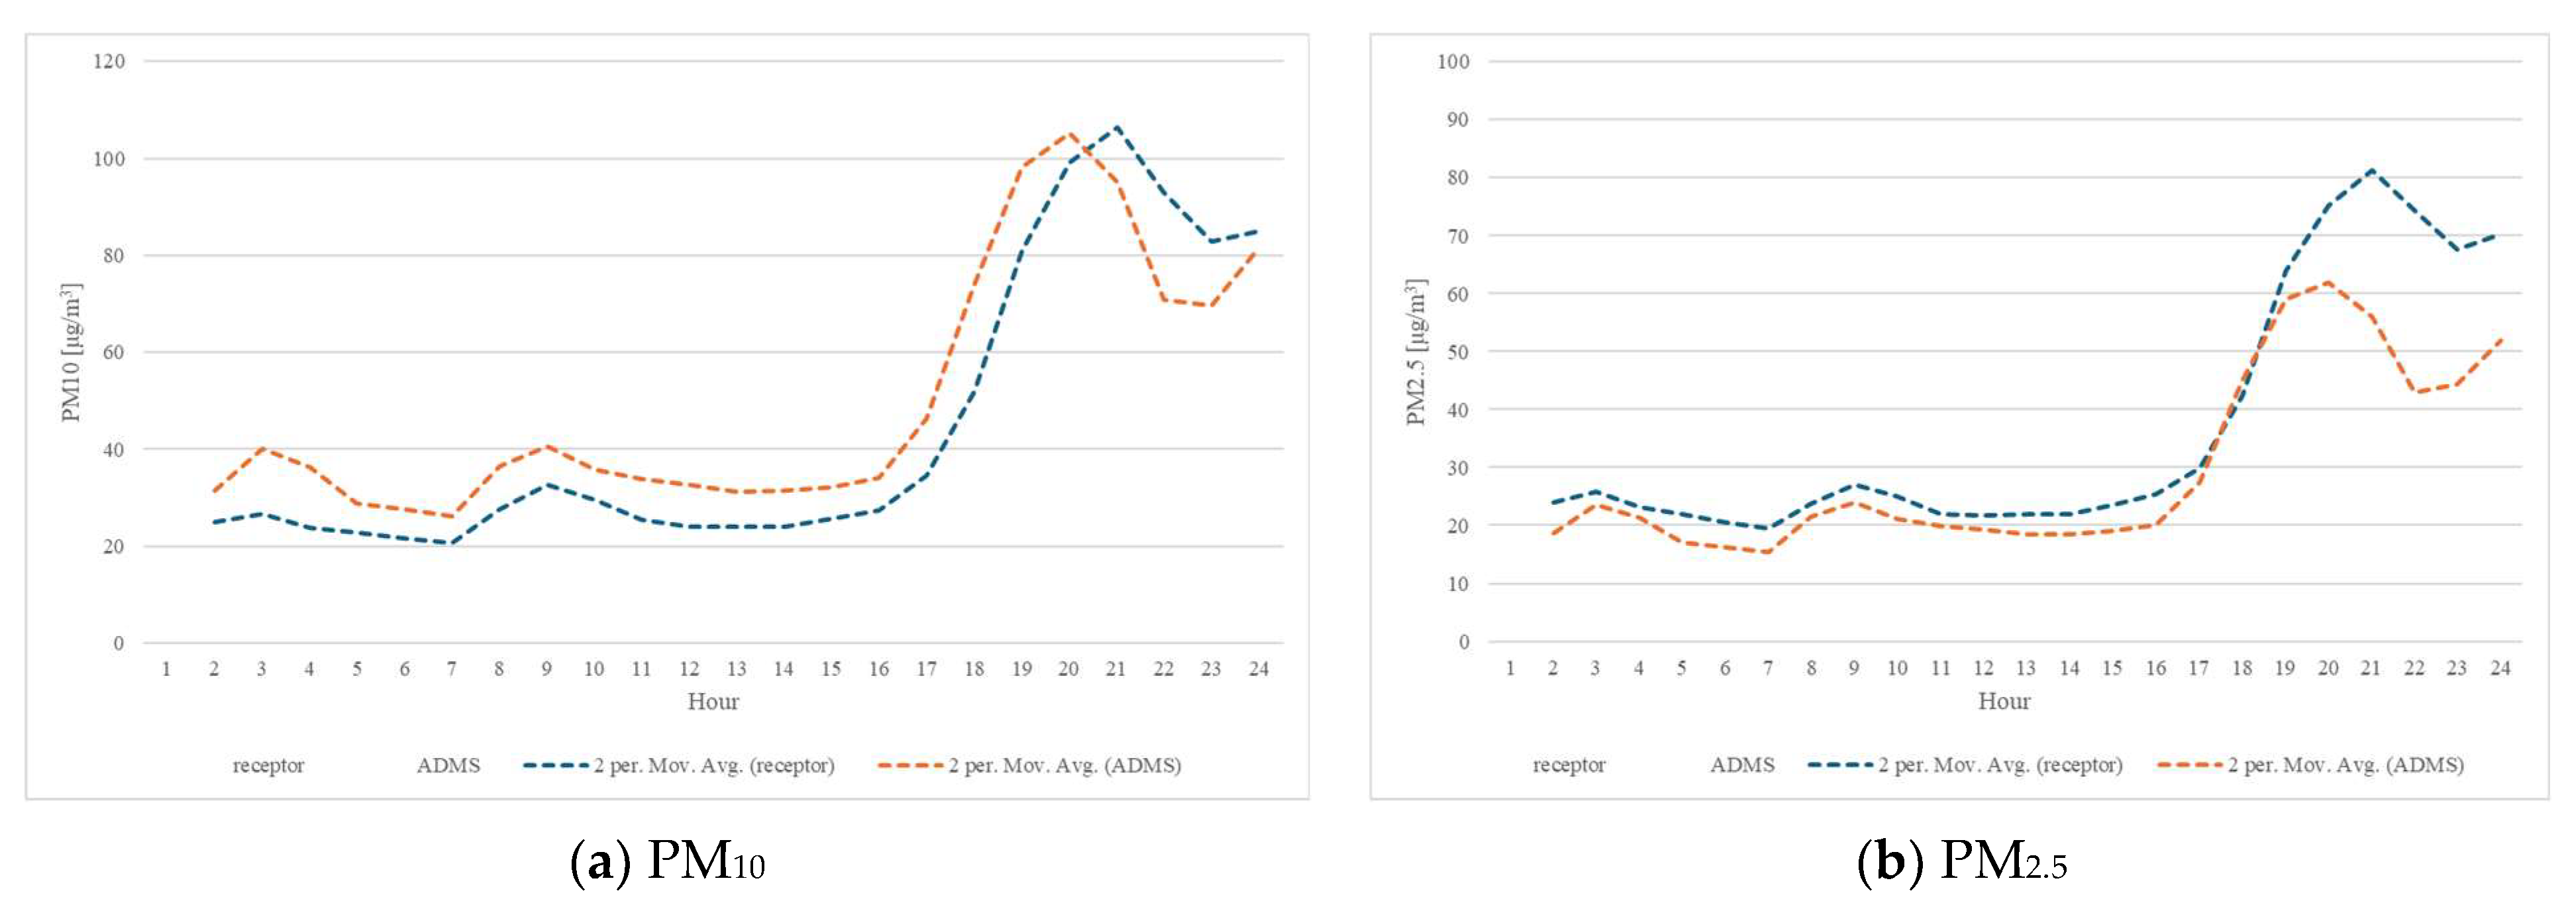
A visual comparison of measured and modelled concentrations of PM2.5 and PM10 at the Lisice monitoring station is presented in Figure 5a,b, while the correlation of these pollutants at Gjorce Petrov is shown in Figure 6a,b.
A comparison of hourly measured and modelled concentrations indicates that the model generally reproduces the temporal behavior of particulate matter with acceptable traceability. According to the boundary layer dynamics shown in Figure 4b, the worst air quality conditions occur during the night and early morning hours (01:00–08:00). This aligns with the graphs, where measured and modelled concentrations are elevated even in the absence of intensive residential heating. As surface heating intensifies in the morning hours (08:00–10:00), the boundary layer height increases rapidly, promoting dispersion. During this period, the modelled PM concentrations continue to decline. During midday and early afternoon (10:00–16:00), when the boundary layer reaches its maximum height and emissions are reduced due to lower residential activity, the modelled and measured concentrations show overlap. In the late afternoon and evening (16:00–18:00), the boundary layer collapses, limiting vertical dispersion and causing an increase in PM concentrations. This behavior is captured by both measured and modelled data, reflecting realistic atmospheric and emission dynamics.
The range of PM10 concentrations varies from approximately 25 µg/m3 to over 200 µg/m3, which significantly exceeds the national and EU daily limit values (50 µg/m3 and 45 µg/m3, respectively). Nighttime values are generally higher than daytime values, with around 100 µg/m3 at night versus 50 µg/m3 during the day. PM2.5 concentrations are lower than PM10 because they are primarily composed of fine combustion-related particles rather than coarse dust and resuspended material. The measured PM2.5 range is approximately <25 µg/m3 to 125 µg/m3, and the temporal pattern closely resembles that of PM10, showing higher concentrations during the night and lower values during midday, consistent with both measured and modelled emissions and boundary layer behavior.
The PM concentrations measured and modelled in Gjorce Petrov are lower compared to Lisice due to the urban layout and location of Gjorce, which allows better air circulation, promotes dispersion even under stable nighttime conditions. The graphs show good agreement between measured and modelled concentrations. Compared to Lisice, nighttime concentrations in Gjorce are lower because of fewer local emissions, reduced traffic, and minimal industrial sources. This pattern continues during the day, when a higher boundary layer promotes better mixing and reduces PM concentrations. In the late afternoon, as the boundary layer decreases and atmospheric conditions worsen, pollutants begin to accumulate and concentrations increase sharply, a process amplified by people returning from work and the activation of intensive household heating.

4.3. Temporal and Spatial Variability of PM Concentrations over Skopje

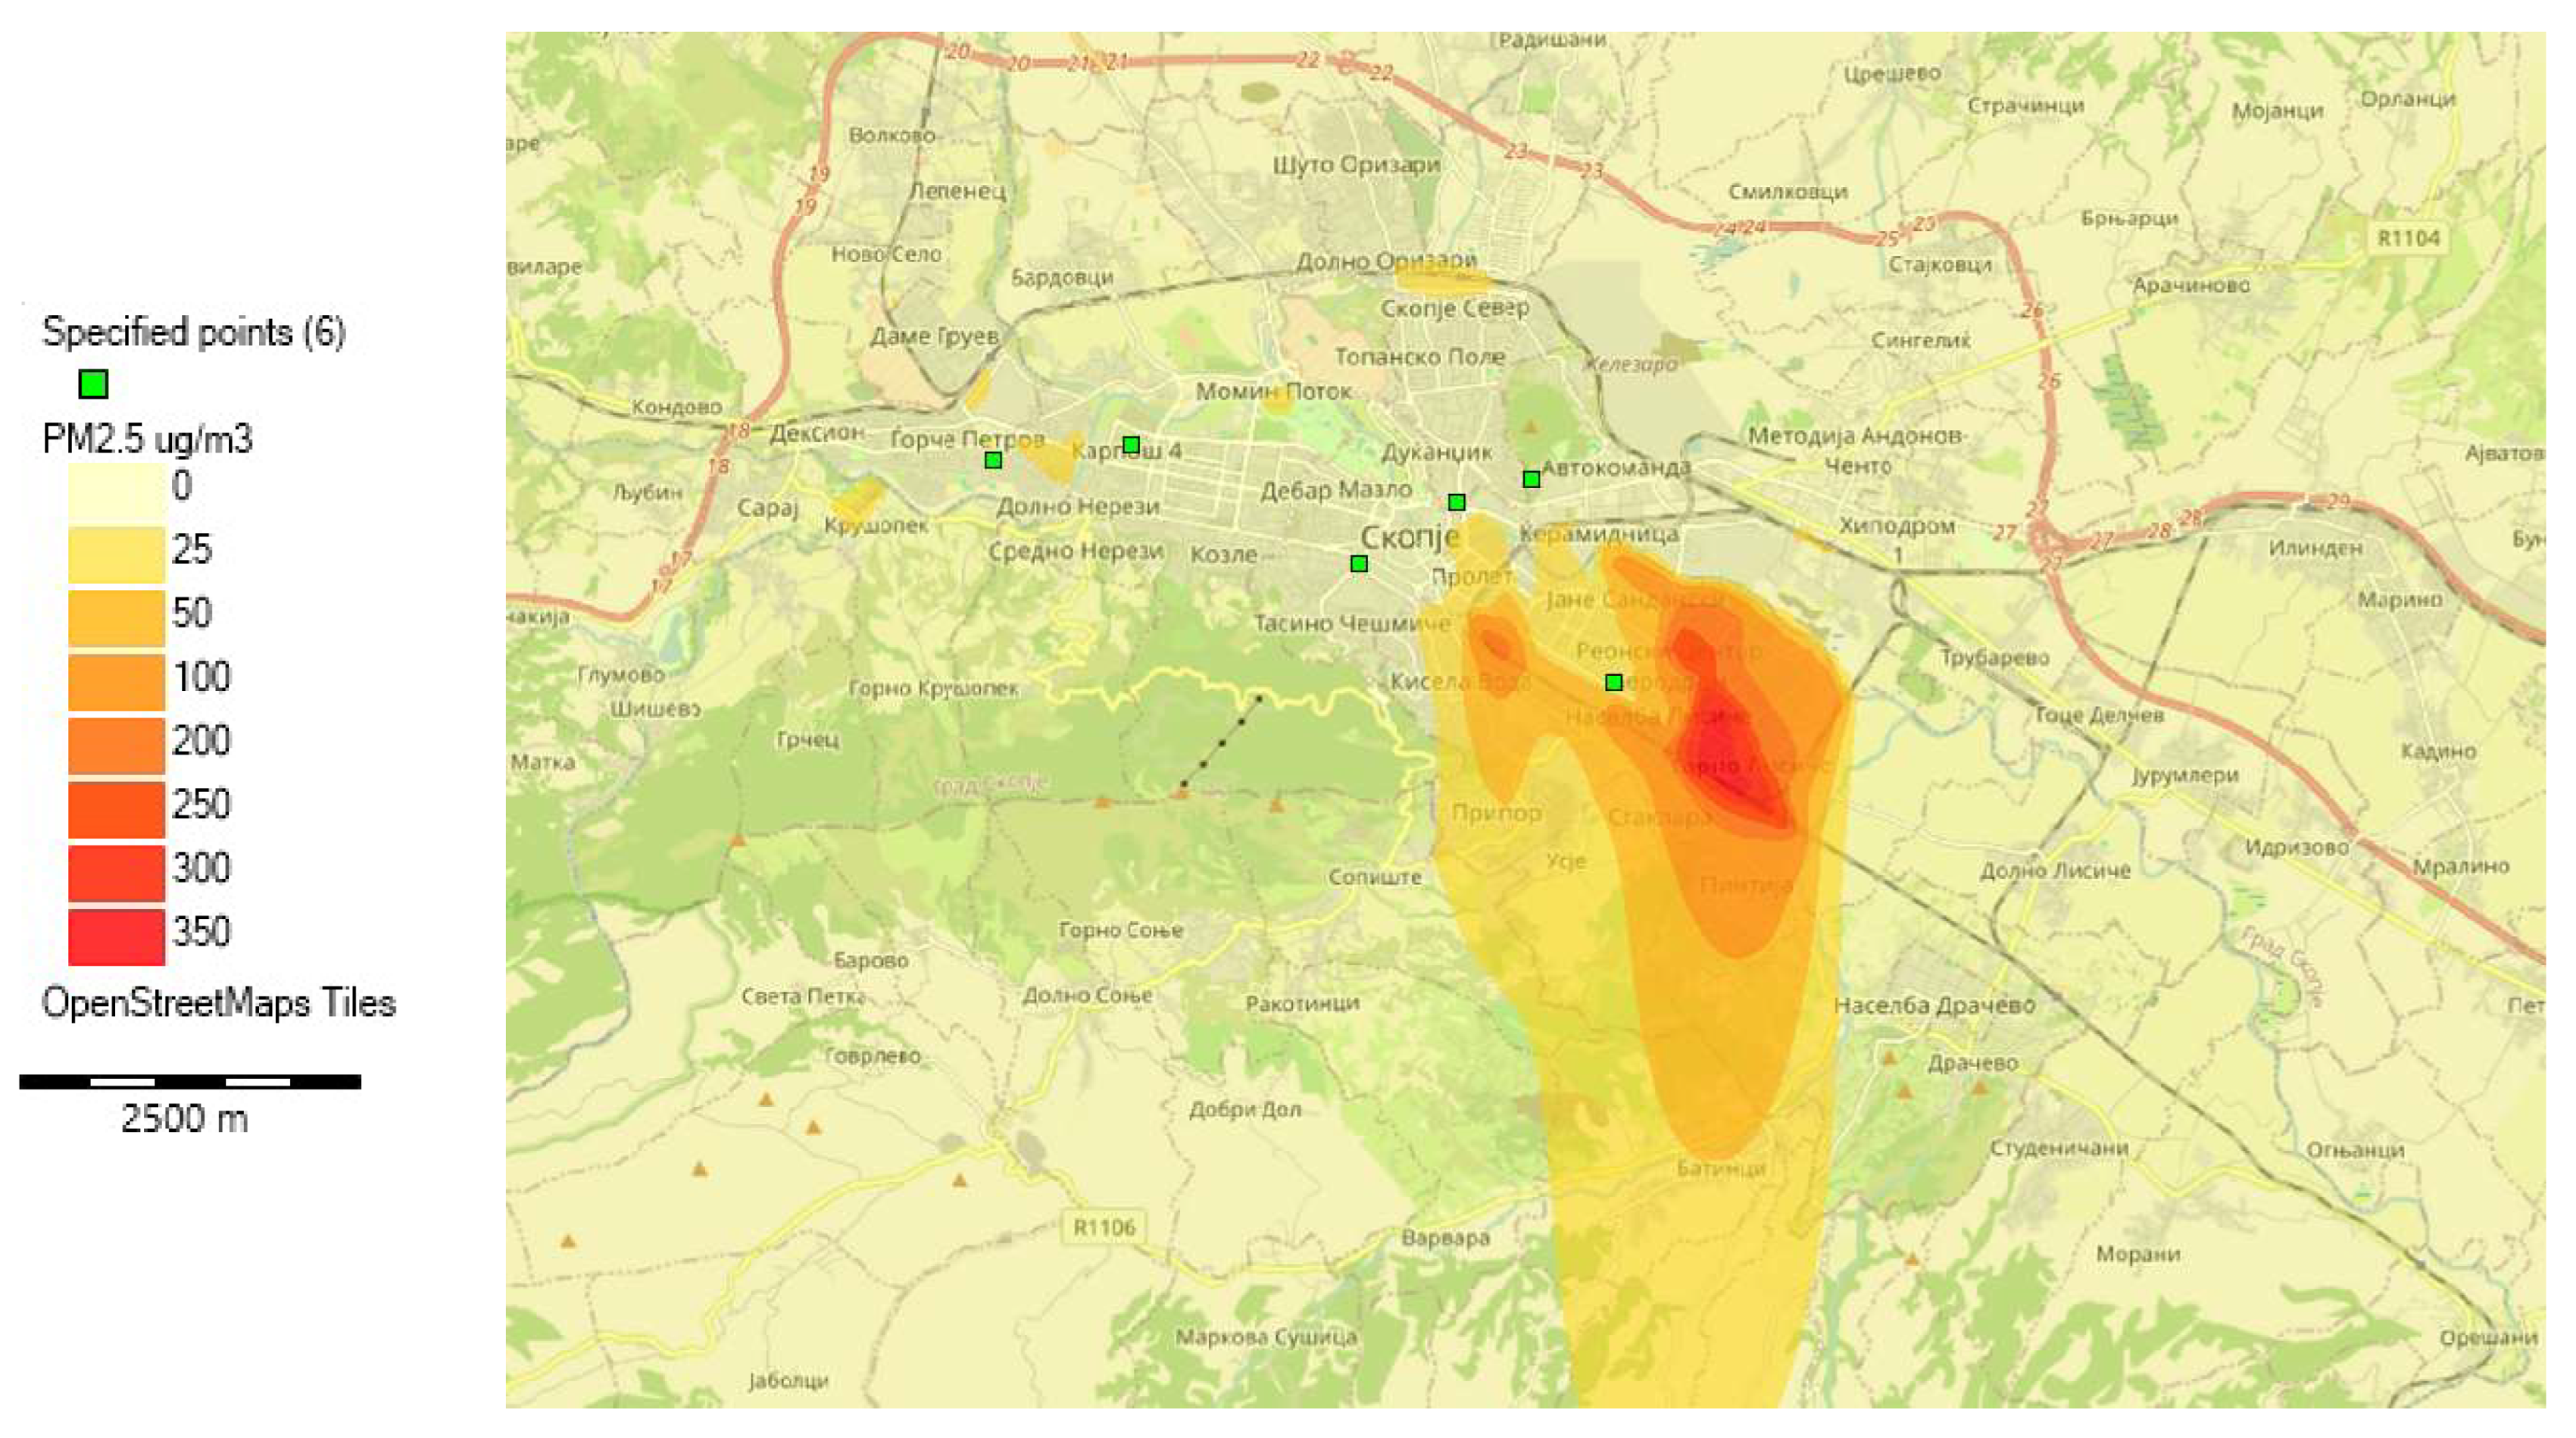
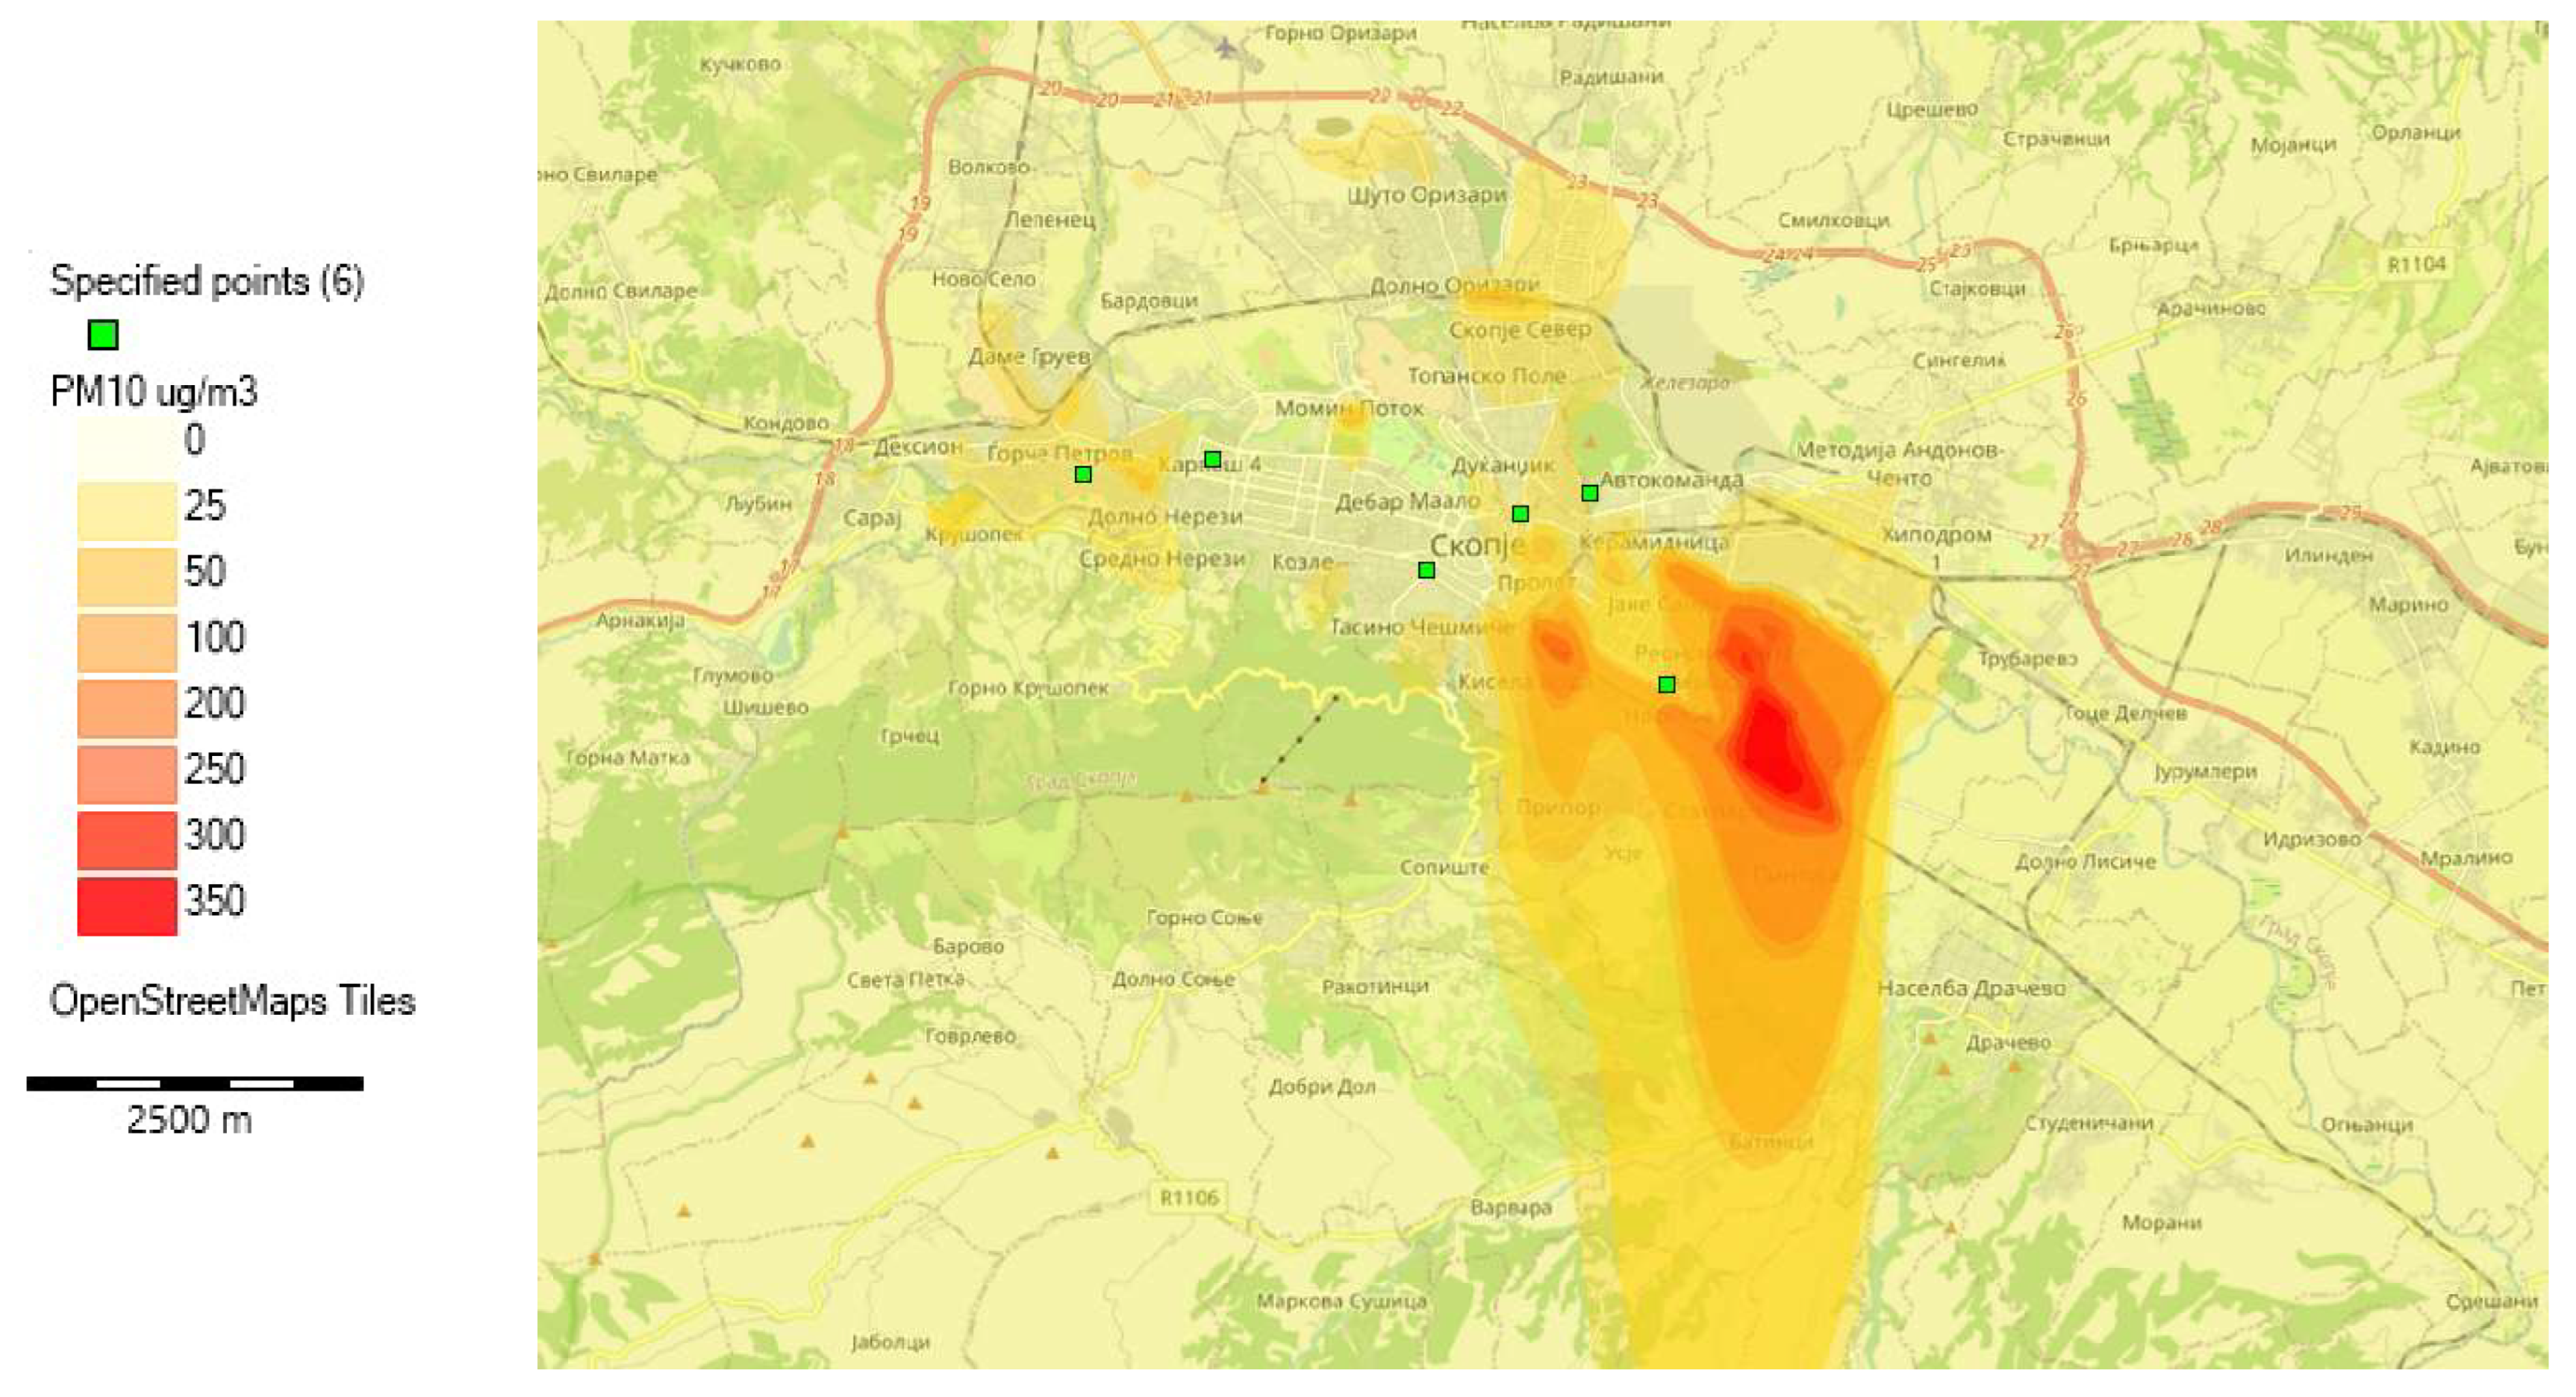
Figure 7 and Figure 8 show PM2.5 and PM10 concentration distribution, respectively, at 02:00 AM in wintertime. At 02:00 AM, the boundary-layer height is very low, around 200 m, which indicates stable night-time conditions with an active temperature inversion. In such conditions, vertical air movement is limited, so pollutants released near the ground cannot rise and disperse efficiently. As a result, PM2.5 and PM10 emitted from residential heating remain trapped close to the surface and lead to increased concentrations over the urban area. The wind during this hour is blowing from the north (0°) with a low speed below 3 m/s, which further reduces the dilution of pollutants because of the limited horizontal transport capacity. This wind direction transports PM2.5 and PM10 mainly towards the south, and because the wind is weak, the plume spreads very little sideways. This behaviour is clearly visible in both of the concentration maps, which show a narrow and elongated plume extending southward from the central parts of Skopje. The PM2.5 plume appears more confined and concentrated, reflecting the fine particles’ stronger tendency to remain suspended under stable conditions and limited vertical mixing, whereas the PM10 plume appears broader and more diffuse, indicating the influence of additional sources such as resuspended dust and the greater settling of coarser particles. While both pollutants accumulate under night-time stable conditions, PM2.5 exhibits sharper concentration gradients and higher sensitivity to suppressed dispersion, whereas PM10 shows a wider spatial impact across downwind residential areas.
The PM2.5 and PM10 concentration maps show distinct intensity levels, with lowest concentrations (up to 25 µg/m3) observed in areas with significant coverage of the central heating network, such as Karpos and Centar. Moderate concentrations in the range of 25–50 µg/m3 occur in areas without central heating systems, including Gjorce Petrov, Shuto Orizari and Aerodrom. The highest concentrations, exceeding 300 µg/m3 and locally reaching 350 µg/m3, are observed across the Lisice area within a narrow downwind plume. These elevated levels are associated with the widespread use of solid-fuel heating and are further intensified by unfavorable meteorological conditions.
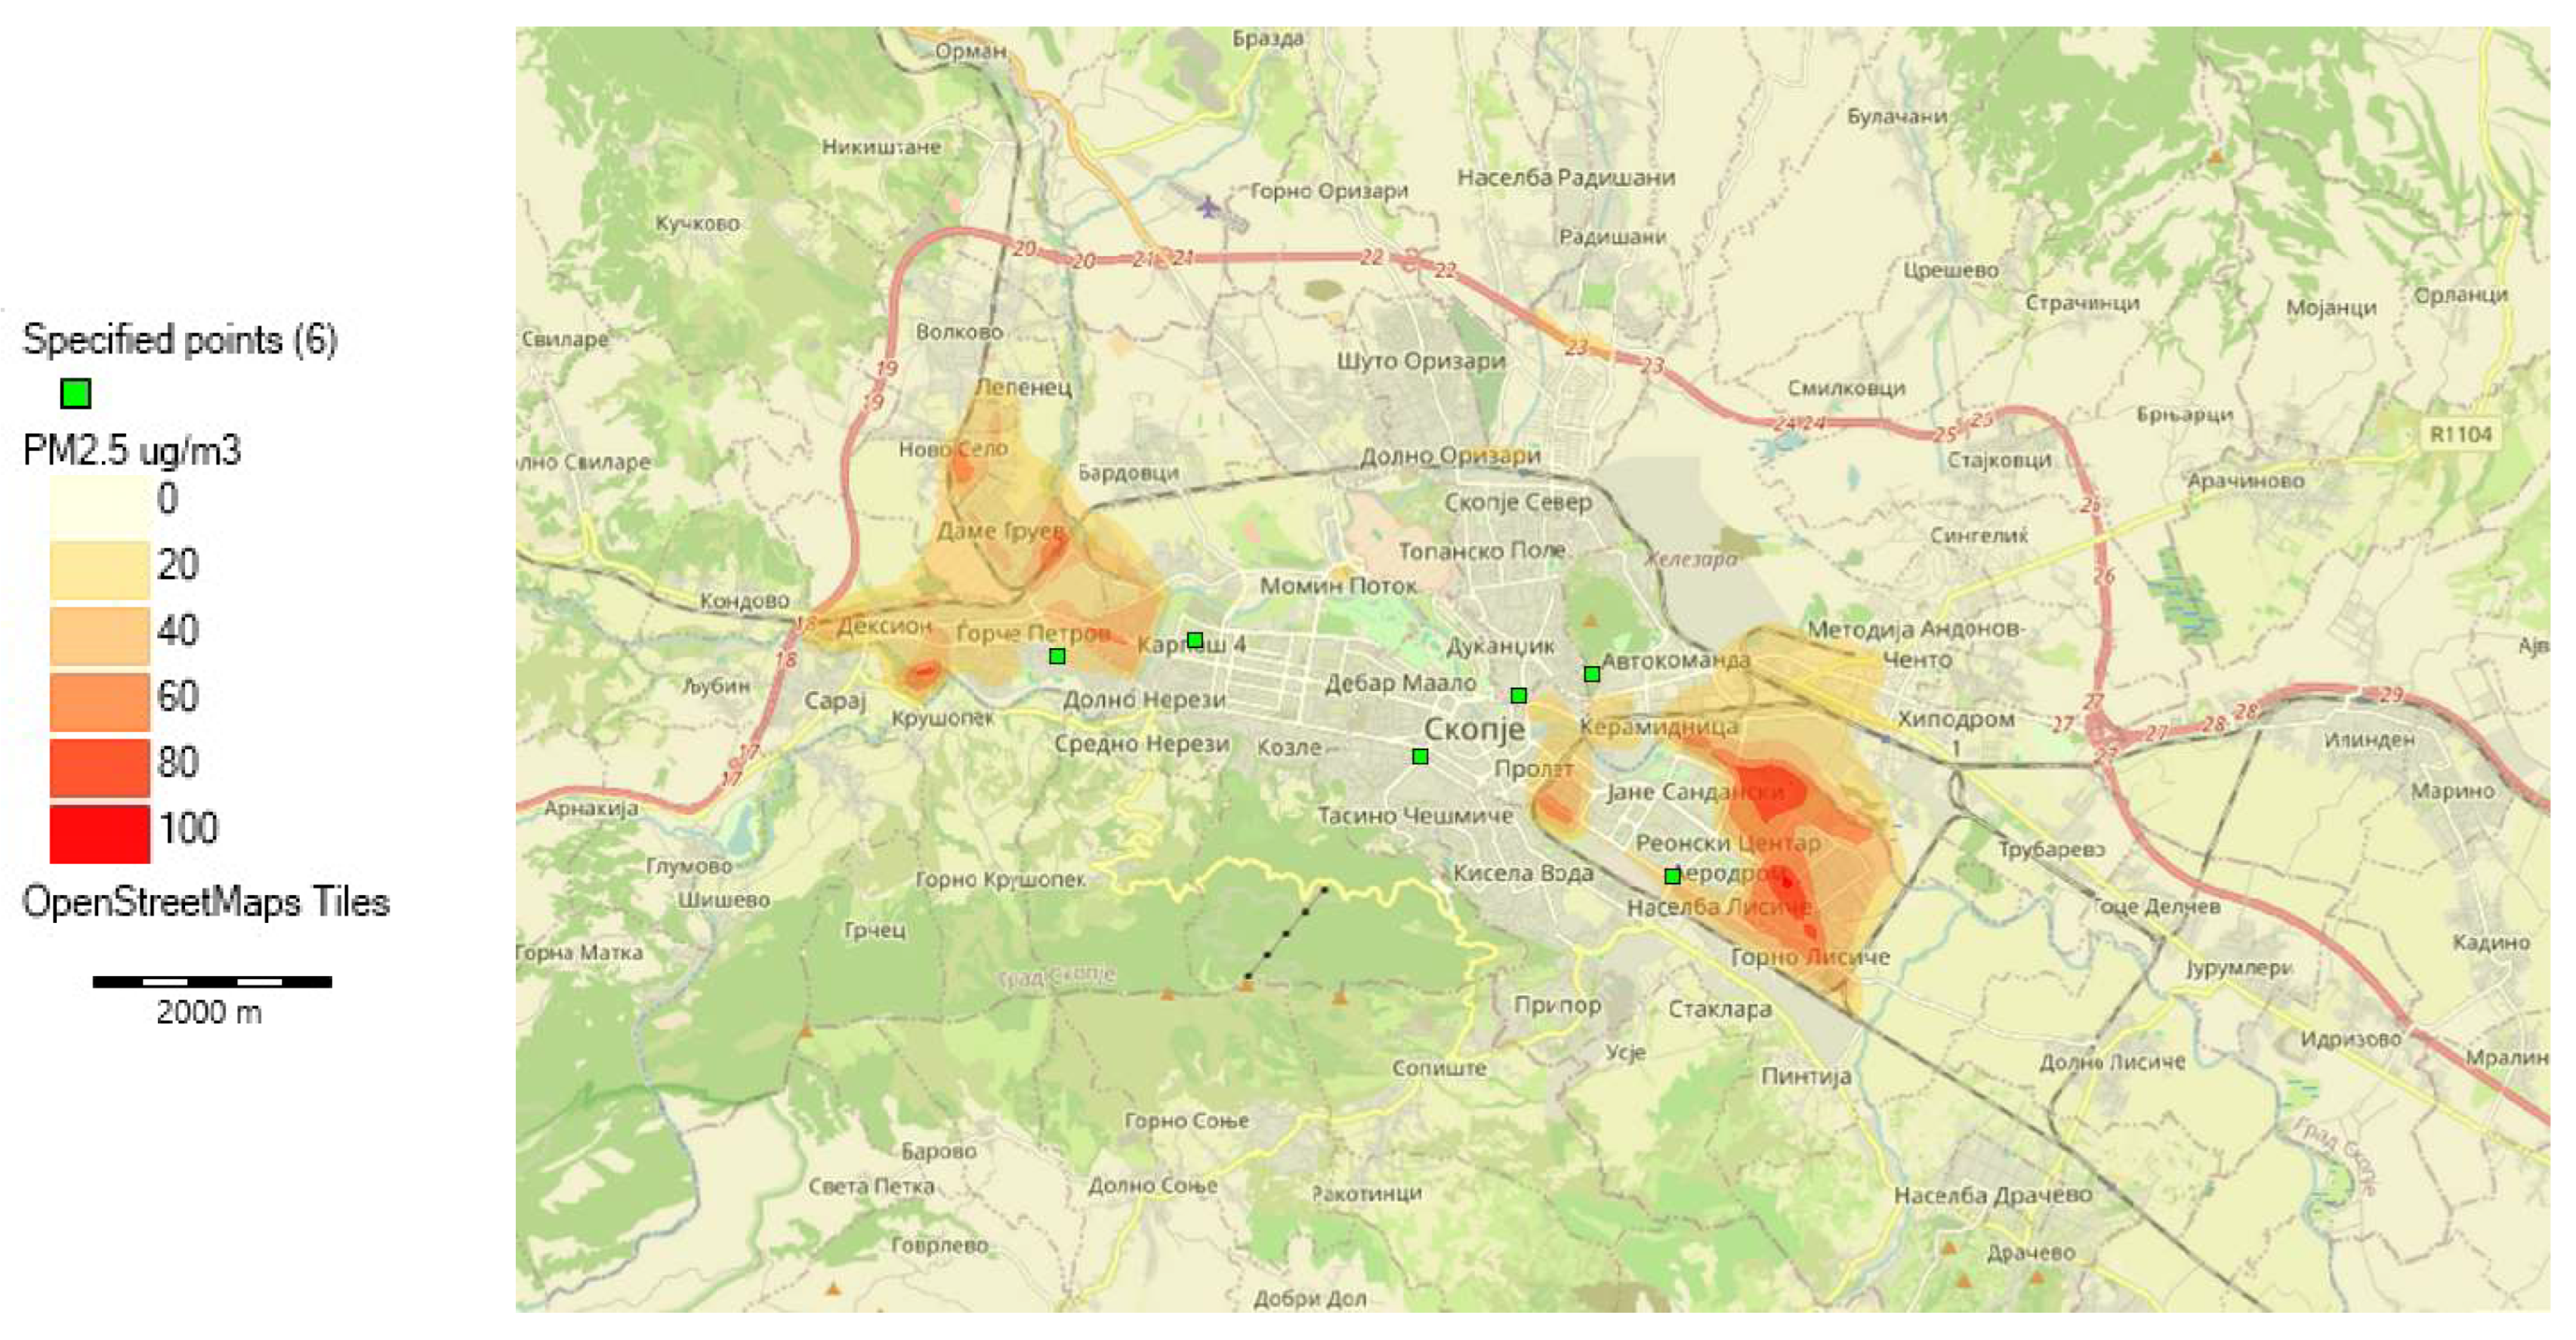
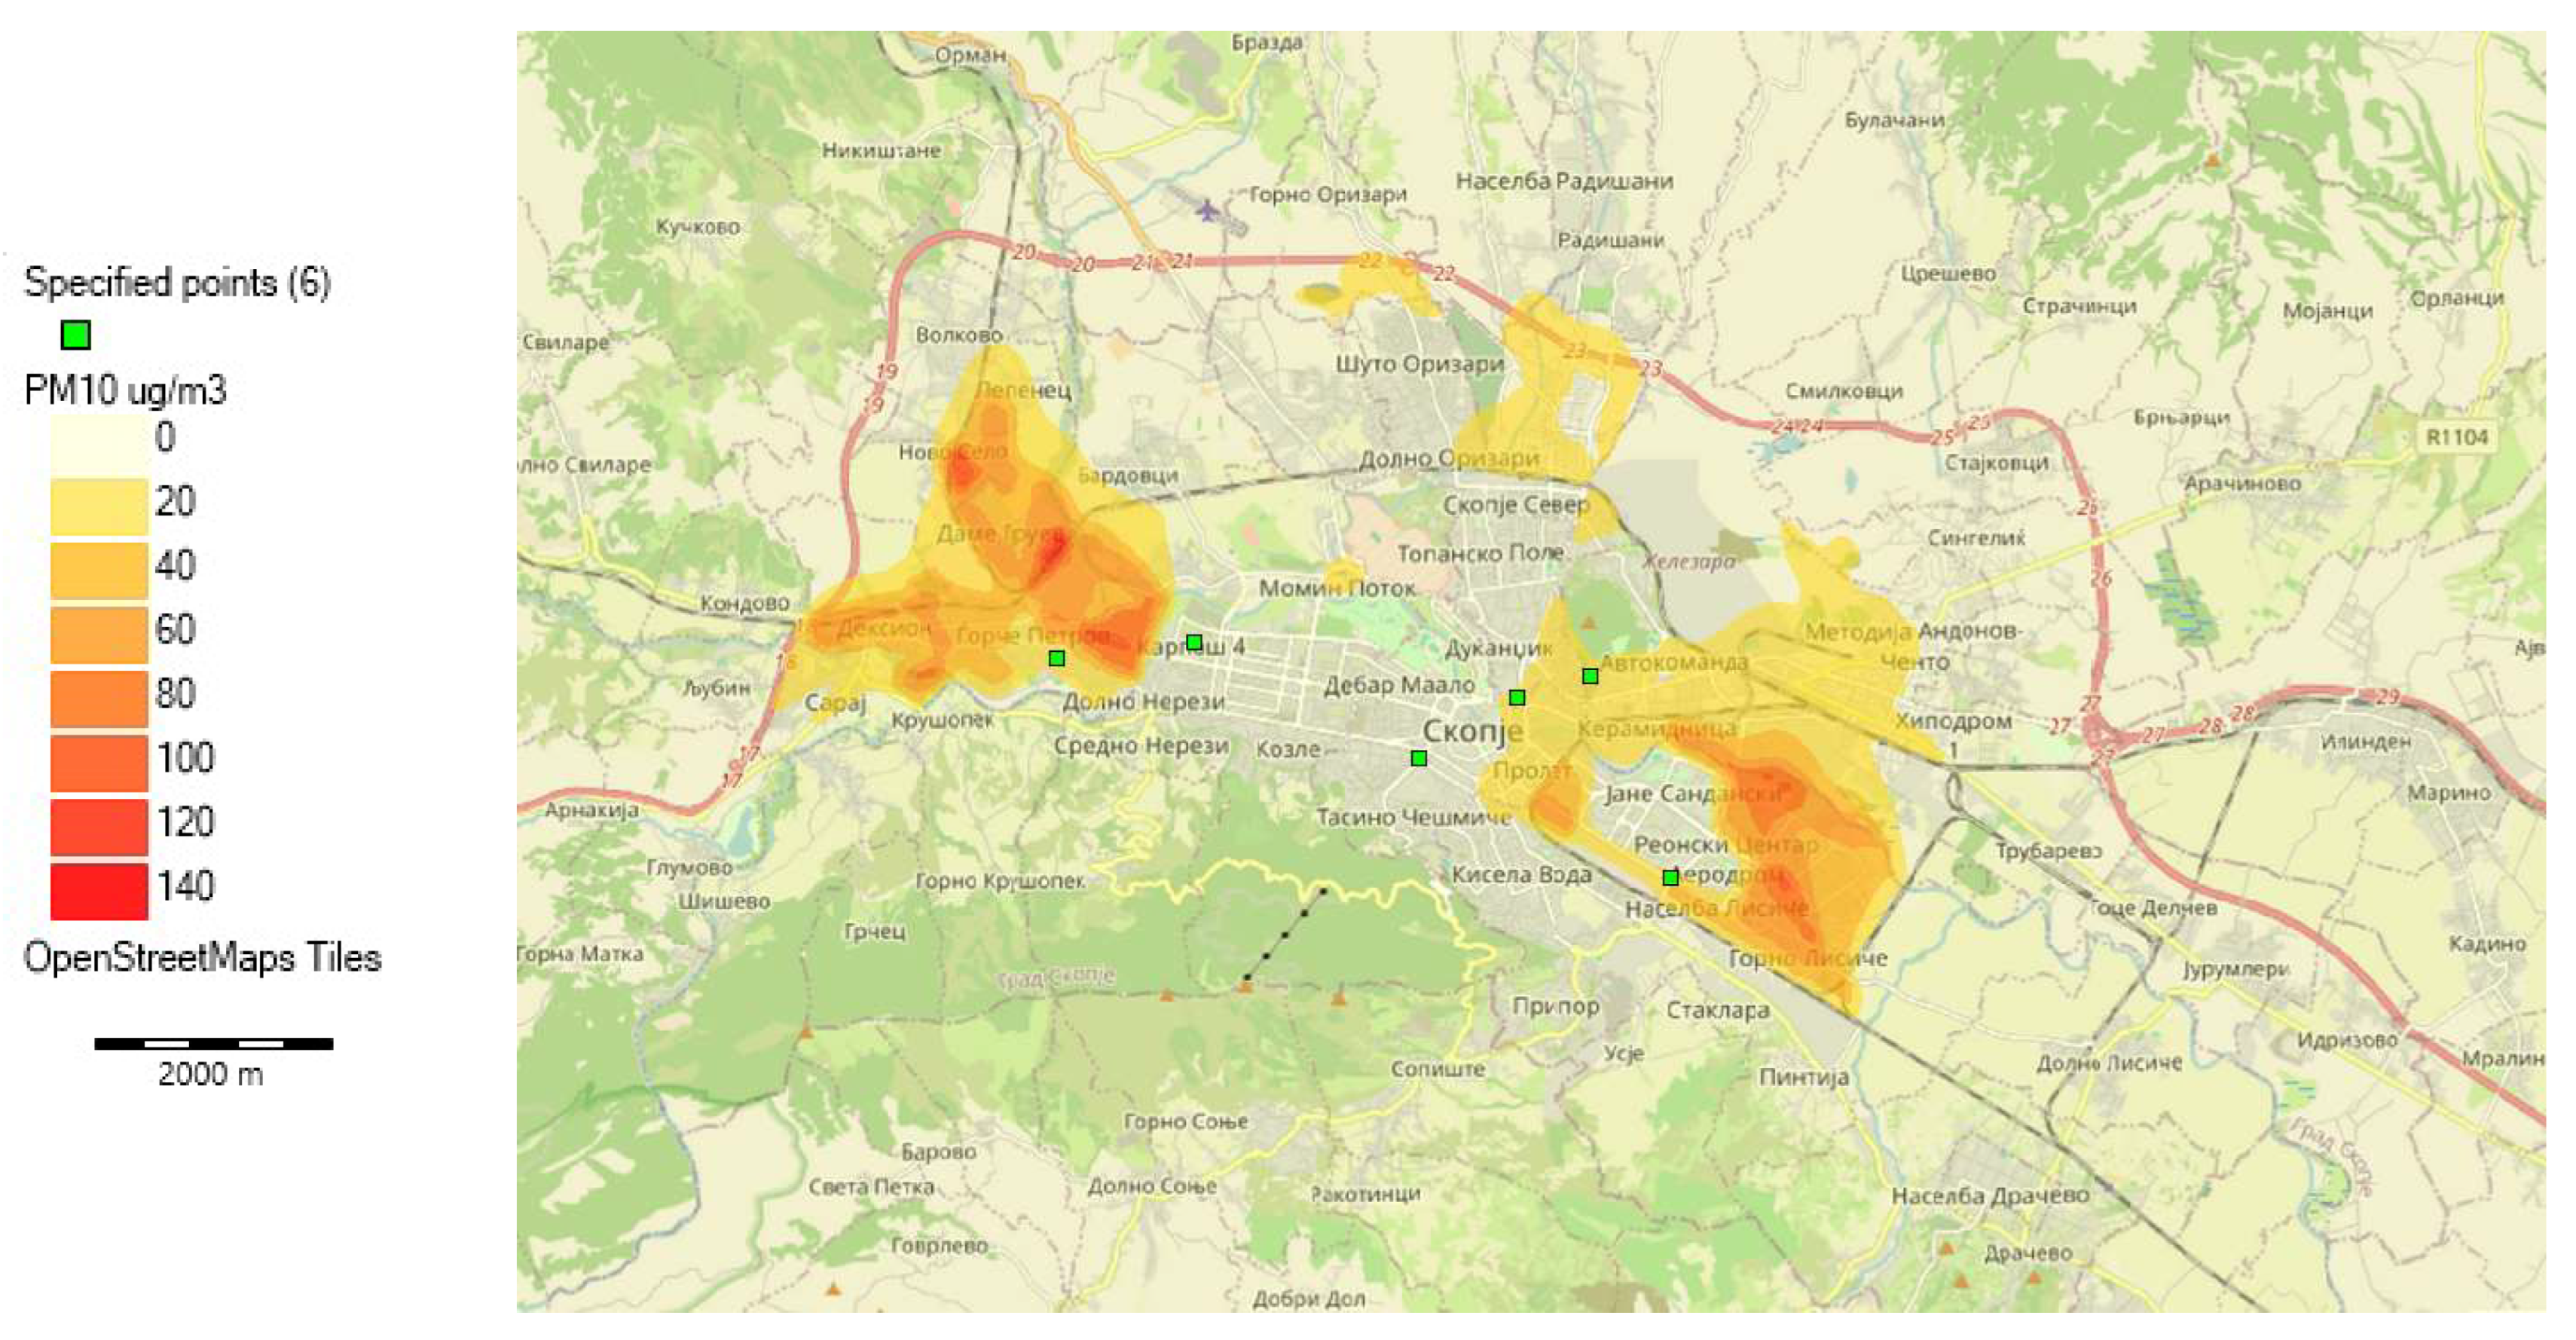
Figure 9 and Figure 10 show PM2.5 and PM10 concentration distribution, respectively, at 02:00 PM in wintertime. At 02:00 PM, the PM2.5 and PM10 concentration maps reflect daytime conditions with wind with moderate speeds blowing from the south (180°). The high boundary-layer height (≈1300 m) reflects strong mixing, which allows pollutants to disperse vertically over a much deeper layer compared to night-time. Pollutants are transported mainly towards the north, forming plumes that extend from the central and southern parts of Skopje toward the northern residential areas. The PM2.5 plume remains more defined, as fine particles stay suspended and follow the wind more closely, while the PM10 plume is broader and more diffuse due to additional sources such as resuspended dust and the greater settling of coarser particles. The PM2.5 and PM10 concentration maps show two distinct zones of elevated concentrations—in addition to the main plume transported northward by the southerly wind, a secondary zone of higher concentrations is visible over the western part of the city. During daytime conditions at 14:00, PM2.5 concentrations are generally lower and range mostly between 20 and 60 µg/m3, with locally elevated values reaching 80–100 µg/m3 in areas directly downwind of active residential heating. PM10 shows a broader intensity range, with concentrations predominantly between 40 and 80 µg/m3, while localized maxima reach 120–140 µg/m3, particularly in areas affected by resuspended dust and combined urban emissions. Comparing the concentration levels at 02:00 AM and 02:00 PM, it is evident that nighttime values are significantly higher due to the much lower boundary-layer height compared to daytime conditions.

4.4. Uncertainty and Limitations

Uncertainty in residential emission estimates arises primarily from the assumed appliance distribution derived from EMEP/EEA guidelines, as no detailed local data on combustion technologies are available. Additional uncertainty stems from the use of Tier 2 average emission factors, which may not fully capture variability in real-world combustion conditions. Further sources of uncertainty include variability in fuel moisture content and lower heating values, as well as the application of generic temporal profiles that are not locally adjusted to reflect specific activity patterns in Skopje. The development of a more detailed, locally derived database on residential combustion technologies and fuel characteristics is currently underway, and its future integration into the emission inventory is expected to further refine model input parameters and reduce associated uncertainties.
Model uncertainty is also associated with meteorological inputs, boundary-layer height estimation, and a simplified representation of residential emissions as homogeneous area sources. Residential emissions were represented using uniform release heights within each district, which may not fully capture variability in building heights and chimney characteristics across the urban area. Furthermore, no buoyant plume rise was applied for residential sources, assuming low-level release conditions typical of domestic combustion; however, actual exhaust dynamics may vary depending on temperature and stack configuration. The analysis was conducted for a single representative winter day, which, although selected to reflect high-pollution conditions, may not fully represent the range of meteorological variability occurring throughout the heating season. Meteorological inputs were obtained from a single monitoring station, which is the only official meteorological monitoring station operated by the National Hydrometeorological Service in Skopje, potentially limiting the representation of spatial variability in wind fields and boundary-layer dynamics across the city basin. Consequently, model results should be interpreted as scenario-based estimates under defined conditions rather than as exact predictions of real-world concentrations.
In addition to inventory and meteorological uncertainties, the present modelling framework does not explicitly account for interactions between different emission sources or for secondary particulate matter formation processes. In reality, atmospheric PM concentrations may be influenced by chemical transformations of precursor gases (e.g., NOx, SO2, NH3), traffic-induced resuspension of road dust, and coupling effects between traffic emissions and surface conditions. These processes can contribute to additional particulate formation or redistribution that is not fully represented in a Gaussian dispersion framework treating primary PM as inert. Consequently, while the model captures the spatial and temporal dispersion of primary emissions, potential non-linear interactions between emission sources and secondary formation mechanisms are not explicitly resolved and should be considered when interpreting the results.

5. Conclusions

This study presented a detailed assessment of residential heating emissions and their contribution to particulate matter pollution in the city of Skopje through the application of numerical dispersion modelling using ADMS-Urban. A spatially resolved emission inventory was developed by integrating national statistical data, spatial planning information, infrastructure coverage, and international methodological guidance. Particular emphasis was placed on household biomass combustion, which was identified as the dominant source of particulate matter emissions in the city.
The source contribution analysis revealed that residential heating accounts for approximately 97–98% of total PM emissions, substantially exceeding the contributions from industry (1.4–1.8%) and road transport. This highly unbalanced emission structure reflects the widespread use of solid biomass fuels and relatively inefficient combustion technologies in the residential sector, particularly during the winter heating season. The results confirm that residential biomass heating is the primary driver of wintertime particulate matter pollution in Skopje.
Emission calculations were carried out using a Tier 2 methodology in accordance with the EMEP/EEA Air Pollutant Emission Inventory Guidebook, allowing emissions to be differentiated by combustion technology. The conversion of fuel consumption data into a consistent energy-based format ensured methodological robustness and compatibility with emission factors and dispersion modelling requirements. The spatial allocation of emissions across 159 city districts enabled a realistic representation of intra-urban variability in residential heating practices.
The analysis confirmed strong consistency between the modelled concentration patterns and the meteorological data, particularly boundary-layer height variability and wind-driven transport, demonstrating satisfactory agreement with measured concentrations. Periods of low boundary-layer height during night and early morning hours were associated with elevated PM10 and PM2.5 concentrations, reflecting suppressed vertical mixing and enhanced pollutant accumulation. Conversely, higher boundary-layer heights during daytime hours coincided with reduced concentrations and improved dispersion. Comparison between modelled and measured concentrations provided further validation of model performance. For the representative winter day analysed, the relative errors for both PM10 and PM2.5 at the Lisice and Gjorce Petrov monitoring sites remained within commonly accepted performance ranges for short-term urban dispersion modelling. The model successfully reproduced observed diurnal trends, including nighttime peaks, midday minima, and late-afternoon concentration increases, demonstrating good temporal traceability. The spatial distribution of concentrations showed strong agreement with observed wind direction and speed patterns. The modelled plumes followed the prevailing wind directions, with nighttime northerly flows transporting pollutants southward under stable conditions and daytime southerly winds producing northward transport under well-mixed conditions. The alignment between wind-driven transport and the spatial concentration fields confirms that the model adequately captures horizontal dispersion and advective processes, supporting its suitability for predictive applications.
Overall, the results confirm that residential biomass heating is the primary driver of particulate matter pollution in Skopje and that numerical dispersion modelling, when supported by detailed emission inventories and an appropriate temporal and spatial resolution, is a powerful tool for understanding urban air pollution dynamics.
The findings underline the importance of targeted mitigation measures in the residential sector. The first approach assumes the continued use of biomass as an energy carrier for household heating and focuses on emission reduction through the use of certified high-quality biomass fuels with higher net calorific value, replacement of individual biomass stoves with high-efficiency and low-emission biomass boilers, substitution of manual boilers with automatic systems, and upgrading of existing household heating systems. A more impactful long-term measure involves a gradual transition from individual biomass-based heating to district (central) heating systems, which would require the expansion and further development of the district heating network across the city. Both mitigation pathways can be explicitly represented and assessed within the ADMS-Urban modelling framework and will therefore be addressed in a dedicated future scenario analysis. Implementation of these measures would significantly reduce particulate matter emissions and contribute to sustainable improvements in urban air quality.
Although the present study focuses on baseline winter conditions, the developed emission inventory and modelling framework allow for straightforward implementation of mitigation scenarios. Potential policy-relevant applications include simulation of reduced biomass consumption, replacement of conventional stoves with high-efficiency low-emission technologies, and expansion of district heating coverage. Preliminary sensitivity considerations suggest that proportional reductions in biomass-related emissions would result in corresponding reductions in near-surface PM concentrations, particularly during stable winter conditions. A dedicated scenario analysis will be addressed in future work to quantify the effectiveness of specific mitigation pathways.

Author Contributions

Conceptualization, M.U.-Z. and M.L.; methodology, M.U.-Z. and M.L.; software, M.U.-Z., M.L. and A.S.; validation, M.U.-Z. and M.L.; formal analysis, Z.M.; investigation, D.D., M.U.-Z. and M.L.; resources, D.D., Z.M., M.U.-Z. and M.L.; writing—original draft preparation, M.U.-Z. and M.L.; writing—review and editing, Z.M.; visualization, M.U.-Z. and A.S.; supervision, D.D. and Z.M.; project administration, D.D. and Z.M.; funding acquisition, D.D. All authors have read and agreed to the published version of the manuscript.

Funding

This research was funded by the UNDP, grant number 07/10-25/9550 signed on 7 November 2025. The funders had no role in the design of the study; in the collection, analyses, or interpretation of data; in the writing of the manuscript; or in the decision to publish the results.

Data Availability Statement

The original contributions presented in this study are included in the article. Further inquiries can be directed to the corresponding author.

Conflicts of Interest

The authors declare no conflicts of interest.

Abbreviations

The following abbreviations are used in this manuscript:
CAMS-TEMPOCopernicus Atmosphere Monitoring Service temporal profiles
CFDComputational Fluid Dynamics
COCarbon monoxide
CUKSTraffic Control Center (North Macedonia)
EEAEuropean Environment Agency
EMEPEuropean Monitoring and Evaluation Programme
MoIMinistry of Interior (North Macedonia)
MOEPPMinistry of Environment and Physical Planning (North Macedonia)
NOXNitrogen oxides
PMParticulate matter
PMFPositive Matrix Factorization
SPASpatial Planning Agency (North Macedonia)
STATState Statistical Office (North Macedonia)
UNDPUnited Nations Development Programme
WHOWorld Health Organization

References

  1. WHO. Ambient (Outdoor) Air Pollution. Available online: https://www.who.int/news-room/fact-sheets/detail/ambient-(outdoor)-air-quality-and-health (accessed on 12 January 2026).
  2. Bai, L.; Benmarhnia, T.; Chen, C.; Kwong, J.C.; Burnett, R.T.; van Donkelaar, A.; Martin, R.V.; Kim, J.; Kaufman, J.S.; Chen, H. Chronic Exposure to Fine Particulate Matter Increases Mortality Through Pathways of Metabolic and Cardiovascular Disease: Insights From a Large Mediation Analysis. J. Am. Heart Assoc. 2022, 11, e026660. [Google Scholar] [CrossRef] [PubMed]
  3. Xi, Y.; Richardson, D.B.; Kshirsagar, A.V.; Wade, T.J.; Flythe, J.E.; Whitsel, E.A.; Rappold, A.G. Association Between Long-Term Ambient PM2.5 Exposure and Cardiovascular Outcomes Among US Hemodialysis Patients. Am. J. Kidney Dis. 2022, 80, 648–657.e1. [Google Scholar] [CrossRef] [PubMed]
  4. Liu, T.; Meng, H.; Yu, M.; Xiao, Y.; Huang, B.; Lin, L.; Zhang, H.; Hu, R.; Hou, Z.; Xu, Y.; et al. Urban-Rural Disparity of the Short-Term Association of PM2.5 with Mortality and Its Attributable Burden. Innovation 2021, 2, 100171. [Google Scholar] [CrossRef]
  5. Kilpatrick, D.J.; Hung, P.; Crouch, E.; Self, S.; Cothran, J.; Porter, D.E.; Eberth, J.M. Geographic Variations in Urban-Rural Particulate Matter (PM2.5) Concentrations in the United States, 2010–2019. GeoHealth 2024, 8, e2023GH000920. [Google Scholar] [CrossRef] [PubMed]
  6. Strosnider, H.; Kennedy, C.; Monti, M.; Yip, F. Rural and Urban Differences in Air Quality, 2008–2012, and Community Drinking Water Quality, 2010–2015–United States. MMWR Surveill. Summ. 2017, 66, 1–10. [Google Scholar] [CrossRef]
  7. Mohajeri, N.; Hsu, S.-C.; Milner, J.; Taylor, J.; Kiesewetter, G.; Gudmundsson, A.; Kennard, H.; Hamilton, I.; Davies, M. Urban–Rural Disparity in Global Estimation of PM2·5 Household Air Pollution and Its Attributable Health Burden. Lancet Planet. Health 2023, 7, e660–e672. [Google Scholar] [CrossRef]
  8. Tessum, M.W.; Anenberg, S.C.; Chafe, Z.A.; Henze, D.K.; Kleiman, G.; Kheirbek, I.; Marshall, J.D.; Tessum, C.W. Sources of Ambient PM2.5 Exposure in 96 Global Cities. Atmos. Environ. 2022, 286, 119234. [Google Scholar] [CrossRef]
  9. Holmes, N.S.; Morawska, L. A Review of Dispersion Modelling and Its Application to the Dispersion of Particles: An Overview of Different Dispersion Models Available. Atmos. Environ. 2006, 40, 5902–5928. [Google Scholar] [CrossRef]
  10. Namrata; Wagh, N.D. A Review on Atmospheric Dispersion System for Air Pollutants Integrated with GIS in Urban Environment. Nat. Environ. Pollut. Technol. 2022, 21, 1553–1563. [Google Scholar] [CrossRef]
  11. Leelőssy, Á.; Molnár, F.; Izsák, F.; Havasi, Á.; Lagzi, I.; Mészáros, R. Dispersion Modeling of Air Pollutants in the Atmosphere: A Review. Open Geosci. 2014, 6, 257–278. [Google Scholar] [CrossRef]
  12. New York State Department of Environmental Conservation. Review of Atmospheric Transport and Dispersion Models Used for Dose Assessment; New York State Department of Environmental Conservation: Albany, NY, USA, 2022.
  13. Snoun, H.; Krichen, M.; Chérif, H. A Comprehensive Review of Gaussian Atmospheric Dispersion Models: Current Usage and Future Perspectives. Euro-Mediterr. J. Environ. Integr. 2023, 8, 219–242. [Google Scholar] [CrossRef]
  14. Hood, C.; Carruthers, D.; Seaton, M.; Stocker, J.; Johnson, K. Urban Canopy Flow Field and Advanced Street Canyon Modelling in ADMS-Urban. In Proceedings of the 16th International Conference on Harmonisation Within Atmospheric Dispersion Modelling for Regulatory Purposes, Varna, Bulgaria, 8 September 2014. [Google Scholar]
  15. Jackson, M.; Hood, C.; Johnson, C.; Johnson, K. Calculation of Urban Morphology Parameterisations for London for Use with the ADMS-Urban Dispersion Model. Int. J. Adv. Remote Sens. GIS 2016, 5, 1678–1687. [Google Scholar] [CrossRef]
  16. Duong, V.M.; Murana, O.O. Comparative Assessment of Ground-Level Air Quality in the Metropolitan Area of Prague Using Local Street Canyon Modelling. Build. Environ. 2023, 236, 110293. [Google Scholar] [CrossRef]
  17. Porwisiak, P.; Werner, M.; Kryza, M.; ApSimon, H.; Woodward, H.; Mehlig, D.; Gawuc, L.; Szymankiewicz, K.; Sawiński, T. Application of ADMS-Urban for an Area with a High Contribution of Residential Heating Emissions-Model Verification and Sensitivity Study for PM2.5. Sci. Total Environ. 2024, 907, 168011. [Google Scholar] [CrossRef]
  18. Sunjevic, M.; Reba, D.; Rajs, V.; Vujic, B.; Ninkov, M.; Vojinovic-Miloradov, M. Assessment of Detected in Situ and Modeled PM10/2.5 Concentration Levels during the Urban Transformation Process in Novi Sad, Serbia. Therm. Sci. 2023, 27, 2275–2286. [Google Scholar] [CrossRef]
  19. Zhong, J.; Lu, Y.; Stocker, J.; Hamilton, V.; Johnson, K. Modelling Temperature Variations in Birmingham, UK at the Neighbourhood Scale: Using ADMS-Urban Climate Model. Sustain. Cities Soc. 2025, 131, 106666. [Google Scholar] [CrossRef]
  20. Ngo, K.Q.; Hoang, L.A.; Ho, B.Q.; Harris, N.R.P.; Drew, G.H.; Mead, M.I. Street-Scale Dispersion Modelling Framework of Road-Traffic Derived Air Pollution in Hanoi, Vietnam. Environ. Res. 2023, 233, 116497. [Google Scholar] [CrossRef]
  21. Zhong, J.; Stocker, J.; Cai, X.; Harrison, R.M.; Bloss, W.J. Street-Scale Air Quality Modelling over the West Midlands, United Kingdom: Effect of Idealised Traffic Reduction Scenarios. Urban Clim. 2024, 55, 101961. [Google Scholar] [CrossRef]
  22. Skopje Se Zagreva. Skopje Is Heating Up. 2026. Available online: https://www.skopjesezagreva.mk/ (accessed on 17 December 2025).
  23. Mirakovski, D.; Zendelska, A.; Boev, B.; Shijakova-Ivanova, T.; Boev, I. Research on the Distribution of Sources for the Skopje Urban Area–Identification of the Main Sources of Ambient Air Pollution; AMBICON UGD Lab.: Skopje, North Macedonia, 2022. [Google Scholar]
  24. Cambridge Environmental Research Consultants (CERC). ADMS-Urban Version 5.1 User Guide(Version 5.1) [Manual]; CERC: Cambridge, UK, 2025; Available online: https://www.cerc.co.uk/environmental-software/assets/data/doc_userguides/CERC_ADMS-Urban5.1_User_Guide.pdf (accessed on 30 January 2026).
  25. State Statistical Office of the Republic of Macedonia. Energy Consumption in Households, Statistical Review: Industry and Energy; State Statistical Office of the Republic of Macedonia: Skopje, North Macedonia, 2019. Available online: https://www.stat.gov.mk/publikacii/2021/6.4.21.01%20915.pdf (accessed on 15 January 2026).
  26. Agency for Spatial Planning of North Macedonia. General Urban Plan of the City of Skopje 2022–2032; Agency for Spatial Planning of North Macedonia: Skopje, North Macedonia, 2022.
  27. Ministry of Environment and Physical Planning (MOEPP). Register of A-Integrated Environmental Permits. Available online: https://arhiva.moepp.gov.mk/wp-content/uploads/2014/10/Registar-na-A-ISKZ-Dozvoli-15.03.2024.pdf (accessed on 14 December 2025).
  28. City of Skopje. Register of B-Integrated Environmental Permits. Available online: https://skopje.gov.mk/media/11801/registar-na-b-ied-i-duop.pdf (accessed on 21 January 2026).
  29. State Statistical Office of the Republic of Macedonia. T-04: Total Energy Consumed in Households, by Regions. Available online: https://www.stat.gov.mk/xls_publikacii/2021/6.4.21.01%20915.xlsx (accessed on 15 January 2026).
  30. EMEP; EEA. EMEP/EEA Air Pollutant Emission Inventory Guidebook 2023. Available online: https://www.eea.europa.eu/en/analysis/publications/emep-eea-guidebook-2023 (accessed on 14 December 2025).
  31. Guevara, M.; Jorba, O.; Tena, C.; Denier van der Gon, H.; Kuenen, J.; Elguindi, N.; Darras, S.; Granier, C.; Pérez García-Pando, C. Copernicus Atmosphere Monitoring Service TEMPOral Profiles (CAMS-TEMPO): Global and European Emission Temporal Profile Maps for Atmospheric Chemistry Modelling. Earth Syst. Sci. Data 2021, 13, 367–404. [Google Scholar] [CrossRef]
  32. State Statistical Office of the Republic of Macedonia. Census of the Population, Households and Apartments in North Macedonia. 2021. Available online: https://www.stat.gov.mk/publikacii/2022/POPIS_DZS_web_MK.pdf (accessed on 14 December 2025).
  33. IQAir. World Air Quality Report: Region and City PM2.5 Ranking; IQAir: Steinach, Switzerland, 2023. [Google Scholar]
  34. Huang, L.; Zhu, Y.; Zhai, H.; Xue, S.; Zhu, T.; Shao, Y.; Liu, Z.; Emery, C.; Yarwood, G.; Wang, Y.; et al. Recommendations on benchmarks for numerical air quality model applications in China–Part 1: PM2.5 and chemical species. Atmos. Chem. Phys. 2021, 21, 2725–2743. [Google Scholar] [CrossRef]
  35. de Meij, A.; Cuvelier, C.; Thunis, P.; Pisoni, E. A new set of indicators for model evaluation complementing FAIRMODE’s modelling quality objective (MQO). Geosci. Model Dev. 2025, 18, 4231–4245. [Google Scholar] [CrossRef]
  36. Hanna, S.; Chang, J. Acceptance Criteria for Urban Dispersion Model Evaluation. Meteorol. Atmos. Phys. 2012, 116, 133–146. [Google Scholar] [CrossRef]
  37. Sattari, A.; Hooyberghs, H.; Janssen, S.; Norowski, A.; Blyth, L.; Augustynski, I. Enhancing ATMO-Street model accuracy through emission source analysis using a dense sensor network: A Warsaw case study. Environ. Monit. Assess. 2025, 197, 1123. [Google Scholar] [CrossRef]
Figure 1. Contribution of each pollution source to the total pollution from PM.
Atmosphere 17 00291 g001
Figure 2. District heating system network within the city of Skopje (marked with gray lines) and districts division (marked with orange lines) [26].
Atmosphere 17 00291 g002
Figure 3. Computational domain with emission sources and receptors in ADMS-Urban [24].
Atmosphere 17 00291 g003
Figure 4. Meteorological conditions during the analyzed winter day: (a) wind rose and (b) diurnal boundary-layer height.
Atmosphere 17 00291 g004
Figure 5. Measured and modelled concentrations of particulate matter at the Lisice monitoring station: (a) PM10 and (b) PM2.5.
Atmosphere 17 00291 g005
Figure 6. Measured and modelled concentrations of particulate matter at the Gjorce Petrov monitoring station: (a) PM10 and (b) PM2.5.
Atmosphere 17 00291 g006
Figure 7. Modelled PM2.5 concentration map at 02:00 AM in winter.
Atmosphere 17 00291 g007
Figure 8. Modelled PM10 concentration map at 02:00 AM in winter.
Atmosphere 17 00291 g008
Figure 9. Modelled PM2.5 concentration map at 02:00 PM in winter.
Atmosphere 17 00291 g009
Figure 10. Modelled PM10 concentration map at 02:00 PM in winter.
Atmosphere 17 00291 g010
Table 1. Summary of source-specific input parameters used in ADMS-Urban.
Parameter CategoryIndustry (Point Sources)Transport (Road Sources)Households (Area Sources)
Geometry/LocationCoordinates (X, Y): Exact location of the stack/facilityCoordinates (start X, Y & end X, Y): road segment definitionPolygon coordinates (X, Y): vertices defining the neighborhood/block boundary
Physical PropertiesStack diameter (m): internal diameter of the openingRoad width (m): total width of the roadRelease height (m): average height of chimneys
Stack height (m): release height above ground
Exit velocity (m/s): speed of exhaust gasesSurface roughness
Exit temperature (°C): temperature of exhaust gases
Activity/Traffic DataOperational hours: time profile of when the facility is activeAverage speed (km/h): average traffic flow speedFuel usage profile: hourly/seasonal heating usage variations
Volume flux (m3/s): total volume of gas emitted (derived from velocity/diameter)Light vehicles (PMV): count of passenger cars (per hour/day)
Heavy vehicles (TMV): count of trucks/buses (per hour/day)
Emission DataEmission rate (g/s): mass of pollutant emitted per secondEmission factors (g/km/s): calculated via fleet dataTotal emission (g/m2/s): aggregated emissions for the defined polygon
Pollutants: NOx, PM10, PM2.5, SO2, etc.Pollutants: NOx, PM10, PM2.5, SO2, etc.Pollutants: NOx, PM10, PM2.5, SO2, etc.
Table 2. FAC2 values for PM10 and PM2.5 at the Lisice and Gjorce Petrov monitoring sites.
ReceptorLisiceGjorce Petrov
Season/ParameterPM10PM2.5PM10PM2.5
Winter1.441.190.851.24
Spring1.050.690.640.69
Summer1.870.575.275.32
Autumn2.691.422.632.72
Table 3. Statistical performance indicators for PM10 and PM at the Lisice and Gjorce Petrov monitoring sites for 15 February 2023.
ReceptorLisiceGjorce Petrov
Indicator/ParameterPM10PM2.5PM10PM2.5
Mean relative error (-)−0.1360.020.224−0.172
Mean Bias (µg/m3)−25.96−5.515.46−7.45
Normalized Mean Bias (-)−0.27−0.080.12−0.25
Root Mean Square Error (µg/m3)28.5630.1912.2112.09
Disclaimer/Publisher’s Note: The statements, opinions and data contained in all publications are solely those of the individual author(s) and contributor(s) and not of MDPI and/or the editor(s). MDPI and/or the editor(s) disclaim responsibility for any injury to people or property resulting from any ideas, methods, instructions or products referred to in the content.