Article

Impact of Large-Scale Wildfires and Meteorological Factors on PM Concentrations in Agricultural Regions: Non-Linear Relationship Analysis Using GAM


1
Department of Safety Engineering, Graduate School, Seoul National University of Science and Technology, Seoul 01811, Republic of Korea
2
Department of Safety Engineering, Seoul National University of Science and Technology, Seoul 01811, Republic of Korea
3
Climate Change Division, National Institute of Agricultural Sciences, Rural Development Administration (RDA), Wanju 55365, Republic of Korea
*
Authors to whom correspondence should be addressed.
Atmosphere 2026, 17(2), 216; https://doi.org/10.3390/atmos17020216
Submission received: 14 January 2026 / Revised: 11 February 2026 / Accepted: 17 February 2026 / Published: 19 February 2026
(This article belongs to the Section Air Quality)

Abstract

The intensification of large-scale wildfires, driven by climate change, presents a critical threat to agricultural ecosystems, specifically during the vulnerable sowing season in March. Departing from the prevailing focus on urban air quality, this study elucidates the spatiotemporal dynamics of particulate matter (PM) in eight major Korean agricultural regions during the March 2025 wildfires. By employing a Generalized Additive Model (GAM), we characterized the complex non-linear interactions between PM concentrations and meteorological variables. The analysis reveals a substantial elevation in PM levels during the wildfire event relative to the pre-fire baseline. Most notably, the Sangju region experienced the most acute accumulation, with PM-10 and PM-2.5 concentrations surging by 74% and 46%, respectively; this intensification was significantly compounded by topographic trapping and surface inversion phenomena. Furthermore, GAM results identified temperature and relative humidity as the primary determinants of PM retention, whereas wind speed demonstrated a distinct non-linear, U-shaped effect, facilitating particulate resuspension at higher velocities. These findings quantitatively underscore the susceptibility of agricultural environments to wildfire-induced aerosols and highlight the imperative for establishing agriculture-specific monitoring networks and early warning protocols to safeguard crop productivity.

1. Introduction

The acceleration of climate change has precipitated a global escalation in both the frequency and intensity of wildfires. Given the inherent characteristics of wildfires—specifically, restricted accessibility and the abundance of combustible vectors—single events often result in catastrophic devastation. Statistics from the Korea Forest Service illuminate this trend: over the recent decade (2015–2024), the mean annual frequency of wildfires was approximately 546, with an average affected area of 4003 ha. This represents a marked increase relative to the preceding decade (2005–2014), with incidence rising by approximately 42% and the damaged area expanding by a factor of 6.3, evidencing a distinct trend toward the enlargement of wildfire scale [1]. While anthropogenic activities in rural sectors, such as agricultural byproduct incineration and land preparation, remain predominant ignition sources [2], the fundamental driver escalating recent wildfires to uncontrollable magnitudes is the high-temperature, arid meteorological regime induced by climate change, which establishes conditions highly conducive to rapid fire propagation [3]. Beyond the extensive loss of forest resources and ecological devastation, these large-scale wildfires generate deleterious secondary impacts on public health and industrial operations by releasing voluminous smoke plumes laden with atmospheric pollutants during combustion. Notably, the massive wildfire event concentrated in the Gyeongsang province from 21 to 30 March 2025, ravaged an extensive area of 48,238.61 ha across 11 distinct districts [4]. According to the Central Disaster and Safety Countermeasures Headquarters, the unprecedented velocity of the wildfire propagation was attributed to the synergistic interaction of prolonged extreme aridity and high wind speeds relative to climatological norms. Furthermore, satellite imagery clearly captured massive smoke plumes enveloping the southeastern Korean Peninsula [4].
Wildfire smoke comprises a complex mixture of hazardous pollutants, including fine particulate matter (PM-2.5), particulate matter (PM-10), nitrogen dioxide (NO2), sulfur dioxide (SO2), carbon monoxide (CO), and volatile organic compounds (VOCs) [5]. Particulate matter (PM) derived from wildfire smoke exhibits distinct physicochemical profiles and toxicological mechanisms compared to ambient PM, thereby posing a more severe threat to human health. Previous investigations indicate that wildfire-derived PM is enriched with organic compounds possessing high oxidative potential and reactive oxygen species (ROS), inducing more potent oxidative stress and inflammatory responses than ambient PM [6,7]. In particular, in vivo studies have reported that PM collected during wildfire events significantly exacerbates pulmonary cell injury and the production of inflammatory cytokines compared to ambient PM, exhibiting approximately a tenfold increase in pulmonary toxicity [8]. Pollutants entrained in wildfire smoke can be transported over distances exceeding hundreds of kilometers depending on meteorological conditions, exerting widespread impacts on air quality not only in the immediate vicinity of the fire but also on a national scale [9]. According to the National Institute of Environmental Research (NIER), satellite imagery analysis revealed that PM-2.5 concentrations in proximal regions surged by approximately 25-fold relative to baseline levels during large-scale wildfires; furthermore, it was confirmed that high concentrations of emitted pollutants undergo long-range transport, affecting air quality in distal regions through the formation of secondary aerosols [10,11].
The dispersion of atmospheric pollutants resulting from large-scale wildfire exerts complex deleterious effects, particularly on agricultural ecosystems. High concentrations of atmospheric PM absorb incident radiant heat, elevating leaf surface temperatures by approximately 2–4 °C; this thermal increase abnormally accelerates the transpiration rate, thereby inducing water stress in crops [12,13,14]. Furthermore, PM deposited on leaf surfaces physically obstructs stomata and blocks sunlight, reducing photosynthetic efficiency by 21–58% and decreasing carbohydrate content—a critical energy source for plant growth—which ultimately results in growth retardation [13]. March marks the critical sowing and regrowth period for major crops; consequently, wildfire-derived PM occurring during this season can inflict catastrophic damage on crop productivity [15]. Indeed, previous studies have reported a correlation between PM and the inhibition of agricultural yield [16,17]. Whereas existing research has predominantly focused on urban air quality or human health impacts, there is a paucity of quantitative studies examining the effects of wildfires on air quality in agricultural regions and the crop growth environment. Therefore, an analysis of the behavioral characteristics of wildfire-derived PM targeting agricultural areas is urgently required. Research on the air pollution impacts of wildfires has conventionally been conducted using satellite remote sensing or Chemical Transport Models (CTM) to trace smoke dispersion pathways over extensive regions [18,19,20]. In regions frequently beset by large-scale wildfires, such as California, USA, and Australia, efforts have been made to assess pollution exposure in agricultural and suburban areas through such macroscopic modeling or to elucidate general correlations between air quality and meteorological factors using linear regression analysis [21,22,23]. However, while these approaches are useful for understanding broad spatial distributions, they have limitations in explaining the complex behavior of PM coupled with local topographic features. Given the topographical characteristics of South Korea, where mountainous terrain and agricultural land are intermixed, the relationship between meteorological variables and air pollutants is likely to exhibit complex non-linear interactions rather than simple linearity; thus, the application of statistical methodologies capable of interpreting these dynamics with precision is necessary.
Consequently, this study aims to elucidate the impact of wildfire-emitted pollutants on PM concentrations in major agricultural regions of South Korea, centering on the large-scale wildfire event of March 2025. PM concentrations exhibit complex non-linear associations—characterized by thresholds or saturation points—rather than simple linear correlations with meteorological parameters such as wind speed, ambient temperature, and humidity. Conventional linear regression analyses possess inherent limitations in adequately capturing the complex influence exerted by these meteorological variables. To address these complexities, this study employs a Generalized Additive Model (GAM) to flexibly model non-linear relationships between variables and to precisely estimate the impact of the wildfire while adjusting for meteorological effects. To this end, utilizing PM-10 and PM-2.5 concentration data acquired from monitoring stations in eight major agricultural regions across South Korea, we quantitatively analyze concentration variations across the pre-fire, wildfire, and post-fire periods to derive meaningful implications.

2. Materials and Methods

2.1. Study Area and Period

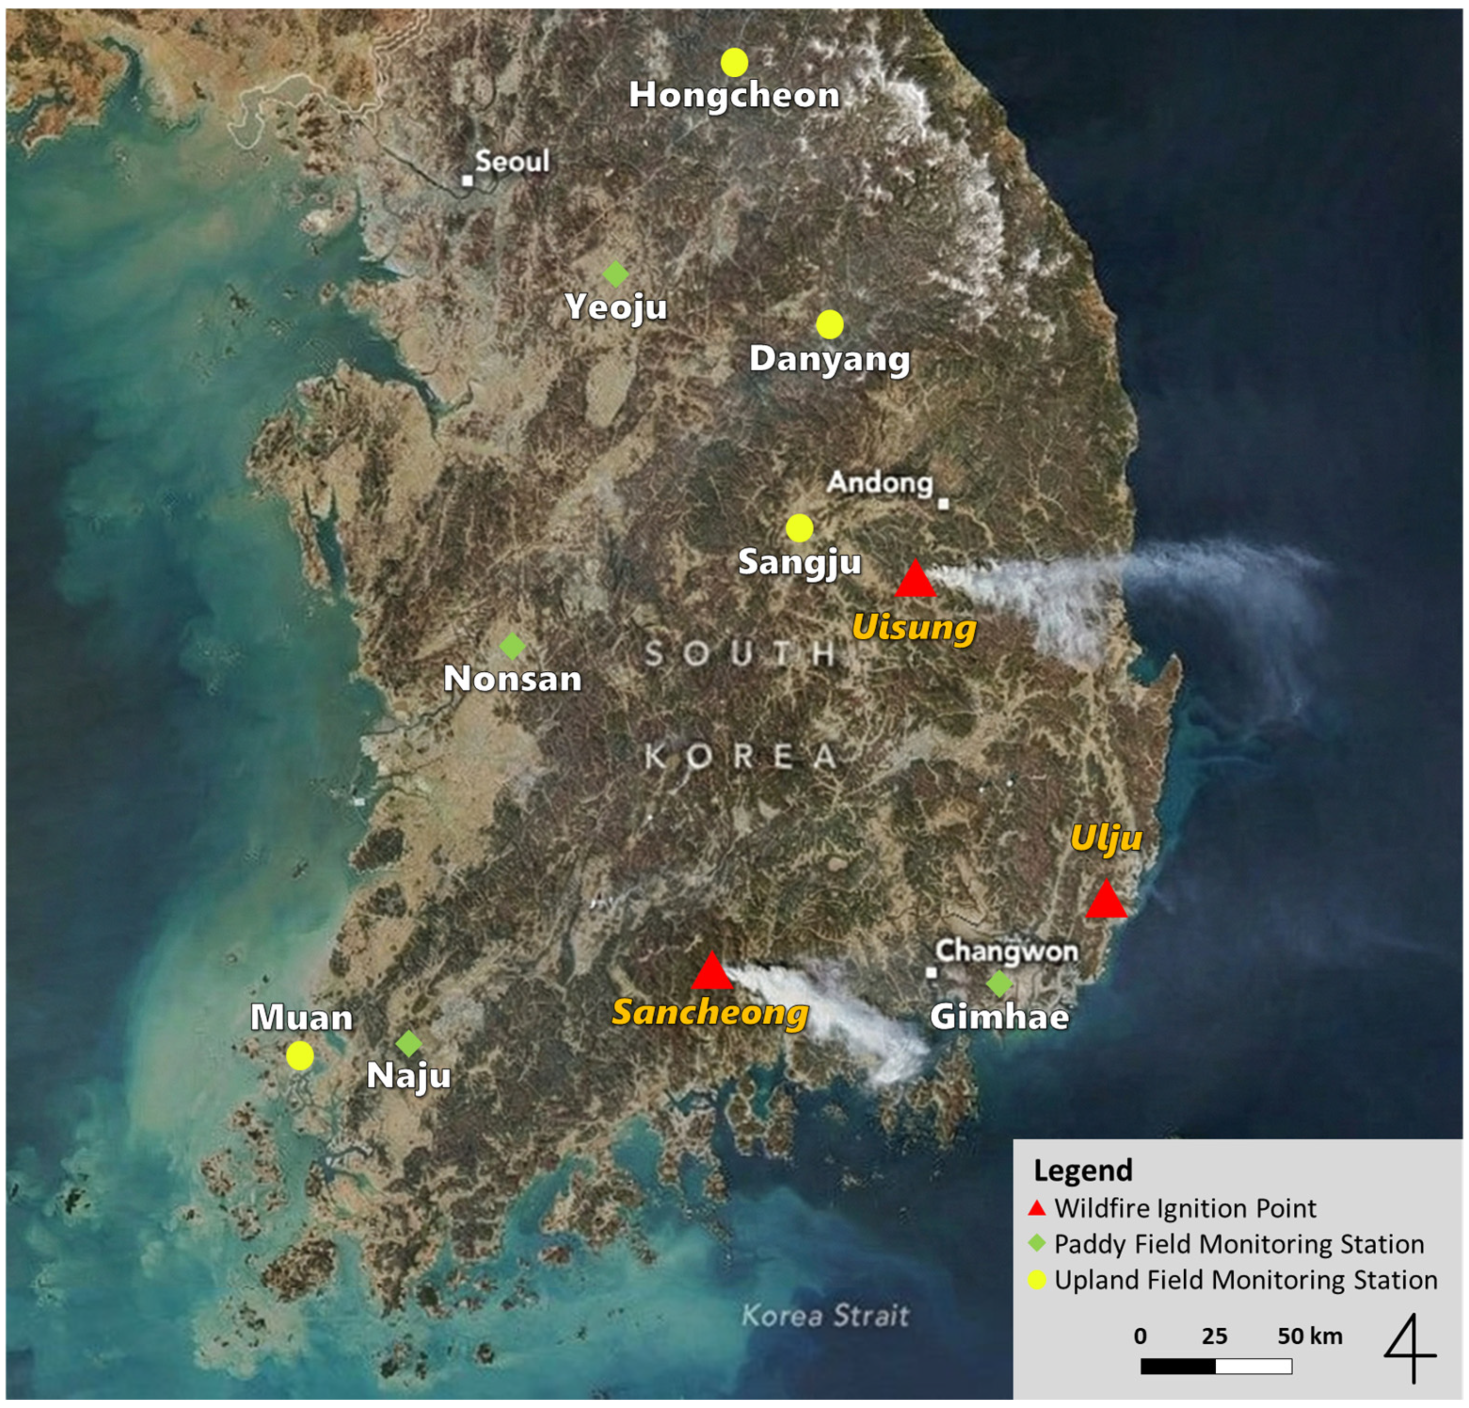
This study designated three specific regions—Sancheong-gun (Gyeongsangnam-do), Uiseong-gun (Gyeongsangbuk-do), and Ulju-gun (Ulsan Metropolitan City)—as the primary wildfire occurrence sites (Figure 1). These areas were subject to a Level 3 response by the Korea Forest Service during the large-scale wildfire events that transpired across the Gyeongsang provinces from 21 to 30 March 2025 [24]. A Level 3 response signifies a critical crisis stage characterized by an estimated damage area exceeding 100 ha or average wind speeds surpassing 7 m/s, with an anticipated extinguishment duration of over 24 h, thereby necessitating the mobilization of firefighting resources on a broad, regional scale [25]. At the time of the events, these regions exhibited meteorological characteristics defined by sustained strong winds and severe aridity relative to climatological norms.
To evaluate variations in atmospheric PM concentrations nationwide in relation to wildfire occurrences, the study period was stratified into three distinct phases: ‘Pre-fire’, ‘Wildfire’, and ‘Post-fire’. The analysis periods were established to secure a stable atmospheric baseline prior to the event and to capture the residual presence and dissipation processes of pollutants following the event. Consequently, the Pre-fire period was defined as the 10 days preceding the outbreak (11 March 2025, 00:00–21 March 2025, 15:00), and the Post-fire period as the 10 days following extinguishment (30 March 2025, 12:00–9 April 2025, 23:00). The Wildfire period was defined as 21 March 2025, 16:00 to 30 March 2025, 13:00, based on the duration and timing of the wildfire in Sancheong-gun, which exhibited the most prolonged duration among the regions subject to a Level 3 response.
PM measurement data utilized in this study were acquired from monitoring stations located in eight major agricultural regions across South Korea (four paddy field regions and four dry field regions). The geographical distribution of agricultural monitoring stations is shown in Figure 1. The selection criteria for these monitoring stations were as follows: Gimhae, Naju, Nonsan, and Yeoju were selected as representative paddy field regions, based on their location within South Korea’s major plains. Conversely, Danyang, Muan, Sangju, and Hongcheon were selected as dry field regions, categorized according to the types of crops cultivated. Hourly averaged concentrations derived from real-time measurements of PM-10 and PM-2.5 at these eight stations were utilized for the analysis.

2.2. Measurement Methods

To quantify atmospheric concentrations of PM-10 and PM-2.5, this study employed an automatic analyzer (MEZUS 610, Kentek Inc., Daejeon, Republic of Korea) operating on the principle of the Beta-ray Attenuation Method. To ensure data reliability, instrumentation that has obtained formal type approval from the Ministry of Environment was selected; detailed specifications of the measurement equipment are presented in Table S1.
Measurements were conducted automatically at 5 min intervals utilizing the Beta-ray Attenuation Method. This technique continuously measures the mass concentration of PM by collecting suspended atmospheric particles on a filter medium over a defined duration and measuring the transmission of beta radiation. Specifically, the process involves measuring the relative intensity of beta rays emitted from a beta source as they pass through the sample. Since the Beta-ray Attenuation Method enables real-time continuous monitoring with minimal interference from meteorological variables (e.g., moisture), it is highly effective for capturing rapid fluctuations in wildfire smoke concentrations; accordingly, it has been adopted as the standard reference method by the Ministry of Environment [27,28].

2.3. Data Analysis

To analyze the variations in PM concentrations attributable to wildfire occurrences and meteorological factors, the explanatory variables constructed in this study comprised the classification of wildfire periods and meteorological parameters, specifically wind speed, ambient temperature, and relative humidity. The progression of the wildfire event was categorized by stratifying the entire analysis timeline into three distinct periods: ‘Pre-fire’, ‘Wildfire’, and ‘Post-fire’. Temperature and relative humidity data were calibrated by averaging measurements from the eight monitoring stations on an hourly basis. Wind speed data were acquired via the Korea Meteorological Administration’s Weather Data Service, utilizing time-series datasets from the nearest Automated Synoptic Observing System (ASOS) and Automatic Weather Station (AWS) sites located within the same administrative districts (Si/Gun) as each monitoring station [29,30]. To ensure data quality and statistical integrity, observations containing missing values were excluded from the analysis.
Based on the collected dataset, a GAM analysis was executed. GAM is a semi-parametric regression model that extends the Generalized Linear Model (GLM); it possesses the distinct advantage of flexibly estimating complex non-linear relationships between explanatory and dependent variables directly from the data without rigid a priori assumptions [31,32]. It is widely employed in the analysis of time-series data, such as atmospheric pollution concentrations, to effectively control for the effects of non-linear confounding factors, including seasonality, long-term trends, and meteorological variables [33].
g E Y = β 0 + f 1 x 1 + f 2 x 2 + + f p x p + ϵ
The link function relates the expected value E Y of the dependent variable Y , β 0 represents the intercept, and f p x p denotes the unknown smoothing function for each explanatory variable [34]. In GAM, the influence of each variable is represented by individual smoothing functions; since these functions depict non-linear changes in predicted values corresponding to specific variable values, the non-linear effects of each variable can be visualized and interpreted through partial dependence plots. In this study, separate GAMs were constructed for each monitoring station, with PM-10 and PM-2.5 concentrations serving as the dependent variables. The dependent variable was defined as the hourly average concentration of PM-10 or PM-2.5. PM concentration data are positive values (≥0) and exhibit an asymmetrical distribution skewed to the right. Considering these distributional characteristics, the analysis was conducted by transforming the PM concentrations into logarithmic values, assuming a Gaussian distribution. With the exception of categorical variables such as the wildfire period classification, continuous variables—specifically ambient temperature, relative humidity, and wind speed—were modeled using smoothing functions.
To ascertain the distribution of PM concentrations during the analysis period, the statistical significance of log-transformed concentrations for each station was evaluated using Analysis of Variance (ANOVA) and Tukey’s Honest Significant Difference (HSD) post hoc test. Prior to the execution of the GAM analysis, the Variance Inflation Factor (VIF) was calculated to assess the explanatory power and multicollinearity among explanatory variables. The analysis confirmed the absence of multicollinearity issues among all variables; consequently, all designated variables were incorporated into the model. Temporal autocorrelation inherent in the time-series data was corrected using an AR(1) model. Following the GAM analysis, residual diagnostics were performed using Q-Q plots to assess the normality of the model. All statistical analyses were conducted using R version 4.5.2.

3. Results

3.1. Distribution of PM Concentrations During the Analysis Period

To quantitatively validate these visual trends, geometric means were compared and analyzed, accounting for the log-normal distribution characteristics of the data; the results are summarized in Table 1.
Both PM-10 and PM-2.5 exhibited elevated concentrations during the Wildfire period compared to the Pre-fire and Post-fire periods. Specifically, PM-10 concentrations increased by approximately 25–74%, and PM-2.5 concentrations by approximately 12–46%, relative to the Pre-fire baseline. The Tukey HSD post hoc test, conducted to verify statistical significance, revealed statistically significant differences in PM-10 concentrations between the Pre-fire and Wildfire periods, as well as between the Wildfire and Post-fire periods across all monitoring stations (p < 0.05). Regarding PM-2.5 concentrations, significant differences between the Pre-fire and Wildfire periods were observed only in the Danyang, Muan, Naju, Nonsan, and Sangju regions (p < 0.05). Conversely, comparisons between the Pre-fire and Post-fire periods generally showed no statistically significant differences for either PM-10 or PM-2.5; however, a significant difference was noted in PM-10 concentrations at the Muan monitoring station (p < 0.05). The ANOVA results demonstrate that PM concentrations surged coinciding with the onset of the wildfire, suggesting that the magnitude of the wildfire’s impact varies depending on particle size.

3.2. GAM Analysis Results

3.2.1. GAM Analysis on PM-10 Concentrations

The results of the GAM analysis for PM-10 concentrations over the entire study period are summarized in Table 2. Except for Muan, PM-10 concentrations significantly increased during the Wildfire period compared to the Pre-fire period at all sites (p < 0.05). In all regions, the influence of ambient temperature and relative humidity on PM-10 concentrations was found to be statistically significant; however, wind speed was statistically significant only in specific regions, namely Hongcheon and Sangju (p < 0.05).
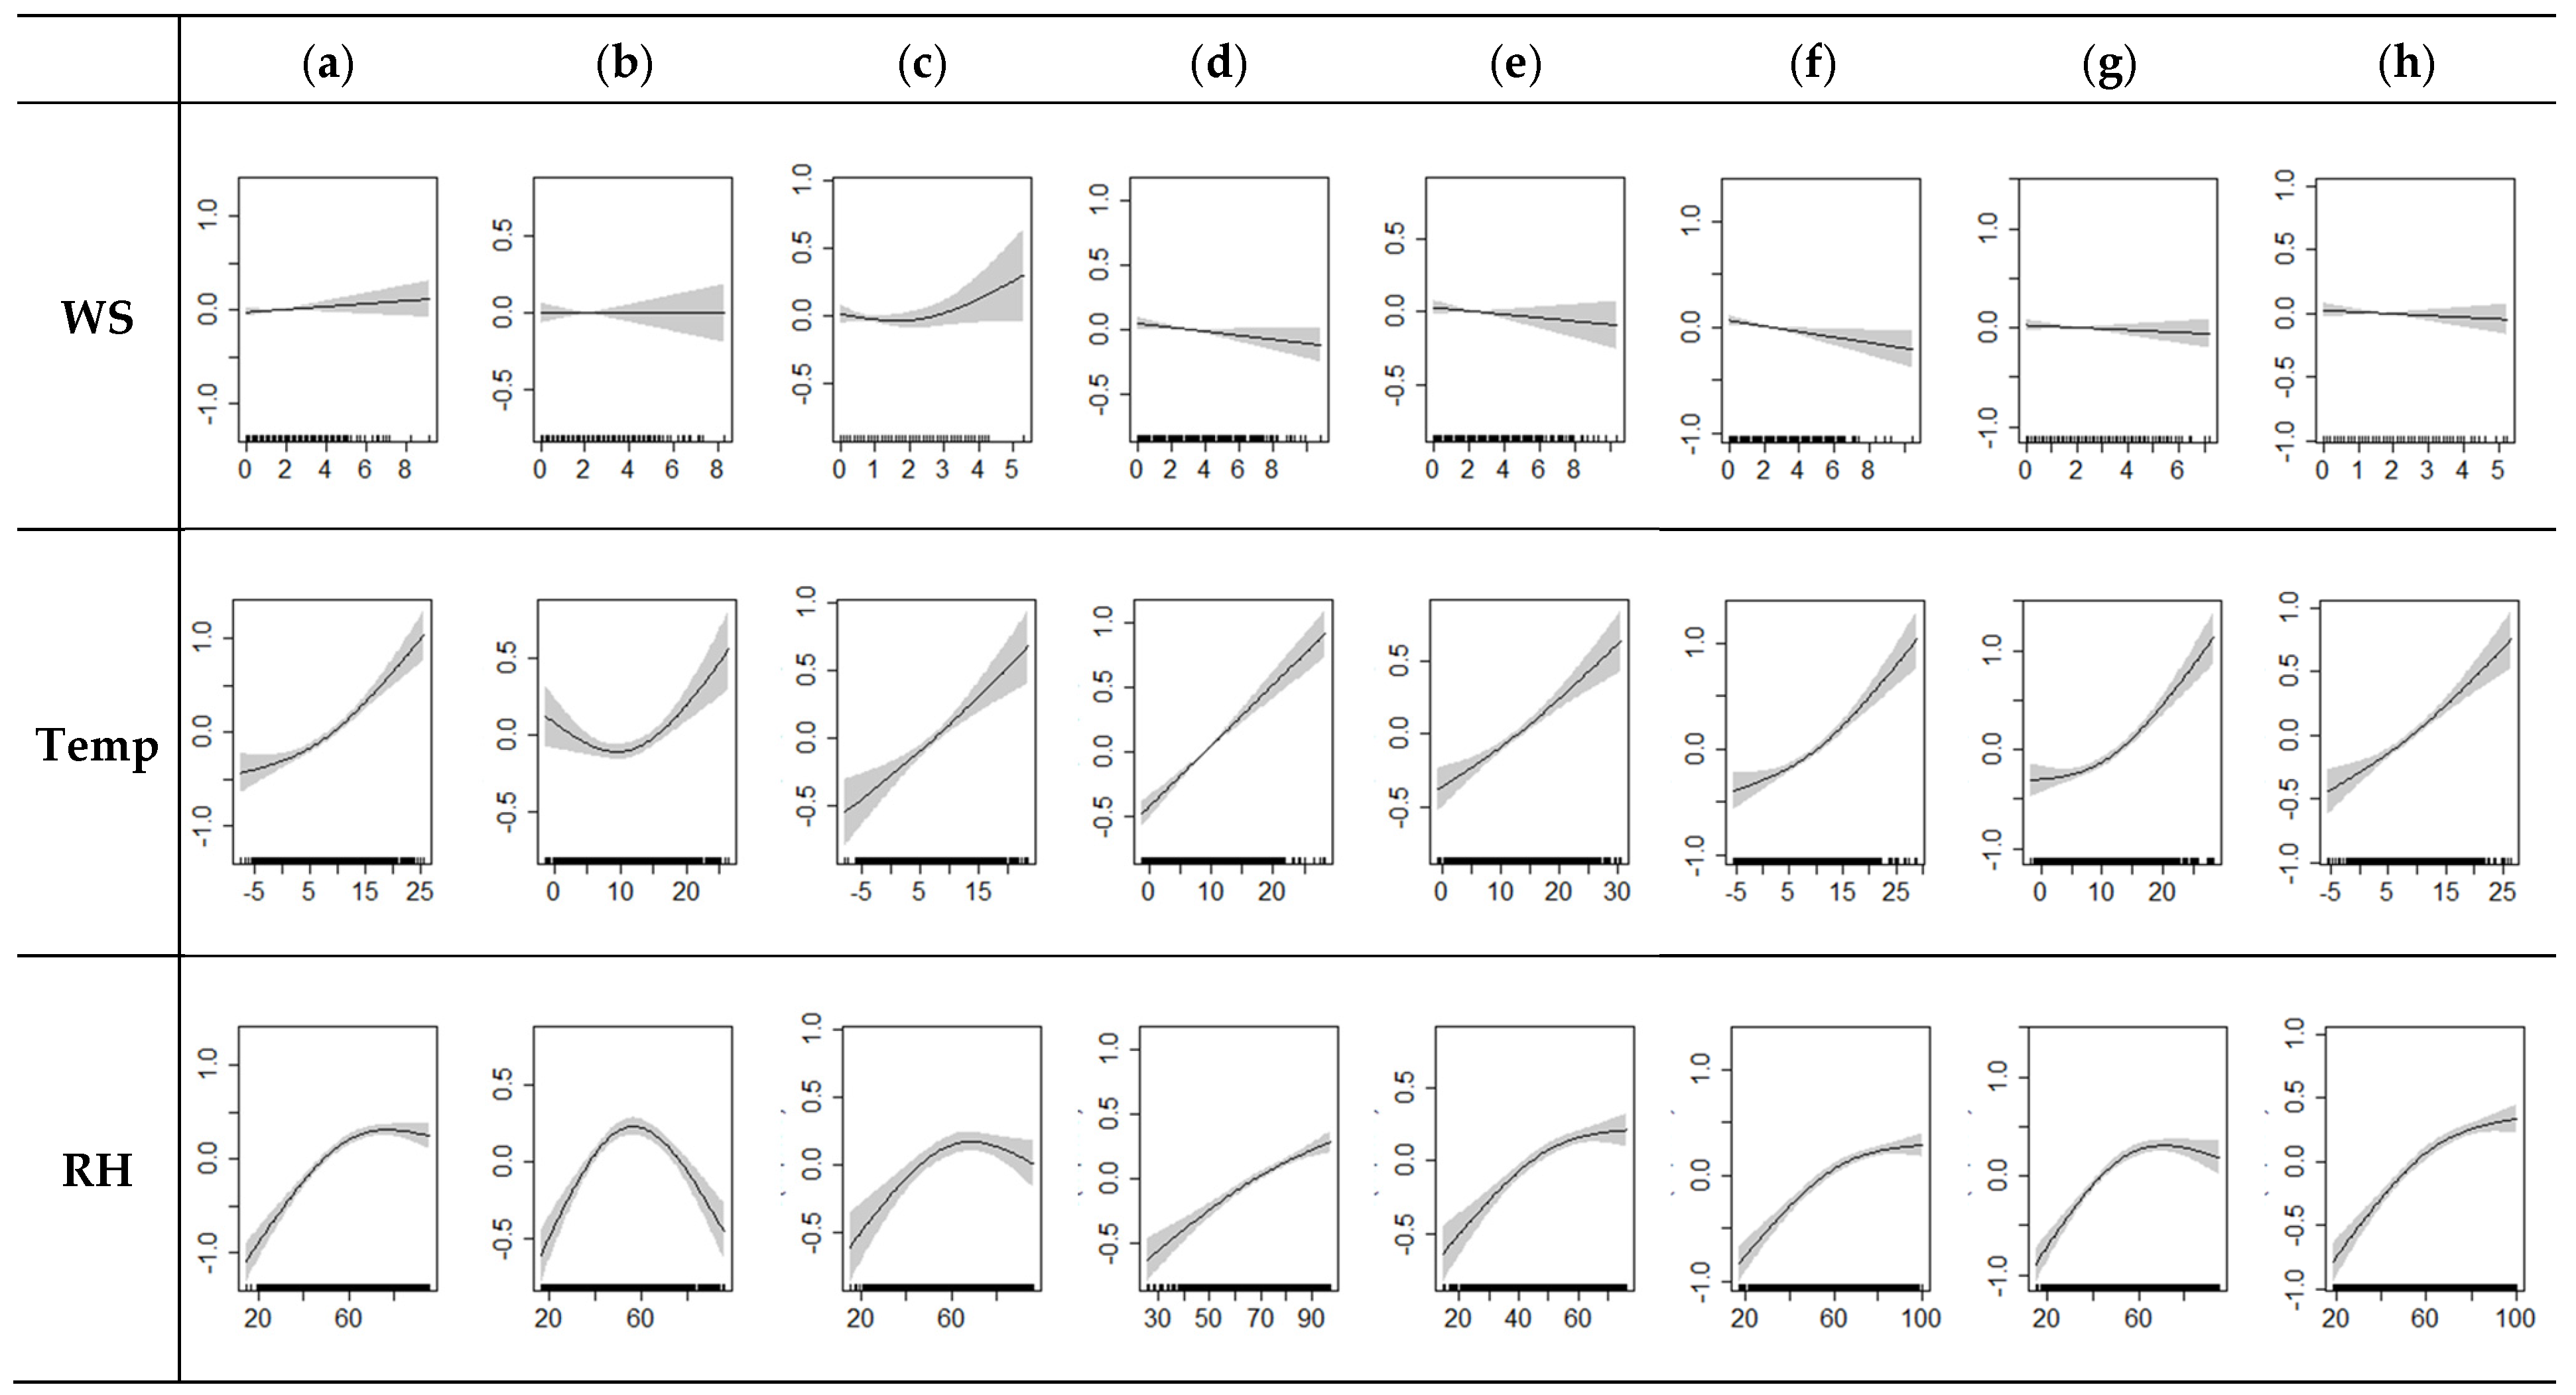
Figure 2 visualizes the intrinsic contribution, or partial effect, of each smoothing variable derived from the GAM analysis for PM-10. The x-axis represents the distribution of observed data, while the y-axis depicts the partial effect of each variable; the value 0 represents the mean, with values above 0 indicating a positive contribution greater than the average, and values below 0 indicating a negative contribution. The y-axis label indicates the corresponding smoothing variable representing the estimated partial effects for each variable. In the wind speed (WS) plots, the rate of increase in PM-10 concentrations exhibits a U-shaped or parabolic trajectory, initially decreasing and subsequently increasing. Initially, PM-10 concentrations tend to decrease below the average as wind speed increases; however, in the cases of Gimhae, Hongcheon, Naju, Sangju, and Yeoju, concentrations exhibit an upward trend as wind speeds exceed a threshold of 6–8 m/s. The partial response plots for temperature (Temp) reveal a tendency for PM-10 concentrations to increase exponentially across most regions as temperature rises. Specifically, when temperatures were below 10 °C, PM-10 concentrations were lower than the average, whereas they exceeded the average when temperatures surpassed 10 °C. Similarly, the rate of increase in PM-10 concentrations generally escalates with rising relative humidity (RH). Notably, in the Danyang, Gimhae, Hongcheon, Naju, and Sangju regions, the partial effect on PM-10 concentrations peaks at approximately 60–70% relative humidity, followed by a declining trend thereafter.

3.2.2. GAM Analysis on PM-2.5 Concentrations

The results of the GAM analysis for PM-2.5 concentrations across the entire study period are presented in Table 3. Statistically significant differences between the Pre-fire and Wildfire periods were observed in the Danyang, Gimhae, and Sangju regions. Regarding meteorological factors, consistent with the results for PM-10, the influence of ambient temperature and relative humidity was statistically significant across all regions; however, wind speed was significant only in the Nonsan region (p < 0.05).
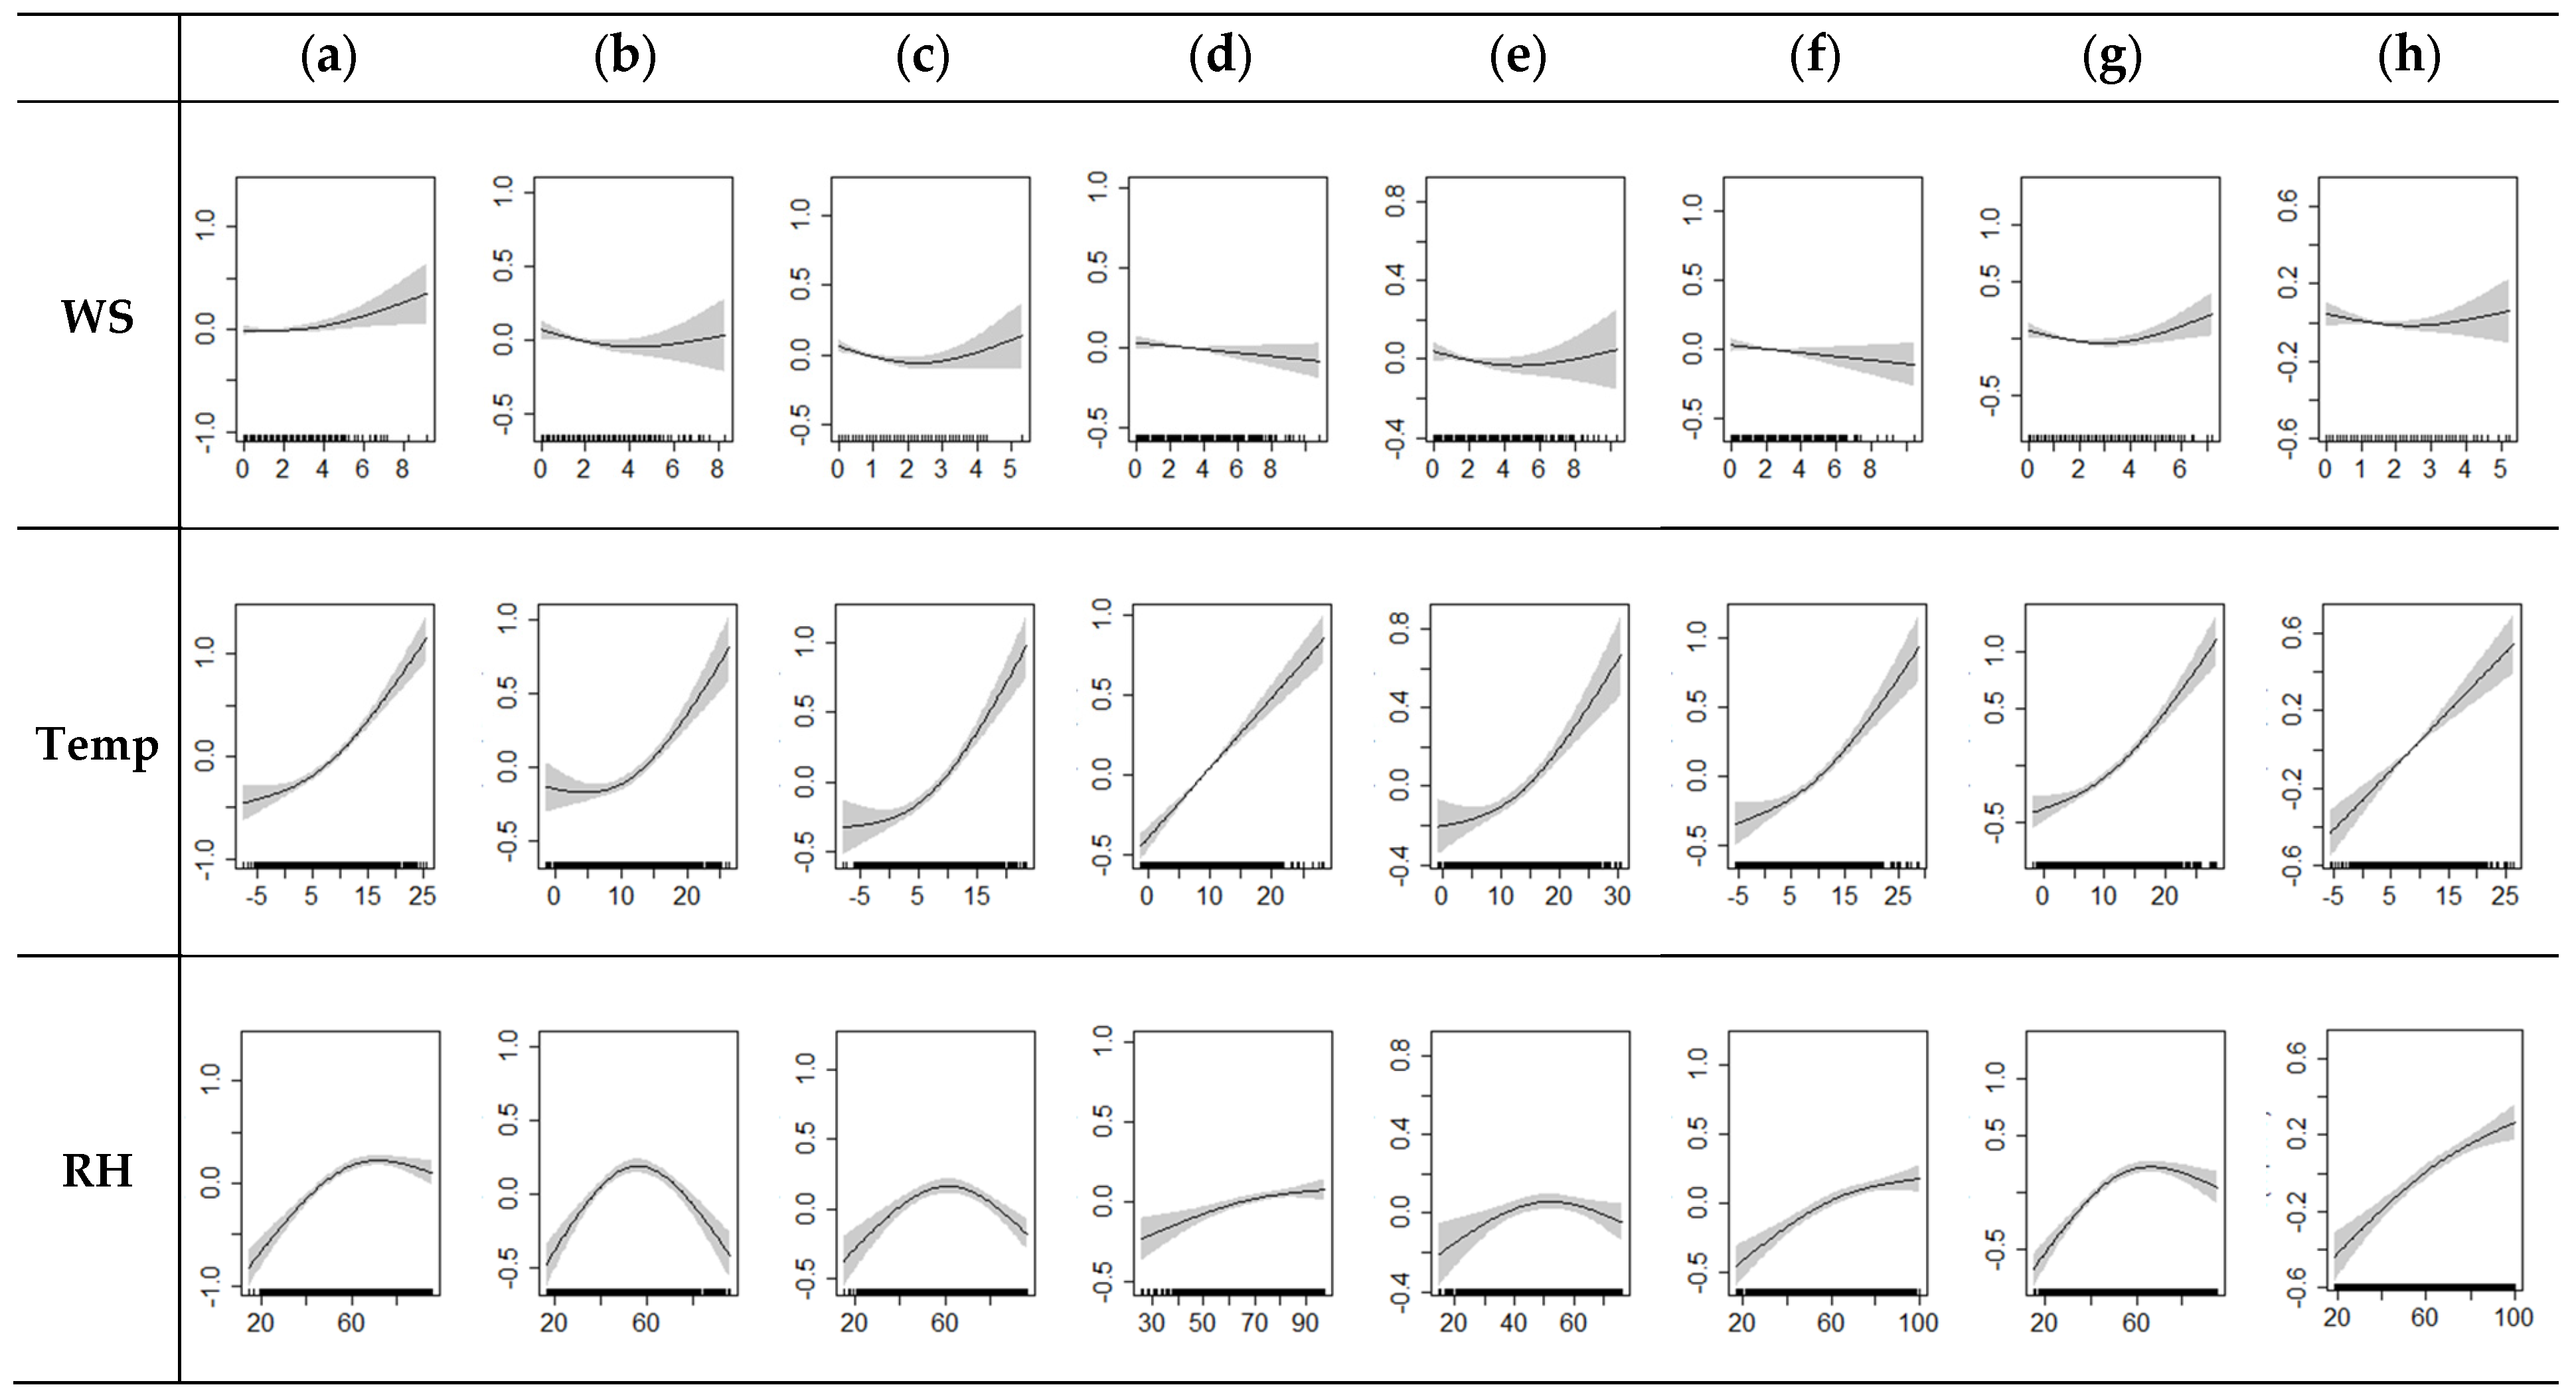
Figure 3 illustrates the partial effects of each smoothing variable on PM-2.5 concentrations. In most regions, the rate of increase in PM-2.5 concentrations tended to diminish as wind speed increased; conversely, the Hongcheon region displayed a parabolic trend similar to that observed for PM-10. Furthermore, PM-2.5 concentrations demonstrated a marked tendency to increase rapidly with rising ambient temperature and relative humidity. This suggests that temperature and relative humidity are the dominant meteorological drivers facilitating the accumulation of PM.

4. Discussion

A comparative analysis of the geometric mean concentrations of PM-10 and PM-2.5 at each monitoring station revealed a pronounced elevation during the ‘Wildfire’ period relative to the Pre-fire and Post-fire periods, a finding that corroborates the results of preceding studies [35,36,37]. Notably, the rate of increase in PM concentrations during the Wildfire period was more substantial for PM-10 than for PM-2.5. While larger particles are more susceptible to gravitational sedimentation, thereby exhibiting depositional properties and exerting localized effects, PM-2.5, characterized by its finer particle size, can be injected into the upper atmosphere at altitudes of 3–5 km by strong thermal updrafts, facilitating rapid and widespread dispersion to neighboring countries [35]. Consequently, it appears that the distinct behavioral characteristics of the two PM fractions are attributable to differences in particle size.
Both PM-10 and PM-2.5 concentrations exhibited the highest rates of increase in the Sangju region. Given that the Sangju monitoring station demonstrated significantly higher growth rates compared to other stations under similar meteorological conditions during the same timeframe, it is inferred that the specific topographic features of the region played a decisive role. Sangju is situated in a basin topography bordered by mountain ranges to the west. Such terrain facilitates the formation of katabatic winds (downslope flows) during the night, which increases atmospheric stability and suppresses the vertical dispersion of pollutants, thereby inducing a topographic trapping effect [38]. Furthermore, the Surface Inversion Layer formed by nocturnal radiative cooling likely confined pollutants near the ground surface, maximizing the cumulative effect of concentrations in a scenario where emission sources remained active [39].
Generally, PM emitted from wildfires tends to disperse and decrease concentration as the distance from the ignition point increases; thus, regions near the fire are likely to exhibit relatively higher PM concentrations due to the direct deposition of smoke and aerosols [40,41]. However, the dispersion of pollutants is governed not merely by geographical distance but significantly by the prevailing wind direction and atmospheric transport pathways at the time. Although a specific air mass trajectory analysis was not incorporated into this study, the possibility cannot be excluded that sustained winds across the study area transported pollutants in specific directions, thereby influencing regional variations in concentration. Additionally, the formation of secondary aerosols, driven by wildfire-derived precursors such as nitrogen oxides (NOx) and sulfur oxides (SOx), may have contributed to the elevated PM concentrations observed in certain regions [42].
Given that emission sources of PM in agricultural regions are more stable compared to those in urban areas, meteorological factors exert a more pronounced influence on concentration variations [43]; therefore, elucidating the relationship between meteorological variables and PM concentrations is paramount. First, regarding the relationship between PM and wind speed, concentrations tended to decrease as wind speed increased, yet exhibited a reinforced increasing trend when wind velocities exceeded 6–8 m/s. This finding aligns with prior research; while high wind speeds can reduce concentrations through dilution and dispersion, they may also induce resuspension, thereby creating an environment conducive to PM generation [44,45,46,47]. Temperature emerged as the most potent driver accelerating PM concentrations, a result consistent with previous studies [48,49,50]. Elevated temperatures facilitate the photochemical reactions of precursors, accelerating the formation of secondary aerosols, thereby likely promoting the photochemical oxidation of wildfire-derived precursors [51]. In the case of high relative humidity, it acts as a determinant raising observed concentrations by inducing the hygroscopic growth of particles, which increases their size and mass [52]. Furthermore, high relative humidity may have facilitated aqueous-phase chemical reactions, contributing to the increase in atmospheric PM concentrations [53].
In contrast to prior studies that predominantly focused on high-density urban areas [49,54,55], this research specifically targeted the variations in PM concentrations within agricultural regions. Wildfire-derived PM scatters atmospheric light, thereby attenuating direct solar radiation, which can result in a reduction in the net photosynthesis rate [56]. Moreover, high concentrations of PM deposited on crop leaf surfaces induce a shading effect that reduces light transmission [13], and physically obstruct stomata to block gas exchange, thereby significantly exacerbating physiological stress on crops [12,57]. Therefore, in the event of future large-scale wildfires, it is imperative to establish systematic response protocols based on agricultural environmental impact assessments, not only to prevent human casualties but also to minimize crop damage. Specifically, the implementation of an ‘Agriculture-Specific PM Early Warning System’ that integrates meteorological data with wildfire dispersion models is required to enable preemptive measures in agricultural regions anticipated to be exposed to high PM concentrations.
While this study relied exclusively on the analysis of PM-10 and PM-2.5 mass concentrations, concurrent chemical characterization is requisite to definitively identify wildfire-derived aerosols. Precursors primarily emitted during wildfires may have generated secondary aerosols via atmospheric photochemical reactions; however, as this study did not encompass an analysis of the chemical composition of PM, the specific impacts of emitted precursors and secondary formation pathways could not be verified. In particular, the significant concentration differential observed before and after the wildfire in the Muan region, which is geographically distinct from the ignition source, is presumed to be attributable to long-range transport and the formation of secondary aerosols during transit. However, as this research did not incorporate specific air mass trajectory analysis, there were inherent limitations in explicitly elucidating these long-range dispersion and formation mechanisms.
Furthermore, the relatively low statistical significance of wind speed or the limited explanatory power observed in the statistical models of this study suggests that relying solely on surface meteorological observation data is insufficient to fully explain wildfire smoke dispersion within complex mountainous terrain. To more precisely elucidate the dispersion dynamics of wildfire-derived air pollutants, integrated consideration of three-dimensional meteorological information—such as Upper-air meteorological data, Planetary Boundary Layer Height (PBLH), and atmospheric stability—along with vertical concentration distribution data and pollutant emission inventories is essential. Applying such multidimensional datasets to the models would enable a more profound and accurate analysis of the dispersion and deposition mechanisms of pollutants resulting from wildfires.
Additionally, while the analysis was conducted using monitoring stations located in eight agricultural regions, it is difficult to assert that these sites are fully representative of the entire agricultural landscape of South Korea. Therefore, future research necessitates the enhancement of spatial resolution through interpolation techniques for unmonitored areas near wildfire sites or through high-resolution air quality modeling. Moreover, as the analysis period of this study was limited to 30 days, with the wildfire duration spanning approximately 10 days, only short-term impacts were assessed; consequently, future studies should implement continuous monitoring to investigate long-term variations in PM concentrations following the Post-fire phase.

5. Conclusions

This study analyzed the impact of the large-scale wildfires of March 2025 on PM concentrations in major agricultural regions of South Korea using a GAM. The analytical results demonstrated a significant surge in PM-10 and PM-2.5 concentrations during the Wildfire period relative to the Pre-fire baseline. Most notably, the Sangju region recorded the highest rates of increase—74% and 46%, respectively—exacerbated by topographic trapping effects. Ambient temperature and relative humidity were identified as the primary drivers propelling the elevation in concentrations.
High concentrations of PM concentrated during the critical sowing season in March pose a detrimental threat to crop productivity. In the current era, where climate change is accelerating the frequency and scale of wildfires throughout the year, the implementation of immediate and effective policies is imperative to mitigate crop damage that threatens food security. Consequently, moving beyond mere reactive measures, we strongly advocate for the establishment of an ‘Agriculture-Specific PM Early Warning System’ that integrates meteorological data with wildfire dispersion models. Future research should aim to expand the scope of this study by integrating chemical speciation and trajectory analysis to precisely elucidate the mechanisms of secondary pollutant formation and long-range dispersion processes.

Supplementary Materials

The following supporting information can be downloaded at: https://www.mdpi.com/article/10.3390/atmos17020216/s1, Table S1: Specification of PM detector.

Author Contributions

Conceptualization, H.-J.K. and K.-Y.K.; methodology, H.-J.K.; validation, H.-J.K., K.-Y.K. and J.-H.K.; formal analysis, H.-J.K.; investigation, H.-J.K.; resources, J.-H.K.; data curation, H.-J.K.; writing—original draft preparation, H.-J.K.; writing—review and editing, K.-Y.K.; visualization, H.-J.K.; funding acquisition, J.-H.K. All authors have read and agreed to the published version of the manuscript.

Funding

This work was carried out with the support of “Cooperative Research Program for Agriculture Science & Technology Development (Project No. RS-2022-RD010348)”, Rural Development Administration, Republic of Korea. And the APC was funded by Rural Development Administration, Republic of Korea.

Institutional Review Board Statement

Not applicable.

Data Availability Statement

The original contributions presented in this study are included in the article. Further inquiries can be directed to the corresponding author.

Conflicts of Interest

The authors declare no conflicts of interest.

References

  1. Korea Forest Service. Statistical Yearbook of Forest Fire 2024; Korea Forest Service: Daejeon, Republic of Korea, 2025. (In Korean) [Google Scholar]
  2. Kim, Y.R.; Jo, J.H.; Lee, J.H.; Hwang, H.Y. Analysis of the Effect of Land use on Forest Fires: Focused on Chungbuk Province Cases. J. Korean Soc. Hazard Mitig. 2014, 14, 223–232. [Google Scholar] [CrossRef]
  3. Jolly, W.M.; Cochrane, M.A.; Freeborn, P.H.; Holden, Z.A.; Brown, T.J.; Williamson, G.J.; Bowman, D.M. Climate-induced variations in global wildfire danger from 1979 to 2013. Nat. Commun. 2015, 6, 7537. [Google Scholar] [CrossRef] [PubMed]
  4. Central Disaster and Safety Countermeasures Headquarters. Daily Situation Report No. 38 (09:00)—Public Release (15 April 2025). (In Korean). Available online: https://www.mois.go.kr/frt/bbs/type001/commonSelectBoardArticle.do;jsessionid=mltqibXWUxKYgr1uKcRTkKWb.node40?bbsId=BBSMSTR_000000000336&nttId=117106 (accessed on 30 September 2025).
  5. Andreae, M.O.; Merlet, P. Emission of trace gases and aerosols from biomass burning. Glob. Biogeochem. Cycles 2001, 15, 955–966. [Google Scholar] [CrossRef]
  6. Aguilera, R.; Corringham, T.; Gershunov, A.; Benmarhnia, T. Wildfire smoke impacts respiratory health more than fine particles from other sources: Observational evidence from Southern California. Nat. Commun. 2021, 12, 1493. [Google Scholar] [CrossRef] [PubMed]
  7. Rizly, S. Epidemiological and Clinical Evidence on the Association Between Wildfire PM2.5 and Pulmonary Health Outcomes. Cureus 2025, 17, e91239. [Google Scholar] [CrossRef]
  8. Wegesser, T.C.; Pinkerton, K.E.; Last, J.A. California wildfires of 2008: Coarse and fine particulate matter toxicity. Environ. Health Perspect. 2009, 117, 893. [Google Scholar] [CrossRef]
  9. Han, D.; Guo, Y.; Wang, J.; Zhao, B. Global disparities in indoor wildfire-PM2.5 exposure and mitigation costs. Sci. Adv. 2025, 11, eads4360. [Google Scholar] [CrossRef]
  10. National Institute of Environmental Research (NIER). Disclosure of Satellite Images of Large-Scale Wildfires on the East Coast Observed by Cheollian Environmental Satellite. Available online: https://nesc.nier.go.kr/ko/html/board/gallery/22/select.do?pagingYn=Y&showUpendEprss=Y&keyword=%EC%82%B0%EB%B6%88&pageIndex=1&pageUnit=12&bbsManageInnb=22&bbsCtgryInnb=214&bbsInnb=344 (accessed on 27 January 2026).
  11. National Institute of Environmental Research (NIER). Analysis Results of Satellite Observations on Simultaneous Wildfires in the Yeongnam Region. Available online: https://nesc.nier.go.kr/ko/html/board/bbs/23/select.do?&bbsInnb=480 (accessed on 27 January 2026).
  12. Hirano, T.; Kiyota, M.; Aiga, I. Physical effects of dust on leaf physiology of cucumber and kidney bean plants. Environ. Pollut. 1995, 89, 255–261. [Google Scholar] [CrossRef]
  13. Alipoor, S.; Soltani, E. A Comparative Analysis of Forage Production in Dust-Stressed Amaranthaceae Halophytes. Int. J. Plant Prod. 2025, 19, 605–617. [Google Scholar] [CrossRef]
  14. Mohapatra, K.; Biswal, S. Effect of particulate matter (PM) on plants, climate, ecosystem and human health. Int. J. Adv. Technol. Eng. Sci. 2014, 2, 118–129. [Google Scholar]
  15. Emberson, L.; Ashmore, M.; Murray, F.; Kuylenstierna, J.; Percy, K.; Izuta, T.; Zheng, Y.; Shimizu, H.; Sheu, B.; Liu, C. Impacts of air pollutants on vegetation in developing countries. Water Air Soil Pollut. 2001, 130, 107–118. [Google Scholar] [CrossRef]
  16. Yadav, P.; Dhupper, R.; Singh, S.; Singh, B. Crop adaptation to air pollution I. Effect of particulate and SO. Indian J. Agric. Res 2019, 53, 303–308. [Google Scholar]
  17. Zhou, L.; Chen, X.; Tian, X. The impact of fine particulate matter (PM2.5) on China’s agricultural production from 2001 to 2010. J. Clean. Prod. 2018, 178, 133–141. [Google Scholar] [CrossRef]
  18. İban, M.C.; Şahin, E. Monitoring burn severity and air pollutants in wildfire events using remote sensing data: The case of Mersin wildfires in summer 2021. Gümüşhane Üniversitesi Fen Bilim. Derg. 2022, 12, 487–497. [Google Scholar] [CrossRef]
  19. Hashim, M.; Kanniah, K.D.; Ahmad, A.; Rasib, A.W. Remote sensing of tropospheric pollutants originating from 1997 forest fire in Southeast Asia. Asian J. Geoinform. 2004, 4, 57–68. [Google Scholar]
  20. Paugam, R.; Wooster, M.; Freitas, S.; Val Martin, M. A review of approaches to estimate wildfire plume injection height within large-scale atmospheric chemical transport models. Atmos. Chem. Phys. 2016, 16, 907–925. [Google Scholar] [CrossRef]
  21. Indrawati, A.; Andarini, D.; Cholianawati, N. Analysis PM10 and Visibility During Forest Fire in Palangka Raya. In Proceedings of the IOP Conference Series: Earth and Environmental Science, Jakarta, Indonesia, 23–25 March 2021; p. 012002. [Google Scholar]
  22. Tang, W.; Wiedinmyer, C.; Emmons, L.K.; Holder, A.L.; Uhl, J.H.; St. Denis, L.A.; Cook, M.; Abolafia-Rosenzweig, R.; He, C.; Barsanti, K.C. Emissions from burned structures in wildfires as significant yet unaccounted sources of US air pollution. Nat. Commun. 2025, 16, 11443. [Google Scholar] [CrossRef]
  23. Childs, M.L.; Li, J.; Wen, J.; Heft-Neal, S.; Driscoll, A.; Wang, S.; Gould, C.F.; Qiu, M.; Burney, J.; Burke, M. Daily local-level estimates of ambient wildfire smoke PM2. 5 for the contiguous US. Environ. Sci. Technol. 2022, 56, 13607–13621. [Google Scholar] [CrossRef]
  24. Korea Forest Service. Real-time Wildfire Information. Available online: https://fd.forest.go.kr/ffas/pubConn/movePage/sub1.do (accessed on 30 September 2025).
  25. Korea Forest Service. Operation of the Spring Wildfire Caution Period for 2022 (1 February–15 May). Available online: https://www.forest.go.kr/kfsweb/cop/bbs/selectBoardArticle.do;jsessionid=mlWuawbT8Qx1Bz175y83EzZuCFNfqD6KQtVakMThuuzcnuGqJkRLl2qN02L4K4ks.frswas02_servlet_engine5?nttId=3157772&bbsId=BBSMSTR_1036&pageUnit=10&pageIndex=7&searchtitle=title&searchcont=&searchkey=&searchwriter=&searchWrd=&ctgryLrcls=&ctgryMdcls=&ctgrySmcls=&ntcStartDt=&ntcEndDt=&mn=NKFS_04_02_01&orgId= (accessed on 28 January 2026).
  26. NASA Earth Observatory. Outbreak of Fire Across South Korea. Available online: https://science.nasa.gov/earth/earth-observatory/outbreak-of-fire-across-south-korea-154083/ (accessed on 12 September 2025).
  27. National Institute of Environmental Research (NIER). Air Pollution Standard Test Method—ES 01605.1b: Suspended Particulate Matter PM-10 in Ambient Air—Beta-Ray Absorption Method. Available online: https://www.law.go.kr/%ED%96%89%EC%A0%95%EA%B7%9C%EC%B9%99/%EB%8C%80%EA%B8%B0%EC%98%A4%EC%97%BC%EA%B3%B5%EC%A0%95%EC%8B%9C%ED%97%98%EA%B8%B0%EC%A4%80 (accessed on 5 January 2026).
  28. National Institute of Environmental Research (NIER). Air Pollution Standard Test Method—ES 01606.2b: Particulate Matter Less than 2.5µm in Ambient Air—Beta-Ray Absorption Method. Available online: https://www.law.go.kr/%ED%96%89%EC%A0%95%EA%B7%9C%EC%B9%99/%EB%8C%80%EA%B8%B0%EC%98%A4%EC%97%BC%EA%B3%B5%EC%A0%95%EC%8B%9C%ED%97%98%EA%B8%B0%EC%A4%80 (accessed on 5 January 2026).
  29. Korea Meteorological Administration. Automatic Weather Station (AWS) Data. Available online: https://data.kma.go.kr/data/grnd/selectAwsRltmList.do?pgmNo=56 (accessed on 30 September 2025).
  30. Korea Meteorological Administration. Automated Synoptic Observing System (ASOS) Data. Available online: https://data.kma.go.kr/data/grnd/selectAsosRltmList.do?pgmNo=36 (accessed on 30 September 2025).
  31. Wood, S.N. Generalized additive models. Annu. Rev. Stat. Its Appl. 2025, 12, 497–526. [Google Scholar] [CrossRef]
  32. Westervelt, D.; Horowitz, L.; Naik, V.; Tai, A.; Fiore, A.; Mauzerall, D.L. Quantifying PM2.5-meteorology sensitivities in a global climate model. Atmos. Environ. 2016, 142, 43–56. [Google Scholar] [CrossRef]
  33. Dominici, F.; McDermott, A.; Zeger, S.L.; Samet, J.M. On the use of generalized additive models in time-series studies of air pollution and health. Am. J. Epidemiol. 2002, 156, 193–203. [Google Scholar] [CrossRef] [PubMed]
  34. Wood, S.N. Generalized Additive Models: An Introduction with R, 2nd ed.; Chapman and Hall/CRC: Boca Raton, FL, USA, 2017. [Google Scholar]
  35. Hodzic, A.; Madronich, S.; Bohn, B.; Massie, S.; Menut, L.; Wiedinmyer, C. Wildfire particulate matter in Europe during summer 2003: Meso-scale modeling of smoke emissions, transport and radiative effects. Atmos. Chem. Phys. 2007, 7, 4043–4064. [Google Scholar] [CrossRef]
  36. Schlosser, J.S.; Braun, R.A.; Bradley, T.; Dadashazar, H.; MacDonald, A.B.; Aldhaif, A.A.; Aghdam, M.A.; Mardi, A.H.; Xian, P.; Sorooshian, A. Analysis of aerosol composition data for western United States wildfires between 2005 and 2015: Dust emissions, chloride depletion, and most enhanced aerosol constituents. J. Geophys. Res. Atmos. 2017, 122, 8951–8966. [Google Scholar] [CrossRef] [PubMed]
  37. Castagna, J.; Senatore, A.; Bencardino, M.; Mendicino, G. Concurrent influence of different natural sources on the particulate matter in the central mediterranean region during a wildfire season. Atmosphere 2021, 12, 144. [Google Scholar] [CrossRef]
  38. Filonchyk, M.; Yan, H. The characteristics of air pollutants during different seasons in the urban area of Lanzhou, Northwest China. Environ. Earth Sci. 2018, 77, 763. [Google Scholar] [CrossRef]
  39. Largeron, Y.; Staquet, C. Persistent inversion dynamics and wintertime PM10 air pollution in Alpine valleys. Atmos. Environ. 2016, 135, 92–108. [Google Scholar] [CrossRef]
  40. Ning, J.; Di, X.; Yu, H.; Yuan, S.; Yang, G. Spatial distribution of particulate matter 2.5 released from surface fuel combustion of Pinus koraiensis–A laboratory simulation study. Environ. Pollut. 2021, 287, 117282. [Google Scholar] [CrossRef]
  41. Khadgi, J.; Kafle, K.; Thapa, G.; Khaitu, S.; Sarangi, C.; Cohen, D.; Kafle, H. Concentration of particulate matter and atmospheric pollutants in the residential area of Kathmandu Valley: A case study of March–April 2021 forest fire events. Environ. Pollut. 2024, 363, 125280. [Google Scholar] [CrossRef]
  42. Tian, M.; Wang, H.; Chen, Y.; Yang, F.; Zhang, X.; Zou, Q.; Zhang, R.; Ma, Y.; He, K. Characteristics of aerosol pollution during heavy haze events in Suzhou, China. Atmos. Chem. Phys. 2016, 16, 7357–7371. [Google Scholar] [CrossRef]
  43. Zender-Świercz, E.; Galiszewska, B.; Telejko, M.; Starzomska, M. The effect of temperature and humidity of air on the concentration of particulate matter-PM2.5 and PM10. Atmos. Res. 2024, 312, 107733. [Google Scholar] [CrossRef]
  44. Linda, J.; Hasečić, A.; Pospíšil, J.; Kudela, L.; Brzezina, J. Impact of wind-induced resuspension on urban air quality: A CFD study with air quality data comparison. NPJ Clim. Atmos. Sci. 2025, 8, 74. [Google Scholar] [CrossRef]
  45. Liu, Z.; Shen, L.; Yan, C.; Du, J.; Li, Y.; Zhao, H. Analysis of the Influence of Precipitation and Wind on PM2. 5 and PM10 in the Atmosphere. Adv. Meteorol. 2020, 2020, 5039613. [Google Scholar] [CrossRef]
  46. Wang, Z.; Shi, X.; Ma, Y.; Wei, X. Variation Characteristics of Mass Concentration of Inhalable Particles in Qingdao, China. J. Geosci. Environ. Prot. 2020, 8, 192–201. [Google Scholar] [CrossRef]
  47. Lv, M.; Li, Z.; Jiang, Q.; Chen, T.; Wang, Y.; Hu, A.; Cribb, M.; Cai, A. Contrasting trends of surface PM2.5, O3, and NO2 and their relationships with meteorological parameters in typical coastal and inland cities in the Yangtze River Delta. Int. J. Environ. Res. Public Health 2021, 18, 12471. [Google Scholar] [CrossRef] [PubMed]
  48. Asimakopoulos, D.; Flocas, H.; Maggos, T.; Vasilakos, C. The role of meteorology on different sized aerosol fractions (PM10, PM2.5, PM2.5–10). Sci. Total Environ. 2012, 419, 124–135. [Google Scholar]
  49. Kim, M.J. Changes in the relationship between particulate matter and surface temperature in Seoul from 2002–2017. Atmosphere 2019, 10, 238. [Google Scholar] [CrossRef]
  50. Pirsaheb, M.; Bakhshi, S.; Almasi, A.; Mousavi, S.; Rezaei, M.; Sharafi, H.; Saleh, E. Evaluating the effect of meteorological parameters (humidity, temperature, wind speed and pressure) on the dust phenomenon-Case study: Kermanshah, Iran (2008–2012). Int. J. Pharm. Technol. 2016, 8, 17847–17855. [Google Scholar]
  51. Dawson, J.; Adams, P.; Pandis, S. Sensitivity of PM 2.5 to climate in the Eastern US: A modeling case study. Atmos. Chem. Phys. 2007, 7, 4295–4309. [Google Scholar] [CrossRef]
  52. Seinfeld, J.H.; Pandis, S.N. Atmospheric Chemistry and Physics: From Air Pollution to Climate Change; John Wiley & Sons: Hoboken, NJ, USA, 2016. [Google Scholar]
  53. Sun, Y.; Chen, C.; Zhang, Y.; Xu, W.; Zhou, L.; Cheng, X.; Zheng, H.; Ji, D.; Li, J.; Tang, X. Rapid formation and evolution of an extreme haze episode in Northern China during winter 2015. Sci. Sci. Rep. 2016, 6, 27151. [Google Scholar] [CrossRef]
  54. Phuleria, H.C.; Fine, P.M.; Zhu, Y.; Sioutas, C. Air quality impacts of the October 2003 Southern California wildfires. J. Geophys. Res. Atmos. 2005, 110. [Google Scholar] [CrossRef]
  55. Li, H.; Zhang, Q.; Zheng, B.; Chen, C.; Wu, N.; Guo, H.; Zhang, Y.; Zheng, Y.; Li, X.; He, K. Nitrate-driven urban haze pollution during summertime over the North China Plain. Atmos. Chem. Phys. 2018, 18, 5293–5306. [Google Scholar] [CrossRef]
  56. Chameides, W.L.; Yu, H.; Liu, S.; Bergin, M.; Zhou, X.; Mearns, L.; Wang, G.; Kiang, C.; Saylor, R.; Luo, C. Case study of the effects of atmospheric aerosols and regional haze on agriculture: An opportunity to enhance crop yields in China through emission controls? Proc. Natl. Acad. Sci. USA 1999, 96, 13626–13633. [Google Scholar] [CrossRef]
  57. Rai, P.K. Impacts of particulate matter pollution on plants: Implications for environmental biomonitoring. Ecotoxicol. Environ. Saf. 2016, 129, 120–136. [Google Scholar] [CrossRef]
Figure 1. Geographical distribution of wildfire ignition points and agricultural monitoring stations in South Korea. The satellite imagery captures smoke plumes spreading across the southeastern region on 22 March 2025. red triangles denote the wildfire ignition points (Sancheong, Uisung, and Ulju). Agricultural monitoring stations are categorized by land use type: green diamonds represent paddy field stations (Gimhae, Naju, Nonsan, Yeoju), while yellow circles represent upland field stations (Danyang, Hongcheon, Muan, Sangju). (Base map source: NASA Earth Observatory [26]).
Atmosphere 17 00216 g001
Figure 2. Partial effect plots of meteorological factors on PM-10 concentrations using Generalized Additive Models (GAM). The columns correspond to the eight monitoring stations: (a) Danyang, (b) Gimhae, (c) Hongcheon, (d) Muan, (e) Naju, (f) Nonsan, (g) Sangju, and (h) Yeoju. The rows display the partial effects of the explanatory variables: wind speed (WS), temperature (Temp), and relative humidity (RH). The tick marks on the x-axis represent observed data points (rug plot). The y-axis indicates the partial effect of each variable. The solid black lines depict the estimated smooth functions, and the grey shaded areas represent the 95% confidence intervals.
Atmosphere 17 00216 g002
Figure 3. Partial effect plots of meteorological factors on PM-2.5 concentrations using Generalized Additive Models (GAM). The columns correspond to the eight monitoring stations: (a) Danyang, (b) Gimhae, (c) Hongcheon, (d) Muan, (e) Naju, (f) Nonsan, (g) Sangju, and (h) Yeoju. The rows display the partial effects of the explanatory variables: wind speed (WS), temperature (Temp), and relative humidity (RH). The tick marks on the x-axis represent observed data points (rug plot). The y-axis indicates the partial effect of each variable. The solid black lines depict the estimated smooth functions, and the grey shaded areas represent the 95% confidence intervals.
Atmosphere 17 00216 g003
Table 1. ANOVA Test and Tukey HSD Post hoc Test Results for PM-10 and PM-2.5 Concentrations by Monitoring Station.
Monitoring StationPeriodPM-10PM-2.5
NGM (GSD)
[μg/m3]
FpNGM (GSD)
[μg/m3]
Fp
DanyangPre-fire25630.74 (1.77) a70.30<0.00125116.90 (1.87) a25.92<0.001
Wildfire21453.39 (1.91) b21424.33 (2.01) b
Post-fire25033.83 (1.46) a24918.25 (1.48) a
GimhaePre-fire25627.59 (1.68) a29.81<0.00125115.66 (1.88) a6.960.001
Wildfire21337.36 (2.05) b21318.61 (2.22) b
Post-fire24925.17 (1.70) a19415.93 (1.47) a
HongcheonPre-fire25624.57 (1.63) a68.46<0.00124115.03 (1.75) a22.89<0.001
Wildfire21440.56 (2.09) b21319.62 (2.08) b
Post-fire25022.72 (1.72) a23813.58 (1.81) a
MuanPre-fire25641.63 (1.42) a33.04<0.00125620.38 (1.48) a7.340.001
Wildfire21451.97 (1.86) b21422.78 (2.19) b
Post-fire25037.29 (1.42) c25019.07 (1.49) a
NajuPre-fire25631.51 (1.54) a44.87<0.00125319.54 (1.65) a11.34<0.001
Wildfire21445.56 (1.85) b21223.63 (2.07) b
Post-fire24431.92 (1.44) a24419.02 (1.50) a
NonsanPre-fire25635.08 (1.66) a35.07<0.00125220.03 (1.74) a10.53<0.001
Wildfire21448.57 (1.82) b21424.02 (1.93) b
Post-fire25034.53 (1.45) a25019.40 (1.55) a
SangjuPre-fire25631.36 (1.67) a82.33<0.00125318.84 (1.85) a32.38<0.001
Wildfire21454.62 (2.15) b21427.43 (2.32) b
Post-fire25030.05 (1.42) a24717.98 (1.45) a
YeojuPre-fire25658.33 (1.63) a26.73<0.00125524.05 (1.85) a4.870.008
Wildfire21476.25 (1.67) b21427.37 (1.91) b
Post-fire25057.85 (1.45) a25023.57 (1.56) a
Note: Means sharing the same superscript letter (a, b, c) are not significantly different (p > 0.05) according to Tukey’s HSD test.
Table 2. GAM Analysis Results for PM-10 Concentrations by Monitoring Station.
Monitoring StationCategoricalSmooth FunctionalAdj-R2
VariableEstimateS.E.p-ValueVariableedfFp-Value
DanyangPre-fire(reference)WS1.6921.5870.1170.369
Wildfire0.3480.056<0.001Temp1.93662.780<0.001
Post-fire−0.0180.0520.727RH1.97746.816<0.001
GimhaePre-fire(reference)WS1.6122.9540.1670.268
Wildfire0.2240.0650.001Temp1.93925.422<0.001
Post-fire−0.1680.0590.005RH1.98434.038<0.001
HongcheonPre-fire(reference)WS1.8465.2450.0310.334
Wildfire0.2470.059<0.001Temp1.94038.847<0.001
Post-fire−0.2010.056<0.001RH1.97318.779<0.001
MuanPre-fire(reference)WS1.0002.3350.1270.281
Wildfire0.0480.0470.304Temp1.000121.916<0.001
Post-fire−0.2290.045<0.001RH1.6469.6940.003
NajuPre-fire(reference)WS1.6292.0910.2690.221
Wildfire0.2540.051<0.001Temp1.88023.672<0.001
Post-fire−0.0420.0490.384RH1.8925.1150.020
NonsanPre-fire(reference)WS1.0001.8890.1700.208
Wildfire0.1680.0520.001Temp1.88133.162<0.001
Post-fire−0.1300.0500.010RH1.86124.881<0.001
SangjuPre-fire(reference)WS1.8934.7200.0190.373
Wildfire0.3610.055<0.001Temp1.92363.668<0.001
Post-fire−0.1490.0520.005RH1.97846.882<0.001
YeojuPre-fire(reference)WS1.6321.4460.3510.203
Wildfire0.1730.0540.001Temp1.00049.513<0.001
Post-fire−0.1250.0520.017RH1.75034.508<0.001
Note: The categorical variable ‘period’ stratifies the timeline into ‘Pre-fire’, ‘Wildfire’, and ‘Post-fire’, with ‘Pre-fire’ designated as the reference group. Smoothing variables comprise wind speed (WS), temperature (Temp), and relative humidity (RH). Abbreviations are defined as follows: S.E. = Standard Error; edf = Effective Degrees of Freedom; Adj-R2 = Adjusted R2. A higher Adj-R2 value signifies a greater explanatory power of the model for the observed phenomenon.
Table 3. GAM Analysis Results for PM-2.5 Concentrations by Monitoring Station.
Monitoring StationCategoricalSmooth FunctionalAdj-R2
VariableEstimateS.E.p-ValueVariableedfFp-Value
DanyangPre-fire(reference)WS1.0001.3440.2470.254
Wildfire0.2560.066<0.001Temp1.88838.067<0.001
Post-fire−0.0120.0620.852RH1.97662.061<0.001
GimhaePre-fire(reference)WS1.0000.0000.9830.189
Wildfire0.2110.0760.006Temp1.9337.505<0.001
Post-fire−0.0140.0740.850RH1.98535.431<0.001
HongcheonPre-fire(reference)WS1.7331.3100.2190.197
Wildfire0.0930.0890.296Temp1.29120.840<0.001
Post-fire−0.2120.0860.014RH1.94513.976<0.001
MuanPre-fire(reference)WS1.0003.2820.0700.207
Wildfire−0.0800.0560.157Temp1.00095.860<0.001
Post-fire−0.2550.054<0.001RH1.69452.212<0.001
NajuPre-fire(reference)WS1.0001.2540.2630.132
Wildfire0.0320.0620.606Temp1.44931.008<0.001
Post-fire−0.1360.0580.020RH1.91228.599<0.001
NonsanPre-fire(reference)WS1.0005.6450.0180.210
Wildfire0.0080.0580.891Temp1.87134.080<0.001
Post-fire−0.1720.0560.002RH1.95559.407<0.001
SangjuPre-fire(reference)WS1.0000.6930.4060.262
Wildfire0.2640.066<0.001Temp1.93639.361<0.001
Post-fire−0.1200.0630.057RH1.97657.753<0.001
YeojuPre-fire(reference)WS1.0000.6300.4280.217
Wildfire0.0390.0600.514Temp1.60535.190<0.001
Post-fire−0.1470.0580.011RH1.94863.774<0.001
Note: The categorical variable ‘period’ stratifies the timeline into ‘Pre-fire’, ‘Wildfire’, and ‘Post-fire’, with ‘Pre-fire’ designated as the reference group. Smoothing variables comprise wind speed (WS), temperature (Temp), and relative humidity (RH). Abbreviations are defined as follows: S.E. = Standard Error; edf = Effective Degrees of Freedom; Adj-R2 = Adjusted R2. A higher Adj-R2 value signifies a greater explanatory power of the model for the observed phenomenon.
Disclaimer/Publisher’s Note: The statements, opinions and data contained in all publications are solely those of the individual author(s) and contributor(s) and not of MDPI and/or the editor(s). MDPI and/or the editor(s) disclaim responsibility for any injury to people or property resulting from any ideas, methods, instructions or products referred to in the content.