1. Introduction
Tropical cyclones (TCs) are among the most devastating natural hazards globally, often producing large fatalities, widespread infrastructure damage, and long-term socioeconomic disruption in coastal regions. These impacts are especially pronounced in the tropical Americas and along the U.S. Gulf Coast, where high population density, rapid coastal development, and limited evacuation flexibility heighten vulnerability to extreme storm events [
1,
2]. It is worth noting that for regions like the Gulf of Mexico, rainfall often presents a greater hazard than wind speed alone, although this study focuses primarily on storm frequency and intensity counts. As coastal populations expand and anthropogenic climate change intensifies the thermodynamic environment, TCs are projected to become stronger, wetter, and potentially more destructive [
3,
4,
5]. These trends underscore the increasing need for reliable seasonal hurricane outlooks, which serve as foundational information for preparedness planning, emergency management, insurance and reinsurance decisions, and resource allocation across government and private sectors.
Seasonal TC activity is strongly modulated by large-scale climate variability, and decades of research have established robust relationships between storm frequency and indicators such as the El Niño–Southern Oscillation (ENSO), Atlantic sea-surface temperature (SST) anomalies, vertical wind shear, tropospheric humidity, and the meridional overturning circulation [
6,
7,
8]. ENSO in particular is among the most influential predictors: El Niño events suppress Atlantic TCs through enhanced vertical wind shear and subsidence, whereas La Niña events tend to enhance development by reducing shear and moistening the MDR [
9,
10]. Atlantic multidecadal variability, such as the Atlantic Multidecadal Oscillation (AMO), also contributes substantially to long-term TC modulation through changes in SSTs, thermodynamic structure, and Sahel rainfall [
11,
12]. These well-documented climate–TC linkages have motivated the widespread use of statistical forecasting systems grounded in large-scale climate indices.
Pre-season TC forecasts by NOAA, CSU, and other research groups typically rely on linear or generalized linear regression models using indicators such as MDR SST anomalies, ENSO indices, vertical wind shear, sea-level pressure anomalies, and SST gradient patterns [
13,
14,
15,
16]. These approaches benefit from transparency, physical interpretability, and computational simplicity, and have demonstrated considerable skill relative to climatology. More recent statistical advances, including Lasso regularization, ridge regression, and systematic predictor screening, have further improved preseason forecast performance [
17,
18]. Nonetheless, the overwhelming majority of these methods focus on basin-wide activity.
Despite substantial progress, key gaps remain in our understanding and prediction of regional TC activity. The Gulf of Mexico, Caribbean Sea, and wider Atlantic basin each respond differently to ENSO, the Atlantic Meridional Mode (AMM), the AMO, and MDR thermodynamics [
19,
20]. These three regions were selected for analysis because they represent distinct dynamical regimes with different sensitivities to large-scale climate forcing, and they collectively account for the majority of TC impacts on North American coastal populations. For instance, Caribbean TC activity is especially sensitive to ENSO-induced vertical wind shear, whereas Gulf hurricanes are more strongly influenced by local SST anomalies, the Loop Current, and mesoscale oceanic features [
21,
22]. These spatial variations imply that basin-wide predictors do not necessarily translate into accurate regional forecasts. Only a limited number of studies have attempted regional or landfall-focused predictions using logistic regression or analog methods [
23,
24], and these typically employ small predictor sets and inconsistent validation frameworks.
A second major gap concerns prediction across different intensity thresholds. Although tropical storms, hurricanes, and major hurricanes share some common environmental drivers, the development of major hurricanes is especially sensitive to thermodynamic structure, potential intensity, inner-core processes, and favorable upper-ocean conditions [
25,
26]. Few seasonal forecast systems evaluate skill simultaneously across intensity categories, limiting our understanding of why prediction skill varies with storm strength and what role climate predictors play in modulating major hurricane counts.
The rise of machine-learning (ML) methods has introduced new opportunities for capturing nonlinear climate–TC relationships that traditional linear models cannot resolve. Neural networks, random forests, gradient-boosted trees, and analog-style k-nearest neighbors have all been applied in preliminary or experimental forms to seasonal TC prediction [
27,
28,
29]. These techniques, in principle, allow for more flexible modeling of predictor interactions, such as combined ENSO–SST–shear influences or compound thermodynamic effects. While traditional statistical regression by region remains viable, machine-learning methods offer the potential to capture nonlinear climate-TC relationships and complex predictor interactions that linear models cannot resolve, particularly when multiple climate modes interact simultaneously. Yet existing ML studies vary widely in predictor selection, typically test only one algorithm, and rarely employ operationally realistic cross-validation designs. Reported skill is often comparable to or marginally better than traditional regression models, but the lack of standardized experimental frameworks has prevented clear scientific conclusions regarding whether ML methods reliably outperform simpler, well-regularized statistical techniques, especially under small-sample constraints.
Collectively, these gaps motivate a unified, systematic evaluation of multiple forecast models, regional domains, intensity thresholds, and predictor sets under consistent data and validation conditions. This study addresses these needs by developing and testing four forecasting approaches—Lasso regression, k-nearest neighbors (KNN), artificial neural networks (ANN), and XGBoost—across nine region-intensity combinations within the Atlantic basin. These four methods were selected to represent a spectrum of statistical and machine-learning approaches: Lasso provides a regularized linear baseline with physical interpretability; KNN offers a non-parametric analog-based method; ANN represents deep learning approaches; and XGBoost exemplifies modern ensemble tree-based methods. This selection enables systematic comparison across fundamentally different modeling paradigms. We draw on HURDAT best-track data and National Hurricane Center (NHC) seasonal maps for target definitions, and pair these with 34 monthly climate predictors from NOAA and NASA GISS datasets, including MDR latent heat flux (LHF) empirical orthogonal function (EOF) patterns, ENSO indices, global SST fields, and large-scale circulation metrics. A 30-year sliding cross-validation window approximates realistic operational constraints and allows consistent comparison of linear and nonlinear climate–TC relationships.
The goals of this work are to
Quantify how seasonal predictive skill varies across regions and intensity thresholds;
Evaluate the relative contributions and stability of large-scale climate predictors; and
Determine whether ML approaches offer robust, repeatable improvements over traditional statistical models for seasonal TC forecasting.
By integrating regional, intensity-specific, and multi-model analyses within a unified methodological framework, this study contributes new insight into the structure of climate predictability for Atlantic TCs and provides a comparative foundation for improving regional seasonal hurricane outlooks in a warming climate.
2. Data and Methods
2.1. Data
Historical tropical cyclone (TC) activity from 1950 to 2024 was compiled using the HURDAT2 best-track archive [
30,
31,
32,
33], supplemented by seasonal TC track maps produced by the National Hurricane Center (NHC). For each season and sub-basin, the number of TCs was manually tabulated and stratified by maximum lifetime intensity following the Saffir–Simpson Hurricane Wind Scale. Three intensity-based target variables were defined:
Tropical cyclone (TC): tropical storms, category 1–2 hurricanes, and major hurricanes
Hurricane (HU): category 1–5 hurricanes
Major hurricane (MH): category 3–5 hurricanes
Counts for each category were assembled for three subregions of the Greater Atlantic Basin—the Gulf of Mexico (18–31° N, 98–81° W), the Caribbean Sea (10–25° N, 90–60° W), and the full North Atlantic Basin (0–60° N, 100–20° W)—resulting in nine region-intensity target variables (
Table 1 and
Table 2).
To ensure consistency and comparability across all modeling approaches, a unified set of predictor variables was adopted following established practice in seasonal hurricane prediction [
34]. The predictors include a suite of large-scale oceanic and atmospheric climate indices archived by the NOAA Physical Sciences Laboratory. These indices encompass sea surface temperature (SST) anomalies in the Atlantic and Pacific, a variety of El Niño–Southern Oscillation (ENSO) indicators, and multiple teleconnection and synoptic-scale circulation indices.
To account for regional climate dynamics most relevant to Atlantic TC genesis, additional predictors were derived for the Main Development Region (MDR; 10–20° N, 80–20° W) using NCEP–NOAA Reanalysis data [
35]. MDR-based fields included SST, outgoing longwave radiation (OLR), sea-level pressure (SLP), upper- and lower-tropospheric zonal and meridional winds, and vertical wind shear. Surface latent heat flux (LHF) fields were also extracted for boreal winter, from which Empirical Orthogonal Function (EOF) analysis was applied to identify dominant modes of variability linked to TC-favorable conditions.
Broader global forcing was represented by mean land–ocean temperature indices for the globe (GGST), Northern Hemisphere (NGST), and Southern Hemisphere (SGST), derived from the GISS Surface Temperature Analysis (Version 4).
In total, 34 monthly indices—capturing SST anomalies, ENSO behavior, teleconnection patterns, and regional flux dynamics—were evaluated as candidate predictors (
Table 1). Monthly indices were selected rather than daily data because seasonal prediction relies on slowly evolving boundary conditions (e.g., SST anomalies) rather than high-frequency synoptic noise.
To evaluate the stability and performance of forecasting models under differing levels of predictor availability, nine predictor-set configurations were constructed. These configurations cross three temporal availability scenarios—(1) January–February, (2) January–April, and (3) January–February combined with a July–September Niño-region SST forecast—with three data-scope scenarios: (a) Core indices only, (b) Core + Niño indices, and (c) Core + Niño + LHF-EOF predictors. When cross-classified with the nine region–intensity target variables, these design choices generated 81 predictor–target combinations for model training and evaluation (
Table 2).
2.2. Methods
This study evaluates four statistical and machine learning approaches for seasonal hurricane prediction: a generalized linear model with Lasso regularization (Lasso), a K-nearest neighbor model (KNN), a three-layer artificial neural network (ANN), and an Extreme Gradient Boosting model (XGBoost). The central hypothesis is that hurricane activity across different Atlantic subregions is systematically related to large-scale climate predictor variables. The models are tested to determine which approach most effectively predicts future-year hurricane activity using a moving 30-year window of historical data.
2.2.1. Statistical and Machine Learning Models
Lasso Model
The Lasso model follows the formulation introduced in [
34], assuming that the logarithm of the expected hurricane count in a given region is a linear function of the predictor set. Coefficients are estimated by minimizing a penalized log-likelihood function
L defined below, enabling concurrent parameter shrinkage and variable selection.
where
is the observed hurricane count in year
,
is the predictor vector,
is the intercept,
is the coefficient vector, and
is the regularization parameter.
Because many climate indices exhibit substantial multicollinearity, predictors are first grouped using hierarchical clustering based on pairwise correlation. Within each cluster, the variable most strongly associated with the target is retained for modeling. This preprocessing step mitigates redundancy and preserves degrees of freedom. While L regularization may exclude some predictors, the hierarchical clustering preprocessing step ensures that physically important climate modes are represented by retaining the strongest variable from each correlated group, mitigating the risk of discarding essential information. This predictor selection is performed independently within each 30-year training window, preventing information leakage from future years.
Model predictions assume a Poisson distribution for hurricane counts, and predictive skill is evaluated using a log-likelihood skill score relative to climatology. A Poisson distribution was chosen because hurricane counts are discrete, non-negative integers, making Gaussian assumptions inappropriate for this data type. As an interpretable statistical benchmark, the Lasso model highlights dominant linear relationships between climate conditions and hurricane variability.
KNN Model
The K-nearest neighbors model provides a non-parametric, instance-based approach that estimates hurricane outcomes from historical seasons with climate conditions similar to those of the target year. All predictors are standardized to a zero mean and unit variance, and similarity is measured using Euclidean distance.
For a target year with a predictor vector
, the forecast is computed as:
where
is the predicted hurricane count for year
t,
is the observed count in analog year
i, and
(
) is the set of the
K closest analog years.
The hyperparameter is selected via cross-validation to minimize mean squared prediction error. Smaller values emphasize localized analogs but increase noise sensitivity, while larger values provide smoother predictions. Because the KNN model imposes no parametric form, it naturally captures nonlinear and multimodal relationships among climate predictors—such as interactions between ENSO phases, Atlantic SST anomalies, and wind-shear variations. We acknowledge that Euclidean distance can become less meaningful in high-dimensional spaces due to the curse of dimensionality, which may contribute to KNN’s limited skill in this application. The analog-based framework also facilitates physically interpretable comparison between more recent and historical seasons.
ANN Model
The artificial neural network is designed to capture nonlinear, high-order relationships among climatic predictors that may not be fully represented by linear or distance-based models. A feed-forward multilayer perceptron architecture is implemented with two hidden layers, rectified linear unit (ReLU) activations, and an output layer producing continuous hurricane-count predictions.
For an input
, the network output is:
where
and
denote trainable weights and biases.
The first hidden layer comprises 100 neurons, and the second contains 50 neurons, allowing the model to expand and then compress the predictor space. Training is performed for 50 epochs using the Adam optimizer (learning rate ) and a StepLR scheduler with a decay factor of 0.1 every 10 epochs. Mini-batches of size 8 balance computational efficiency and gradient stability.
The ANN autonomously learns nonlinear mappings among predictors—such as multi-variable interactions between SST anomalies, vertical wind shear, and ENSO metrics—and provides a representative neural network benchmark for this prediction task.
XGBoost Model
The Extreme Gradient Boosting (XGBoost) model captures nonlinear relationships and complex feature interactions through an ensemble of regression trees trained sequentially. Each tree reduces the residuals of the ensemble built thus far, while built-in regularization controls overfitting—an essential feature given the limited number of annual observations.
The model minimizes the regularized objective:
where
is the loss function,
is the tree added at iteration
, and
penalizes model complexity based on the number of leaves
and leaf weights
.
A grid search with five-fold cross-validation is used to optimize tree depth, number of boosting rounds, and minimum child weight, with the parameter space restricted to reduce overfitting. XGBoost’s ability to uncover nonlinear interactions among teleconnections, SST anomalies, and dynamical predictors makes it a competitive baseline for this study.
2.2.2. Performance Evaluation
All models are evaluated using a Sliding-Window Cross-Validation (SWCV) design that emulates operational preseason forecasting. For each target year , models are trained using the preceding 30 years of data and tested in that year , ensuring strict separation between training and testing data. The window then advances by one year, yielding a full series of out-of-sample forecasts across 1951–2024.
This approach ensures:
- (1)
Temporal integrity, preventing information leakage from future predictors.
- (2)
Robust validation, producing an empirical distribution of model errors across many independent forecasts.
Forecasts for each model are generated for all three intensity categories (TC, HU, MH) and all three subregions (Atlantic Basin, Caribbean Sea, Gulf of Mexico).
Model performance is assessed using mean squared error (MSE) and a log-likelihood skill score
, defined as:
where the negative log-likelihood for Poisson-distributed counts is:
Positive values indicate improvement over climatology. Averaging across all SWCV windows yields an overall cross-validated skill score for each model, serving as the primary basis for comparing the generalization ability of Lasso, KNN, ANN, and XGBoost across decades of climate variability.
3. Results
This section presents the predictive performance of the four models across all forecasting experiments. We first evaluate temporal accuracy and stability for each individual model and then assess how performance varies with different predictor-variable configurations and region–intensity target combinations.
3.1. Individual Model Performance
3.1.1. Lasso Model
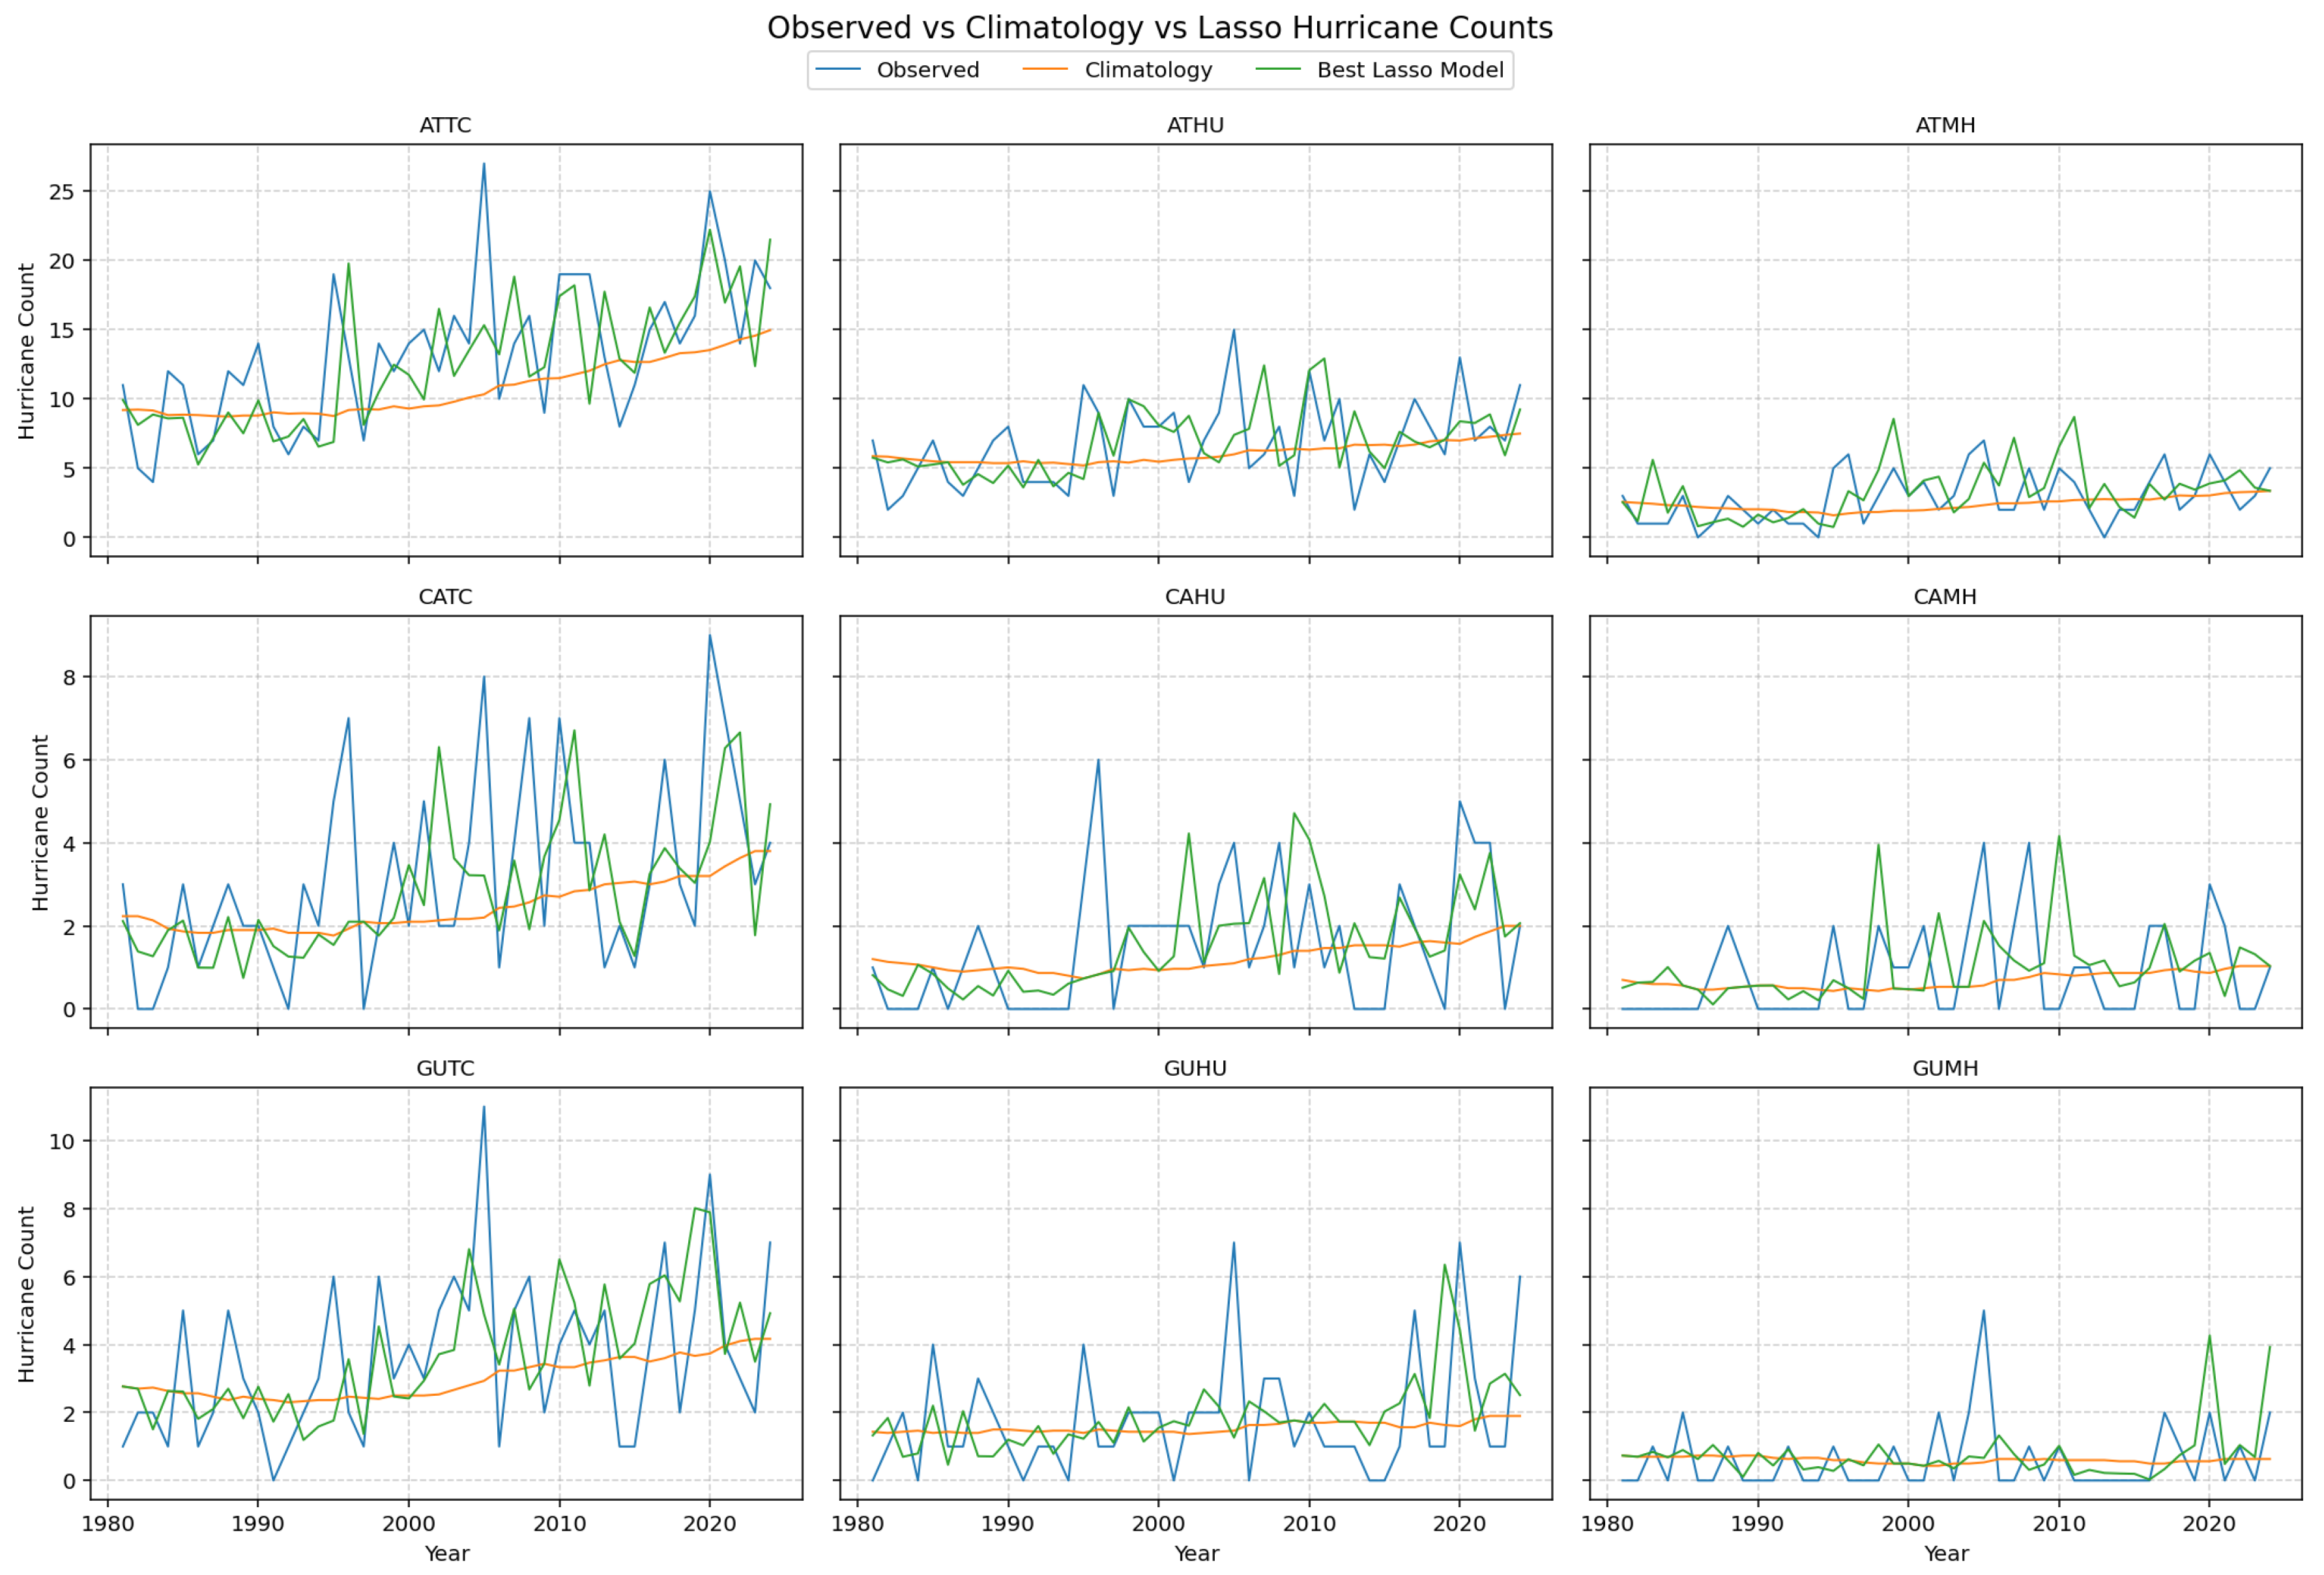
Figure 1 illustrates the observed variability in storm counts across the three study regions. The time series reveals distinct interannual, decadal and multidecadal periods of variability in all three regions. The Lasso model performs reliably for total tropical cyclone counts (ATTC, CATC, GUTC), reproducing both long-term trends and substantial interannual variability. For hurricanes (HU) and major hurricanes (MH), the model remains responsive to interannual fluctuations, outperforming the nearly constant climatological baseline.
Although extreme peaks are somewhat damped—a consequence of regularization—the model retains the correct timing and relative magnitude of active and inactive periods across all basins. Overall, Lasso exhibits strong and stable skills for frequently occurring storm categories and provides meaningful improvements over climatology even for more intense hurricane classes.
3.1.2. KNN Model
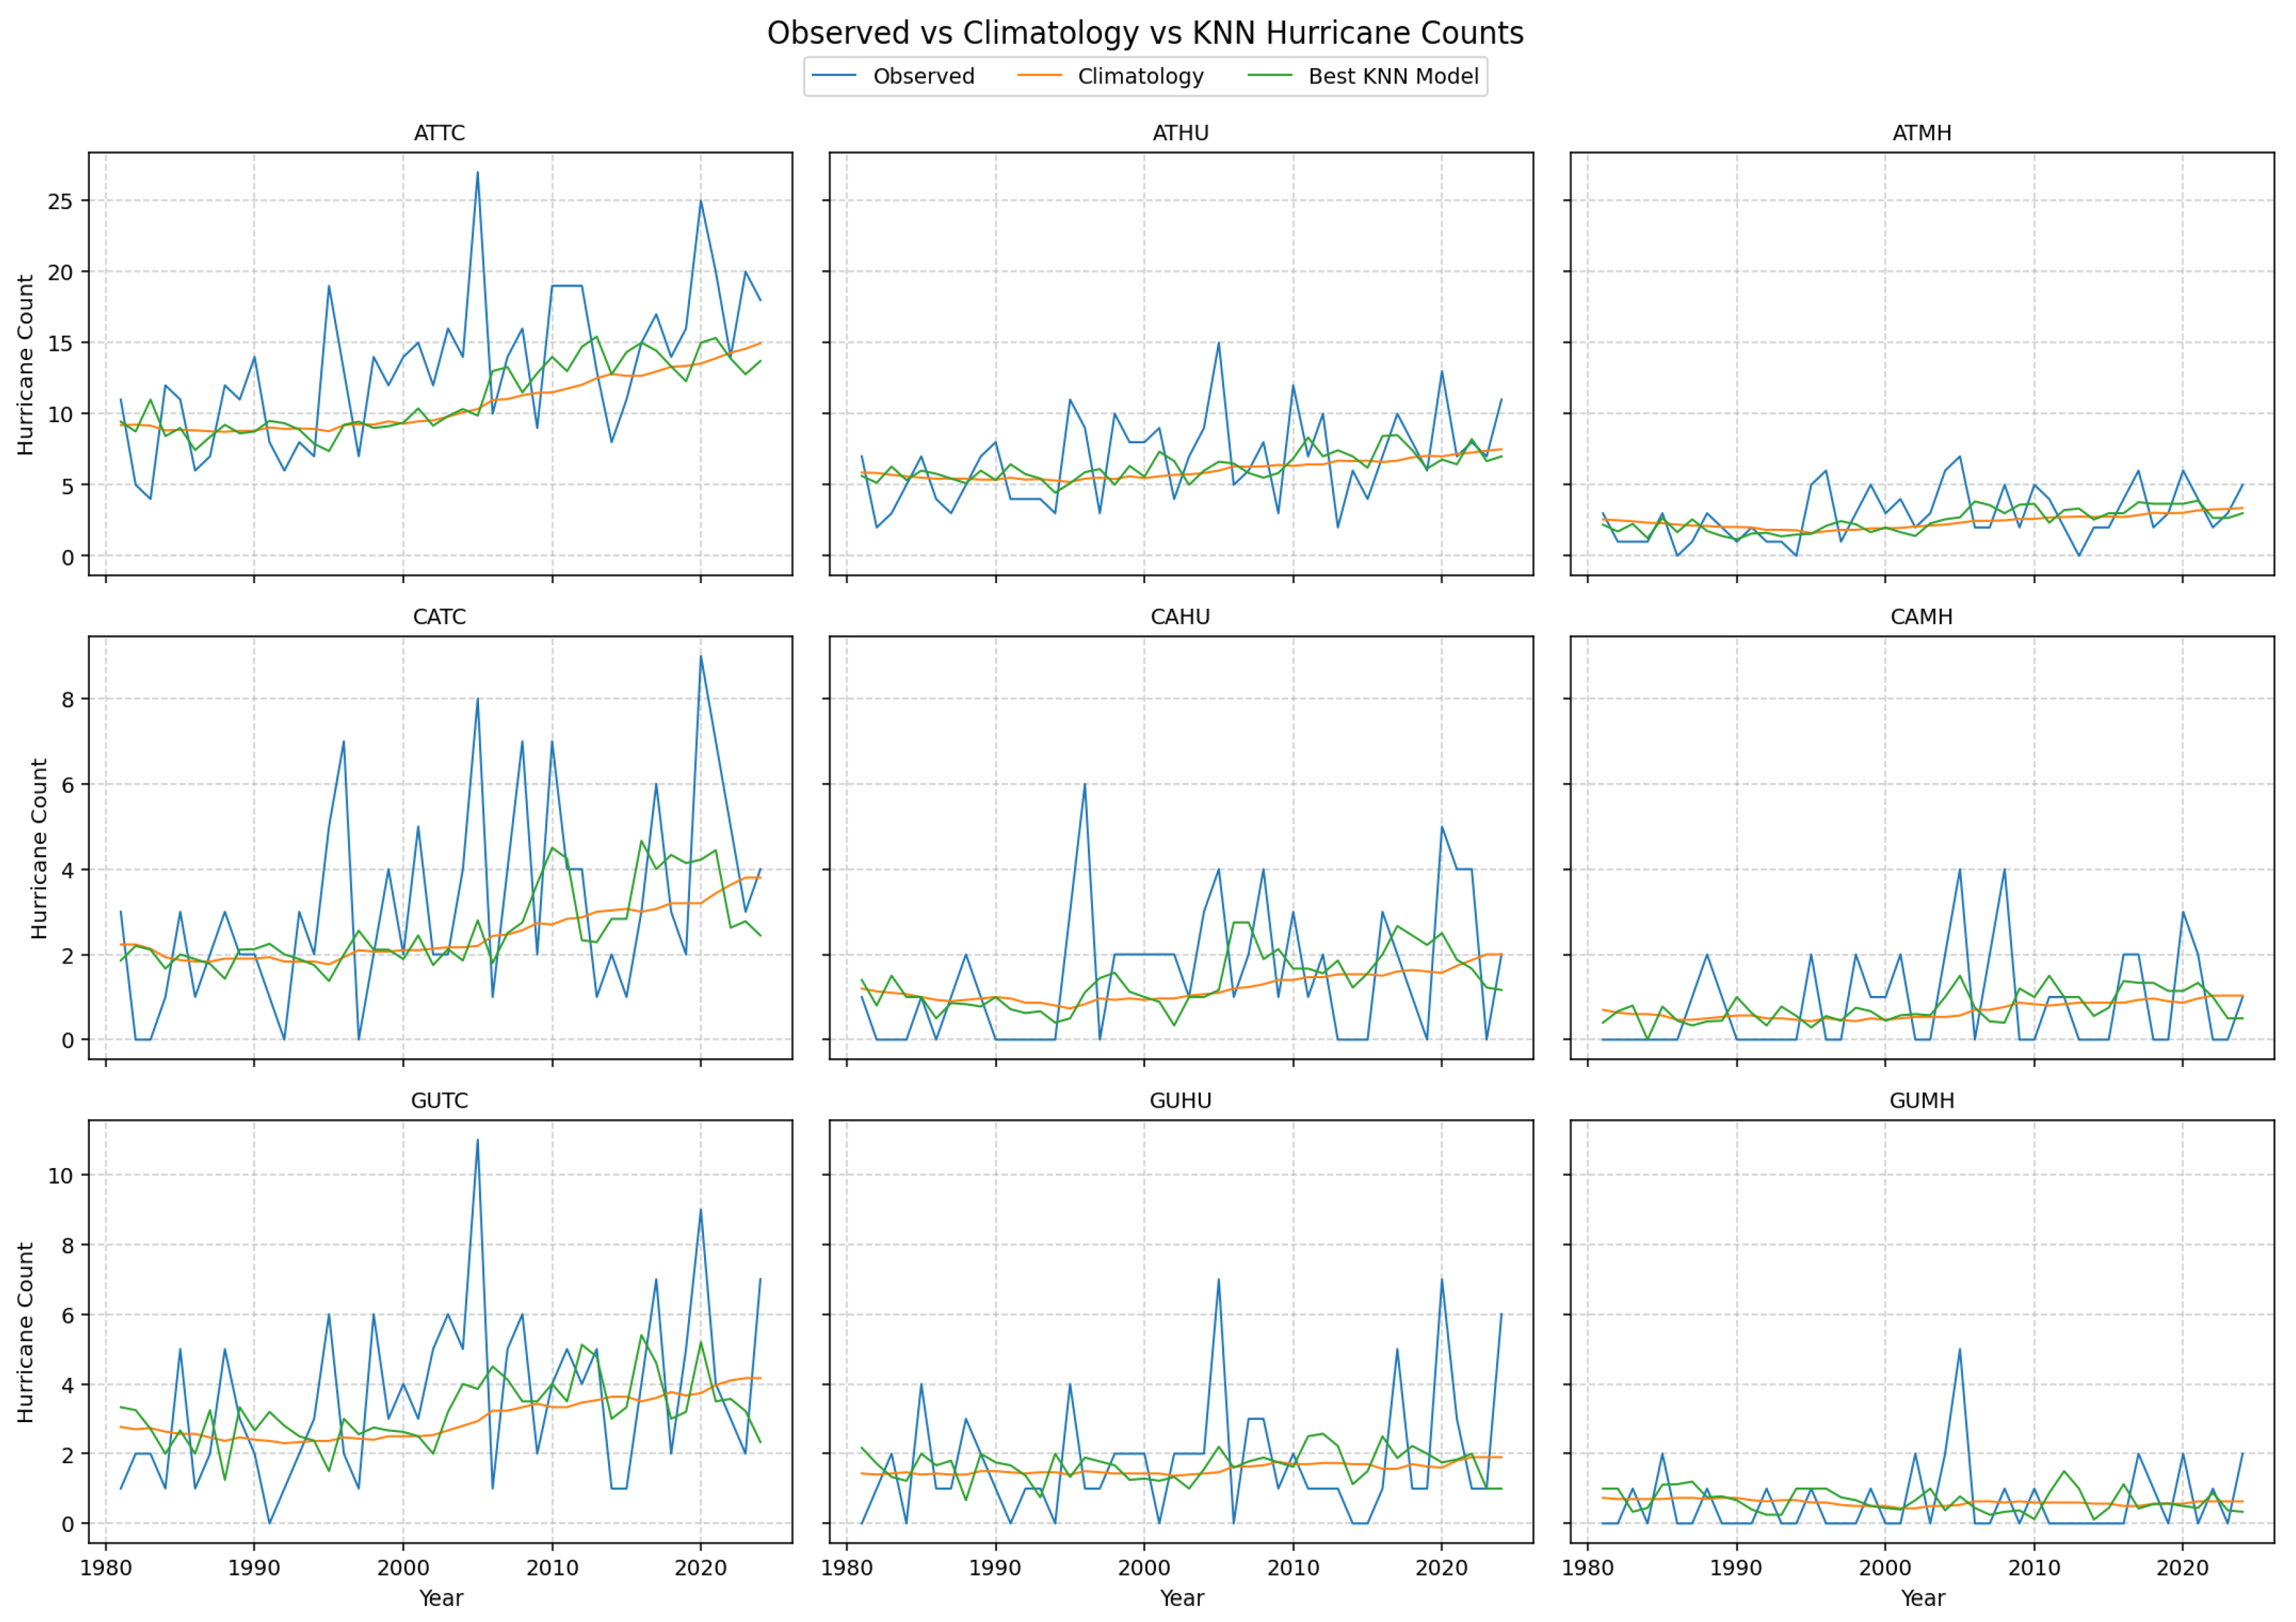
The KNN framework yields favorable skill across most region–intensity combinations (
Figure 2). By identifying past seasons with predictor profiles similar to the target year, the model effectively captures multidecadal variability and broad transitions between active and quiet phases. Forecasts generally smooth extreme peaks but maintain accurate temporal phasing, resulting in consistently better performance than climatology for TC and HU categories.
Skill diminishes for major hurricanes, reflecting the scarcity of suitable analog years and the difficulty of matching rare climatic configurations. Nevertheless, the KNN approach offers a robust non-parametric benchmark that performs competitively for more common storm categories.
3.1.3. ANN Model
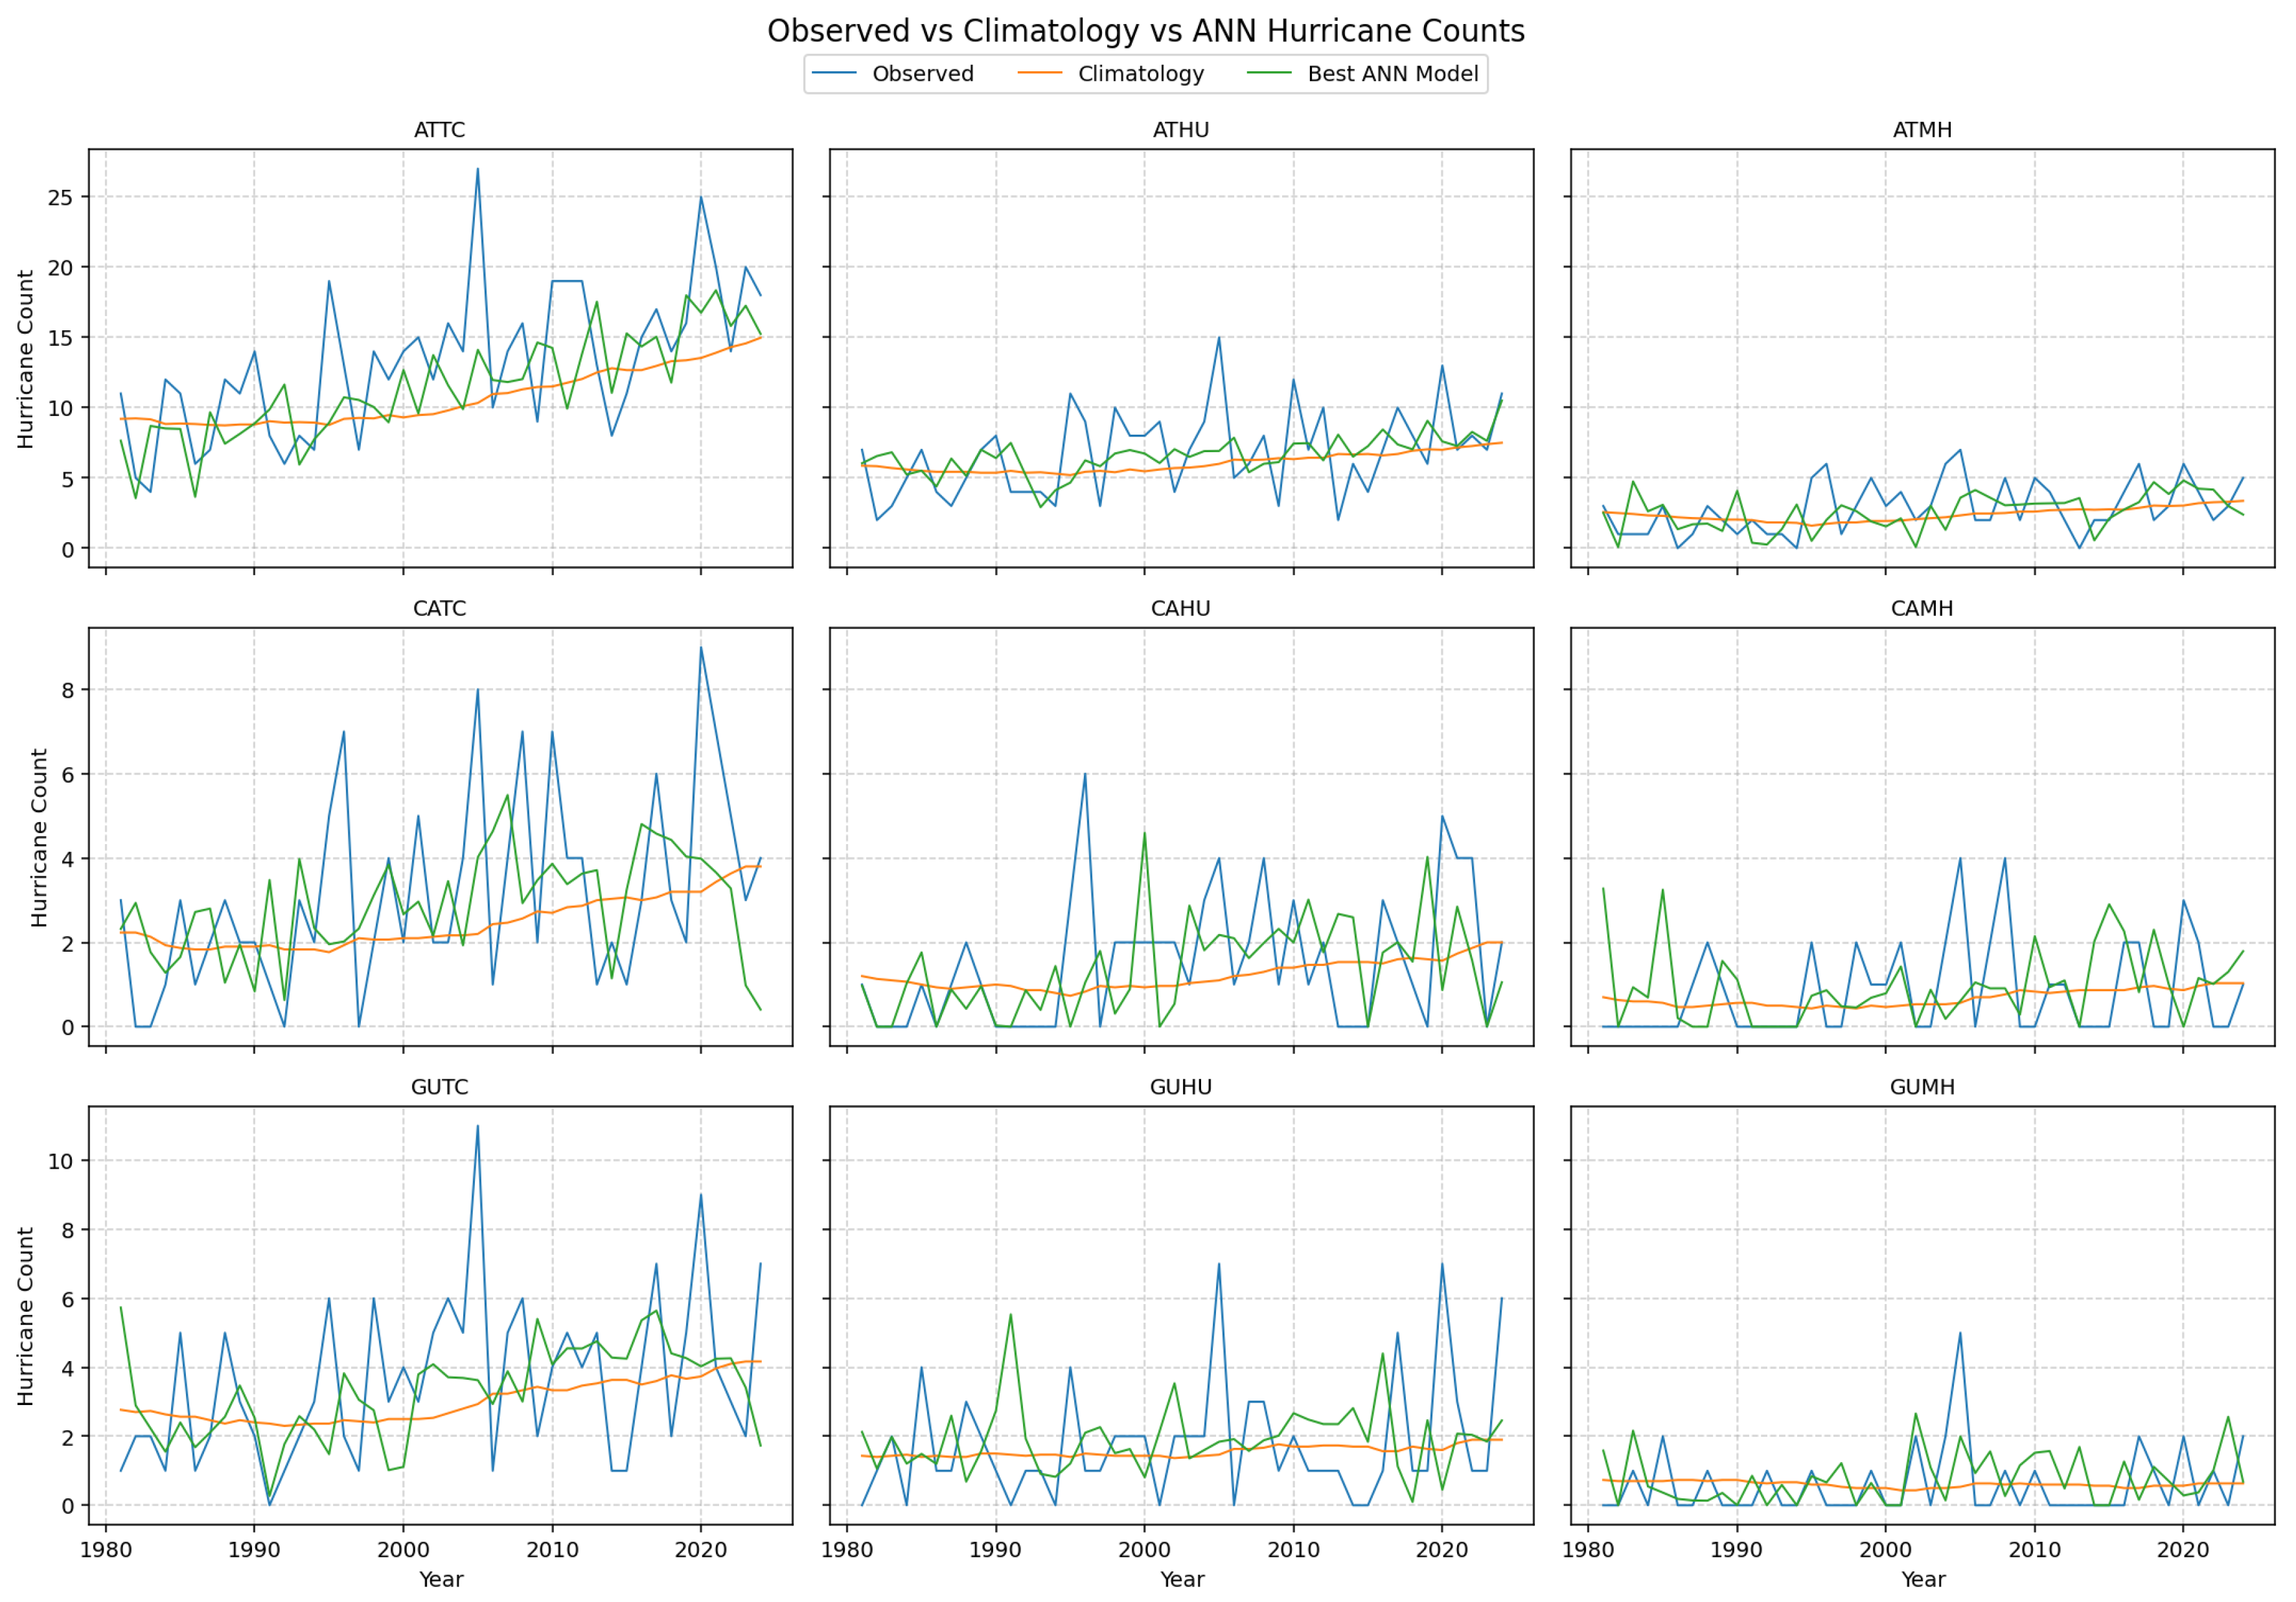
The ANN model captures large-scale fluctuations in hurricane activity but struggles to align the timing of peaks and troughs with observations (
Figure 3). While the model learns the general amplitude and low-frequency variability of TC counts, its predictions frequently lag or lead observed extreme events, producing substantial phase errors.
Performance is adequate for total TCs but deteriorates for HU and MH categories, where nonlinear interactions and small sample size challenge the network’s ability to generalize. These results suggest that the ANN recognizes broad climatic patterns but cannot reliably translate them into year-specific activity levels, given the limited training data.
3.1.4. XGBoost Model
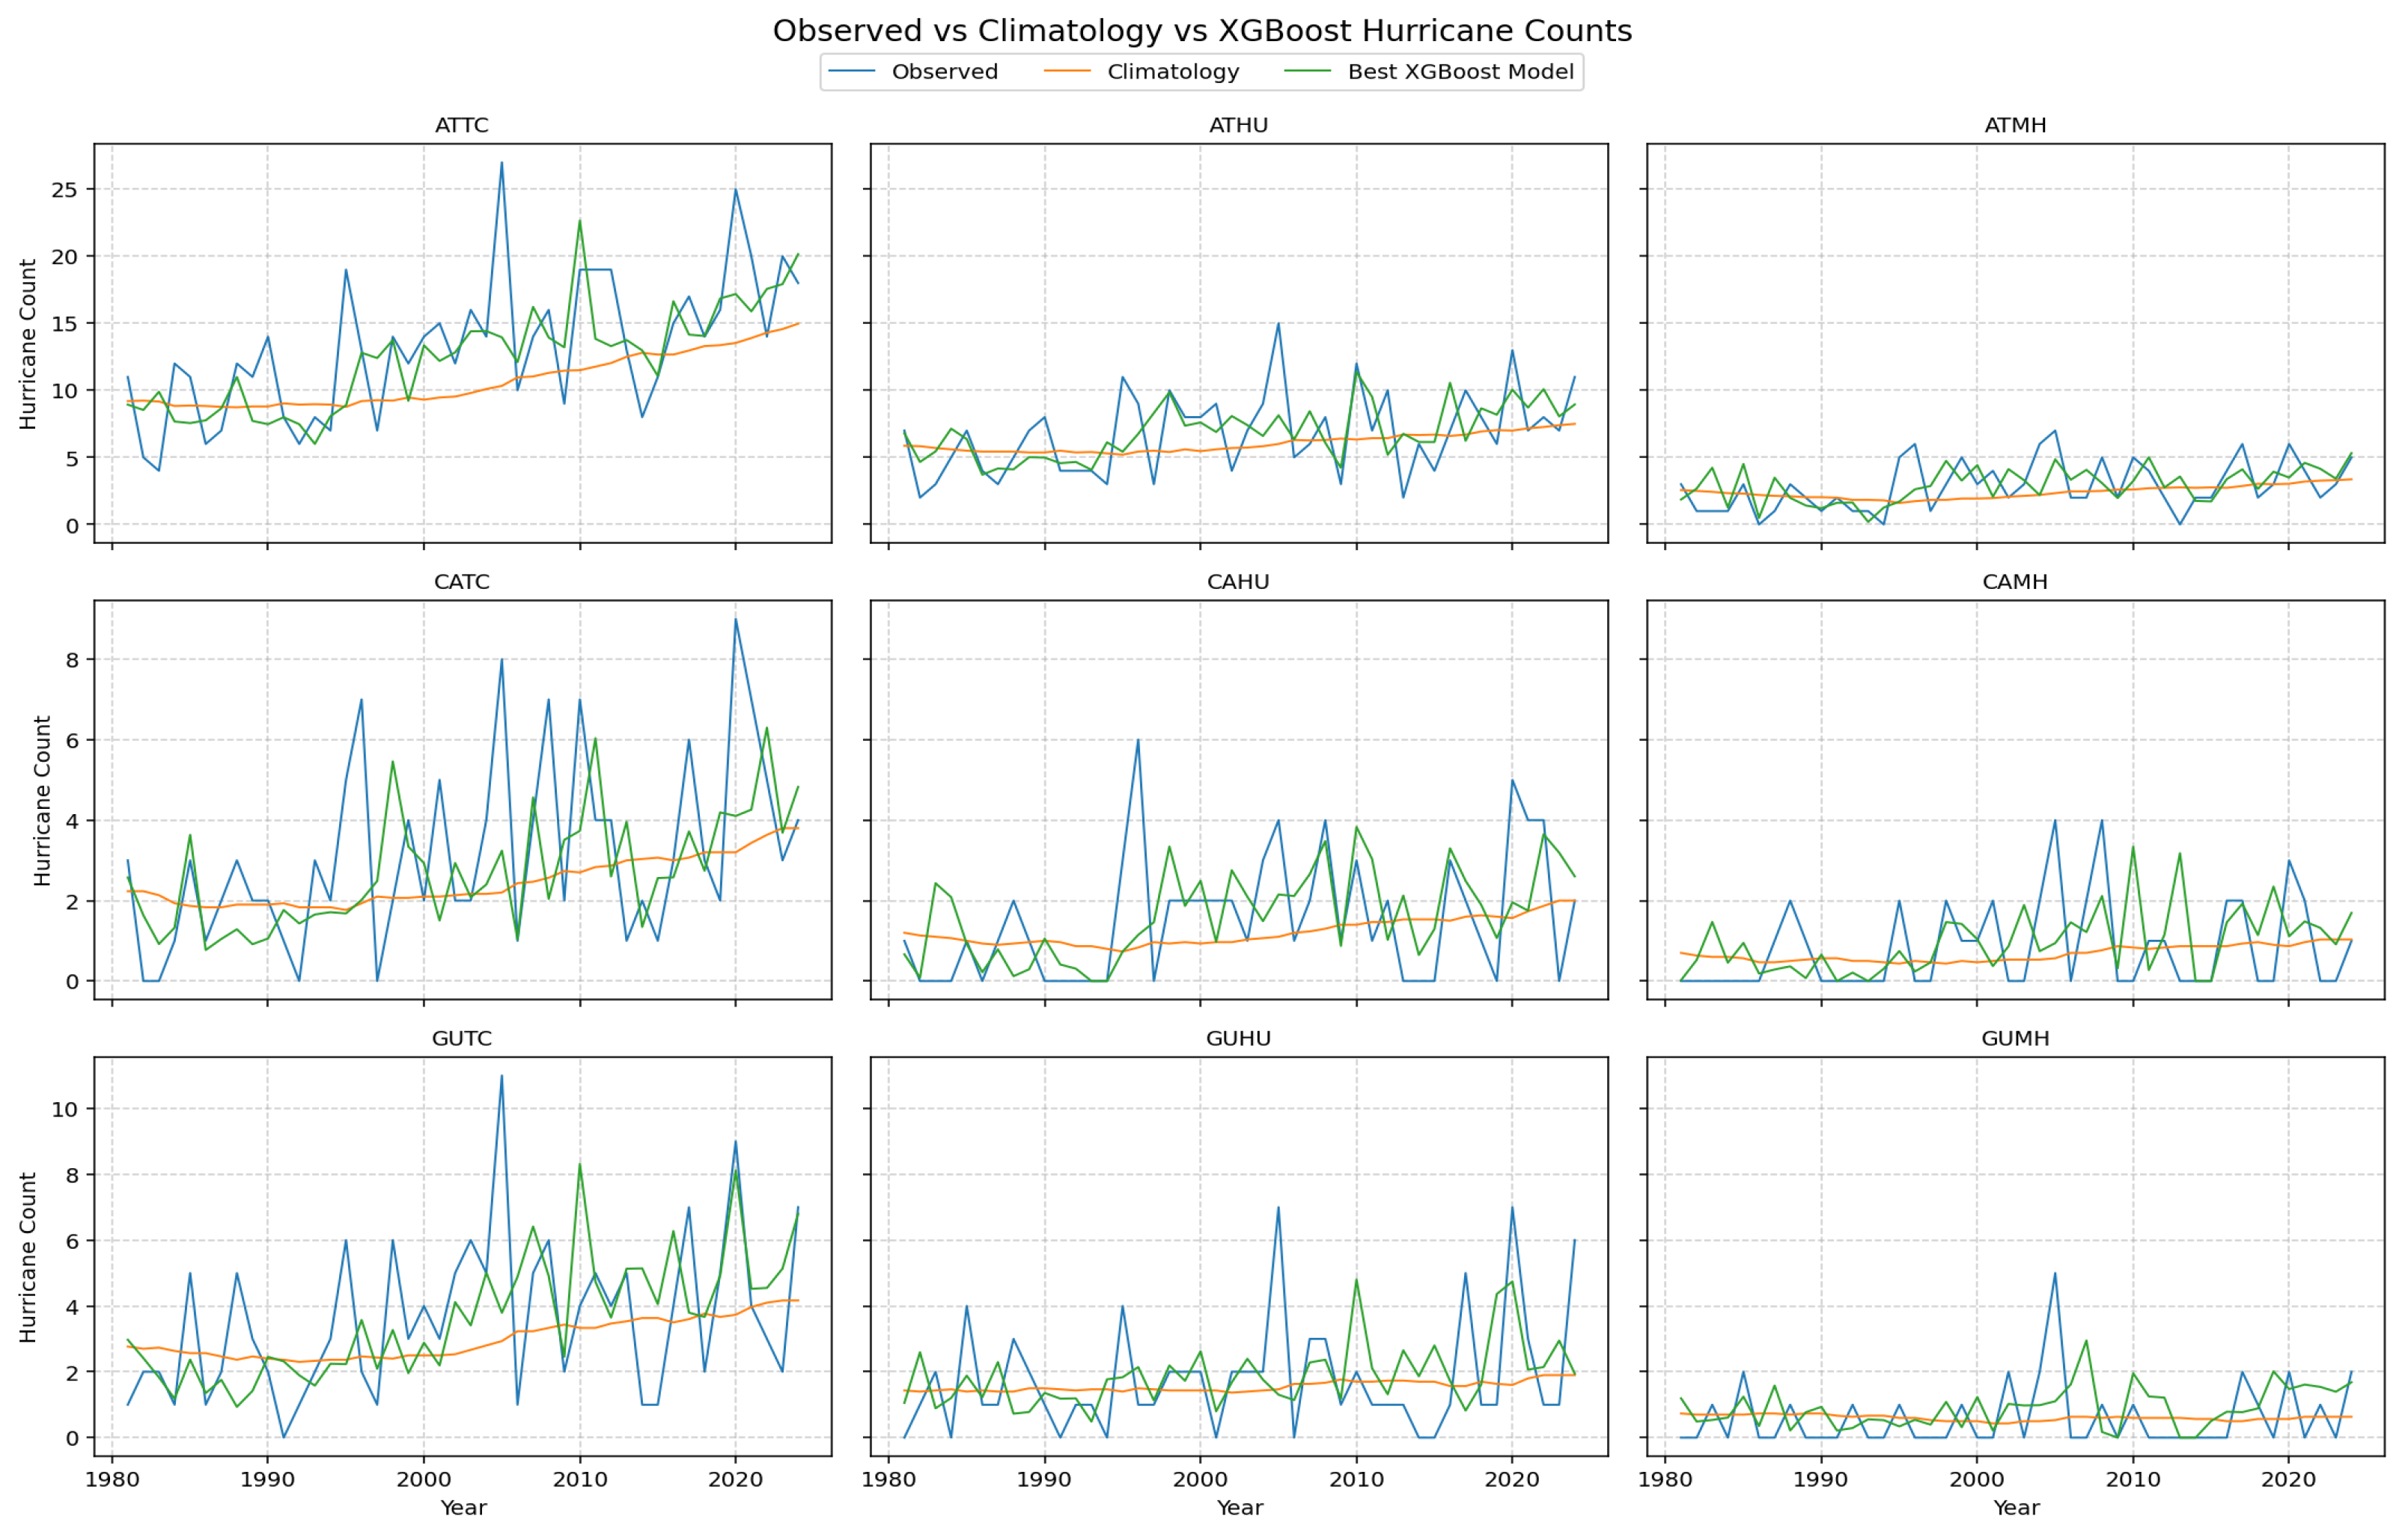
XGBoost delivers the strongest and most consistent performance among all four approaches (
Figure 4). Its forecasts reproduce decadal variability, capture the onset and decline of active phases, and maintain realistic amplitude across all intensity levels. The model is particularly effective for total TCs and hurricanes, where tree-based boosting adapts to nonlinear and hierarchical relationships without overfitting interannual noise.
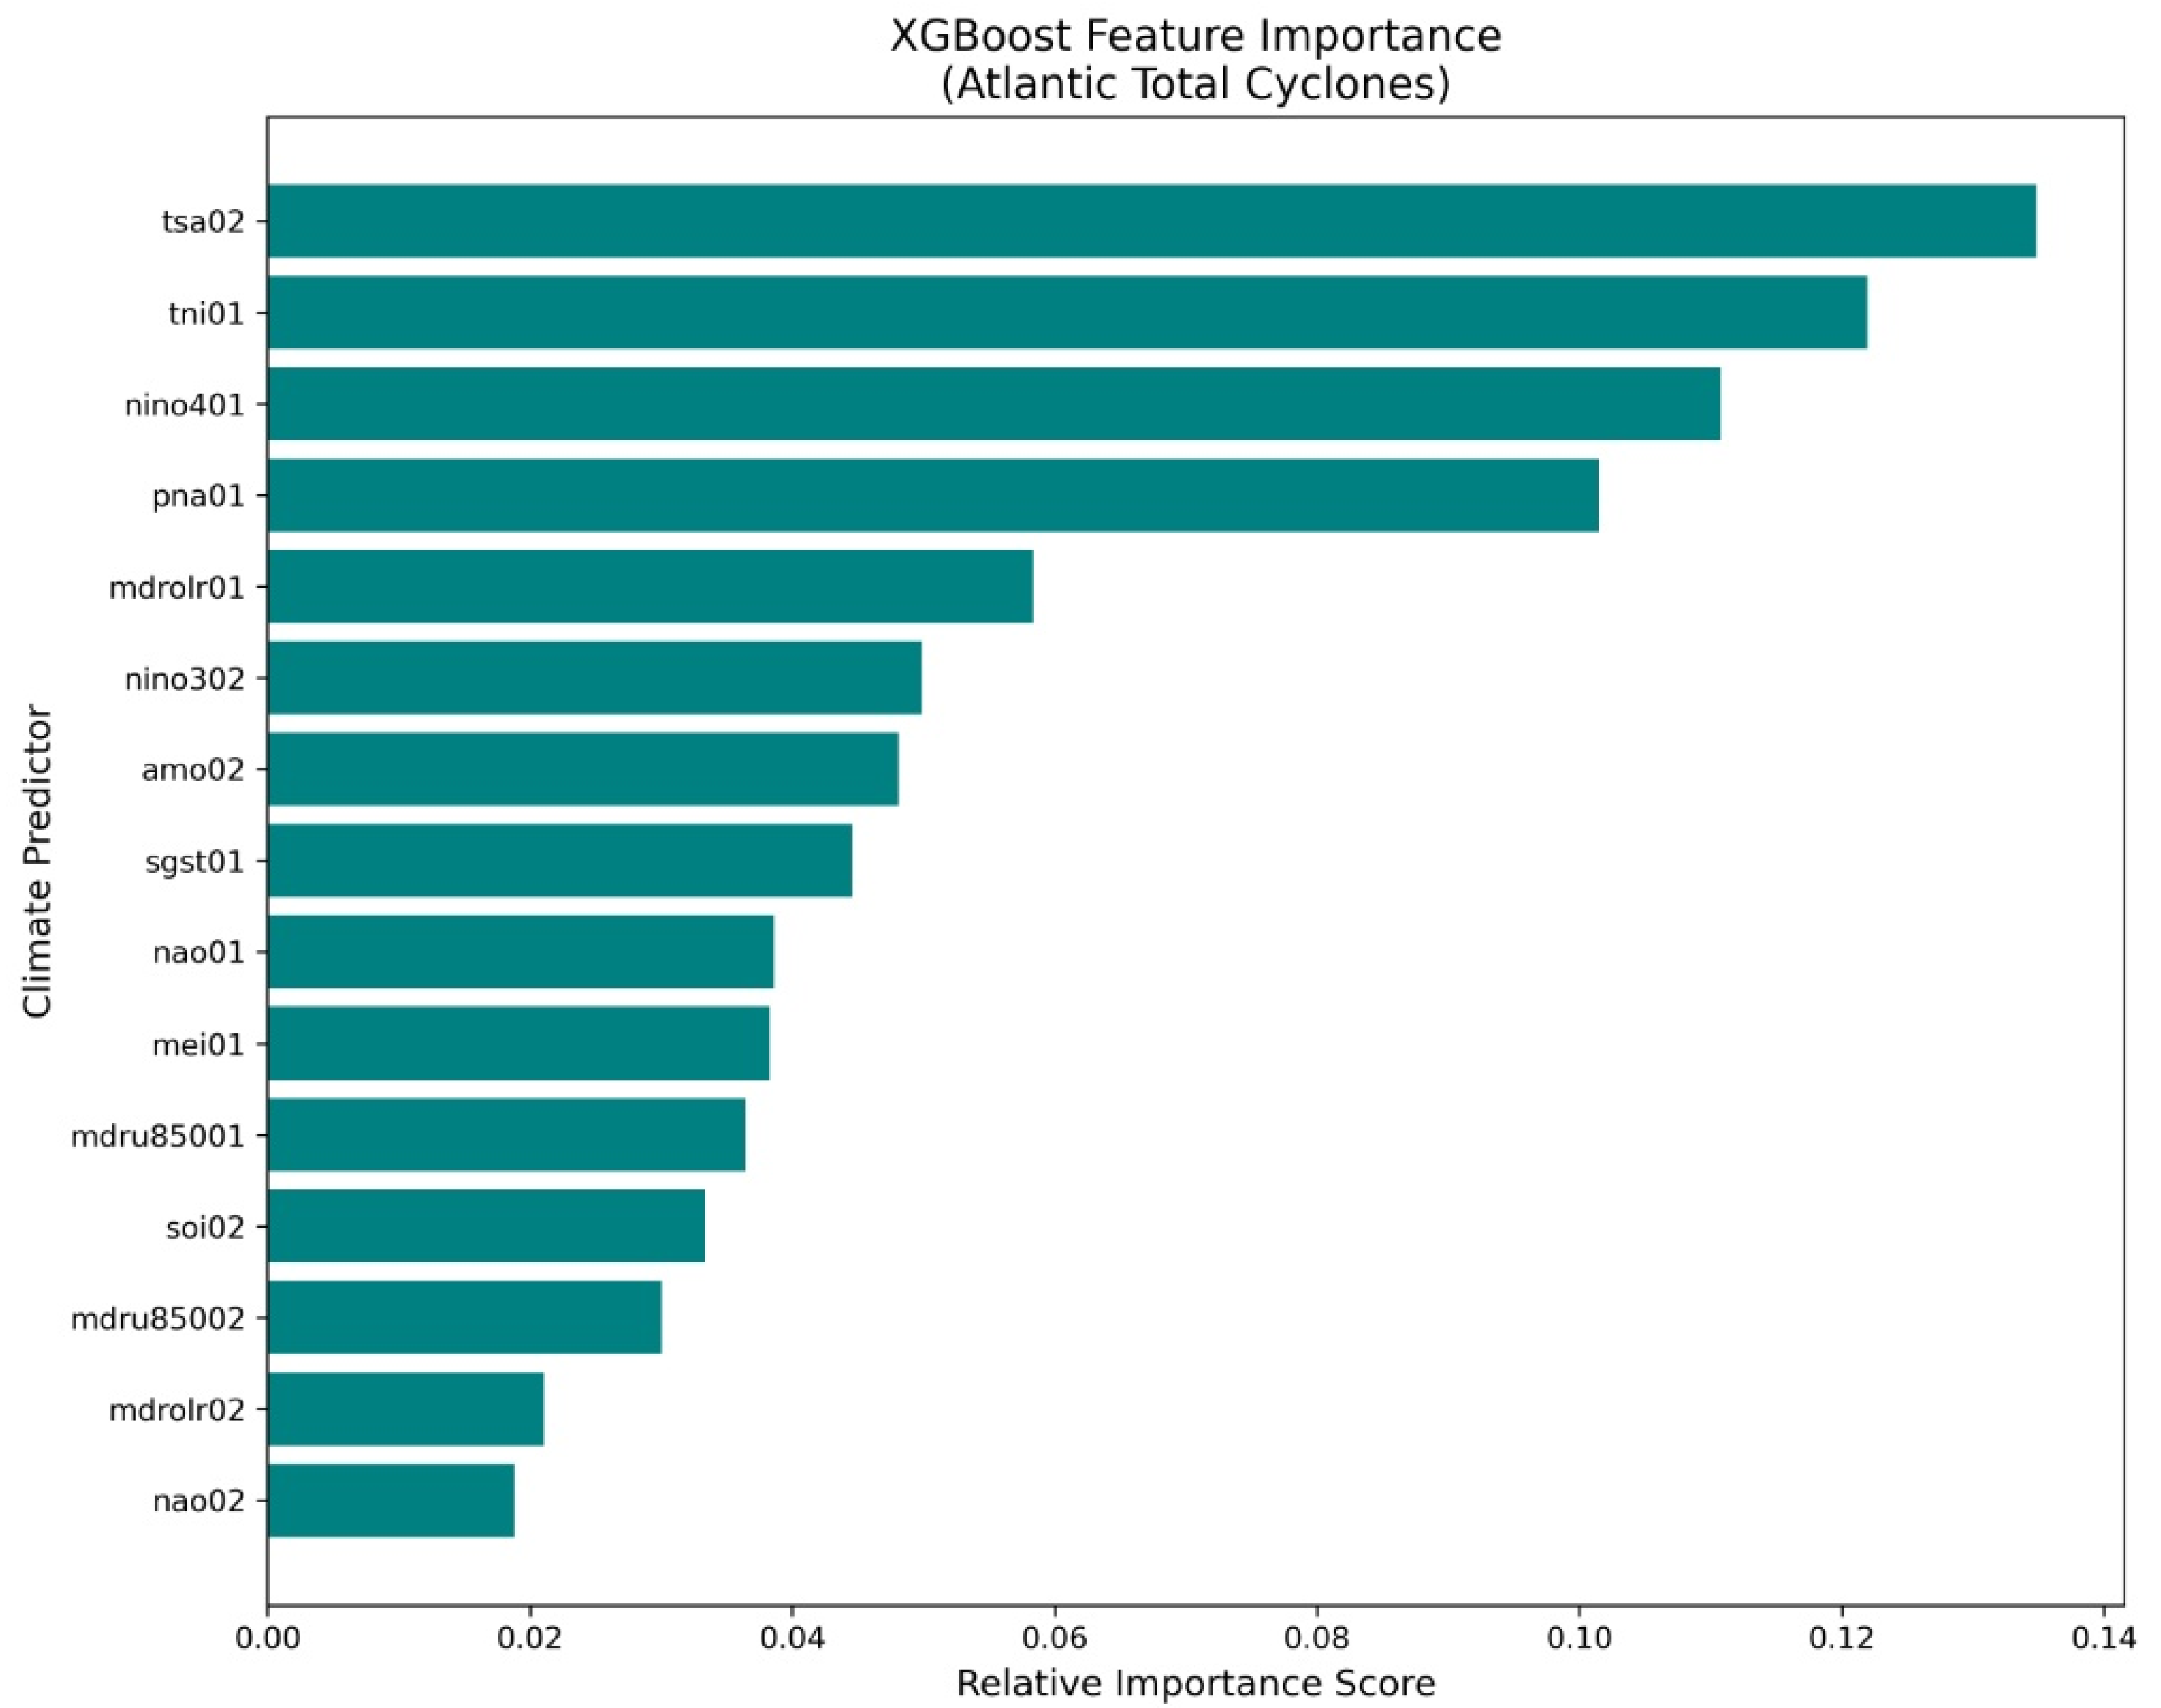
Even for major hurricanes—where data scarcity challenges all models—XGBoost maintains stable phasing and amplitude. This consistent fidelity underscores the advantages of ensemble boosting and embedded regularization in extracting predictive signals from high-dimensional climate data (
Figure 5).
3.2. Cross-Model Comparison
3.2.1. Performance Across Predictor-Variable Sets
Table 3 summarizes the best and average log-likelihood skill scores (H) for each model across nine predictor-variable configurations. The results highlight model sensitivity to predictor diversity, seasonal lead time, and inclusion of ENSO and latent heat flux (LHF) information.
XGBoost demonstrates the highest and most stable performance. It achieves top best-case H-values in virtually all predictor sets (up to 0.374) and maintains near-neutral or positive average skill, even when predictor dimensionality increases. The greatest improvement occurs in the January–April, Core + Niño configuration, indicating that the inclusion of spring ENSO signals enhances model skill. The model remains robust even with LHF predictors, confirming the effectiveness of its internal regularization.
Lasso performs best when predictor sets are moderate in size. Its strongest results appear in the January–April, Core + LHF and January–February + Niño JAS Forecast configurations (best H ≈ 0.25–0.26), where dominant linear relationships drive most of the predictive signal. Beyond these settings, average H-values decline slightly as additional predictors introduce bias from increased regularization.
KNN shows limited sensitivity to predictor set expansion. Best H-values remain between 0.06 and 0.08, while average values fluctuate around zero or slightly negative. This indicates that Euclidean distance in high-dimensional climate space does not leverage additional predictor information effectively.
ANN exhibits substantial performance degradation as input dimensionality increases. Average H-values fall below 3 for almost all expanded predictor sets, especially those including LHF variables. These results reflect severe overfitting given the limited training sample and confirm that the tested ANN architecture is insufficiently constrained for this forecasting task.
In summary, regularized linear (Lasso) and boosted tree (XGBoost) models benefit most from moderate predictor diversity, while data-intensive models (ANN) degrade when dimensionality increases. XGBoost is the only method that maintains stable and positive skill across all predictor configurations.
3.2.2. Performance Across Target Variables
Table 4 summarizes the best and average H-values for each model across nine region–intensity target variables.
XGBoost is the top-performing approach for seven of the nine targets. It achieves positive mean skill for most TC and HU categories, especially in the Atlantic Basin (mean H = 0.27 for ATTC; 0.01 for ATHU). Even the more difficult MH categories yield near-neutral skill, reflecting the model’s resilience to noise and low sample size.
Lasso performs as a strong linear benchmark, achieving positive average skill for total TC categories (e.g., ATTC avg H = 0.18; GUTC avg H = 0.08). Skill declines for hurricane and major hurricane categories, where linear assumptions limit flexibility, but performance remains stable and interpretable.
KNN produces mixed results. It achieves isolated positive best-case scores (e.g., ATMH best H = 0.06), but average values cluster near zero or slightly negative. Its analog-based inference struggles to consistently represent rare events and high-frequency variability.
ANN consistently produces large negative H-values across nearly all targets, reflecting overfitting and poor temporal generalization. Its predictions frequently misalign major activity shifts, resulting in unstable and unreliable forecasts.
In summary, XGBoost provides the strongest overall performance—highest best-case and average skill—followed by Lasso as a reliable linear alternative. KNN adds marginal skill over climatology, and ANN underperforms across all targets given the small-sample constraints.
4. Discussions
This study evaluated four statistical and machine-learning approaches—Lasso, KNN, ANN, and XGBoost—for seasonal prediction of Atlantic tropical cyclone activity under multiple predictor configurations and across several region–intensity targets. The results show that while several methods modestly exceed climatology, only a subset delivers stable, generalizable performance suitable for operational use.
The most consistent outcome is the superiority of XGBoost. Across nearly all predictor sets and targets—especially basin-wide total tropical cyclones and hurricanes—XGBoost achieves the highest best-case scores and maintains near-neutral or positive mean skill. Its ability to regularize model complexity through boosted decision trees, prune weak interactions, and accommodate nonlinear dependencies among predictors appears well matched to the structure of the seasonal hurricane prediction problem. With only a few decades of training data, a model must capture large-scale climate signals without tracking year-specific noise; XGBoost is the only method that consistently strikes that balance.
Lasso performs well when predictor sets remain moderate in size and are dominated by physically interpretable indices. It yields positive mean skill for several total TC targets and, in specific configurations, matches or occasionally exceeds XGBoost. This behavior aligns with earlier findings that regularized linear models can isolate compact, physically meaningful predictors. In this study, Lasso performs best for high-sample targets where linear relationships between climate drivers and storm counts are strongest. Its performance weakens for rare outcomes—such as regional major hurricanes—where strong regularization and linear constraints limit sensitivity. Even so, Lasso remains a stable, interpretable baseline for identifying core climate–TC linkages.
KNN and ANN highlight the difficulties inherent in applying data-intensive or highly flexible models to small training samples. KNN exhibits minimal responsiveness to increased predictor dimensionality, with modest best-case skill and near-zero or negative average performance. Euclidean analogs in high-dimensional, correlated predictor spaces fail to reliably distinguish active from inactive seasons. ANN performs substantially worse: mean skill scores are strongly negative across most targets. The network overfits the limited data and does not reproduce the temporal alignment of observed variability. Without substantial redesign—such as stronger regularization, reduced complexity, or larger training sets—ANN architectures of this type are not suitable for seasonal TC prediction. We acknowledge that the poor performance of the ANN may stem from the inherent mismatch between the data volume (annual counts) and the parameter space of neural networks. While simpler architectures were tested, the model failed to converge on stable solutions as effectively as decision-tree ensembles, suggesting that for datasets of this size (<100 samples), deep learning approaches are less suitable than boosted trees.
Predictor availability and lead time influence model performance but not uniformly. Both XGBoost and Lasso usually benefit from additional early-season information, such as predictors extended through April or the inclusion of Niño indices. XGBoost responds most favorably to “January–April, Core + Niño” configurations. Lasso achieves its best scores in a subset of balanced predictor sets where the number and strength of predictors align with its regularization. By contrast, inclusion of LHF-derived EOFs leads to mixed outcomes, indicating that increased physical detail does not automatically improve predictive skill. Instead, the interaction among model structure, predictor noise, and limited sample size determines whether new information provides a usable signal.
Differences across regions–intensity targets further demonstrate the limits of predictability. Both XGBoost and Lasso perform best for basin-wide total TCs, with skill decreasing for hurricanes, major hurricanes, and geographically smaller domains. This pattern reflects both physical and statistical constraints. Basin-wide TC activity is strongly tied to large-scale climate conditions, whereas regional hurricane and major-hurricane counts also depend on local forcing, track variability, and internal dynamics not captured by seasonal predictors. The lower predictability observed in the Gulf of Mexico compared to the Caribbean likely reflects the influence of local features that are not well-represented by large-scale climate indices. While Caribbean activity is strongly modulated by large-scale ENSO-induced shear, Gulf activity is often driven by Loop Current dynamics and rapid intensification of weak storms formed locally—processes that are less coupled to basin-wide seasonal predictors. Sparse samples for regional MH targets reduce effective signal strength, pushing several models toward neutral or negative skill. These outcomes indicate that fine-scale seasonal guidance is inherently more uncertain, rather than showing that models are fundamentally inadequate.
Our approach differs from recent ML-based hurricane studies in several ways: we employ region-specific targets rather than basin-wide totals only, use a consistent 30-year sliding window rather than fixed train-test splits, and systematically compare four different model families rather than focusing on a single algorithm.
Several implications emerge. First, regularized ensemble methods—especially XGBoost—provide a strong foundation for seasonal TC forecasting and represent a useful complement or alternative to traditional linear approaches. Second, increased model complexity or ‘black-box’ architectures do not guarantee better performance. Models must be carefully matched with data volume and the underlying physical structure of the problem. Third, the pronounced contrast between basin-scale and region-specific skill underscores the need for caution when issuing granular seasonal guidance. Regional outlooks remain possible but should be accompanied by clear communication of uncertainty.
This study has several limitations that suggest directions for future work. Results are based on a fixed 30-year sliding-window validation framework and a single set of climate predictors based on storm counts; alternative target variables, such as accumulated cyclone energy, validation window lengths, additional dynamical model inputs, or other reanalysis products, may alter relative model performance. The analysis treats each regional target variable independently, foregoing potential benefits of multitask or hierarchical models that exploit shared climate drivers. Furthermore, verification relies solely on Poisson-likelihood skill scores; complementary probabilistic or decision-relevant metrics could provide a broader assessment of forecast value.
Despite these constraints, the findings show that physically informed, well-regularized machine-learning systems can substantially improve seasonal prediction of Atlantic tropical cyclone activity—particularly for basin-scale total storm counts. As climate change continues to reshape the large-scale environment influencing tropical cyclones, comparative evaluations such as this will be critical for guiding the development of next-generation seasonal and regional hurricane prediction systems. Recent studies have also applied advanced data assimilation and machine learning techniques to other basins, such as the Bay of Bengal, to improve track and intensity forecasts at shorter time scales [
36,
37].
5. Conclusions
This study compared four modeling approaches—Lasso, KNN, ANN, and XGBoost—for seasonal prediction of Atlantic tropical cyclone activity across multiple regions, intensity thresholds, and predictor configurations. Using a consistent suite of climate predictors and a 30-year sliding window cross-validation framework, the analysis provides an operationally realistic assessment of how linear, analog-based, neural-network, and tree-ensemble methods perform in a small-sample seasonal forecasting environment.
Across the full set of experiments, XGBoost emerges as the most reliable and skillful model, consistently achieving the highest best-case and positive or near-neutral mean H-scores for many basin-wide and regional targets. Its ability to accommodate nonlinear interactions among predictors, while controlling overfitting through boosting and regularization, is a key advantage. This makes it particularly well-suited to the limited sample sizes that characterize seasonal hurricane prediction. Lasso also performs strongly, especially for total tropical cyclone counts and for predictor sets of moderate size that emphasize physically interpretable climate indices. These results reaffirm the value of regularized linear methods as stable, interpretable baselines. In contrast, KNN and ANN models exhibit marginal or even negative skill, highlighting the difficulty of applying high-flexibility or data-intensive approaches to small-sample climatological problems.
The analysis also demonstrates that forecast skill is sensitive to predictor availability and lead time. Certain configurations—particularly those incorporating early-season SST anomalies and Niño indices—enhance performance for both XGBoost and Lasso. However, the benefits of expanding predictor sets are not uniform; additional variables sometimes degrade skill, reflecting an inherent trade-off between predictor diversity, noise characteristics, and optimized predictor size. Moreover, regional and major-hurricane targets remain the most challenging to predict, owing to both statistical limitations (sparse event counts) and physical constraints on the predictability of storm counts for relatively small regions.
Collectively, these findings have several implications. First, well-designed machine-learning models—especially tree-based ensembles—can provide meaningful improvements over climatology and simple regression when rigorously evaluated. Second, greater algorithmic complexity does not guarantee greater forecast skill; model choice must remain closely aligned with data volume, physical interpretability, and the nature of the prediction problem. Third, seasonal outlooks for highly specific regional or intensity categories should be communicated with appropriate caution, given the limited predictability at these scales.
Several opportunities for future research remain. Alternative target variables, different lengths of training windows and validation windows, expanded predictor sources (including dynamical model output), and multitask or hierarchical learning frameworks may better leverage shared information across regions and intensity levels. Additional verification metrics—probabilistic scores or decision-oriented measures—could also provide a more comprehensive view of model utility.
Despite these limitations, the study demonstrates that physically informed machine-learning frameworks offer a viable pathway for improving the accuracy, robustness, and interpretability of seasonal Atlantic tropical cyclone forecasts, particularly at the basin scale and for total storm counts under operationally realistic constraints.