Article

Quantification of the Spatial Heterogeneity of PM2.5 to Support the Evaluation of Low-Cost Sensors: A Long-Term Urban Case Study

1
Department of Meteorology, Institute of Geography and Earth Sciences, ELTE Eötvös Loránd University, Pázmány Péter sétány 1/A, H-1117 Budapest, Hungary
2
Global Change Research Institute, Czech Academy of Sciences, Bĕlidla 986/4a, 603 00 Brno, Czech Republic
3
HUN-REN Centre for Agricultural Research, Brunszvik u. 2., H-2462 Martonvasar, Hungary
4
HUN-REN Centre for Energy Research, Konkoly-Thege út 29–33, H-1121 Budapest, Hungary
*
Author to whom correspondence should be addressed.
Atmosphere 2025, 16(9), 998; https://doi.org/10.3390/atmos16090998
Submission received: 4 August 2025 / Revised: 17 August 2025 / Accepted: 21 August 2025 / Published: 23 August 2025
(This article belongs to the Section Atmospheric Techniques, Instruments, and Modeling)

Abstract

During the last decades, development of novel low-cost sensors commercialized for indoor air quality measurements has gained interest. In this research, three AirVisual Pro air quality monitors were used to monitor PM2.5 and carbon dioxide concentrations in which two were installed indoors and one outdoors at two residential apartments in Central Europe (Budapest, Hungary). In our research, we present a methodology to support the evaluation of indoor sensors by utilizing official outdoor monitoring data, leveraging the fact that indoor spaces are frequently ventilated and thus influenced by outdoor conditions. We compared six-year measurement data (January 2017–December 2022) with outdoor concentrations provided by the Hungarian Air Quality Monitoring Network (HAQM). However, the well-known low spatial representativeness and high spatio-temporal variability of PM2.5 in city environments made this evaluation problematic, which needed to be addressed before comparison. Here we quantify the spatial heterogeneity of the HAQM PM2.5 data for a maximum of eight stations. Then, based on the carbon dioxide readings of the AirVisual Pro units, data filtering was performed for the AirVisual 1 and AirVisual 2 sensors located in indoor environments to identify ventilated periods (nearly 10,000 ventilated events) for the AirVisual 1 and AirVisual 2 sensors, respectively, for the comparison of indoor and outdoor PM2.5 concentrations. The AirVisual 3 sensor was placed in a garden storage, and the measurements taken there were considered outdoor values throughout. Finally, four heterogeneity criteria were set for the HAQM data to filter conditions that were assumed to be comparable with the indoor sensor data. The results indicate that the spatial heterogeneity was indeed detectable, and in approximately 50–60% of the cases, the readings could be considered as non-representative to single location comparison, but the results depend on the selected homogeneity criteria. The AirVisual and HAQM comparison indicated relatively low sensitivity to heterogeneity criteria, which is a promising result that can be exploited. AirVisual sensors generally overestimated PM2.5, but this bias could be corrected with a simple linear adjustment. Slopes changed across sensors (0.83–0.85 for AirVisual 1, 0.48–0.53 for AirVisual 2, and 0.70–0.73 for AirVisual 3), indicating general overestimation and correlations from moderate to high (R2 = 0.45–0.89) depending on the device. In contrast, when we compared the measurements only with data from the nearest reference station, we obtained a weaker match and slopes that did not match those calculated by taking into account homogeneity criteria. This research contributes to the proliferation of citizen science and supports the application of LCSs in indoor conditions.

1. Introduction

Indoor air quality is strongly influenced by external environmental factors, since outdoor air pollutants enter the indoor environment through natural or mechanical ventilation, as well as by penetrating through a building’s cracks [1,2]. Moreover, indoor air quality is also significantly affected by indoor activities such as cooking, smoking, use of cleaning products, incense burning, heating system, the behavior of occupants, etc. [3,4].
The amount of time individuals spend indoors depends on a number of factors [5]. According to [6], people spend ~87% of their time indoors on average, which means that attention is needed on indoor air quality as well. This means that monitoring and occasionally improving indoor air quality is of high priority. Among various air pollutants, aerosol particles and especially fine particulate matter (PM2.5) are of critical concern in both indoor and outdoor environments. Extensive research over the past decades has demonstrated that both short- and long-term exposure to PM2.5 is linked to a range of adverse health outcomes. These include allergic reactions, asthma symptoms, cardiovascular and respiratory diseases, and potentially increased risk of lung cancer [7,8,9,10,11].
As in many other countries, outdoor air quality is routinely monitored and analyzed in Hungary with high-precision reference instruments [12,13,14,15,16], but research on indoor air quality remains limited [17,18,19], mostly due to lack of instrumentation and a lack of awareness within the public.
In recent years, the growing use of low-cost air quality sensors (LCSs) for outdoor monitoring, along with the rapid rise in crowd-sourced measurements [20], has been accompanied by a significant increase in their indoor usage [21,22,23,24]. These devices are silent, compact, affordable, and user-friendly, making them valuable tools for both researchers and individuals in assessing indoor exposure. Furthermore, the widespread availability of LCSs enables enhanced spatial and temporal coverage in air quality monitoring [25].
Despite these advantages, the practical applicability of LCSs is frequently questioned by researchers and decision-makers due to concerns over their limited robustness, lower accuracy/precision, undocumented calibration method, and sensitivity to environmental conditions. As a result, frequent validation of their performance against reference-grade instruments is essential to assess their practical applicability [26,27]. Most studies focus on the comparison of LCSs with reference monitors in outdoor or controlled indoor environments. In general, these comparisons show various level of agreement between the LCSs and the reference instruments [28,29,30,31,32,33], and in many cases obviously post-processing is needed on LCS data [28] to obtain usable data. This suggests that these sensors can be used for characterizing PM2.5 load after appropriate data processing.
In the coming years, with the expected proliferation of indoor LCSs, comparison with reference grade instruments will clearly not be a feasible option for the general public. Alternative, novel methods are needed that offer the possibility of evaluating LCS performance to non-researchers with acceptable quality and interpretability. This study aims to offer such an alternative method that can potentially be useful for the public.
Here we focus on AirVisual Pro (IQAir, AG, Steinach, Switzerland) LCSs that were operated in two residential apartments in Central Europe (Budapest, Hungary) almost continuously for multiple years. AirVisual Pro provides near-real-time measurements of PM2.5 and carbon dioxide (CO2) concentrations indoors. The basic idea of our method is the exploitation of the CO2 readings to detect time periods when indoor air was mixed with outdoor air and the AirVisual Pro readings are potentially comparable with outdoor conditions. However, given the well-known spatio-temporal variability of PM2.5, attention was needed to select time periods when the outdoor air’s PM2.5 concentration potentially represented local conditions.
Our primary goal was to develop an algorithm that can be easily reproduced by citizens. To achieve this, we combine a CO2-based time period selection method with an assessment of the representativeness of outdoor monitoring stations, which involves evaluating their spatial and temporal heterogeneity. By defining the value of the so-called homogeneity criteria (when the overall PM2.5 can be considered as representative to the whole city), it becomes possible to filter AirVisual Pro data for the appropriate time periods that represent outdoor PM2.5, enabling relatively accurate evaluation of the sensors’ performance.
Our proposed method is applicable in cities where PM2.5 is regularly monitored by reference instruments. This approach offers a simple and accessible methodology for the general public to better understand and manage indoor air quality. The study contributes to the proliferation of citizen science in terms of indoor air quality.

2. Materials and Methods

2.1. Air Quality Monitors Used for Indoor Measurements

Three AirVisual Pro sensors were used in this study (Figure 1). The AirVisual Pro is a low-cost air quality monitoring device capable of measuring PM2.5 concentration and CO2 mixing ratio with high temporal resolution.
According to the manufacturer, the AirVisual Pro node is able to detect PM2.5 concentration in the particle size range of 0.3–2.5 µm, CO2 concentration in the effective range of 400–10,000 ppm, air temperature in the effective range of 10–40 °C, and relative humidity in the effective range of 0–95%. The AirVisual Pro sensor detects microscopic fine particles by an advanced optical sensor (AVPM25b) co-developed by IQAir [24]. Given that the sensor measures particle number and not particle mass, conversion is needed to obtain estimated PM2.5 values. However, this conversion is undocumented.
The AirVisual Pro device contains a SenseAir S8 (model SE-0031, SenseAir, Delsbo, Sweden) sensor that measures CO2 concentration [26]. The CO2 sensor provides a feature called automatic baseline correction (ABC). ABC means that the sensor is subject to self-calibration from time to time which ensures relatively good accuracy. ABC assumes that the node is exposed to open air conditions from time to time which means that occasionally it samples air with ~400 ppm CO2 concentration. This could be further clarified by considering that, in reality, this value is continuously increasing due to the increasing background CO2 concentration, as well as elevated CO2 concentration typically observed in urban environments. At present, CO2 concentration in a city environment is not expected to fall below ~415 ppm. As presumably the lowest value in the record observed within a time interval (typically detected during open window conditions, i.e., ventilated conditions, or when the device is moved outdoors) can be compared with the 400 ppm assumed baseline, adjustments can be made to ensure a relatively bias-free CO2 record. This smart feature provides reasonable CO2 readings for the long term and offers possibilities for CO2 data analysis (of course with suboptimal accuracy is some cases).
Once the AirVisual Pro is connected to the Internet, it can be configured to display outdoor air quality at selected locations, such as those operated by official air quality monitoring stations worldwide. When a nearby official monitoring station is selected, the sensor can also provide an approximate estimation of the outdoor values based on the available reference data.
The AirVisual Pro functions as an indoor air quality advisory device. It continuously monitors indoor conditions and compares them with outdoor data to provide recommendations for maintaining healthy air indoors. For example, if the indoor CO2 concentration is high and the outdoor PM2.5 level is low, AirVisual Pro suggests ventilation by opening the windows. Conversely, if the indoor CO2 concentration is low and the outdoor PM2.5 value is higher than the indoor one, it will recommend keeping windows closed to preserve indoor air quality and keep away polluted air.
When indoor PM2.5 levels are elevated—often due to consistently poor air quality outdoors—the device may suggest using an air purifier to improve air quality and protect residents’ health.
All sensor data is recorded in near real time and stored in the device’s built-in memory in a comma-separated values (CSV) format. This data can be downloaded to a personal computer when the AirVisual Pro is connected to the Internet.
Like other low-cost sensors, the AirVisual Pro may experience measurement drift over time. However, [26] found that the AirVisual Pro exhibited the lowest drift among the sensors evaluated in their study, a finding further supported by [22]. Despite these promising results, the long-term stability of the AirVisual Pro remains an open question and warrants further investigation in future studies.

2.2. Description of the Measurement Sites

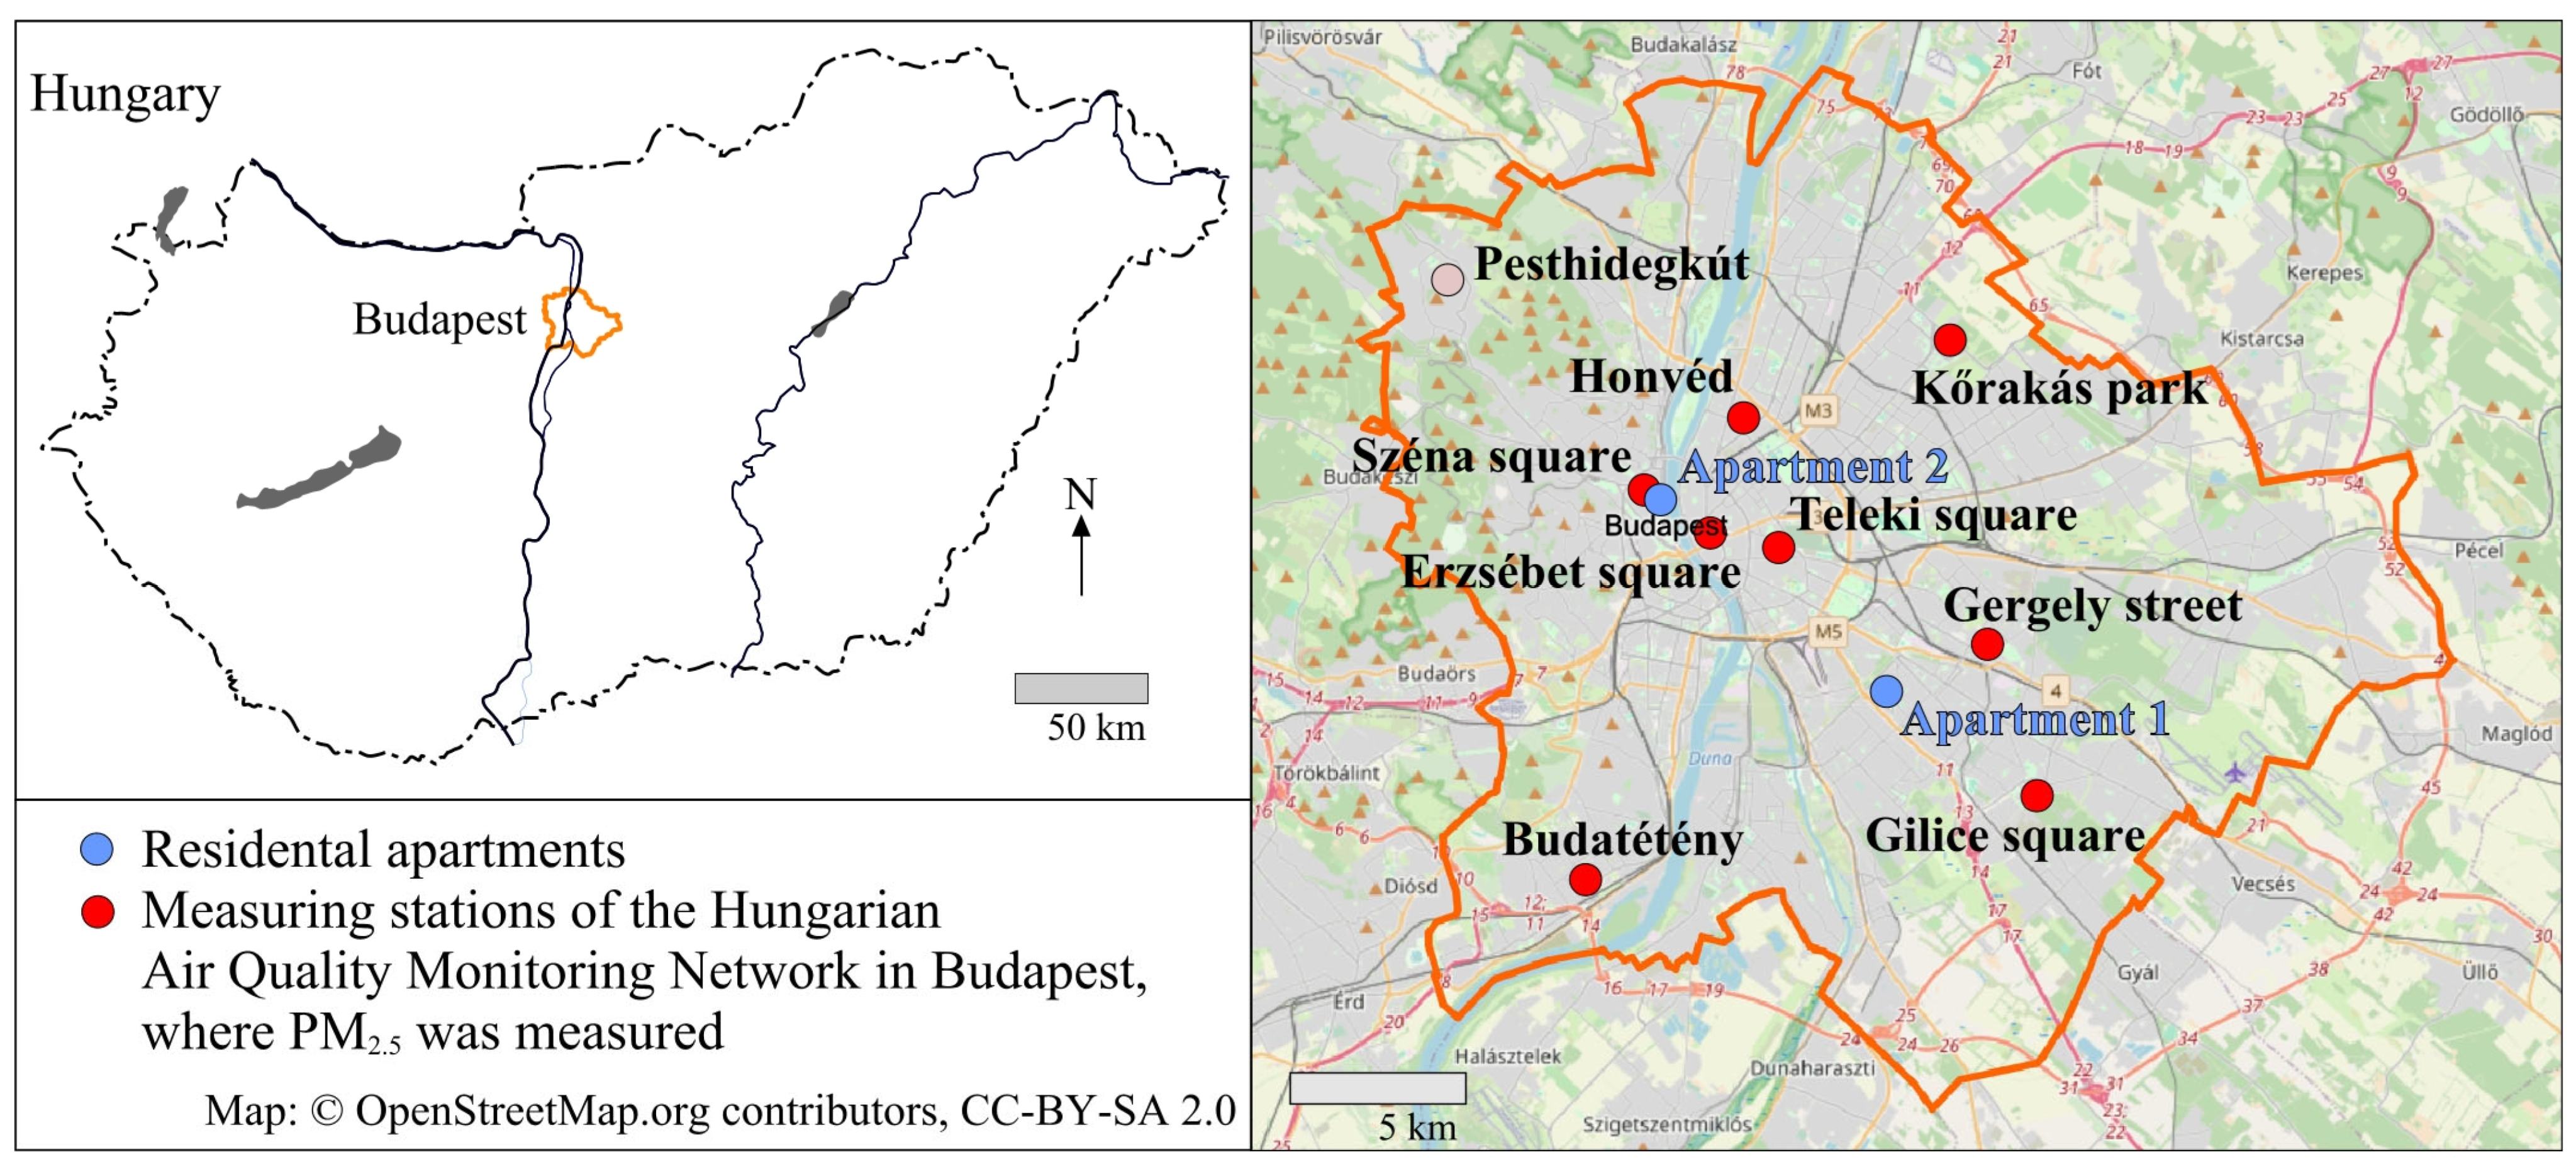
AirVisual Pro sensors were installed and operated in two residential apartments and in one outdoor storage room close to one of the apartments in Budapest, Hungary. One of the sensors (hereafter referred to as AirVisual 1) was placed in an apartment located in a suburban area of Budapest (47.46° N, 19.12° E; see Figure 2, marked as Apartment 1). The primary local source of PM2.5 pollution in this area was emissions from domestic heating systems in neighboring houses, along with occasional outdoor fires (wood burning, summer grill parties, etc.).
Measurements began in January, 2017. Initially, the AirVisual Pro was installed in the living room (approximately 18 m2), positioned near a window. After 1.5 years, the sensor was relocated to a small indoor storage room (approximately 1 m2 in size), which shares airspace with the kitchen and entrance hall. The new installation position was at a height of 150 cm, about 3 m from the entrance door and roughly 6 m from the kitchen.
The apartment was ventilated by opening windows a few times per day, with the duration of ventilation varying by season—longer in summer and shorter in winter to conserve energy and reduce heating costs. Air was also ventilated slowly but continuously due to a ventilator that sucked air from the apartment and pushed it into open air in a continuous fashion. An air purifier was introduced in early 2017, followed by the installation of a second unit in 2018. The air purifiers were not operated when windows were open; therefore, their influence on indoor PM2.5 levels applied only under closed-window conditions.
The second AirVisual Pro sensor (hereafter referred to as AirVisual 2) was installed at the end of March 2017 in an apartment located in a high-traffic downtown area of Budapest (47.51° N, 19.03° E; see Figure 2, marked as Apartment 2). In this location, the primary sources of PM2.5 were heating and vehicular traffic, as the apartment was situated approximately 550 m from a major public transportation junction.
AirVisual 2 was placed on a bookshelf in the living room (approximately 20 m2), at a height of around 1 m and 6–8 m from the kitchen. The apartment was naturally ventilated by opening the windows twice daily. During the summer months, the apartment was largely unoccupied, as the residents typically spend this period outside of Budapest. An air purifier was installed in the apartment in 2016.
The third AirVisual Pro sensor (hereafter referred to as AirVisual 3) was deployed in the outdoor storage space of Apartment 1 for a four-month monitoring period from August to November 2020. The sensor was placed on a table approximately 80 cm high, positioned in front of a window that remained open at all times, ensuring continuous ventilation. As a result, this location is considered representative of outdoor air conditions. The size of the storage room is approximately 5 m2.
The main characteristics of the apartments and sensor placements used in this study are summarized in Table 1. The study covers a six-year period (2017–2022) of data collection.

2.3. Hungarian Air Quality Monitoring Stations

Outdoor PM2.5 concentration data for the study period were obtained from the Hungarian Air Quality Monitoring (HAQM) Network [34]. HAQM currently operates nine PM2.5 monitoring stations in Budapest (see Figure 2); however, in the case of the present study, the Pesthidegkút station was excluded because it lies in a hilly region of Budapest and shows different impacts than urban stations. The remaining eight stations report hourly mean PM2.5 concentrations using reference-grade instruments: either an Enviro MP101M beta-attenuation monitor (ENVEA Global, Poissy, France) or a Grimm EDM 180 optical particle counter (GRIMM Aerosol Technik GmbH & Co. KG, Ainring, Germany). At four stations (Gilice Square, Kőrakás Park, Széna Square, Teleki Square), concentration data have been available since the very beginning of 2017, while at four other stations (Budatétény, Erzsébet Square, Gergely Street, Honvéd), PM2.5 concentration measurements started only in the second half of 2018.

2.4. Data Processing

2.4.1. Long-Term Indoor Air Quality Measurement Data

Two different types of AirVisual Pro sensors were used in the study. Two of them (operated indoors) were purchased in 2017 and 2018 and represent the first-generation model of AirVisual Pro. One additional sensor was acquired in 2020; this second-generation model offers greater customization and expanded functionality. Depending on the sensor generation the user can select from different operating modes. In the first-generation sensors there are two modes to choose from when operating the instrument: (i) a continuous mode that takes measurements every 10 s and (ii) a default mode that offers four readings per hour at regular time intervals, although the exact timing may vary depending on user interaction (see below for details). The second-generation device offers more options: (i) a continuous mode that takes measurements every 10 s, (ii) a custom mode that allows users to set measurement intervals ranging from 3 min to 1 h, and (iii) the default mode, which is similar to the earlier version; this mode provides four readings per hour at regular intervals, which may also be influenced by user activity.
The sampling frequency remains relatively stable when the AirVisual Pro operates unattended with the screen turned off. However, attention should be given to the special features of the default and custom mode settings if the device is actively used, which may result in the AirVisual Pro providing data with non-uniform data logging intervals [35]. Specifically, if the user activates or deactivates the screen or presses any button on the device, the data logging and measurement frequency switches to 10 s until it returns to the original frequency automatically after 10 min of screen inactivity.
In the frame of our investigation, indoor measurements were performed with two sensors (referred to as AirVisual 1 and AirVisual 2 in this study), which were capable of measuring in two modes: the default and the continuous mode (first-generation sensors). The instrument used for outdoor measurements (AirVisual 3) had all three modes available. For consistency and to help preserve device longevity, the default mode was selected for all three sensors.
High-resolution raw data were used to implement the ventilation detection method described in the following subsection. In addition, hourly and daily average values of concentrations were computed. Days with less than 15 h of available data were excluded from further analysis.
Based on the available data, a 6-year period of indoor measurements was analyzed for Apartment 1, while more than 5 years of measurements were used for Apartment 2. An additional data series is available for Apartment 1’s storage room, which, although indoors, was actually used to represent outdoor conditions (see above).

2.4.2. Detection of Ventilation

The basic idea of the low-cost sensor evaluation method is that we use sensor readings during open window (i.e., ventilated) conditions for comparison with the official HAQM. To achieve this goal, first it was necessary to identify the time periods when the apartments were exposed to outdoor conditions. Open window (i.e., ventilated) conditions were detected by analyzing the temporal variation inCO2 concentrations measured by the AirVisual Pro CO2 sensor. In order to identify the ventilation events in the two apartments, an interactive environment was created using R 3.5.1 (R Foundation for Statistical Computing, Vienna, Austria). When the windows were open, i.e., when ventilation took place, CO2 concentrations dropped due to the mixing between outdoor and indoor air. The temporal pattern of the CO2 time series enables us to identify those periods when the window was opened for at least 5 min. The timing of ventilation was determined manually, as objective methods were not attempted due to unexpected fluctuations caused by various effects (like breathing nearby, significant enrichment during nighttime, etc.).
The procedure assumed that ventilation events were primarily characterized by a rapid decline in indoor CO2 concentrations toward ambient levels. The degree of ventilation was not taken into account in this study, although it presumably depended on factors such as room size, ventilation duration, and outdoor wind speed.
In the analysis, the minimum CO2 concentration observed during each event was taken as the starting point of the corresponding ventilation event. The PM2.5 value measured at that specific time was then compared to the available reference data measured by the selected HAQM stations (see below).
It should be noted that indoor values represent a shorter period (typically 10–30 min), whereas outdoor data are hourly averages. As such, they do not correspond exactly in time. However, the comparison still provides a reasonable approximation of the reliability and accuracy of the low-cost sensors over an extended dataset.

2.4.3. Determining the Homogeneity/Heterogeneity of Outdoor PM2.5

In order to compare the PM2.5 readings obtained from low-cost sensors during open-window conditions with official measurements, the selection of a suitable reference value from HAQM was crucial. Our methodology was based on the following simple assumption. If the spatial (and spatio-temporal) variability of the HAQM data was high, it was an indicator of local effects, thus the target locations might also have been affected by nearby sources, thus comparison with the HAQM data would make no sense. In contrary, if the official network showed homogeneous readings (due to, e.g., non-local sources with high wind speed, or highly convective, well-mixed conditions) than the network was assumed to represent the local air at the residential sites, thus during ventilation the HAQM data was informative (e.g., its average was applicable to any location).
As detailed in Section 2.2, Budapest, covering an area of 525 km2, monitors PM2.5 at a maximum of 9 official monitoring stations (with data gaps, and with a lower number of stations in the beginning of the study period). Various methodologies, both simple and complex, are available in the literature for quantifying the spatial and temporal homogeneity of different air pollutants. Common metrics, such as correlation coefficients (r) between site pairs, the index of correlation (IC), variogram analysis, coefficient of variation (CV), and coefficient of divergence (COD) indicator, have been widely used [36,37,38,39,40,41]. However, the applicability of these metrics may vary due to different circumstances, and their thresholds are not universally standardized. This calls for the application of some methods that might not be universally applicable, but which, at the same time, are easy to calculate.
In this study, we applied two simple metrics to characterize spatial homogeneity/heterogeneity, both of which are easily applicable to citizen science contexts. The first metric is the coefficient of variation (CV), defined as
C V = σ n C ¯ n   ,
where σn is the standard deviation of PM2.5 concentration and C ¯ n is the average PM2.5 concentration from n available reference stations.
The second metric, referred to here as Range, captures the relative range of the measurements:
R a n g e = m a x n m i n n C ¯ n ,
where maxn and minn are the maximum and minimum PM2.5 concentration values, respectively, across n stations at a given time.
As mentioned above, we used data from eight monitoring stations within the study area. However, in order to provide representative data, we included only those time periods for which data from at least six stations were available (n ≥ 6).
In addition to assessing spatial homogeneity, we also evaluated spatio-temporal homogeneity by calculating the same metrics (CV and Range) over a predefined time window. To capture short-term spatio-temporal variability (i.e., stability of weather situations), we used a 5 h window centered on each time point, incorporating data from the current hour ±2 h at the available stations. Those variables are referred to as CV5h and Range5h. For this analysis, we only considered periods where data from at least six stations were available for all five hours:
C V 5 h = σ n ,   5 h C ¯ n ,   5 h ,
R a n g e 5 h = m a x n , 5 h m i n n ,   5 h C ¯ n ,   5 h
where the 5h subscript indicates that values are calculated using all available data over a 5 h period at n stations.
Clearly, it is not possible to objectively identify a single threshold that distinguishes between homogeneous and heterogeneous concentration levels. Therefore, we applied a statistical method (described below) to determine the appropriate threshold values.

2.4.4. Statistical Analysis

As a first step in our analysis, we identified the time periods during which ventilation happened in the two indoor environments (AirVisual 1 and AirVisual 2) based on characteristic changes in CO2 and PM2.5 concentrations (see above). Measurements taken in the storage room (AirVisual 3) were considered as outdoor data in the study and thus directly comparable with HAQM data during appropriate conditions.
Then we examined the data in order to find a well-defined, relatively universal homogeneity threshold for all four homogeneity metrics, supported by the subset of the HAQM data and the representative AirVisual readings.
We identified the threshold by calculating simple statistical metrics from the data, including the RMSE between the subsampled HAQM PM2.5 and AirVisual PM2.5, the slope and intercept of the linear regression fitted to the two datasets, the R2 (coefficient of determination), and bias. To estimate the uncertainty of the slope and intercept, we applied bootstrapping with 100 randomly selected samples from the filtered dataset. We used the RMSE and slope values to determine an appropriate RMSE threshold, as these metrics proved suitable for our purposes. Based on this, we set the final threshold using both the RMSE and homogeneity criteria. The result of the analysis was the determination of four thresholds for each homogeneity criteria (CV, Range, CV5h and Range5h).
After that, we performed two types of comparisons of the indoor and outdoor data for the selected subset of data. First, we selected the hourly data (or 5 h intervals) for which measurements from at least six reference measuring stations were available and the homogeneity criteria was fulfilled (i.e., keeping only those data that are characterized by a homogeneity value below the threshold), and compared the corresponding data with the AirVisual readings. Comparison was performed with simple linear regression in R environment. For each comparison between the low-cost sensor and the reference data, we calculated the slope of the linear regression and the R2.

3. Results and Discussion

3.1. Long-Term Indoor and Outdoor PM2.5 Concentration

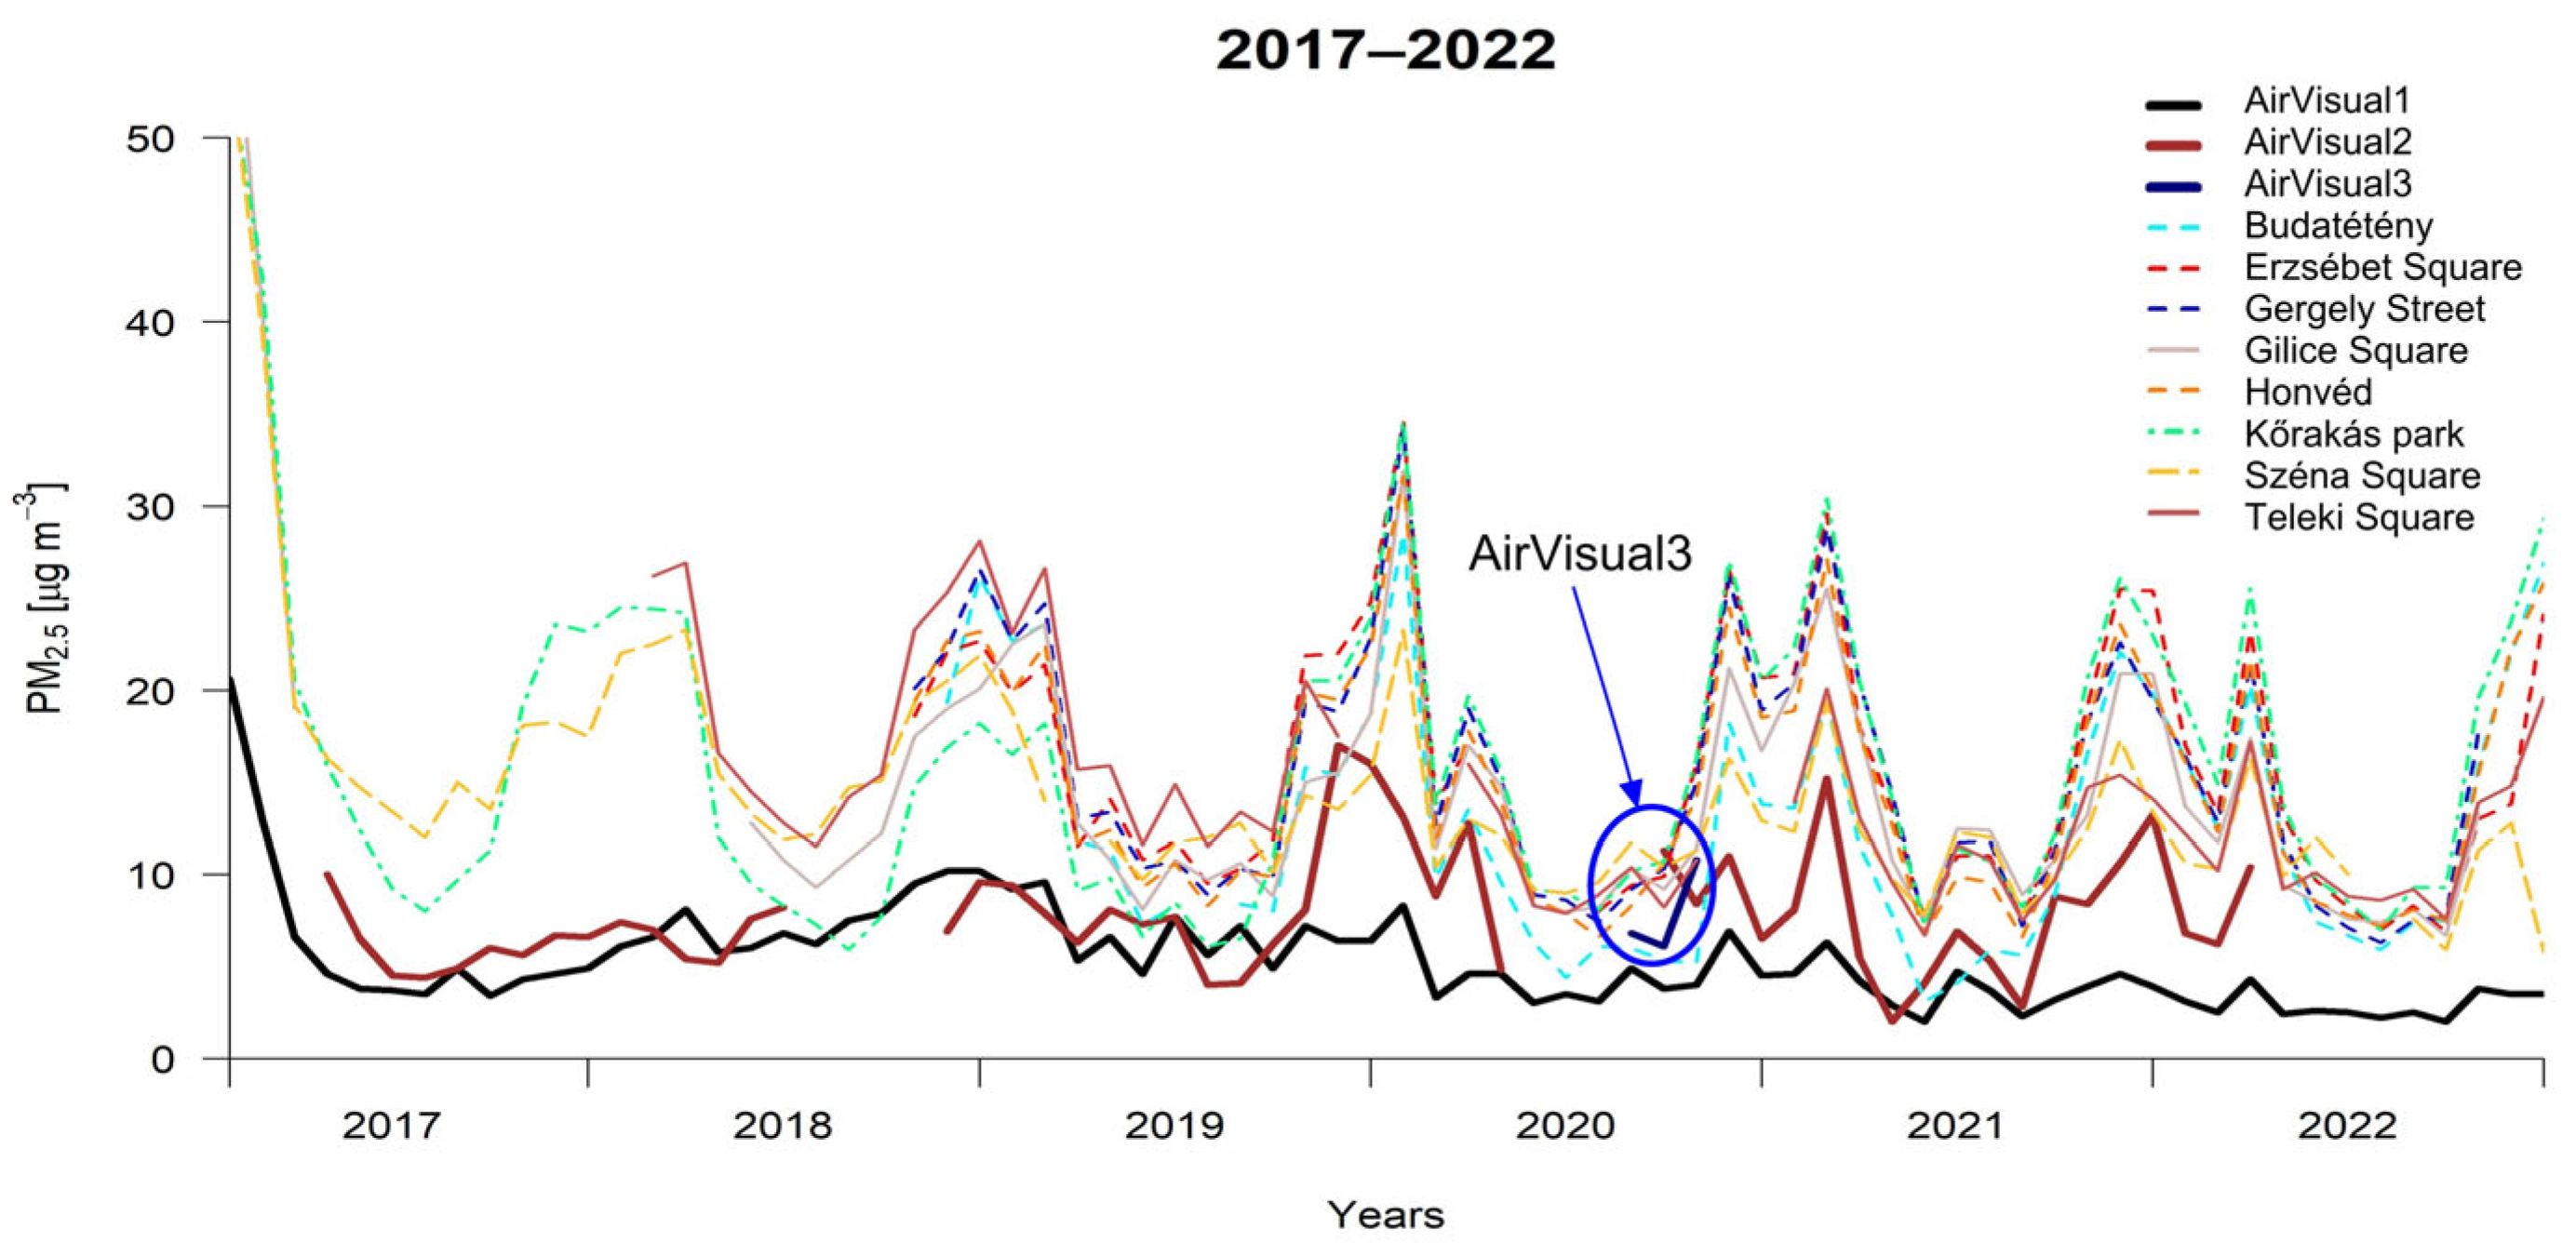
Six years of detailed indoor measurement data have provided information on the relationship between indoor and outdoor air quality. Using monthly averages, Figure 3 shows that the dynamics of indoor measurements track well with outdoor changes, but the differences between the time series are remarkable. During the months (typically the winter heating season) when outdoor PM2.5 concentrations were higher, indoor levels also increased. However, as previously expected, indoor levels were typically lower as air purifiers were used in both apartments. It has to be noted that considering only these measurement results, it remains unclear whether the AirVisual Pro sensors exhibit any systematic deviation from reference-grade measurements.

3.2. Results of Ventilation Detection

Over the six-year study period, we identified ventilation events in the two apartments by analyzing temporal changes in indoor CO2 concentration. A clear indication of ventilation was identified when indoor CO2 levels dropped sharply, while PM2.5 levels changed (typically rising), approaching outdoor concentrations. Using this method, we detected a total of 8124 ventilation events for the AirVisual 1 sensor in Apartment 1 and 1607 events for the AirVisual 2 sensor in Apartment 2. This discrepancy likely reflects differences in occupant lifestyle, time spent at home, and ventilation habits.
Figure 4 shows the diurnal variation in indoor PM2.5 and CO2 levels over two representative days, alongside hourly PM2.5 concentrations from the outdoor reference. The figures clearly highlight the varying degrees of spatial homogeneity and heterogeneity in air quality measurements across the city.
At a time of ventilation (defined as a point when CO2 concentration reached its minimum following a sudden decrease), we recorded the PM2.5 concentration measured by low-cost sensors and aligned it with the nearest hourly value. This dataset was then compared with hourly data from urban air quality monitoring stations after filtering the HAQM data based on homogeneity thresholds, as derived in the following sections.

3.3. Spatial Variability of PM2.5 Concentration

Due to varying weather conditions and airflow patterns, modulated by local sources like biomass burning, industry, traffic or household heating, even a nearby reference measurement (located within a few kilometers) might not be comparable to the indoor data measured during ventilation. To address this issue, our objective was to identify conditions under which PM2.5 concentrations across the city could be considered relatively homogeneous and minimally influenced by local emission sources. While complete homogeneity was unlikely—and could not be definitively confirmed due to the absence of a sufficiently dense observation network—our approach aimed to approximate such scenarios as closely as possible. The homogeneity criteria selection is described in the following subsection; first we analyze the extent to which reference measurements within the city can generally be considered as homogeneous based on the predefined metrics.
Table 2 shows the seasonal and annual averages and standard deviations of PM2.5 concentrations (in µg m–3) measured at eight monitoring stations in Budapest. PM2.5 levels were lowest during the summer months due to strong vertical mixing and lack of heating-related emissions. While PM levels can increase in some regions during the summer, e.g., due to forest fires or resuspended dust [42,43], this was not typical for the area under investigation, apart from a few isolated episodes (e.g., Saharan dust transport or dust appearing after a longer, drier period). Although there were significant relative differences between the individual stations, the standard deviation was low, indicating a more homogeneous distribution. In contrast, PM2.5 concentrations in winter were often two to four times higher than summer values due to increased emissions from heating (e.g., wood and waste burning in households) and frequent atmospheric inversions. The standard deviation was also highest in winter, indicating a more heterogeneous spatial distribution. The annual average was highest at Kőrakás Park (16.3 µg m−3) and lowest at Budatétény (12.8 µg m−3), suggesting that pollution levels varied based on urban location and proximity to emission sources. This called for a well-defined homogeneity criteria selection.
We examined the distribution of the homogeneity measures described in Section 2.4.3 (CV, Range, CV5h and Range5h) for the entire six-year period (Figure 5). Lower values always indicate stronger homogeneity (less spatial, or spatial and temporal variability at the same time). All four homogeneity indicators varied widely, and no clear threshold value emerged that would reliably distinguish homogeneous conditions. It meant that an additional method was needed to select the appropriate criteria.

3.4. Algorithm to Identify Homogeneity Threshold Applicable to the LCS Evaluation

In our study, we used a novel approach to identify the recommended threshold values below which the HAQM dataset could be considered as comparable to the AirVisual readings during ventilation. The method used calculated homogeneity criteria and statistics from the AirVisual–HAQM comparison to find a proper threshold for the homogeneity measures (CV, Range, CV5h and Range5h).
First, we created a filtered dataset of AirVisual data that were comparable with the average of the reference monitoring station data (i.e., ventilated PM2.5 level). Table 3 summarizes the number of data points available for comparison between the low-cost sensors and the reference stations.
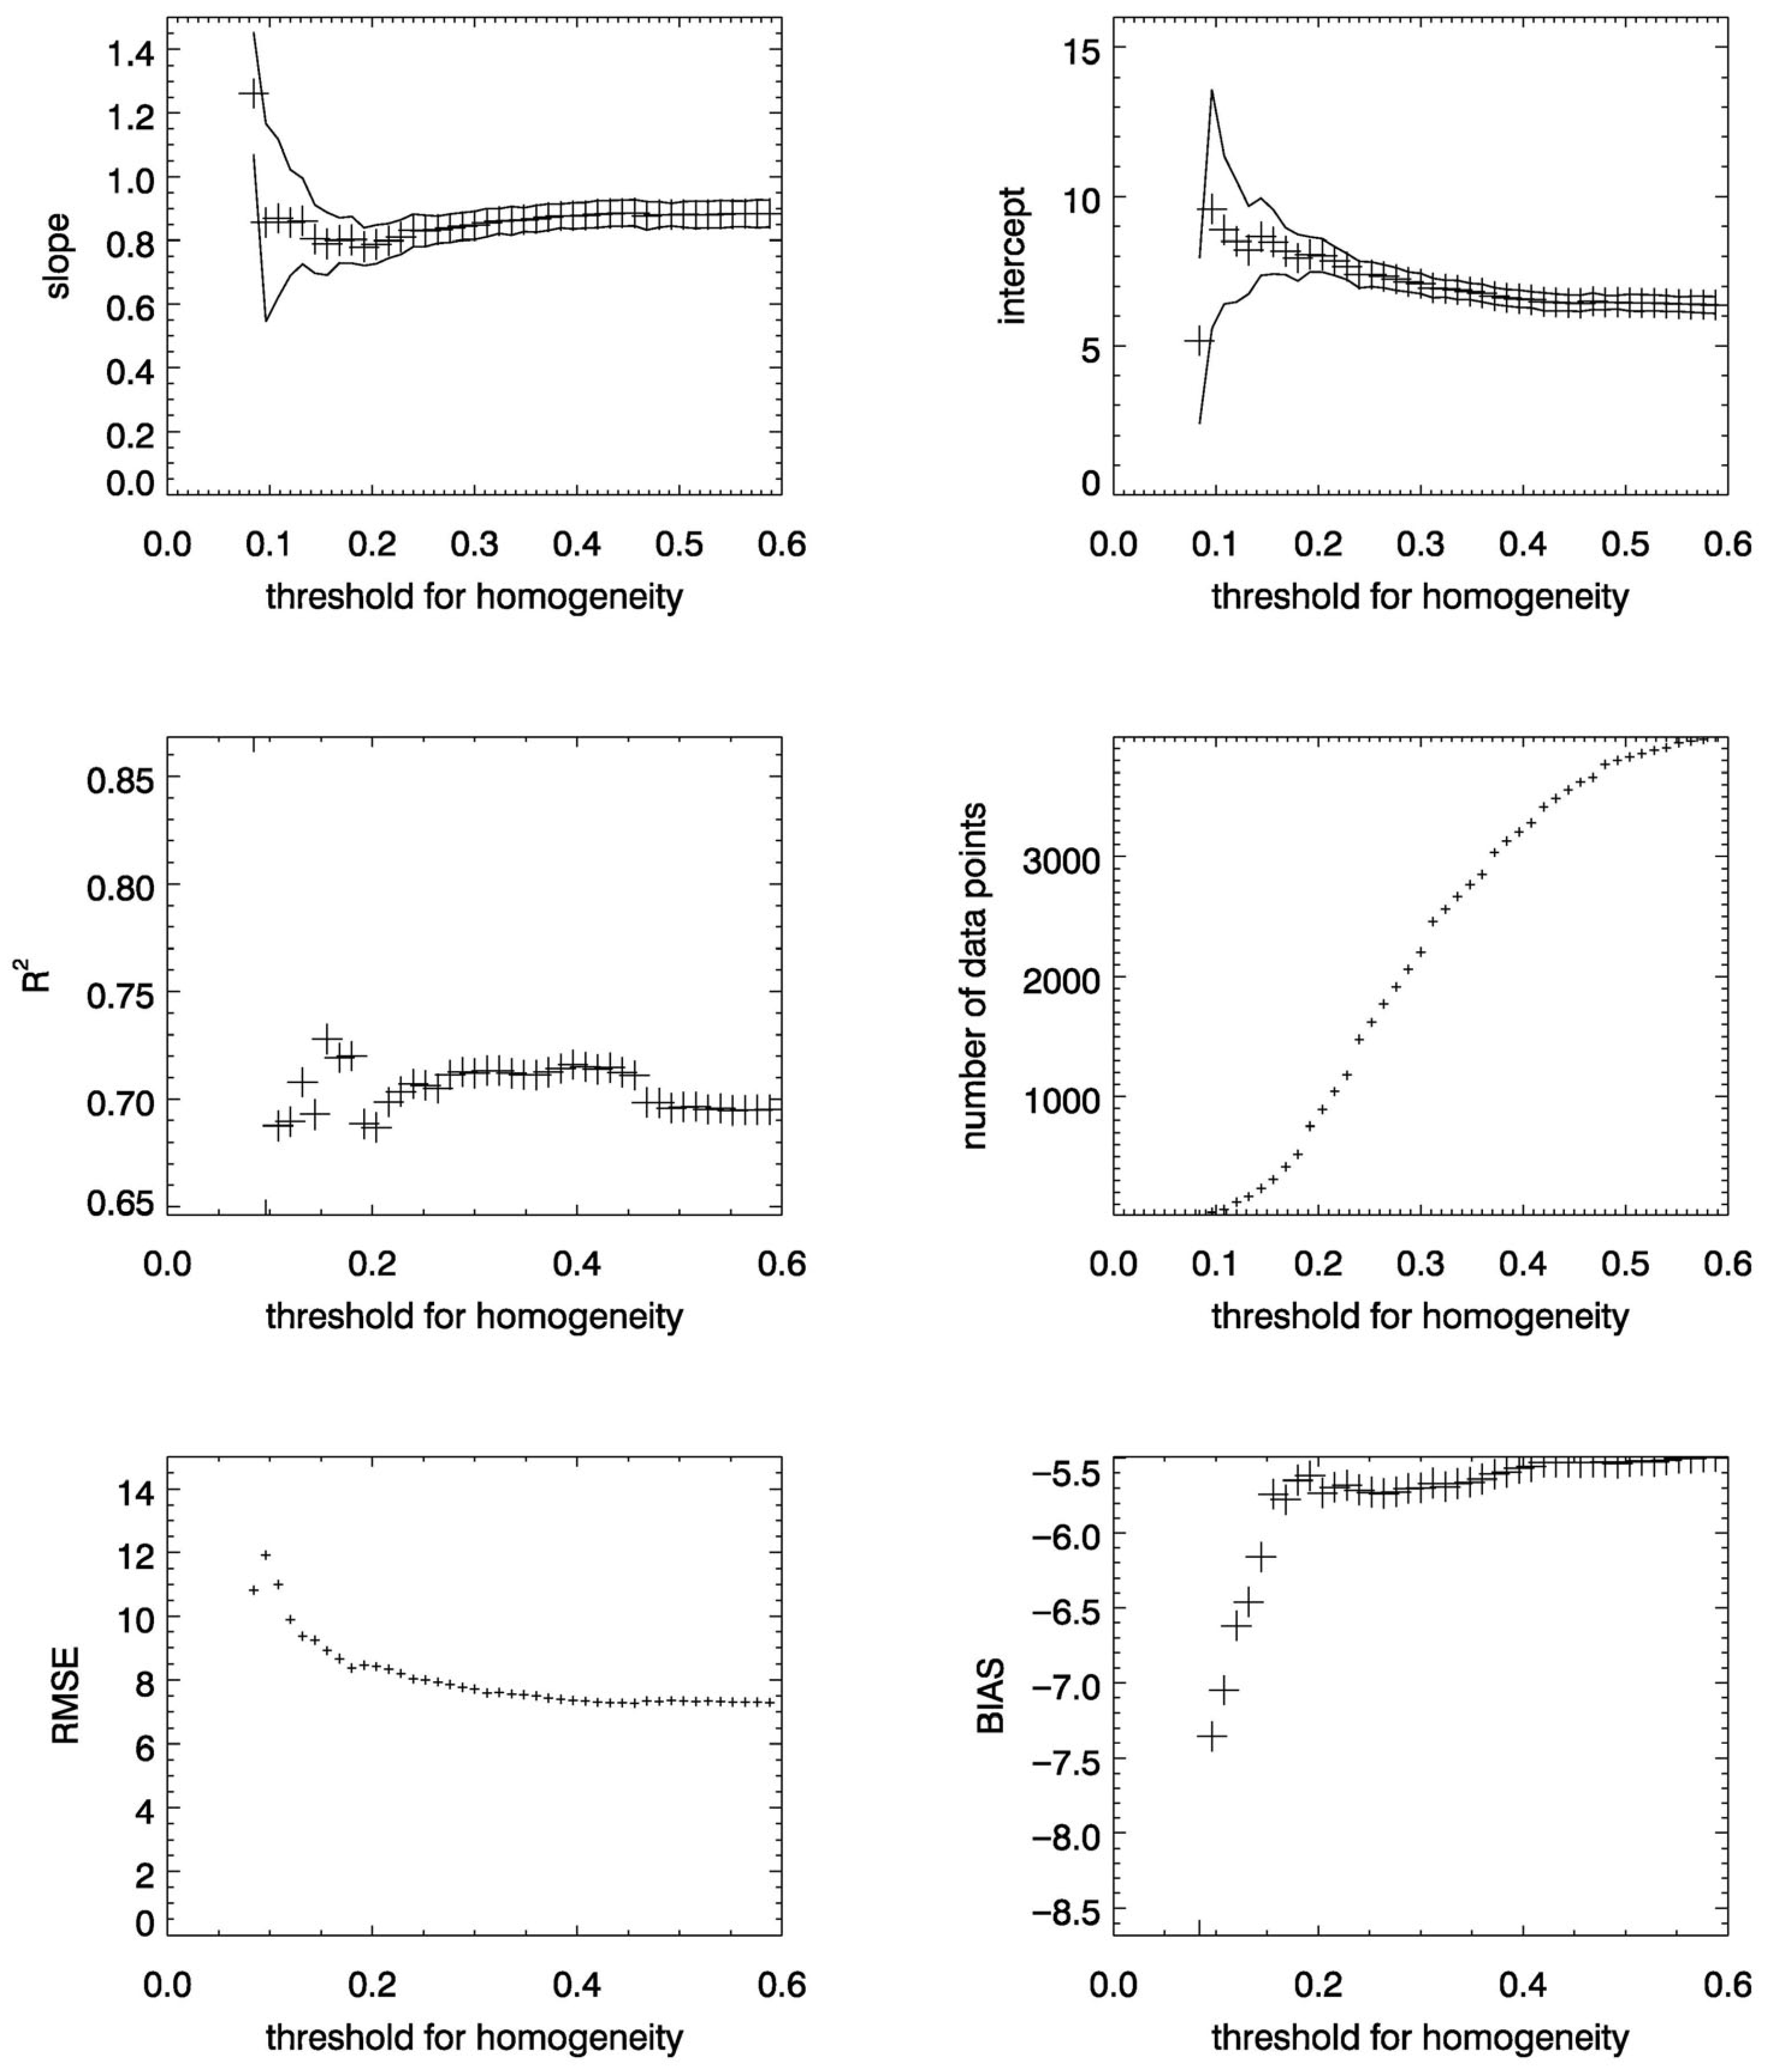
Applying the line fitting and bootstrapping methods to the appropriate database, we calculated statistical measures (see Section 2) using the values measured by low-cost sensors and the values of reference stations after applying multiple thresholds. Figure 6 shows an example of the statistics where the x-axis represents the selected homogeneity criteria. The y value for a given x value refers to the statistics that were calculated using all the HAQM data below the given x threshold (Figure 6). The Supplementary Material (Figures S1–S11) contains plots for all sites and for all homogeneity criteria.
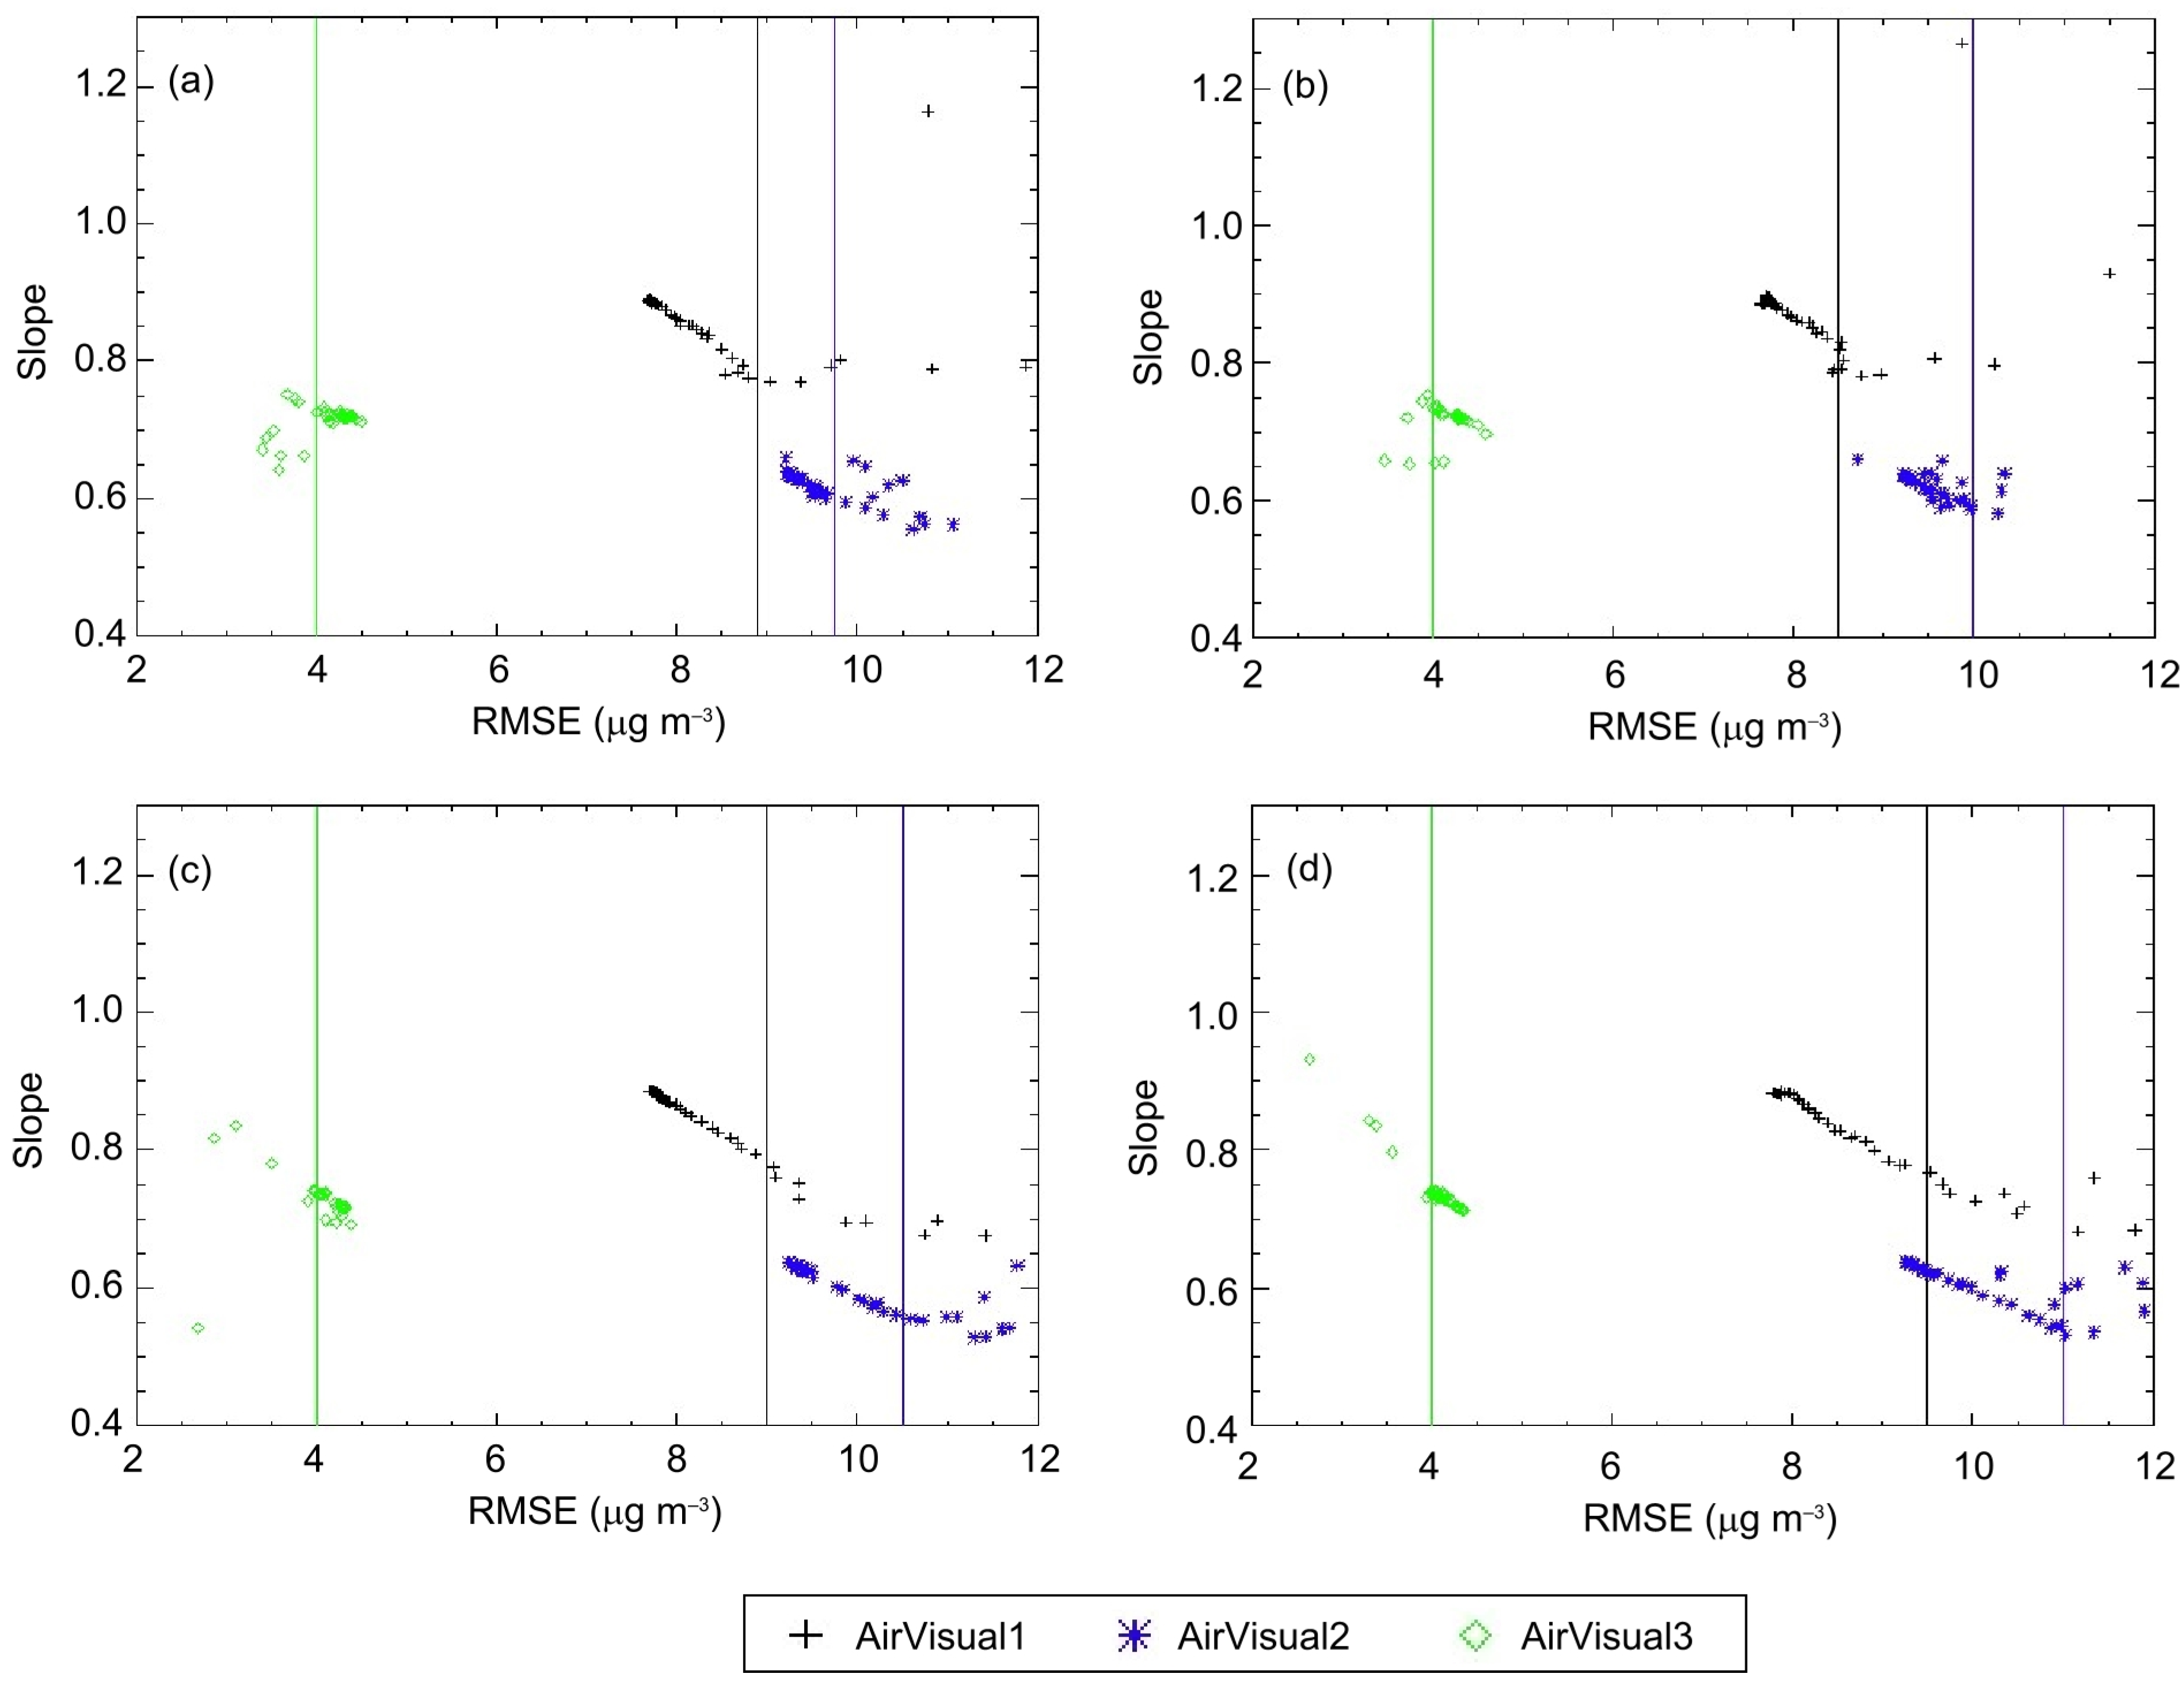
According to Figure 6 the statistical indicators changed as the homogeneity threshold became stricter (from high to low homogeneity values). But still, it was not straightforward to select a threshold for homogeneity. Because of this finding, another analysis was performed with graphics that combined RMSE and the calculated slopes (Figure 7). Note that in Figure 7 the slope and RMSE value pairs correspond to the specific threshold values presented in Figure 6.
Based on Figure 7 it can be observed that, for all three sensors and for all four stability metrics, the slope values can be divided into two distinct groups. In one group, the variation is nearly linear as the function of RMSE (for indoor sensors RMSE increases with stricter threshold; for the outdoor sensor RMSE decreases with stricter threshold), while in the other group, the slope values are more scattered. For all three sensors, we visually detected the RMSE value that separated the two groups. It is important to note that more sophisticated methods, such as breakpoint detection, could have been used, but since our aim was to select a single criteria applicable for all three sensors, visual identification was found to be appropriate and sufficient.
After the visual selection of the RMSE thresholds (indicated by vertical lines in Figure 7), we applied this threshold to assess the homogeneity criteria using the RMSE versus homogeneity criteria graphs. Figure 8 demonstrates the approach for CV. The selected RMSE from the above step was drawn onto the plots (see horizontal lines in Figure 8), and the homogeneity criteria was determined at the point where the relatively stable RMSE changed behavior and became hectic. This selected homogeneity criteria can thus be considered as a trade-off between the fitting stability (expressed by the change in the slope and intercept) and the RMSE, which became too high as the number of data points decreased (caused by the undefined variability of readings). In addition to the figures, Figure 8 also indicates the number of data pairs available for evaluating the LCS performance during ventilation in each case.
We selected a value of CV = 0.27 for the homogeneity threshold, considering all three sensors together. Time periods characterized with CV below this threshold were considered as homogeneous, which supports the evaluation of the LCSs. The corresponding figures in the Supplementary Material (Figures S12–S14) demonstrate the threshold selection for the other stability metrics. The final threshold for CV5h was 0.27, for Range was 0.75, and for Range5h was 1.0.

3.5. Evaluation of the LCSs Using Ventilation Events

With the identification of the threshold for homogeneity for the four defined metrics, and with the subset of AirVisual readings representing outdoor conditions, comparison of LCS data with HAQM could be performed. This evaluation was performed to see the overall bias in the LCS data and thus the possibility of adjusting the data by a simple linear correction. We used the mean of all available 1 h average HAQM station data for the evaluation, which was justified by the low heterogeneity of the subset. Note that for AirVisual 3, all readings were used, as the sensor was considered as outdoors. Urban air quality was found to be relatively homogeneous in approximately 40–50% of the sampling periods.
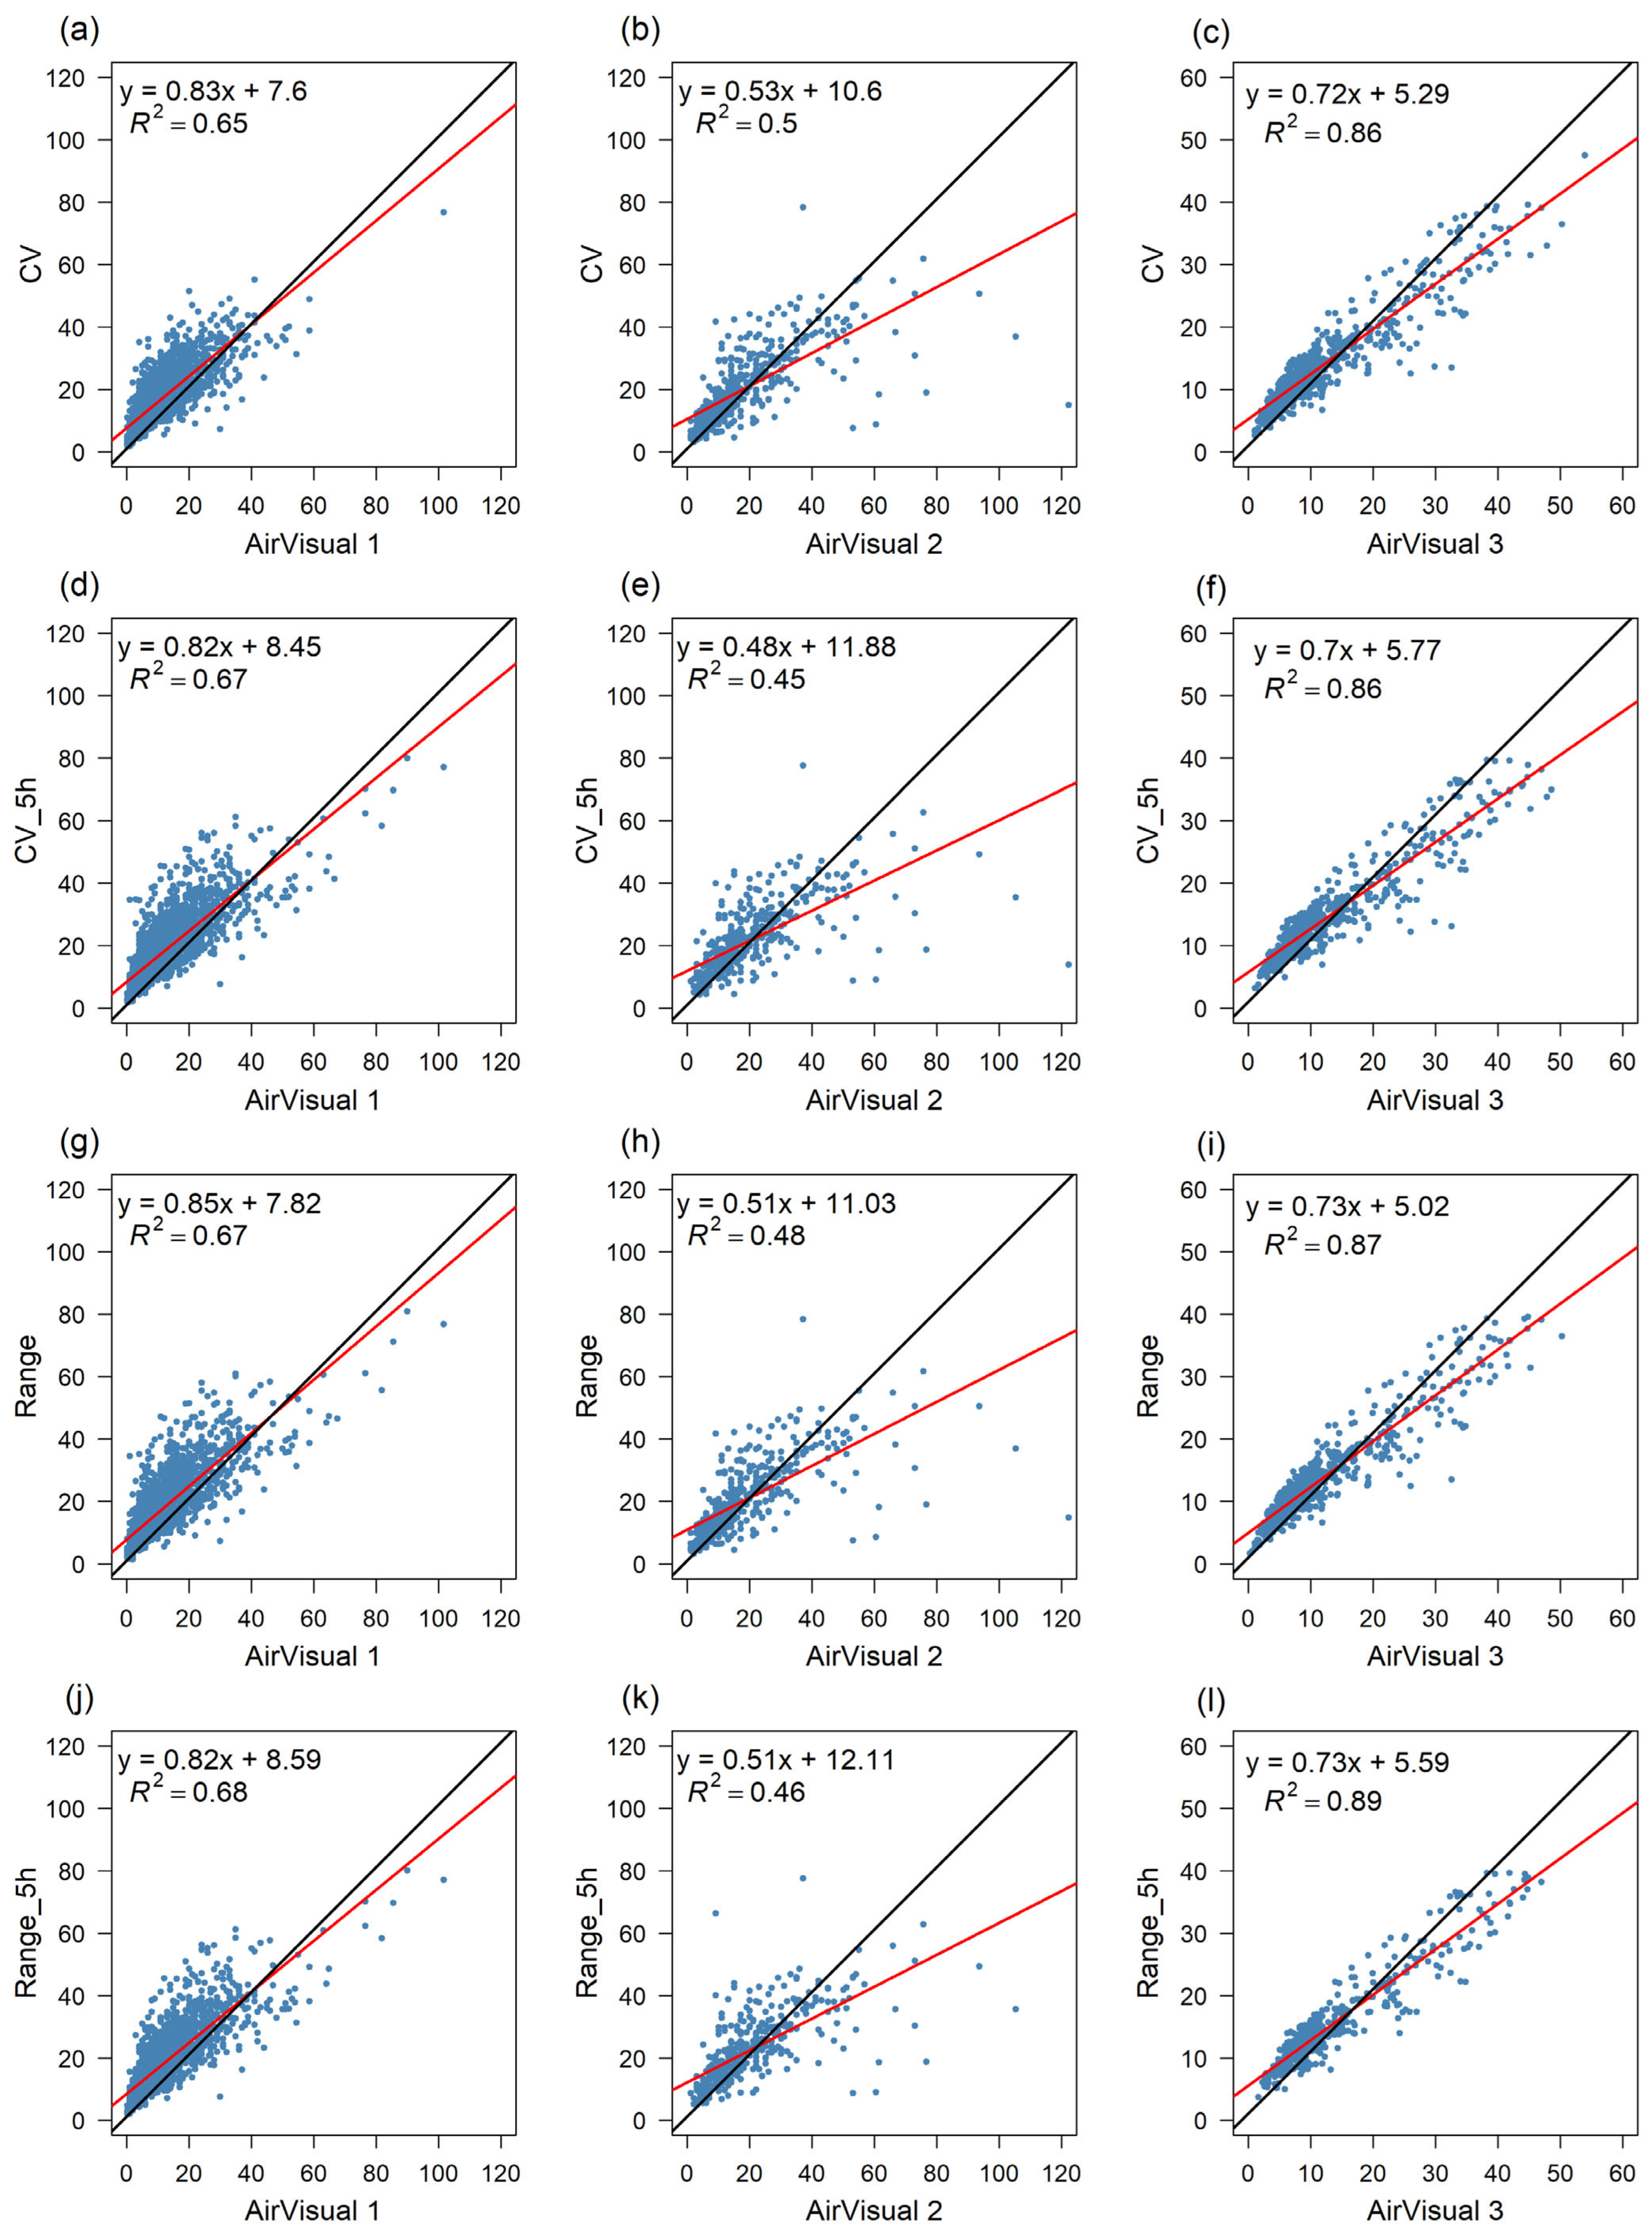
Figure 9 shows the results of the comparison for the selected homogeneous situations in the case of each of the four metrics. It appears that the individual homogeneity criteria alter the results only slightly. This is true even when temporally extended homogeneity (5 h time window) was taken into account. The slopes of the linear regression models—which reflect the degree of under- or overestimation by the AirVisual sensors—range from 0.83 to 0.85 for AirVisual 1, 0.48–0.53 for AirVisual 2, and 0.70–0.73 for AirVisual 3. Corresponding R2 values vary between 0.65 and 0.68, 0.45–0.50, and 0.86–0.89, respectively.
Based on the results it can be concluded that AirVisual 1 typically provided less biased data, while AirVisual 2 was more biased, which highlights the importance of the evaluation of each sensor separately. The resulting linear regression could be used to adjust sensor data. The strongest correlation was observed with the sensor placed in the storage, which also overestimated the real PM2.5 concentration. The results indicate that no generalized correction equation could be constructed, which means that the AirVisual sensors differed in their bias.
In addition to the above analyses, we also compared the measurements from the three low-cost sensors with data from the nearest official reference monitoring stations (Figure 10). For the AirVisual 1 and AirVisual 2 sensors, only data recorded during identified ventilation periods were considered. In contrast, the full dataset was used for the AirVisual 3 sensor. The closest reference station to Apartment 1 (used with AirVisual 1 and AirVisual 3) was located approximately 3 km away at Gergely Street, while the nearest station to Apartment 2 (used with AirVisual 2) was situated just a few hundred meters away at Széna Square (see Figure 2).
Although in the case of Apartment 2 (Figure 10b), the reference station was significantly closer to the measurement site than in the case of Apartment 1 (Figure 10a,c), the correlation between indoor and outdoor measurements was stronger at Apartment 1. This was likely due to the more complex urban environment surrounding Apartment 2, which is located in a dense downtown area. In the case of Apartment 1, the differences between the two types of measurements may also have been influenced by the duration of the monitoring periods. Indoor data were collected over a six-year period, whereas measurements from the storage building were limited to just four months, which does not capture full seasonal variability.
The slopes in Figure 10 differ from those calculated with the homogeneity criteria (Figure 9). The slope for AirVisual 1 is 1.04 (as opposed to 0.83–0.85, derived from the homogeneous cases), 0.43 for AirVisual 2 (0.48–0.53 was the best estimate), and 0.44 for AirVisual 3 (in contrast to 0.70–0.73, which comes from the homogeneous cases).
The results indicate that relying on data from a single reference station resulted in a weaker correlation compared to analyses that included multiple stations—even those located farther away—when only homogeneous cases were considered. Also, the slopes (i.e., indicators of sensor bias) for AirVisual 1 and AirVisual 3 were considerably different from those calculated using the all-station comparison mean (Figure 8), which means that information from the closest station should be treated with caution. Our recommendation is to use the above-described homogeneity criteria and the mean of the reference stations during ventilation events for AirVisual evaluation.

4. Conclusions

Low-cost air quality sensors are increasingly used worldwide to monitor indoor air pollution; however, their accuracy and reliability remain a subject of serious concern. In this study, we evaluated data from three AirVisual air quality sensors using a novel approach. Over a six-year period, we identified ventilation events for two apartments based on changes in CO2 concentration levels measured by the sensors. During these periods, we compared the indoor PM2.5 data with available outdoor measurements. Our results showed that relying on a single, even nearby, reference station yielded misleading results in two of the three cases (in terms of sensor precision expressed by the slope) compared to relying on multiple stations, with the criteria that the stations represented sufficiently homogeneous PM2.5 data over the network.
This approach assumes the availability of reference measurements from several locations within a city. Given the potentially high spatial variability of PM2.5 in large urban areas, we focused on identifying periods and locations where the data across different monitoring stations could be considered homogeneous. We applied a few homogeneity metrics that can be calculated even by non-experts and found no substantial differences between them in terms of applicability. By placing a sensor in outdoor-like conditions for an extended period and selecting cases when PM2.5 is spatially and perhaps temporally homogeneous, we demonstrated that low-cost sensors can be effectively evaluated against reference instruments without the need for controlled laboratory conditions or co-located campaigns. The fitted regression lines can be used to adjust the data so that relatively unbiased PM2.5 readings can be gained indoors. This is a major achievement, with an option to extend citizen science and environmental awareness within the population.
Further research is needed to improve the evaluation using additional data filtering and careful data analysis. Additionally, in this study the ventilation detection was performed manually, which is not reproducible, hence automatic ventilation detection method development is highly needed, possibly supported by open-source computer code, e.g., disseminated via GitHub. Also, spatial heterogeneity needs attention, and also conditions that can potentially affect LCS performance need to be studied as they critically affect readings.

Supplementary Materials

The following supporting information can be downloaded at https://www.mdpi.com/article/10.3390/atmos16090998/s1, Figure S1. Relationship between the homogeneity criteria and the selected statistical measures. Number of data points used for the calculations is also indicated (middle plot in the right hand side). This graph is for AirVisual 1 and homogeneity criteria CV5h. In the upper two plots the symbols represent the slopes and intercepts, while the continuous line is the uncertainty of the fit based on bootstrapping. Figure S2. Relationship between the homogeneity criteria and the selected statistical measures. Number of data points used for the calculations is also indicated (middle plot in the right hand side). This graph is for AirVisual1 and homogeneity criteria Range. In the upper two plots the symbols represent the slopes and intercepts, while the continuous line is the uncertainty of the fit based on bootstrapping. Figure S3. Relationship between the homogeneity criteria and the selected statistical measures. Number of data points used for the calculations is also indicated (middle plot in the right hand side). This graph is for AirVisual 1 and homogeneity criteria Range5h. In the upper two plots the symbols represent the slopes and intercepts, while the continuous line is the uncertainty of the fit based on bootstrapping. Figure S4. Relationship between the homogeneity criteria and the selected statistical measures. Number of data points used for the calculations is also indicated (middle plot in the right hand side). This graph is for AirVisual 2 and homogeneity criteria CV. In the upper two plots the symbols represent the slopes and intercepts, while the continuous line is the uncertainty of the fit based on bootstrapping. Figure S5. Relationship between the homogeneity criteria and the selected statistical measures. Number of data points used for the calculations is also indicated (middle plot in the right hand side). This graph is for AirVisual 2 and homogeneity criteria CV5h. In the upper two plots the symbols represent the slopes and intercepts, while the continuous line is the uncertainty of the fit based on bootstrapping. Figure S6. Relationship between the homogeneity criteria and the selected statistical measures. Number of data points used for the calculations is also indicated (middle plot in the right hand side). This graph is for AirVisual 2 and homogeneity criteria Range. In the upper two plots the symbols represent the slopes and intercepts, while the continuous line is the uncertainty of the fit based on bootstrapping. Figure S7. Relationship between the homogeneity criteria and the selected statistical measures. Number of data points used for the calculations is also indicated (middle plot in the right hand side). This graph is for AirVisual 2 and homogeneity criteria Range5h. In the upper two plots the symbols represent the slopes and intercepts, while the continuous line is the uncertainty of the fit based on bootstrapping. Figure S8. Relationship between the homogeneity criteria and the selected statistical measures. Number of data points used for the calculations is also indicated (middle plot in the right hand side). This graph is for AirVisual 3 and homogeneity criteria CV. In the upper two plots the symbols represent the slopes and intercepts, while the continuous line is the uncertainty of the fit based on bootstrapping. Figure S9. Relationship between the homogeneity criteria and the selected statistical measures. Number of data points used for the calculations is also indicated (middle plot in the right hand side). This graph is for AirVisual 3 and homogeneity criteria CV5h. In the upper two plots the symbols represent the slopes and intercepts, while the continuous line is the uncertainty of the fit based on bootstrapping. Figure S10. Relationship between the homogeneity criteria and the selected statistical measures. Number of data points used for the calculations is also indicated (middle plot in the right hand side). This graph is for AirVisual 3 and homogeneity criteria Range. In the upper two plots the symbols represent the slopes and intercepts, while the continuous line is the uncertainty of the fit based on bootstrapping. Figure S11. Relationship between the homogeneity criteria and the selected statistical measures. Number of data points used for the calculations is also indicated (middle plot in the right hand side). This graph is for AirVisual 3 and homogeneity criteria Range5h. In the upper two plots the symbols represent the slopes and intercepts, while the continuous line is the uncertainty of the fit based on bootstrapping. Figure S12. Changes in RMSE values according to individual threshold values (a) and the corresponding n numbers (b). Vertical line represents the selected homogeneity criteria of CV5h, while in the left plot the horizontal lines represent the breakpoints selected based on Figure 7 in the main text. Figure S13. Changes in RMSE values according to individual threshold values (a) and the corresponding n numbers (b). Vertical line represents the selected homogeneity criteria of Range, while in the left plot the horizontal lines represent the breakpoints selected based on Figure 7 in the main text. Figure S14. Changes in RMSE values according to individual threshold values (a) and the corresponding n numbers (b). Vertical line represents the selected homogeneity criteria of Range5h, while in the left plot the horizontal lines represent the breakpoints selected based on Figure 7 in the main text.

Author Contributions

Conceptualization, R.M., Z.B. and B.A.; methodology, R.M., Z.B., B.A., R.H. and V.G.; software, Z.B., R.H. and E.K.; investigation, R.M. and B.A.; resources, R.M., Z.B., B.A., Á.V.T. and V.G.; data curation, R.M., Z.B., B.A., E.K. and Á.V.T.; writing—original draft, R.M. and Z.B.; writing—review & editing, R.M., Z.B., Á.V.T. and V.G.; visualization, R.M., Z.B., B.A. and R.H.; supervision, R.M. All authors have read and agreed to the published version of the manuscript.

Funding

This work was implemented by the National Multidisciplinary Laboratory for Climate Change (RRF-2.3.1-21-2022-00014) project within the framework of Hungary’s National Recovery and Resilience Plan, supported by the Recovery and Resilience Facility of the European Union. This research was supported by the Hungarian National Scientific Research Fund (NKFIH K-146315 and K-146322) and was also supported by the “Advanced methods of greenhouse gases emission reduction and sequestration in agriculture and forest landscape for climate change mitigation” (CZ.02.01.01/00/22_008/0004635) project.

Institutional Review Board Statement

Not applicable.

Informed Consent Statement

Not applicable.

Data Availability Statement

The raw data supporting the conclusions of this article will be made available by the authors on request. Official air quality data are available at the website of the Hungarian Meteorological Service: https://levegokornyezet.met.hu/en (accessed on 3 August 2025).

Acknowledgments

The authors would like to express their sincere gratitude to Dóra Hidy for providing data of AirVisual 2 sensor.

Conflicts of Interest

The authors declare no conflict of interest.

References

  1. Chen, C.; Zhao, B. Review of Relationship between Indoor and Outdoor Particles: I/O Ratio, Infiltration Factor and Penetration Factor. Atmos. Environ. 2011, 45, 275–288. [Google Scholar] [CrossRef]
  2. Leung, D.Y.C. Outdoor-Indoor Air Pollution in Urban Environment: Challenges and Opportunity. Front. Environ. Sci. 2015, 2, 69. [Google Scholar] [CrossRef]
  3. Hoskins, J.A. Health Effects Due to Indoor Air Pollution. Indoor Built Environ. 2003, 12, 427–433. [Google Scholar] [CrossRef]
  4. Tran, V.V.; Park, D.; Lee, Y.-C. Indoor Air Pollution, Related Human Diseases, and Recent Trends in the Control and Improvement of Indoor Air Quality. Int. J. Environ. Res. Public Health 2020, 17, 2927. [Google Scholar] [CrossRef]
  5. Schweizer, C.; Edwards, R.D.; Bayer-Oglesby, L.; Gauderman, W.J.; Ilacqua, V.; Jantunen, M.J.; Lai, H.K.; Nieuwenhuijsen, M.; Künzli, N. Indoor Time-Microenvironment-Activity Patterns in Seven Regions of Europe. J. Expo. Sci. Environ. Epidemiol. 2007, 17, 170–181. [Google Scholar] [CrossRef]
  6. Klepeis, N.E.; Nelson, W.C.; Ott, W.R.; Robinson, J.P.; Tsang, A.M.; Switzer, P.; Behar, J.V.; Hern, S.C.; Engelmann, W.H. The National Human Activity Pattern Survey (NHAPS): A Resource for Assessing Exposure to Environmental Pollutants. J. Expo. Sci. Environ. Epidemiol. 2001, 11, 231–252. [Google Scholar] [CrossRef]
  7. Al-Kindi, S.G.; Brook, R.D.; Biswal, S.; Rajagopalan, S. Environmental Determinants of Cardiovascular Disease: Lessons Learned from Air Pollution. Nat. Rev. Cardiol. 2020, 17, 656–672. [Google Scholar] [CrossRef]
  8. Ezzati, M.; Kammen, D.M. Quantifying the Effects of Exposure to Indoor Air Pollution from Biomass Combustion on Acute Respiratory Infections in Developing Countries. Environ. Health Perspect. 2001, 109, 481–488. [Google Scholar] [CrossRef]
  9. Sarigiannis, D.A.; Karakitsios, S.P.; Gotti, A.; Liakos, I.L.; Katsoyiannis, A. Exposure to Major Volatile Organic Compounds and Carbonyls in European Indoor Environments and Associated Health Risk. Environ. Int. 2011, 37, 743–765. [Google Scholar] [CrossRef]
  10. Shetty, B.S.P.; D’Souza, G.; Padukudru Anand, M. Effect of Indoor Air Pollution on Chronic Obstructive Pulmonary Disease (COPD) Deaths in Southern Asia—A Systematic Review and Meta-Analysis. Toxics 2021, 9, 85. [Google Scholar] [CrossRef]
  11. Vardoulakis, S.; Giagloglou, E.; Steinle, S.; Davis, A.; Sleeuwenhoek, A.; Galea, K.S.; Dixon, K.; Crawford, J.O. Indoor Exposure to Selected Air Pollutants in the Home Environment: A Systematic Review. Int. J. Environ. Res. Public Health 2020, 17, 8972. [Google Scholar] [CrossRef] [PubMed]
  12. Ferenczi, Z.; Imre, K.; Lakatos, M.; Molnár, Á.; Bozó, L.; Homolya, E.; Gelencsér, A. Long-Term Characterization of Urban PM10 in Hungary. Aerosol Air Qual. Res. 2021, 21, 210048. [Google Scholar] [CrossRef]
  13. Molnár, A.; Imre, K.; Ferenczi, Z.; Kiss, G.; Gelencsér, A. Aerosol Hygroscopicity: Hygroscopic Growth Proxy Based on Visibility for Low-Cost PM Monitoring. Atmos. Res. 2020, 236, 104815. [Google Scholar] [CrossRef]
  14. Qor-el-aine, A.; Béres, A.; Géczi, G. Calibration of CAMS PM2.5 Data over Hungary: A Machine Learning Approach. Environ. Res. Commun. 2024, 6, 075026. [Google Scholar] [CrossRef]
  15. Varga-Balogh, A.; Leelőssy, Á.; Mészáros, R. Effects of COVID-Induced Mobility Restrictions and Weather Conditions on Air Quality in Hungary. Atmosphere 2021, 12, 561. [Google Scholar] [CrossRef]
  16. Varga-Balogh, A.; Leelőssy, Á.; Lagzi, I.; Mészáros, R. Time-Dependent Downscaling of PM2.5 Predictions from CAMS Air Quality Models to Urban Monitoring Sites in Budapest. Atmosphere 2020, 11, 669. [Google Scholar] [CrossRef]
  17. Szabados, M.; Magyar, D.; Tischner, Z.; Szigeti, T. Indoor Air Quality in Hungarian Passive Houses. Atmos. Environ. 2023, 307, 119857. [Google Scholar] [CrossRef]
  18. Szabados, M.; Kakucs, R.; Páldy, A.; Kotlík, B.; Kazmarová, H.; Dongiovanni, A.; Di Maggio, A.; Kozajda, A.; Jutraz, A.; Kukec, A.; et al. Association of Parent-Reported Health Symptoms with Indoor Air Quality in Primary School Buildings—The InAirQ Study. Build. Environ. 2022, 221, 109339. [Google Scholar] [CrossRef]
  19. Szabados, M.; Csákó, Z.; Kotlík, B.; Kazmarová, H.; Kozajda, A.; Jutraz, A.; Kukec, A.; Otorepec, P.; Dongiovanni, A.; Di Maggio, A.; et al. Indoor Air Quality and the Associated Health Risk in Primary School Buildings in Central Europe—The InAirQ Study. Indoor Air 2021, 31, 989–1003. [Google Scholar] [CrossRef]
  20. Hassani, A.; Salamalikis, V.; Schneider, P.; Stebel, K.; Castell, N. A Scalable Framework for Harmonizing, Standardization, and Correcting Crowd-Sourced Low-Cost Sensor PM2.5 Data across Europe. J. Environ. Manag. 2025, 380, 125100. [Google Scholar] [CrossRef] [PubMed]
  21. Anastasiou, E.; Vilcassim, M.J.R.; Adragna, J.; Gill, E.; Tovar, A.; Thorpe, L.E.; Gordon, T. Feasibility of Low-Cost Particle Sensor Types in Long-Term Indoor Air Pollution Health Studies after Repeated Calibration, 2019–2021. Sci. Rep. 2022, 12, 14571. [Google Scholar] [CrossRef]
  22. Demanega, I.; Mujan, I.; Singer, B.C.; Anđelković, A.S.; Babich, F.; Licina, D. Performance Assessment of Low-Cost Environmental Monitors and Single Sensors under Variable Indoor Air Quality and Thermal Conditions. Build. Environ. 2021, 187, 107415. [Google Scholar] [CrossRef]
  23. Kim, D.; Yum, Y.; George, K.; Kwon, J.-W.; Kim, W.K.; Baek, H.-S.; Suh, D.I.; Yang, H.-J.; Yoo, Y.; Yu, J.; et al. Real-Time Low-Cost Personal Monitoring for Exposure to PM2.5 among Asthmatic Children: Opportunities and Challenges. Atmosphere 2021, 12, 1192. [Google Scholar] [CrossRef]
  24. Sá, J.P.; Chojer, H.; Branco, P.T.B.S.; Forstmaier, A.; Alvim-Ferraz, M.C.M.; Martins, F.G.; Sousa, S.I.V. Selection and Evaluation of Commercial Low-Cost Devices for Indoor Air Quality Monitoring in Schools. J. Build. Eng. 2024, 98, 110952. [Google Scholar] [CrossRef]
  25. Connolly, R.E.; Yu, Q.; Wang, Z.; Chen, Y.-H.; Liu, J.Z.; Collier-Oxandale, A.; Papapostolou, V.; Polidori, A.; Zhu, Y. Long-Term Evaluation of a Low-Cost Air Sensor Network for Monitoring Indoor and Outdoor Air Quality at the Community Scale. Sci. Total Environ. 2022, 807, 150797. [Google Scholar] [CrossRef]
  26. Zamora, M.L.; Rice, J.; Koehler, K. One Year Evaluation of Three Low-Cost PM2.5 Monitors. Atmos. Environ. 2020, 235, 117615. [Google Scholar] [CrossRef]
  27. Ródenas García, M.; Spinazzé, A.; Branco, P.T.B.S.; Borghi, F.; Villena, G.; Cattaneo, A.; Di Gilio, A.; Mihucz, V.G.; Gómez Álvarez, E.; Lopes, S.I.; et al. Review of Low-Cost Sensors for Indoor Air Quality: Features and Applications. Appl. Spectrosc. Rev. 2022, 57, 747–779. [Google Scholar] [CrossRef]
  28. Atfeh, B.; Barcza, Z.; Groma, V.; Tordai, Á.V.; Mészáros, R. Performance Assessment of Low- and Medium-Cost PM2.5 Sensors in Real-World Conditions in Central Europe. Atmosphere 2025, 16, 796. [Google Scholar] [CrossRef]
  29. Castell, N.; Dauge, F.R.; Schneider, P.; Vogt, M.; Lerner, U.; Fishbain, B.; Broday, D.; Bartonova, A. Can Commercial Low-Cost Sensor Platforms Contribute to Air Quality Monitoring and Exposure Estimates? Environ. Int. 2017, 99, 293–302. [Google Scholar] [CrossRef]
  30. Feenstra, B.; Papapostolou, V.; Hasheminassab, S.; Zhang, H.; Boghossian, B.D.; Cocker, D.; Polidori, A. Performance Evaluation of Twelve Low-Cost PM2.5 Sensors at an Ambient Air Monitoring Site. Atmos. Environ. 2019, 216, 116946. [Google Scholar] [CrossRef]
  31. Karagulian, F.; Barbiere, M.; Kotsev, A.; Spinelle, L.; Gerboles, M.; Lagler, F.; Redon, N.; Crunaire, S.; Borowiak, A. Review of the Performance of Low-Cost Sensors for Air Quality Monitoring. Atmosphere 2019, 10, 506. [Google Scholar] [CrossRef]
  32. Lim, C.C.; Kim, H.; Vilcassim, M.J.R.; Thurston, G.D.; Gordon, T.; Chen, L.-C.; Lee, K.; Heimbinder, M.; Kim, S.-Y. Mapping Urban Air Quality Using Mobile Sampling with Low-Cost Sensors and Machine Learning in Seoul, South Korea. Environ. Int. 2019, 131, 105022. [Google Scholar] [CrossRef]
  33. Magi, B.I.; Cupini, C.; Francis, J.; Green, M.; Hauser, C. Evaluation of PM2.5 Measured in an Urban Setting Using a Low-Cost Optical Particle Counter and a Federal Equivalent Method Beta Attenuation Monitor. Aerosol Sci. Technol. 2020, 54, 147–159. [Google Scholar] [CrossRef]
  34. Available online: https://legszennyezettseg.met.hu/levegominoseg (accessed on 7 July 2025).
  35. Atfeh, B.; Kristóf, E.; Mészáros, R.; Barcza, Z. Evaluating the Effect of Data Processing Techniques on Indoor Air Quality Assessment in Budapest. In Egyetemi Meteorológiai Füzetek; Pongrácz, R., Mészáros, R., Kis, A., Eds.; ELTE Meteorológiai Tanszék: Budapest, Hungary, 2020; Volume 33, pp. 5–14. ISBN 978-963-489-299-1. [Google Scholar]
  36. Bravo, M.A.; Bell, M.L. Spatial Heterogeneity of PM10 and O3 in São Paulo, Brazil, and Implications for Human Health Studies. J. Air Waste Manag. Assoc. 2011, 61, 69–77. [Google Scholar] [CrossRef] [PubMed]
  37. Faridi, S.; Niazi, S.; Yousefian, F.; Azimi, F.; Pasalari, H.; Momeniha, F.; Mokammel, A.; Gholampour, A.; Hassanvand, M.S.; Naddafi, K. Spatial Homogeneity and Heterogeneity of Ambient Air Pollutants in Tehran. Sci. Total Environ. 2019, 697, 134123. [Google Scholar] [CrossRef]
  38. Krudysz, M.; Moore, K.; Geller, M.; Sioutas, C.; Froines, J. Intra-Community Spatial Variability of Particulate Matter Size Distributions in Southern California/Los Angeles. Atmos. Chem. Phys. 2009, 9, 1061–1075. [Google Scholar] [CrossRef]
  39. Shi, X.; Zhao, C.; Jiang, J.H.; Wang, C.; Yang, X.; Yung, Y.L. Spatial Representativeness of PM2.5 Concentrations Obtained Using Observations from Network Stations. J. Geophys. Res. Atmos. 2018, 123, 3145–3158. [Google Scholar] [CrossRef]
  40. Wallace, L.; Zhao, T. Spatial Variation of PM2.5 Indoors and Outdoors: Results from 261 Regulatory Monitors Compared to 14,000 Low-Cost Monitors in Three Western States over 4.7 Years. Sensors 2023, 23, 4387. [Google Scholar] [CrossRef]
  41. Wilson, J.G.; Kingham, S.; Sturman, A.P. Intraurban Variations of PM10 Air Pollution in Christchurch, New Zealand: Implications for Epidemiological Studies. Sci. Total Environ. 2006, 367, 559–572. [Google Scholar] [CrossRef]
  42. Shikhovtsev, M.Y.; Makarov, M.M.; Aslamov, I.A.; Tyurnev, I.N.; Molozhnikova, Y.V. Application of Modern Low-Cost Sensors for Monitoring of Particle Matter in Temperate Latitudes: An Example from the Southern Baikal Region. Sustainability 2025, 17, 3585. [Google Scholar] [CrossRef]
  43. Wei, Y.; Sun, Y.; Ma, Y.; Tan, Y.; Ren, X.; Peng, K.; Yang, S.; Lin, Z.; Zhou, X.; Ren, Y.; et al. Deviations of Boundary Layer Height and Meteorological Parameters Between Ground-Based Remote Sensing and ERA5 over the Complex Terrain of the Mongolian Plateau. Remote Sens. 2025, 17, 393. [Google Scholar] [CrossRef]
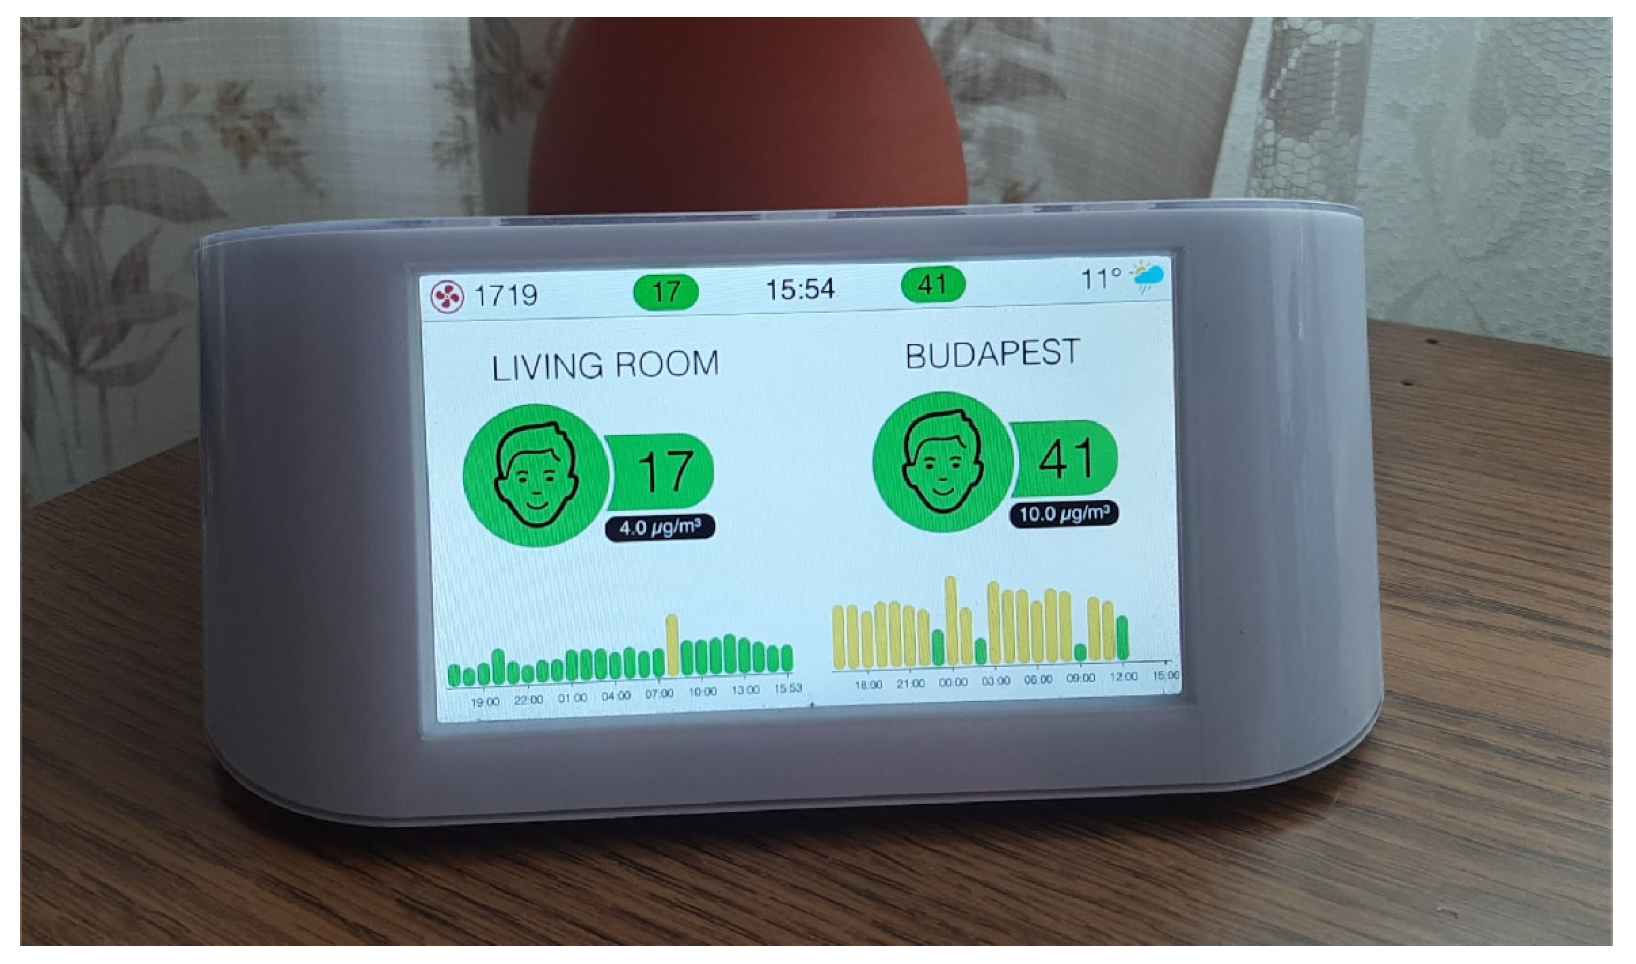
Figure 1. One of the AirVisual sensors operated at one of the residential houses in Budapest.
Atmosphere 16 00998 g001
Figure 2. Location of the measurement sites (apartments) and official stations of the Hungarian Air Quality Network in Budapest. Only those stations where PM2.5 was measured are presented in the map. Pesthidegkút station is located on a hilly region, which is not representative of a typical urban environment, thus it was not taken into account during our investigations.
Atmosphere 16 00998 g002
Figure 3. Monthly averages of PM2.5 concentrations between 2017 and 2022, calculated from the hourly averages of the official monitoring stations in Budapest (https://legszennyezettseg.met.hu, accessed on 1 July 2025) and the three AirVisual sensors. AirVisual 1 and 2 show indoor measurements from two apartments, while AirVisual 3, which was only operational for a few months in the second half of 2020, is representative of outdoor conditions.
Atmosphere 16 00998 g003
Figure 4. Two examples of daily courses of indoor PM2.5 (red line) and CO2 (blue line) concentrations measured by AirVisual 1 sensor, alongside hourly data from official outdoor monitoring stations (represented by various colors), for two selected days: (a) 25 November 2019 and (b) 30 December 2019.
Atmosphere 16 00998 g004
Figure 5. Frequency distribution of the different homogeneity measures: (a) CV, (b) Range, (c) CV5h, and (d) Range5h for the entire study period (2017–2022). Cases were analyzed only when data from at least six reference stations were available.
Atmosphere 16 00998 g005
Figure 6. Relationship between the homogeneity criteria (CV) and the selected statistical measures for AirVisual 1. The number of data points used for the calculations is also indicated (middle plot in the right hand side). In the upper two plots the symbols represent the slopes and intercepts, while the continuous line is the uncertainty of the fit based on bootstrapping.
Atmosphere 16 00998 g006
Figure 7. The relationship between slope and RMSE for different homogeneity measures: (a) CV, (b) Range, (c) CV5h, and (d) Range5h for the entire study period (2017–2022). The vertical lines indicate the RMSE threshold value, marked with the color corresponding to the given device.
Atmosphere 16 00998 g007
Figure 8. Changes in RMSE values according to individual threshold values (a) and the corresponding number of available data pairs (marked by n) (b). Horizontal lines represent the breakpoints based on Figure 6, while vertical lines represent the selected homogeneity criteria of CV.
Atmosphere 16 00998 g008
Figure 9. The relationship between PM2.5 measurement data from three AirVisual sensors (x-axis) and the mean PM2.5 of the official reference instruments of the HAQM (y-axis) for different homogeneity criteria: (ac): CV; (df): CV5h; (gi): Range; (jl): Range5h. For AirVisual 1 (a) and AirVisual 2 (b), only data from identified ventilation events were included, while for AirVisual 3 (c), all available data were used. All values are given in μg m−3. The presented equations can be directly used to adjust the readings so that the result will most likely be bias-free, with some remaining noise of course. The red line is the regression line. The black line represents the 1:1 line.
Atmosphere 16 00998 g009
Figure 10. The relationship between PM2.5 readings (in μg m−3) of the three AirVisual sensors (x-axis) and their respective nearest reference station measurements (y-axis). For AirVisual 1 (a) and AirVisual 2 (b), only data from identified ventilation events were included, while for AirVisual 3 (c), all available data were used. AirVisual 1 and 3 are compared with Gergely Street HAQM station, while AirVisual 2 is compared with Széna Square. The red line is the regression line. The black line represents the 1:1 line.
Atmosphere 16 00998 g010
Table 1. Main characteristics of the measurement locations (both apartments were equipped with an air purifier, though they were not used continuously).
Site NoTotal SizeFloor No. of RoomsNo. of
Residents
Heating
System
Cooling
System
Type of
Ventilation
Apartment 1
(AirVisual 1)
~50 m2024Central heating
system
Air conditioner in the kitchenWindows opened
3–4 times a day
Apartment 2
(AirVisual 2)
78 m2444Central heating
system
No cooling systemWindows opened
2 times a day
Apartment 1
storage room
(AirVisual 3)
~5 m2010No heating systemNo cooling systemNatural
(open window conditions)
Table 2. The average and standard deviation of PM2.5 concentrations measured at the eight stations of the Hungarian Air Pollution Monitoring Station Network in Budapest between 2017 and 2022, by season and for the entire period. The locations of the stations are shown in Figure 2.
PM2.5 Concentration (Average ± Standard Deviation in μg m–3)
StationSpring (MAM)Summer (JJA)Autumn (SON)Winter (DJF)Yearly
Budatétény10.1 ± 7.56.3 ± 3.113.7 ± 1019.4 ± 14.212.8 ± 11.0
Erzsébet Square13.8 ± 8.49.3 ± 4.417.1 ± 10.822.2 ± 14.616.0 ± 11.5
Gergely Street12.4 ± 8.48.9 ± 4.516.9 ± 11.121.9 ± 15.415.4 ± 11.9
Gilice Square12.8 ± 8.39.7 ± 4.814.0 ± 9.224.6 ± 22.015.0 ± 13.7
Honvéd12.4 ± 8.48.4 ± 3.917.0 ± 10.920.9 ± 13.914.9 ± 11.1
Kőrakás Park14.2 ± 10.18.5 ± 4.717.3 ± 11.725.1 ± 18.816.3 ± 13.7
Széna Square13.3 ± 7.111.6 ± 5.314.0 ± 7.918.9 ± 16.914.5 ± 10.7
Teleki Square13.7 ± 8.710.8 ± 5.015.5 ± 10.023.3 ± 20.815.4 ± 12.9
Table 3. Number of hours during a 6-year period, when the dataset was available for the comparison of low-cost sensor data with reference sensor data.
AirVisual 1AirVisual 2AirVisual 3
All cases812416072421
At least six stations available648010472398
At least six stations available for 5 h639110302338
Disclaimer/Publisher’s Note: The statements, opinions and data contained in all publications are solely those of the individual author(s) and contributor(s) and not of MDPI and/or the editor(s). MDPI and/or the editor(s) disclaim responsibility for any injury to people or property resulting from any ideas, methods, instructions or products referred to in the content.