Article

Long-Range Transport of Biomass Burning Aerosols from Southern Africa: A Case Study Using Layered Atlantic Smoke Interactions with Clouds Observations

by
Osinachi F. Ajoku
1,*,
Joseph L. Wilkins
1 and
Mumin Abdulahi
2
1
Department of Earth, Environment and Equity, Howard University, Washington, DC 20059, USA
2
Department of Interdisciplinary Studies, Howard University, Washington, DC 20059, USA
*
Author to whom correspondence should be addressed.
Atmosphere 2025, 16(9), 997; https://doi.org/10.3390/atmos16090997 (registering DOI)
Submission received: 28 June 2025 / Revised: 29 July 2025 / Accepted: 11 August 2025 / Published: 23 August 2025
(This article belongs to the Special Issue Natural Sources Aerosol Remote Monitoring (2nd Edition))

Abstract

A case study of an incoming biomass burning aerosol plume at Ascension Island is analyzed for the peak of the 2017 fire season using satellites, reanalysis and in situ observations. Measurements from the Atmospheric Radiation Measurement Mobile Facility 1 reveal an abrupt change from relatively clean conditions (~70 parts per billion by volume of carbon monoxide) to a more polluted state (~150 parts per billion by volume of carbon monoxide). Corresponding changes in aerosol size reveal a broadening of size distributions toward larger optical diameters, consistent with the arrival of aged aerosols. Within a 24 h period, black carbon fraction increases ~500% from ~300 ng me to ~1500 ng m3, while light absorption coefficients increase ~300%. Long-range transport of these aerosols is primarily confined between 2 and 5 km above sea level along the northwesterly trade winds. Our results show that the primary driver of increases in aerosol loading over Ascension Island is an intensification of the St. Helena high-pressure system (anticyclone) that leads to a weakening of trade winds and increases westward transport on its northern flank. A better understanding of the complex interactions between air quality, meteorology and long-range aerosol transport is important for future modeling studies focused on aerosol–cloud–radiation interactions over the open ocean and reducing its associated uncertainties.

1. Introduction

A significant number of aerosols are emitted into the atmosphere from the African continent, both naturally and anthropologically [1]. The most noticeable, aside from dust from Sahara Africa, are biomass burning aerosols (BBAs), a corollary of seasonal biomass burning being employed for land clearing and management in agricultural expansion in southern Africa [2]. The emitted smoke comprises organic and inorganic aerosol particles, mainly black carbon and brown carbon, with the inclusion of various secondary gases born out of chemical transformation of the primary products [3]. The permeation of smoke in the atmosphere forces the concentrations of aerosol particles and cloud condensation nuclei to increase and exceed the natural background, a situation causing the dynamic and thermodynamic readjustment of atmospheric processing to account for the smoke-imposed forcings.
The Earth’s radiative energy balance is perturbed by the presence of these BBAs. Directly, smoke aerosols absorb and scatter solar radiation and hence lead to the surface cooling and a concomitant heating of black carbon-enriched atmospheric layers aloft. This thermodynamic perturbation is a recipe for the actuation of cloud structural development and mutation. For instance, the heating aloft owing to the black carbon shortwave radiation absorption creates the inversion layer, thereby resulting in stabilization of the boundary layer up to an inhibition of shallow convective cloud formation [4]. Indirectly, aerosols affect the precipitation process in the cloud and hence cloud lifetime. The fact that most smoke emission sources occur over the Northern Hemisphere [5] has been suggested as the possible reason for shifts in the Intertropical Convergence Zone and hence the historical changes in the West African monsoon in response to interhemispheric energy imbalances induced under asymmetric aerosol emissions [6].
A suite of field campaigns was conducted to understand aerosol transportation, including radiative and chemical properties, between Central Africa and the adjacent tropical Atlantic during the 2016 and 2017 biomass burning seasons. Some of the campaigns include the Layered Atlantic Smoke Interactions with Clouds (LASIC) and the Aerosols, Radiation and Clouds in Southern Africa [7,8]. In particular, the LASIC campaign stationed the Department of Energy Atmospheric Radiation Measurement Mobile Facility 1 (ARM-MF 1) on Ascension Island (~14.5° W and ~8° S). One of the primary goals of LASIC was to ascertain the influences of biomass burning-produced aerosols from Africa and moved over the southeast Atlantic on the marine boundary layer, including interactions with low-level clouds [9,10].
In Central and southern Africa, the local dry season (occurring June through November) constantly emits biomass burning aerosols aloft, where the particulate matter is carried by local trade winds and regional atmospheric circulation. One such system is the southern African easterly jet, which is a major contributor of long-range transport between southern Africa and the equatorial Atlantic [11,12] and has impacts on aerosol and low cloud distribution [13]. Ref. [11] found that the southern African easterly jet has two different modes based on its strength. Here, a stronger jet leads to pollutants residing at higher altitudes, often above the marine boundary layer (between 2 and 5 km above sea level). [14] used LASIC field campaign data to understand the evolution of the wave-one ozone maximum in the region due to transport from Central Africa by the southern African easterly jet, and utilized 7-day back trajectories to explore the air mass’s origin. As these aerosols are transported and aged, they undergo changes in coating thickness, which reflects further changes in mixing state and radiative properties. In addition, such aging can lead to particle growth and a change in aerosol size distributions due to an increase in coating thickness [15].
An improved understanding of the long-range transport of biomass burning aerosols from pristine to polluted conditions is imperative towards improving the model representation of aerosol and cloud radiative impacts, especially over the open ocean. The objective of this work is to (1) evaluate aerosol properties around Ascension Island and the nearby Atlantic as conditions evolve from relatively clean to the most polluted days of the 2017 fire season, (2) determine the meteorological conditions associated with large-scale, trans-Atlantic smoke aerosol transport, and (3) highlight the vertical structure of smoke aerosols during transport from southern Africa to Ascension Island.

2. Materials and Methods

Data Sources

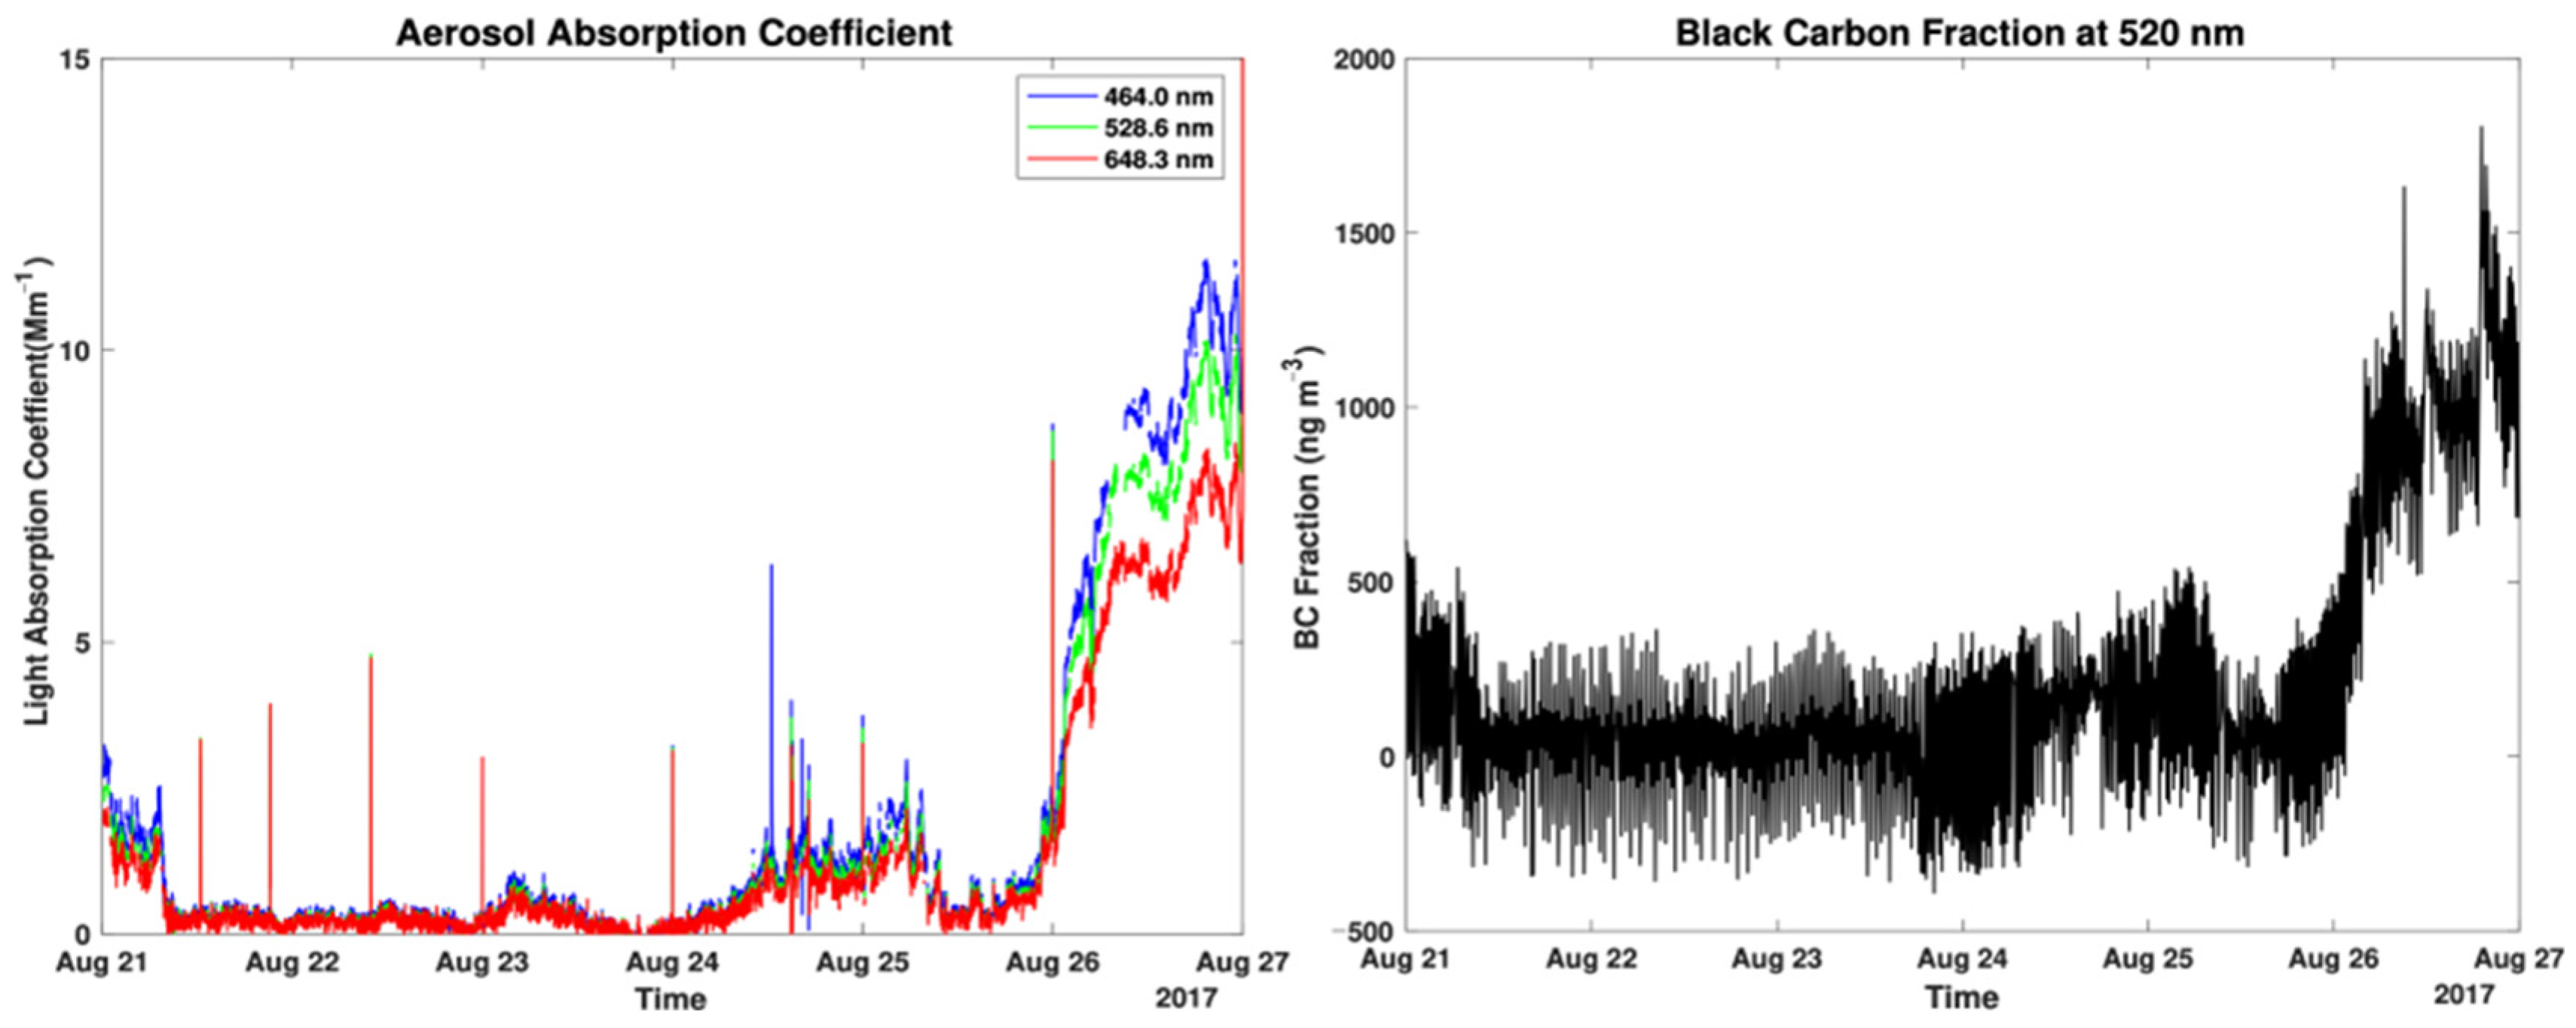
The Department of Energy’s Atmospheric Radiation Measurement Mobile Facility 1, deployed on Ascension, contains a variety of instruments used to measure aerosol and atmospheric properties. The Department of Energy keeps their data available for use in a public repository (www.adc.arm.gov, accessed on 4 November 2024). Data from the ultrahigh sensitivity aerosol spectrometer provides aerosol size distribution, total number concentration, aerosol particle number concentration, volume concentration and surface area concentration at a temporal resolution of ten seconds [16]. The AOS Carbon Monoxide Analyzer provides carbon monoxide mixing ratios in parts per million by volume (ppmv) at a temporal resolution of ten seconds [17]. Aerosol optical properties are obtained from the Particle Soot Absorption Photometer using 1 Flynn algorithm toward sampling and calculating aerosol absorption coefficients at multiple wavelengths (464 nm, 528.6 nm and 648.3 nm) and black carbon fraction at 520 nm [18].
Three-dimensional concentrations of ozone, horizontal meteorological winds and aerosol optical depth (AOD) data are analyzed using the Modern-Era Retrospective analysis for Research and Applications, Version 2 (MERRA2), available at a 0.5° × 0.625° resolution [19] during the episode of interest (21–26 August 2017). MERRA2 assimilates satellite and ground-based data using a numerical algorithm to create a synthesized state of the climate system, which is particularly helpful since such measurements are sparse within the equatorial Atlantic.
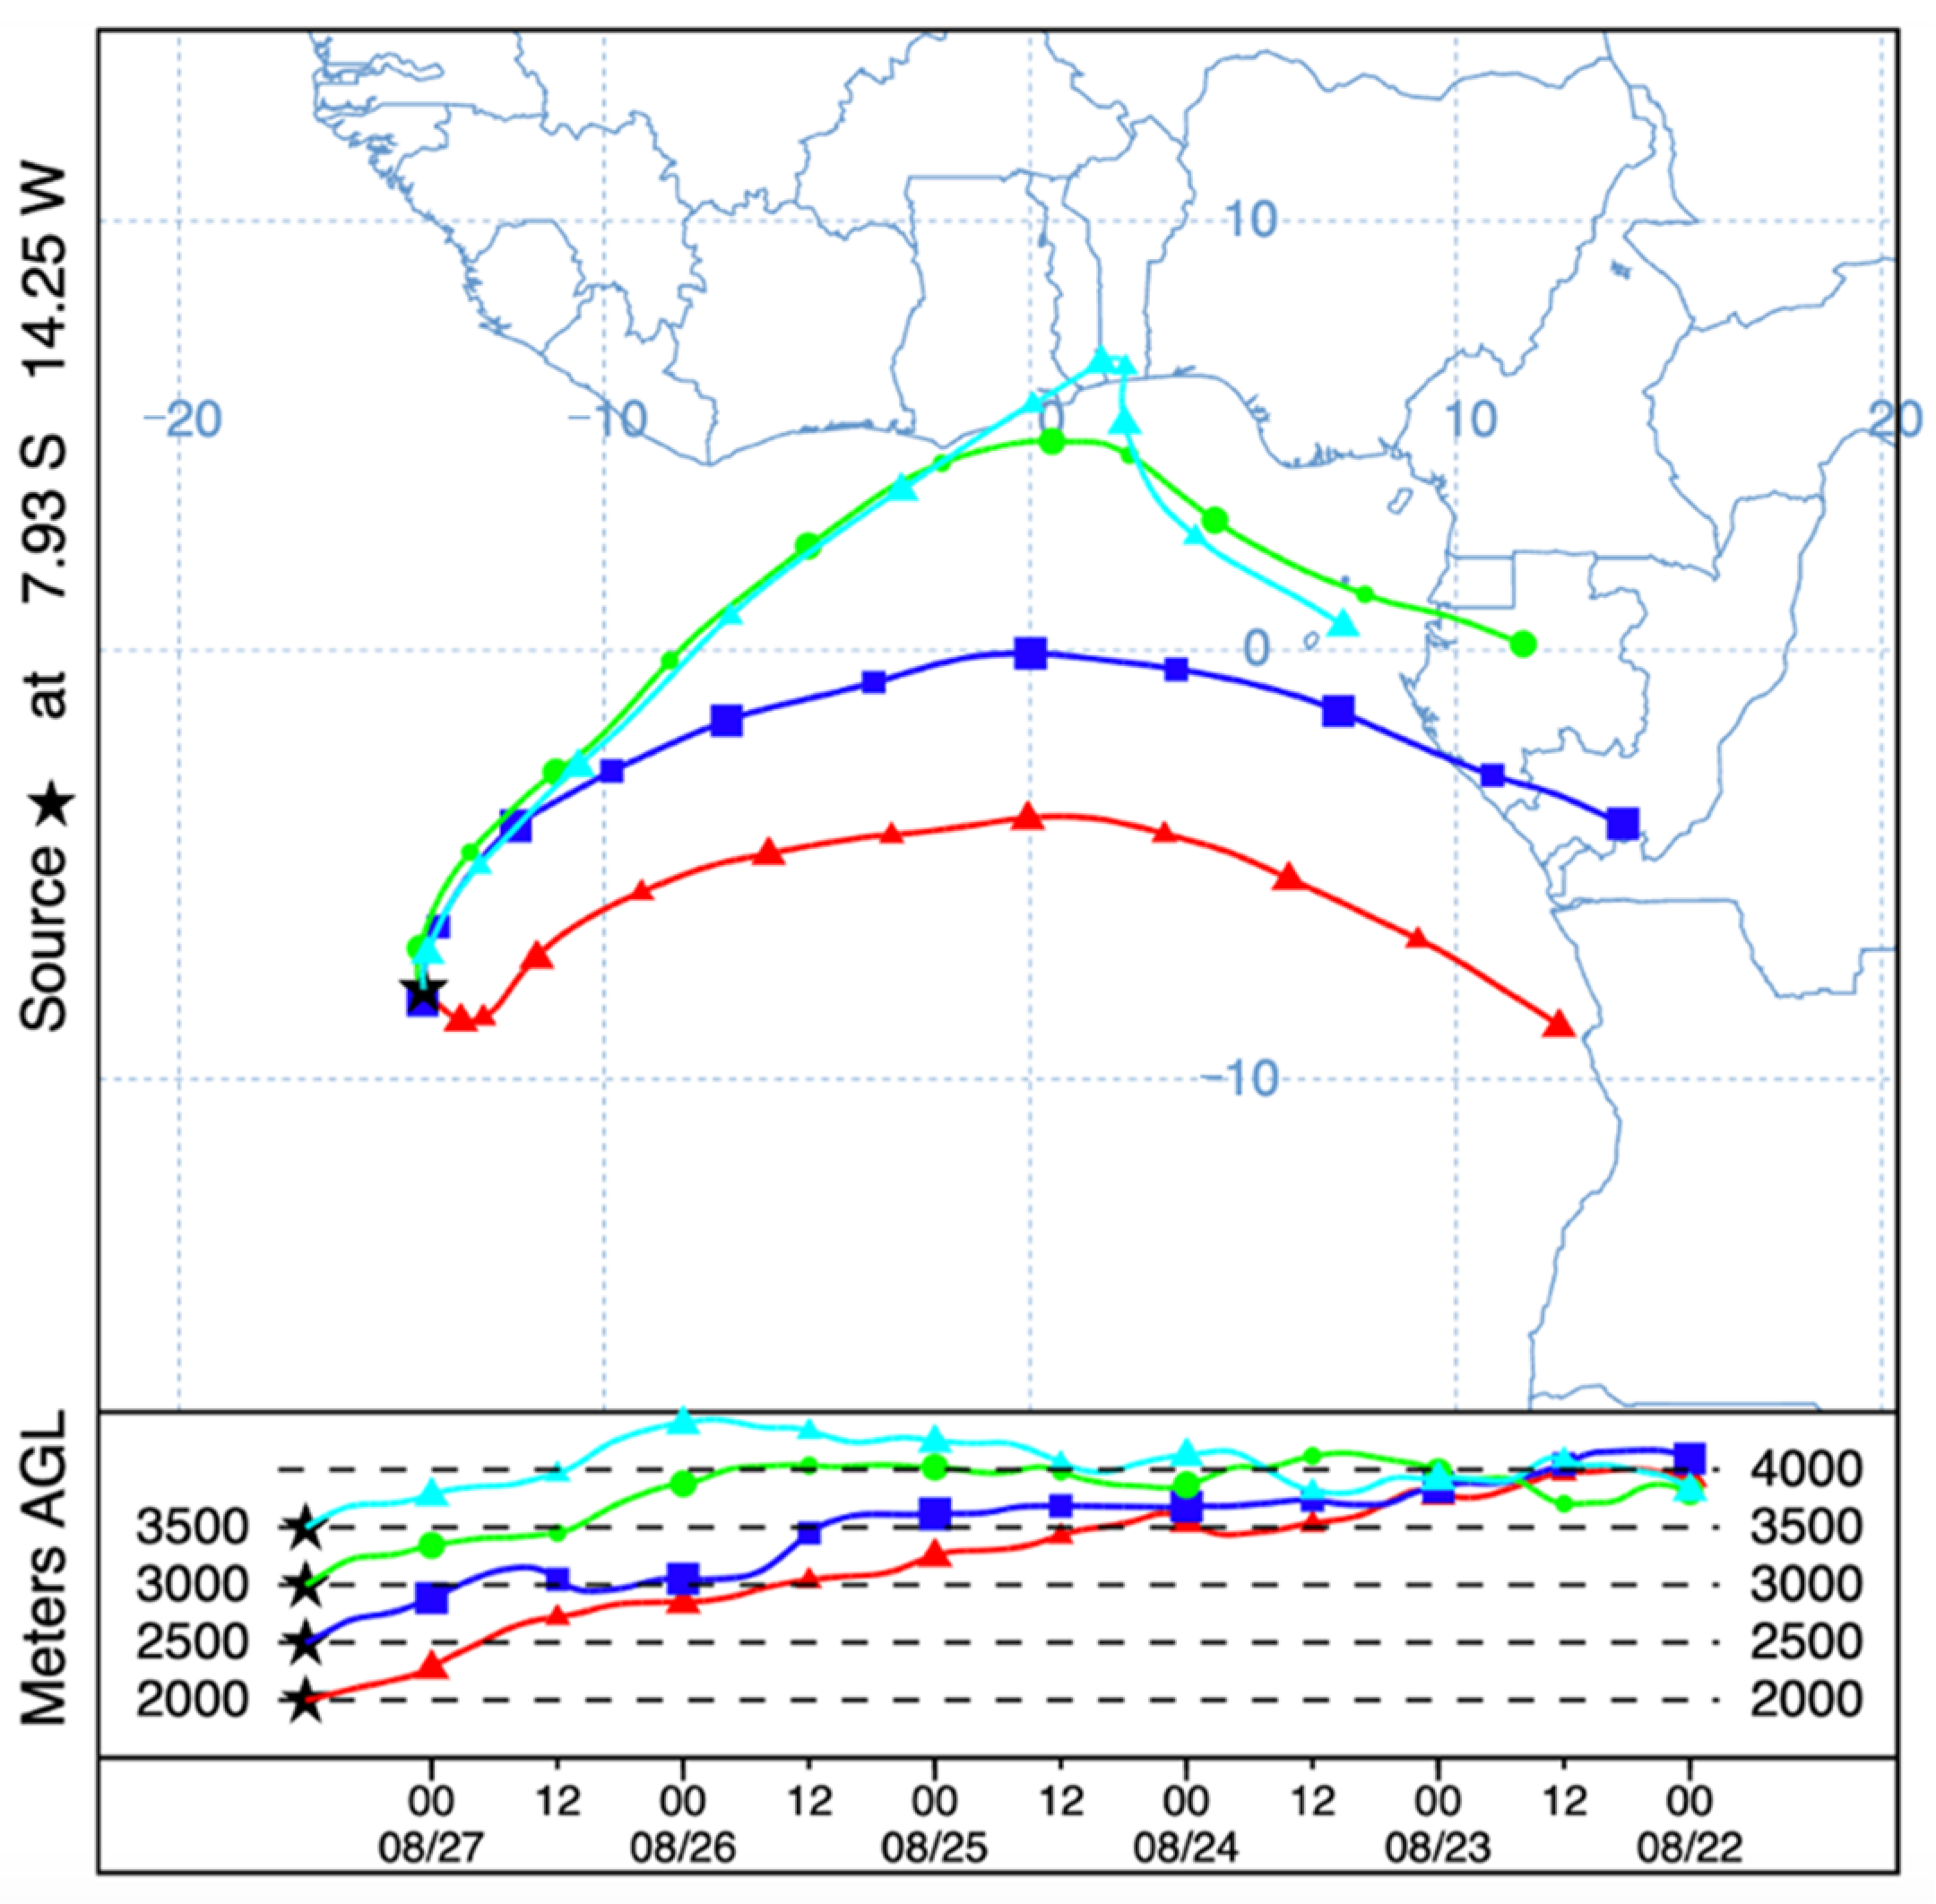
The National Oceanic and Atmospheric Administration’s (NOAA) Hybrid Single-Particle Lagrangian Trajectory (HYSPLIT) model is used to calculate trajectories for air parcels near Ascension Island (7.93° S, 14.25° W) with origins over the central African continent and is forced with Global Data Assimilation System (GDAS) meteorology at 0.5° horizonal resolution [20]. The model was initialized over the island on 27 August 2017, using four different heights within the aerosol layer (2000 m, 2500 m, 3000 m and 3500 m), and back trajectories were each allowed to run for five days.
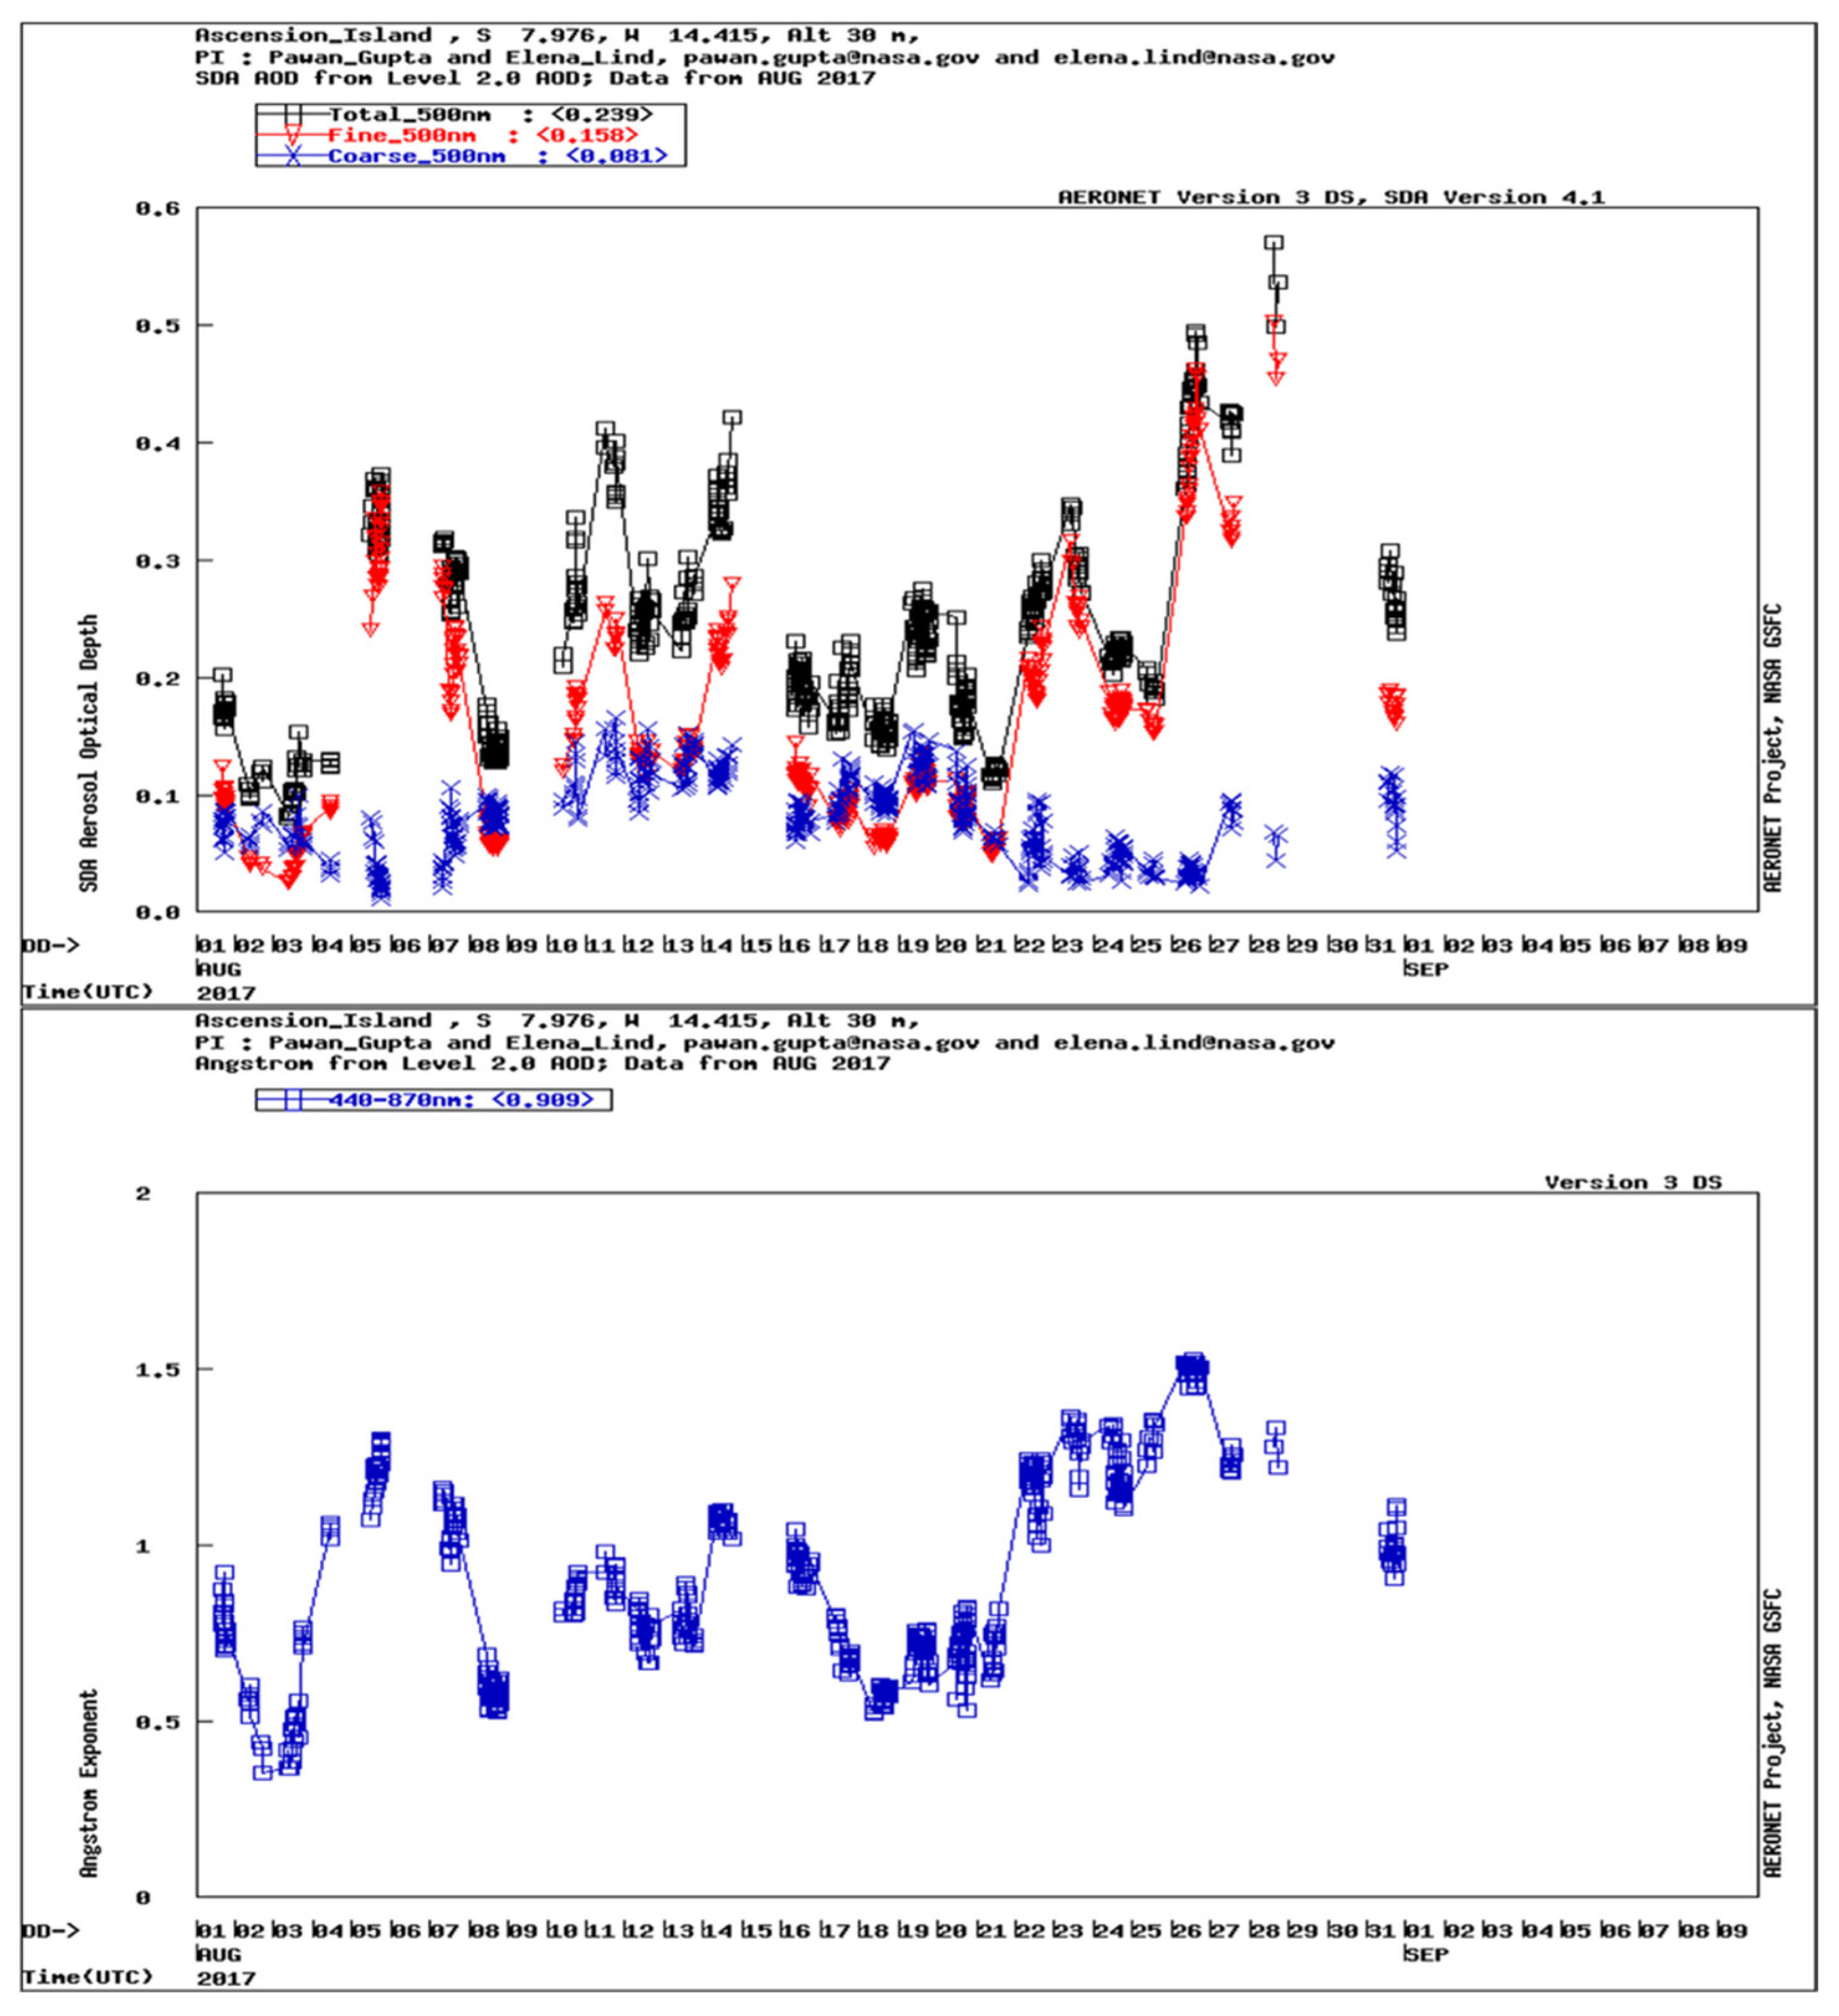
Direct measurements of radiation fluxes from ground station photometers provide estimates for aerosol perturbations. Aerosol retrievals at Ascension Island, provided by the AErosol RObotic NETwork AERONET, courtesy of NASA GSFC, provided daily averaged (whenever available for August 2017) aerosol data, including angstrom exponents (AE) and aerosol optical depth data for fine and coarse mode aerosols [21] at Ascension Island (7.96 W, 14.415 S, 30 m above sea level).
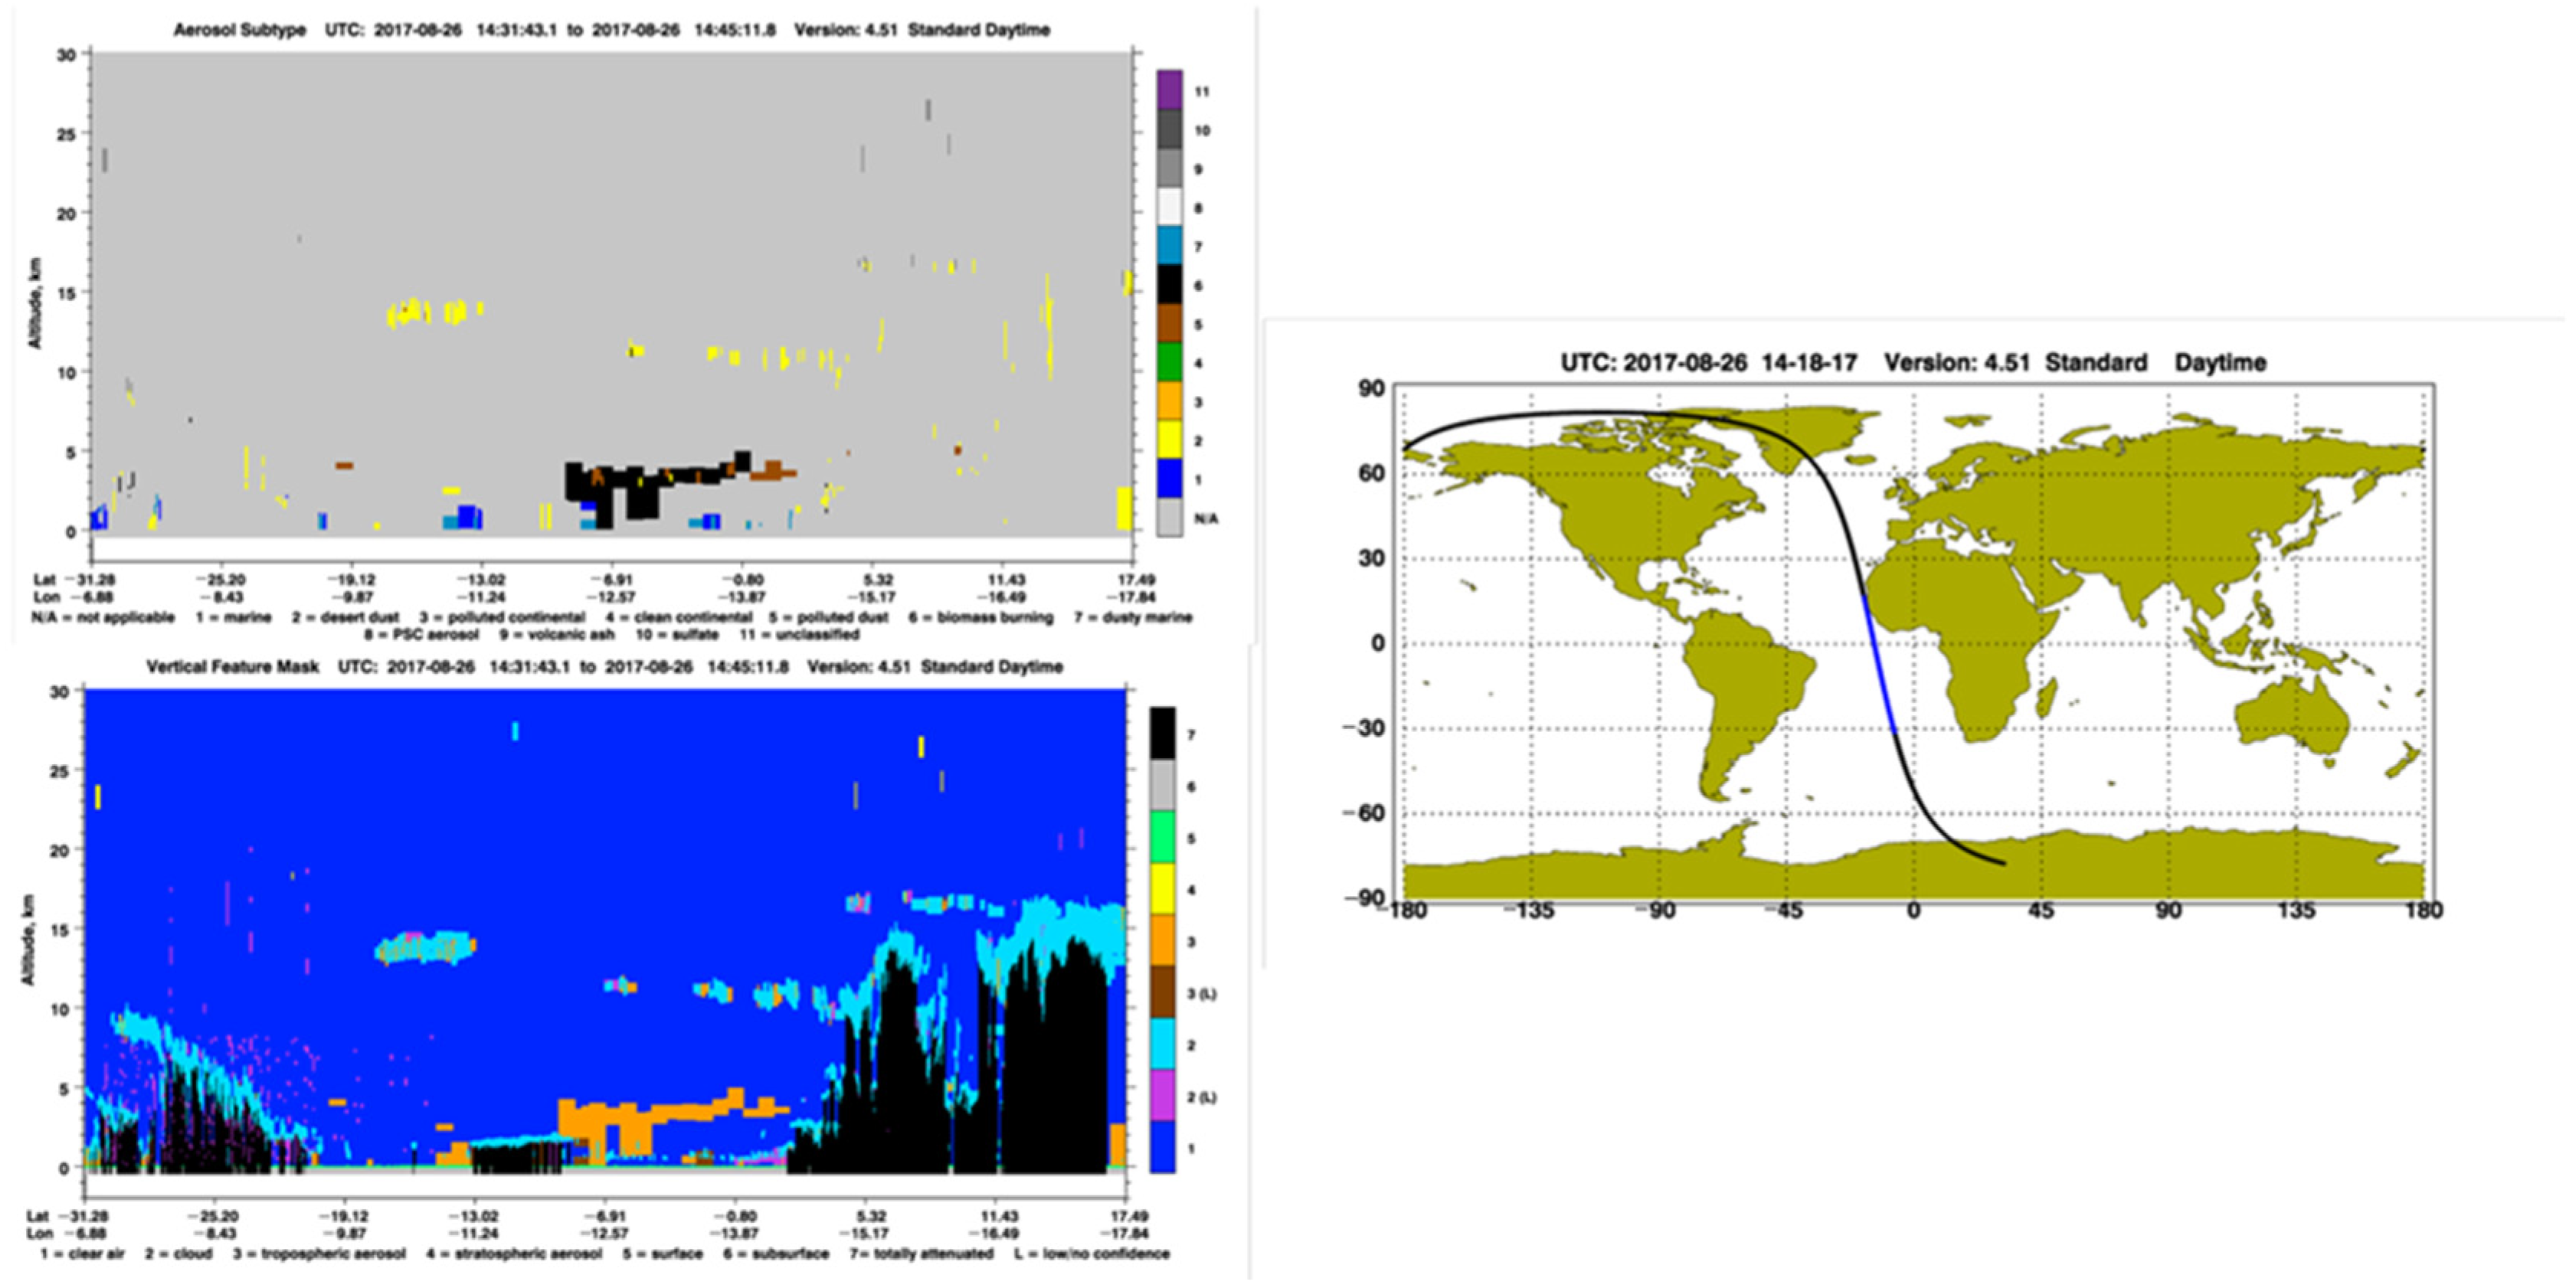
Cloud-Aerosol-Lidar with Orthogonal polarization (CALIOP) is a two-wavelength lidar provided by NASA and produces high-resolution vertical profiles of clouds and aerosols [22]. Data coinciding with our study period of interest (21–27 August) provides transects near the biomass burning sources nearing Central Africa toward Ascension Island. This satellite product can provide data about aerosol subtypes and overlapping areas of both aerosols and clouds.

3. Results

The LASIC campaign centered around Ascension Island carried out state-of-the-art observations of atmospheric and aerosol properties for the years 2016 and 2017. Aerosol concentrations in this area are dependent on biomass burning intensity over the African continent, coupled with meteorological conditions over the equatorial Atlantic. Encompassing two complete biomass burning seasons, measurements of daily averaged, total number concentration (Figure 1) show diurnal variations, in addition to highly variable year-to-year changes in biomass burning intensity and corresponding cross-Atlantic transport. Comparing both years, total number concentrations are much higher in 2017 (201–205 cm−3) compared to 2016 (151–155 cm−3). We focus our analysis on the peak of the 2017 burning season, which occurs between 21 and 26 August.

3.1. Observed Aerosol Size and Chemical Properties

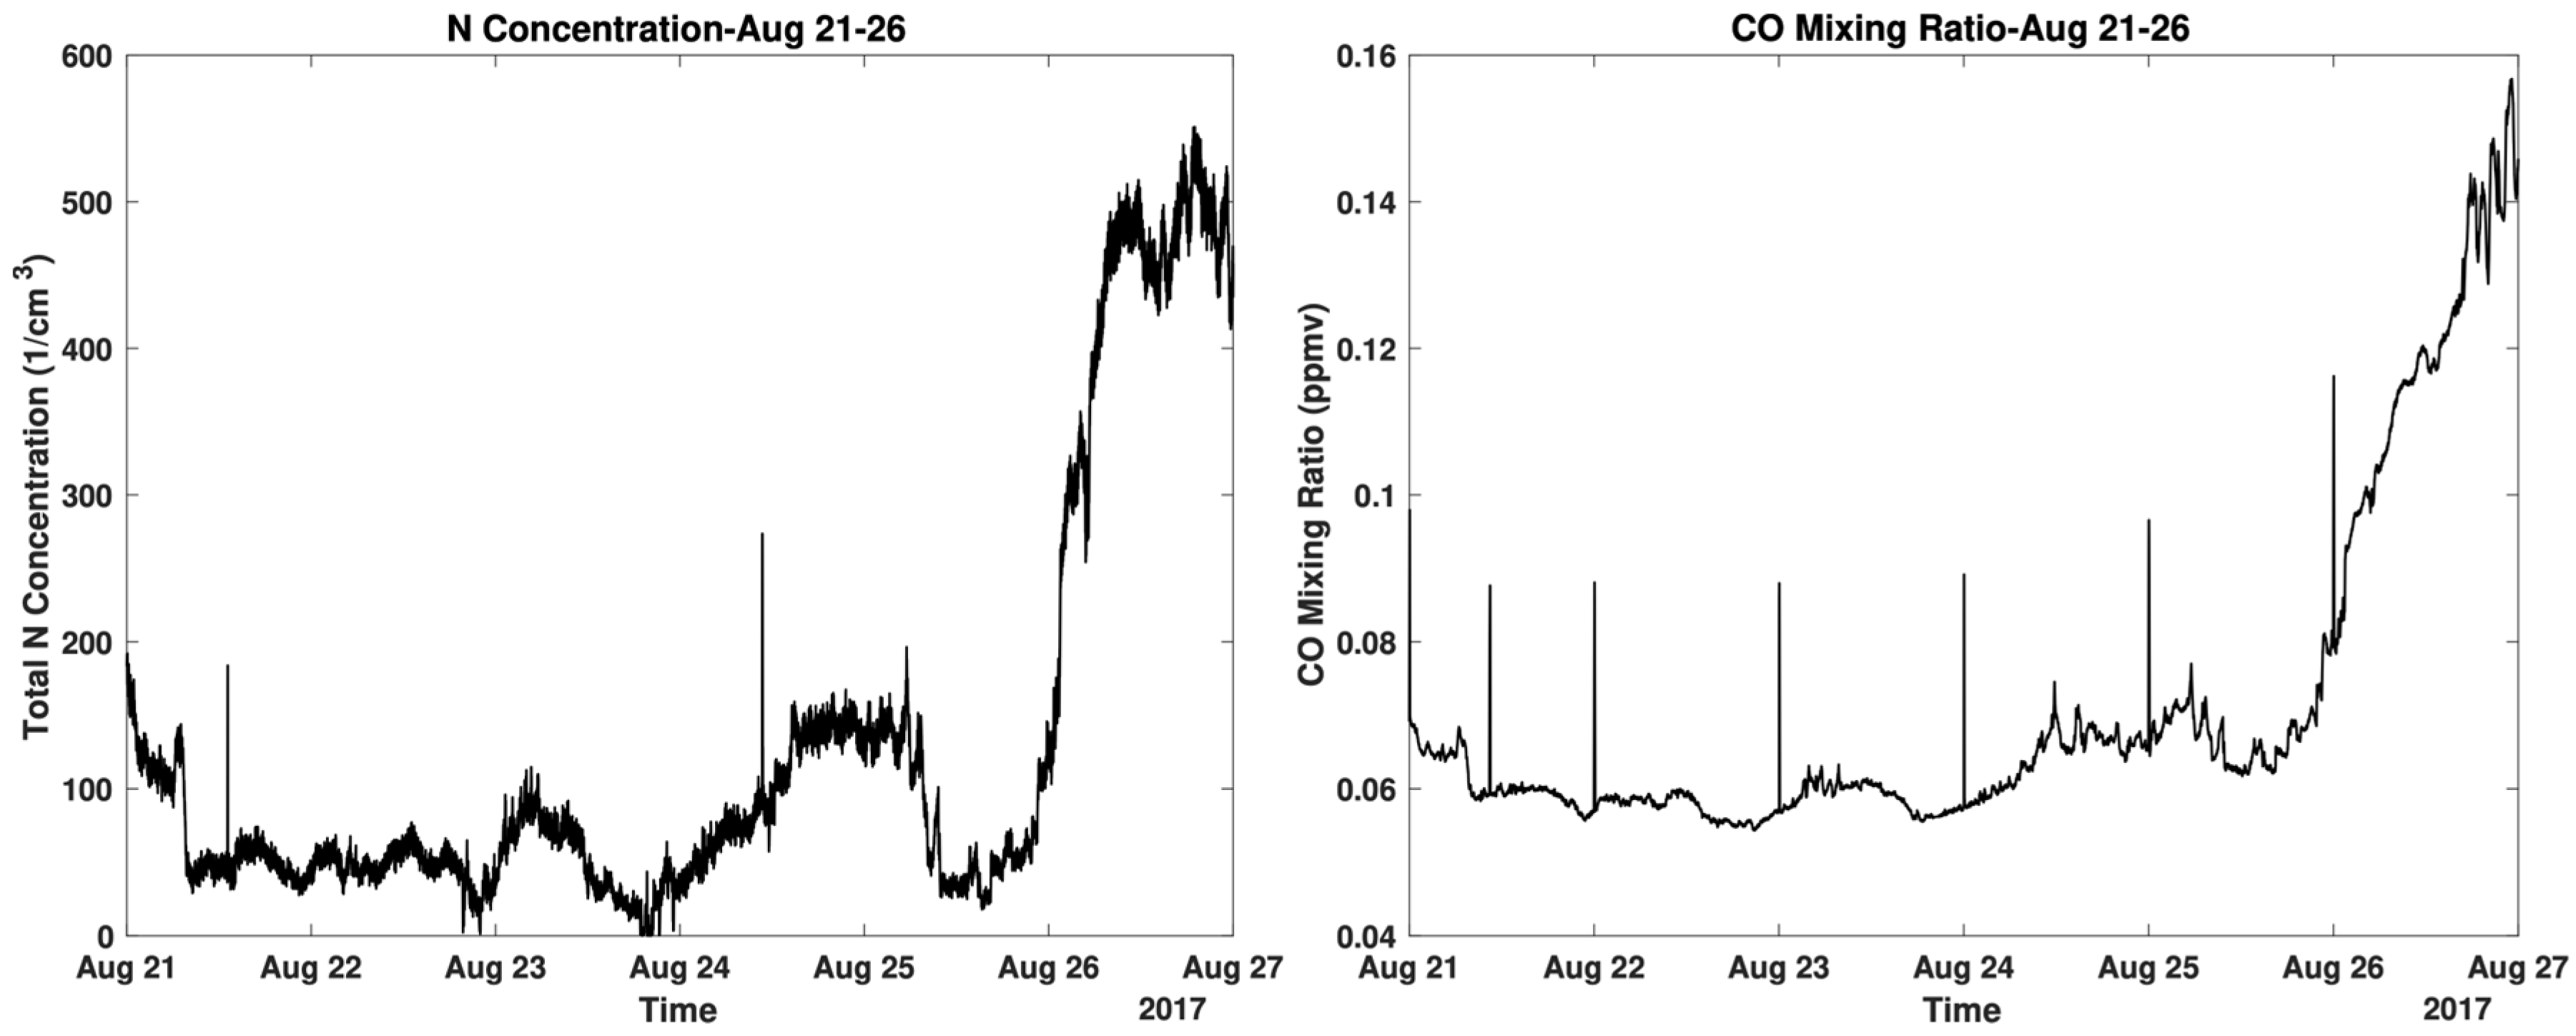
From 21 to 25 August, total number concentration values (sampled every ten seconds) stayed within the range of 0 to 200 cm−3. However, on the 26th, these values drastically increased to values greater than 500 cm−3 (Figure 2, left). Such an intense decrease in concentration values implies the arrival of a smoke plume. These values are further validated when looking at CO mixing ratios during the same period (Figure 2, right). Between the 21st and 25th, CO mixing ratio values ranged between ~0.06 and 0.07 parts per million by volume (ppmv). However, on the 26th, these values rose to ~0.16 ppmv, leading to a ~200% increase in CO, a typical tracer of biomass burning episodes. Such a sudden increased number concentration and CO mixing ratio is indicative of incoming smoke from biomass burning.
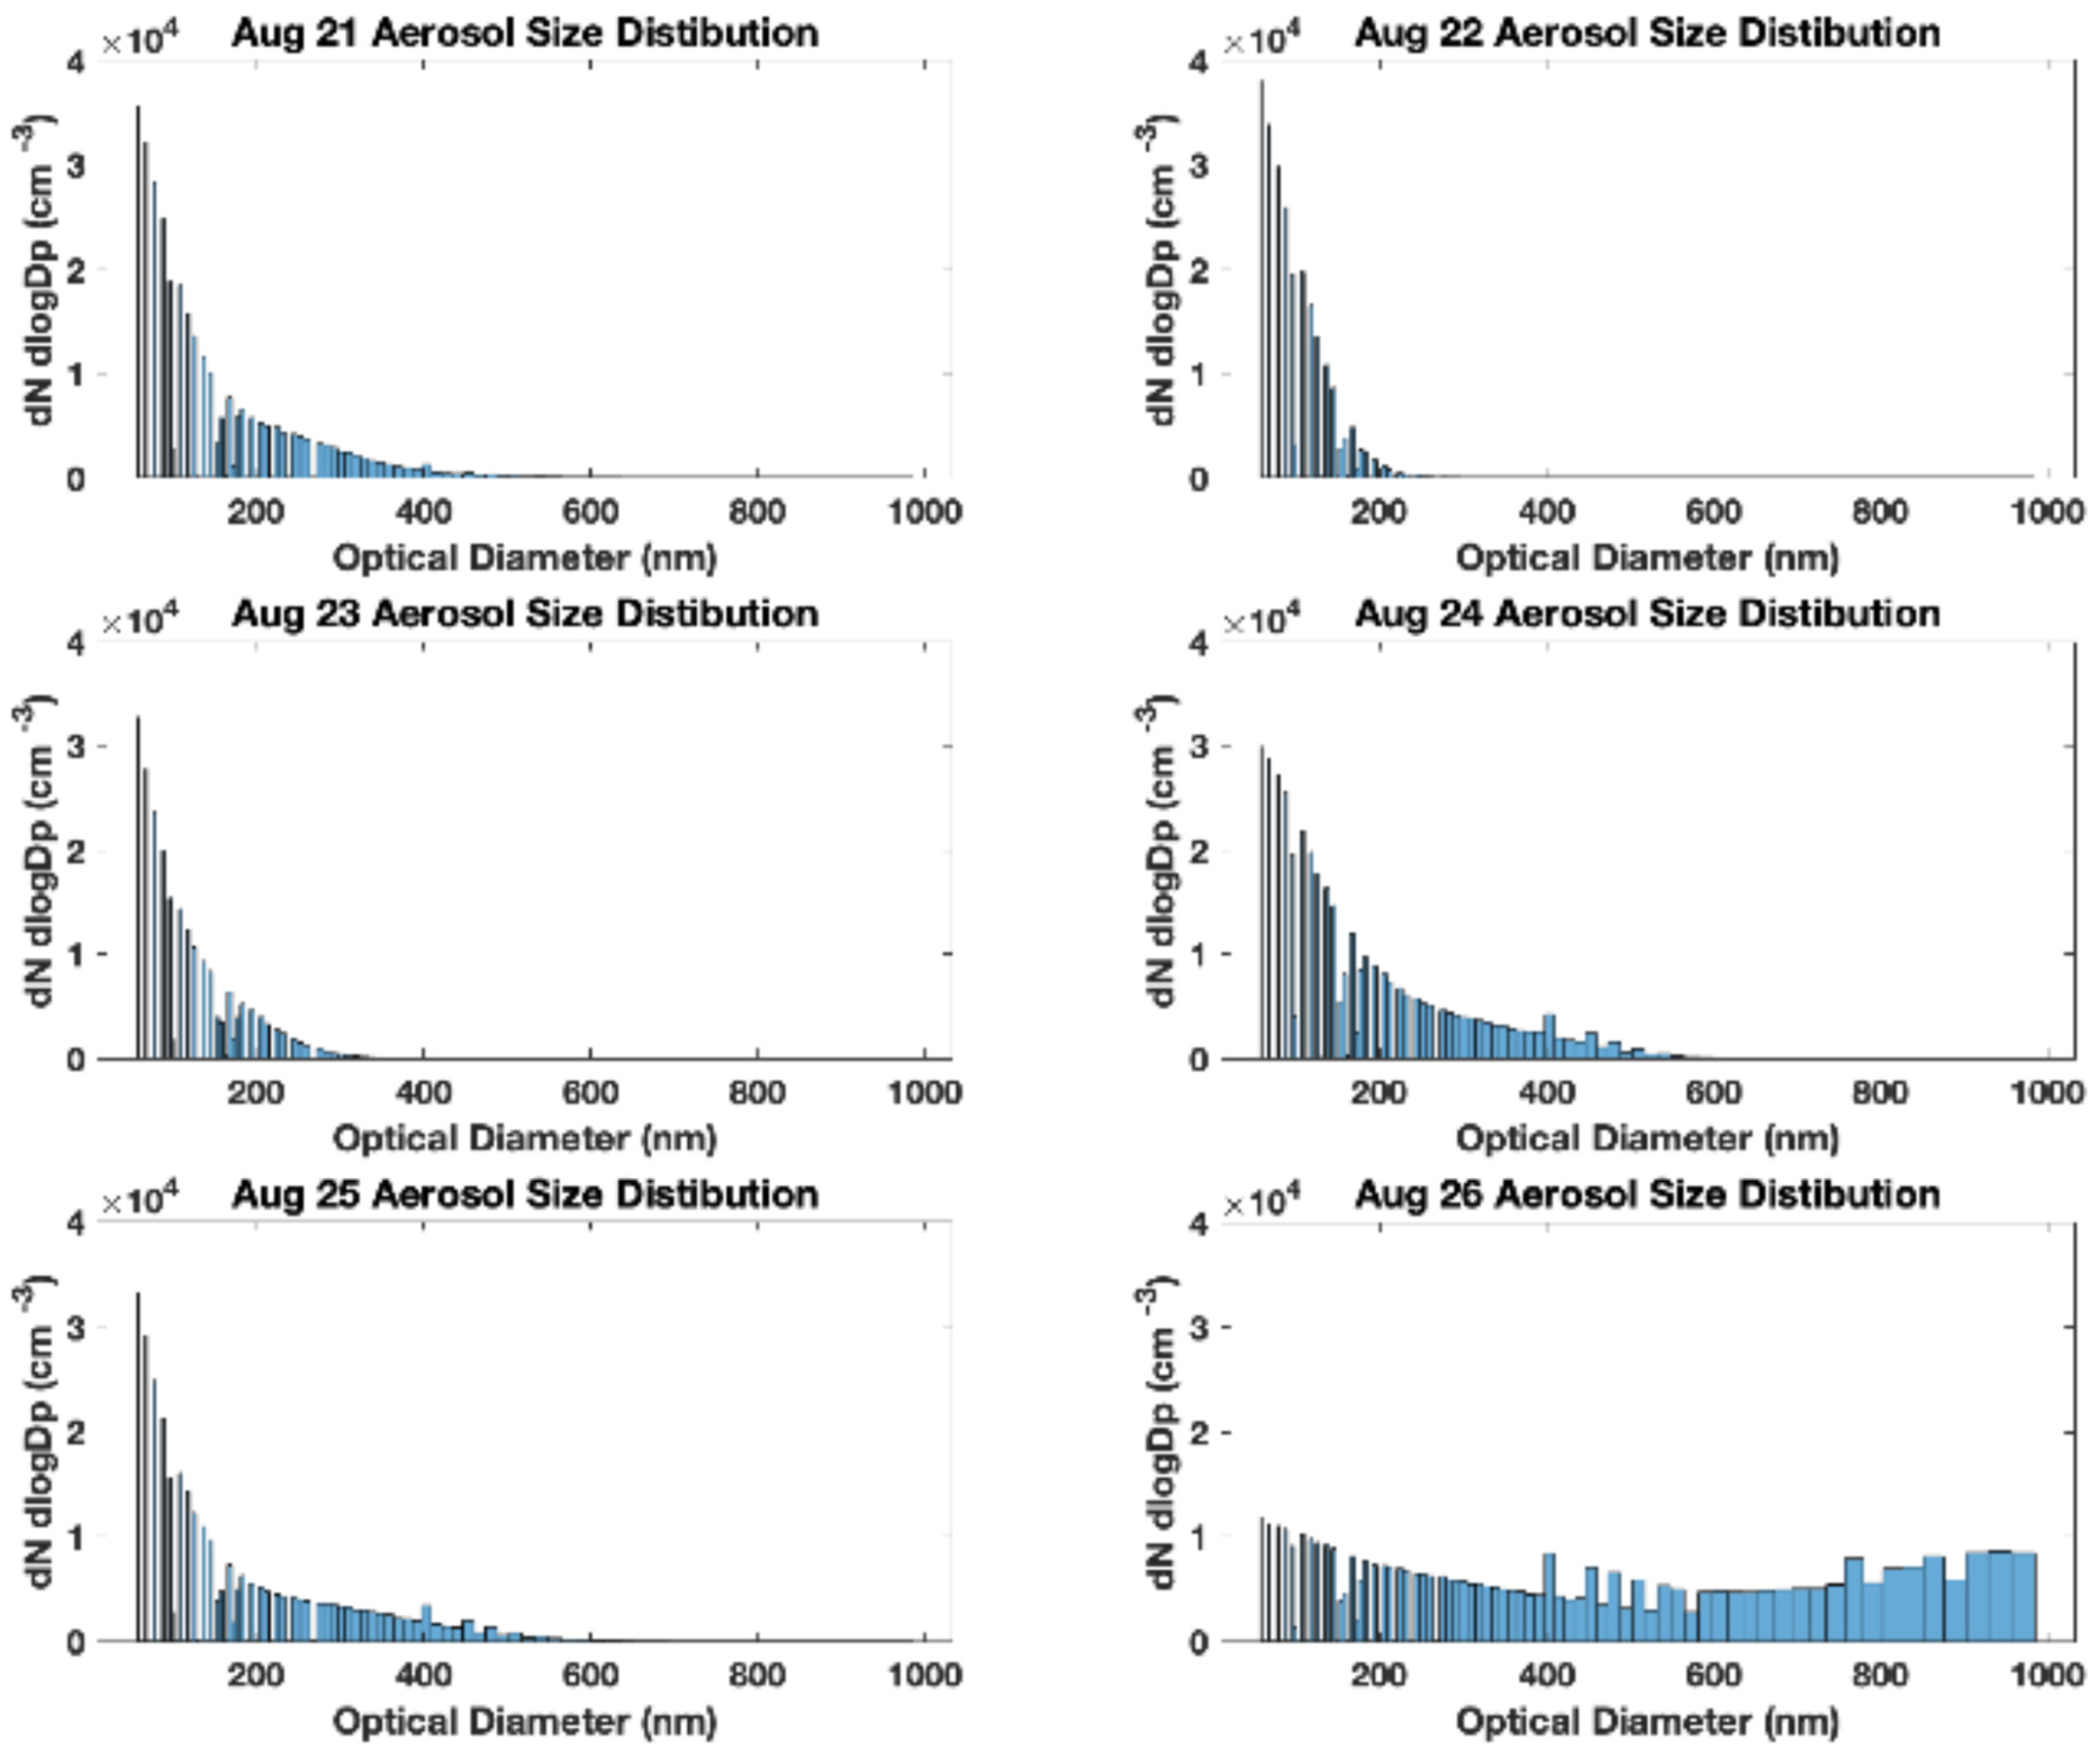
Further evidence of an incoming smoke plume is seen by analyzing aerosol size distributions during the study period (Figure 3). Between 21 and 24 August, measured aerosol optical diameters stayed below 400 nm, with the majority measured below 200 nm. From the 24th to the 25th, the distribution starts to change as larger, more aged particles are advected toward Ascension Island from the African continent. Here, size distributions shift towards slightly larger optical diameters (<600 nm), while there is a decrease in measured particles below 200 nm. On 26 August, there is a rather noticeable shift towards an equal distribution of larger particles due to an influx of accumulation mode aerosols. Measured optical diameters approach ~1 μm, while the number counts for particles in the fine mode (<0.25 nm) decrease by a factor of ~3. Such a “broadening” in the aerosol size distribution in the southeast Atlantic reflects aging as these aerosols are advected further from Africa over the course of several days and agrees with [23].

3.2. MERRA2 Reanalysis

MERRA2 data is used to highlight the evolution of smoke transport and corresponding meteorology during the study period.

3.2.1. Vertical Ozone Distribution

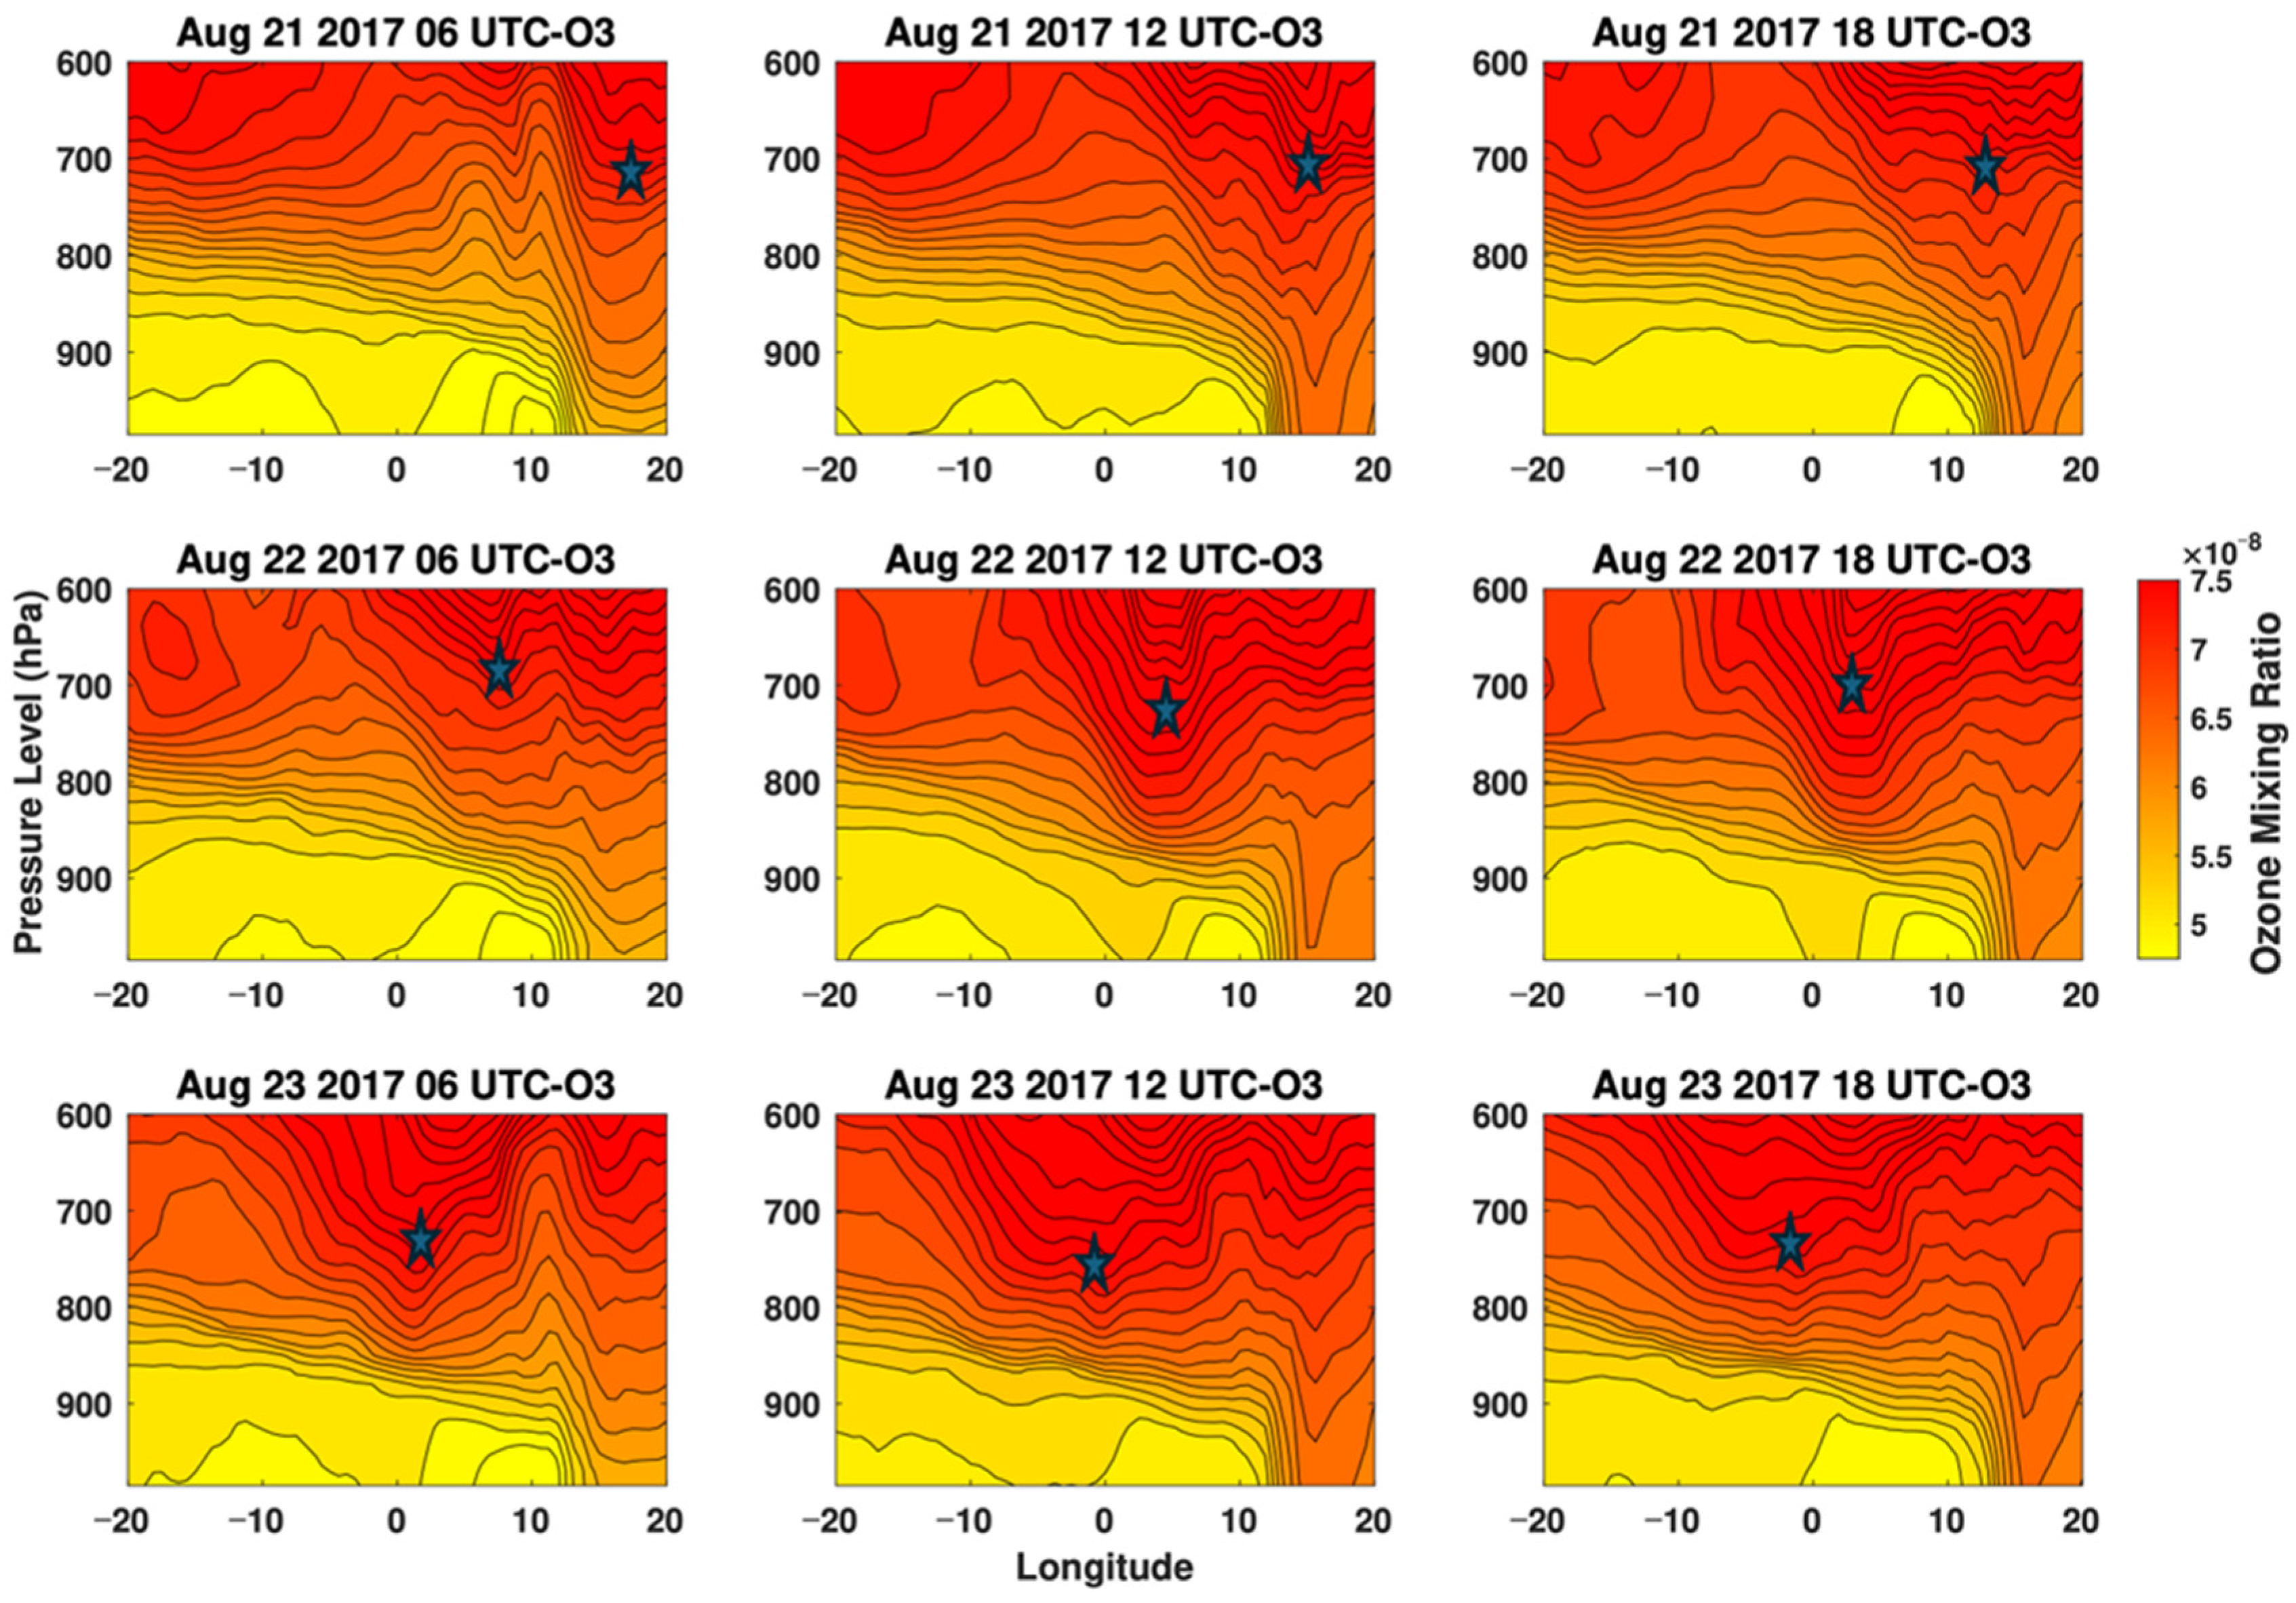
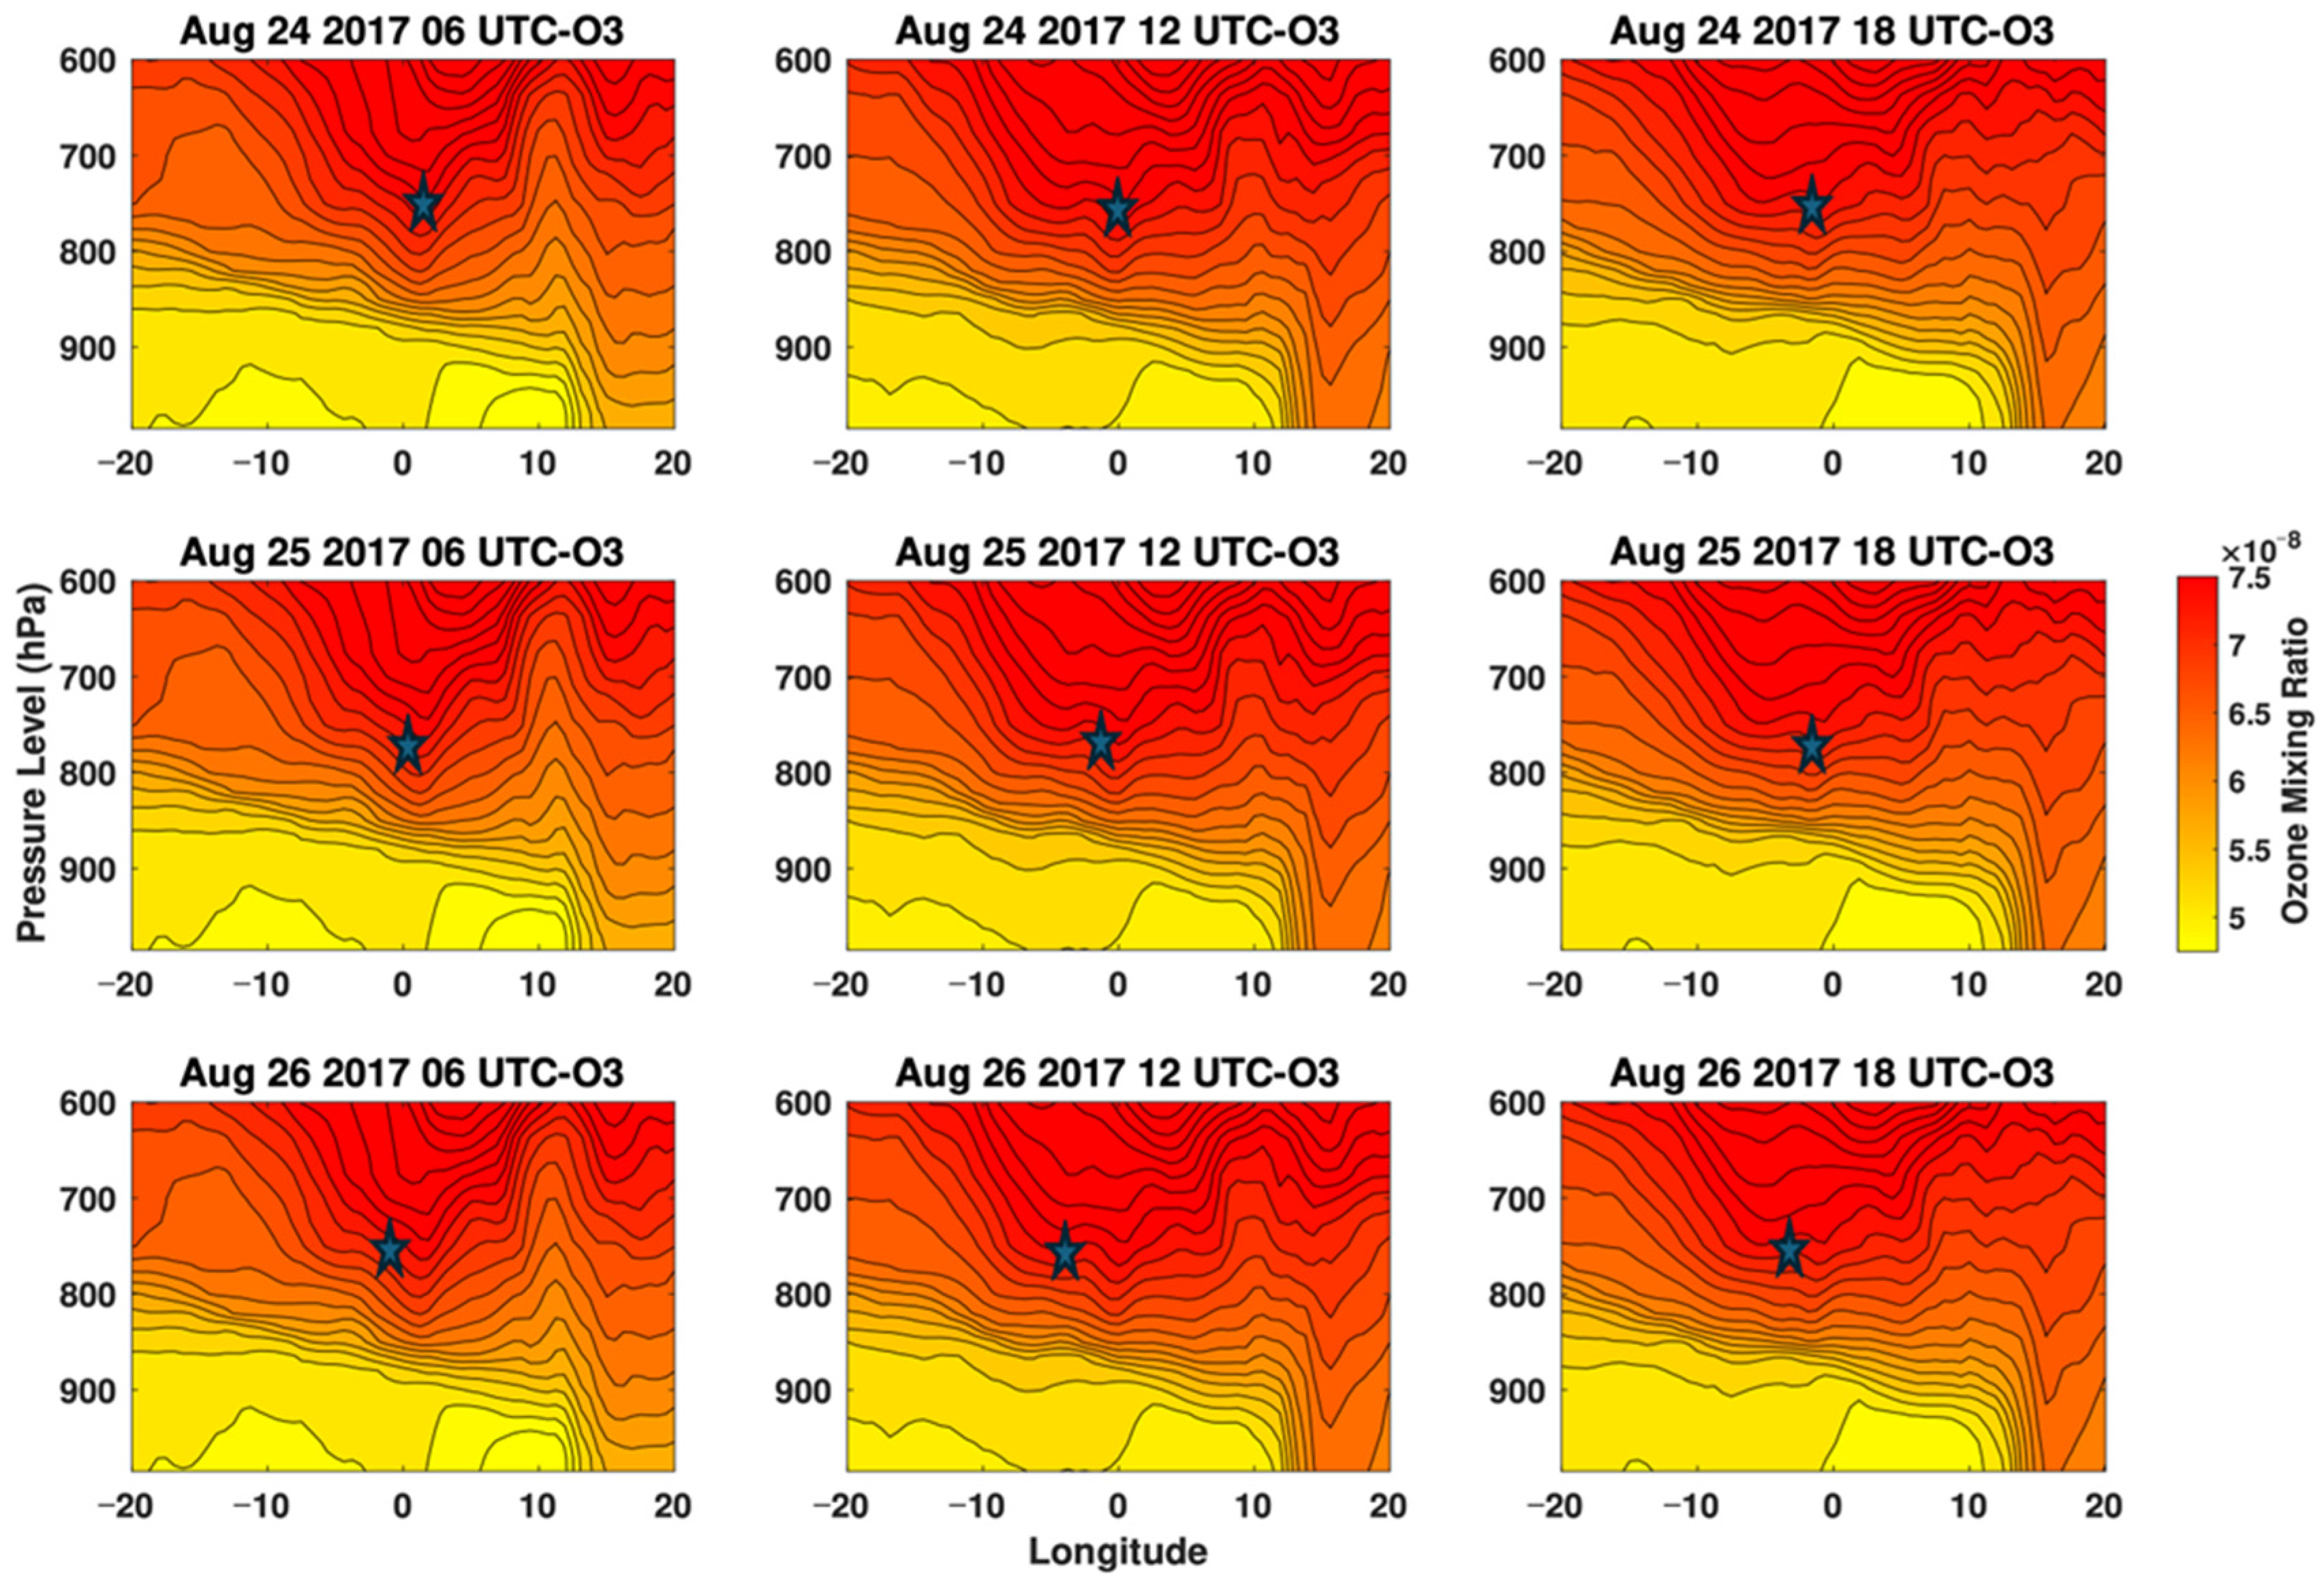
The vertical structure of ozone (averaged between 5° S and 15° S), a known tracer of biomass burning, is evaluated within the lower troposphere between continental Africa and Ascension Island. Mixing ratio values exceed 50 parts per billion by volume (ppbv) throughout the lower troposphere and exceed 70 ppbv above 700 hPa (Figure 4 and Figure 5). On 21 August, the largest vertical gradient for ozone concentrations occurs over land around 700 hPa (highlighted with an asterisk). As the study period progresses, this mass of ozone intrudes into the lower troposphere and reflects a parabolic shape (based on contours of mixing ratio) that migrates westward. On 26 August, this mass reaches its most westward point (Figure 6) and coincides with the surge in observed CO mixing ratio (Figure 2, right). Values exceeding 70 ppbv near the 700 hPa region of Ascension Island agree with [14].

3.2.2. Aerosol Optical Depth

In addition to ozone, vertically integrated AOD is analyzed, and 700 mb wind fields are overlaid, as this region falls within the center of observed aerosol layers and the “ozone plume” highlighted in Figure 5. On 21 August, the spatial aerosol distribution is highest near the central African coast (Figure 6), where AOD values exceed 2.5. The 700 mb wind field highlights the northwesterly trade winds and drives aerosol advection between the 21st to the 23rd, as aerosols are seen reaching Ascension Island (denoted with red asterisk). On 24 August, the trade winds weaken and AOD lessens near Ascension. However, on the 26th, a high-pressure system develops near St. Helena Island and drives the westward transport of aerosols directly to Ascension Island. Further analysis of the wind field on 26 August shows a consistent high-pressure field throughout the day, driving westward transport (Figure 7) and giving rise to the largest AOD values near Ascension Island for the study period. Recent evidence has highlighted the importance of this system in driving biomass burning transport [24].

3.3. HYSPLIT Back Trajectory Analysis

With an understanding of how aerosols and pollutants evolve throughout our study period, HYSPLIT back trajectories were initiated on 27 August at 12:00 UTC, originating from Ascension Island, and allowed to run for five days. The back trajectories show that the smoke plume that arrives at Ascension Island on the 26th originates from Central Africa (Figure 8) and is in the same location as the highest AOD values in the MERRA2 reanalysis (Figure 6). In addition, the higher the smoke resides in altitude above Ascension Island, the further northward its origination point is over Central Africa. The HYSPLIT back trajectories highlight that the aerosol advection transport follows the path of the northern flank of the South Atlantic anticyclone (St. Helena high), with an intensification in southerly transport on the 26th.

3.4. Aerosol Radiative Properties

Here, we focus on the observed, radiative properties of aerosols at Ascension Island and the adjacent equatorial Atlantic during our case study. Several studies have highlighted the importance of aerosol size on the radiative properties of black carbon [25,26]. Further evidence of a smoke plume arrival on the 26th is further exhibited by analyzing black carbon fraction and aerosol absorption coefficients (Figure 9). Between the 21st and 25th, light absorption coefficients remain below 3.5 Mm−1, and black carbon fraction averages under ~250 ng m−3 for the five-day period. However, starting on the morning of the 26th, there is a sharp increase in both variables. Light absorption coefficients rise to values above 7 Mm−3, doubling the previous 5-day average (and tripling in the 464 nm wavelength). The observed increase in absorption is (presumably) due to increases in the black carbon fraction. Within a 24 h period (26 August), the black carbon fraction increases ~500%, from ~250 ng m−3 to ~1250 ng m−3.
More evidence of smoke absorption properties is shown by looking at angstrom exponents and the predominant composition of fine-mode AOD relative to coarse-mode (Figure 10, top). The observed values of AOD from the AERONET site at Ascension Island for August 2017 reveal that the largest measurements occur towards the end of the month. On the 25th, total AOD is measured at ~0.2, with fine-mode AOD measured at ~0.17 (accounting for 85%). By the end of the 26th, total AOD is measured at ~0.47, with fine-mode AOD measured at ~0.43 (91.4%). Such a high composition of fine-mode AOD relative to coarse-mode indicates the arrival of smaller-sized black carbon smoke particles relative to the background coarse-mode sea spray aerosols. The angstrom exponent is a measure of an aerosol’s spectral dependence (how AOD changes with wavelength) and relates to aerosol particle sizes. Generally, AE values less than 1 reflect the dominance of coarse particles (sea spray, dust), while values greater than 1 reflect fine particles (smoke) [27]. Periodically, throughout August 2017, angstrom exponent values exceed 1, reflecting oscillations between influxes of coarse-mode and fine-mode particles arriving at Ascension Island (Figure 10, bottom). Between the 15th and 25th, these values consistently remained below 1, indicating relatively pristine conditions (less smoke), and this is also reflected in AOD measurements, which show a near equal composition of fine-mode and coarse-mode AOD. Angstrom exponent values rise above 1 following the morning of the 22nd and reach the highest values of the month on the 26th (1.47), reflecting further evidence of an incoming smoke plume.
Satellite overpasses in the equatorial Atlantic region on 25 August (Figure 11) and 26 August (Figure 12) reveal the vertical structure of aerosols, including their subtype. Here, we see ample amounts of smoke aerosols nearby Ascension Island within 5 km from the surface. On the 25th, satellite overpasses find that biomass burning aerosols are present between 6.5° S and 12.5° S and 2–5 km in altitude, within the vicinity of Ascension Island. In addition, clouds are present within the same region, and aerosols are assumed to be mixed in. During the 26th (peak aerosol activity), biomass burning aerosols are also present in the region, with the aerosol layer extending further northward. This is possibly due to the strengthening of the St. Helena high-pressure system highlighted in Figure 8. These aerosols, residing between 2 and 4 km, agree with the “ozone plume” highlighted in Figure 5.

4. Discussion

The long-range transport of biomass burning aerosols from Central Africa across the equatorial Atlantic towards Ascension Island is analyzed using reanalysis data, satellite overpasses and ground-based observations from the aerosol robotic network and LASIC campaign. Aerosol measurements during the two-year campaign highlight a maximum towards the end of August 2017. Between 21 and 25 August, conditions over Ascension Island are relatively clean (<200 cm−3 total number concentration), with a biomass burning air mass arriving on the morning of the 26th (>500 cm−3 total number concentration).
Further evidence of an incoming biomass burning plume is shown through measurements of carbon monoxide mixing ratios and aerosol size distributions. Ground measurements from the Atmospheric Radiation Measurement Mobile Facility 1 reveal an increase in aerosol diameter along with number concentration. In the first five days of our study, aerosol diameters remained below 500 nm and quickly increased towards 900 nm on the last day. A broadening of aerosol size distributions not only implies aerosol aging but possibly cloud processing with liquid water, as previously researched in the southeast Atlantic region [23]. As biomass burning aerosols are advected across the Atlantic during our study period, satellite retrievals and reanalysis data reveal this air to be confined between 2 and 5 km, in agreement with aircraft campaigns off the Namibian coast [28] and ozone sondes taken at Ascension Island [14]. We attribute the increase in aerosol concentration over Ascension Island on 26 August to a strengthening of the St. Helena High that leads to a breakdown of the background of northwesterly trade winds and an intensification in westerly transport from the northern side of this pressure system, which has recently been highlighted as driving smoke transport in this region [24]. Such a sudden increase in total number and absorbing aerosol concentrations can influence radiation budgets within the lower atmosphere [29]. In addition, a sudden influx of larger particles has implications for altering regional cloud processes. On a larger scale, a better understanding of the aerosol transport in this region could demystify meteorological influences on aerosol radiative and microphysical impacts on the West African monsoon.
We acknowledge that this research relies on satellite observations that may be subject to uncertainty, in particular, ozone concentrations and clear-sky AOD. Limited observations prevent a complete analysis of biomass burning aerosol transport from source to measurement site. We welcome similar studies that may reinforce or contrast the results presented. Aerosols, clouds and their interactions remain amongst the highest uncertainties towards understanding Earth’s climate [30,31]. It is our hope that this work will serve as the foundation for modeling studies towards better understanding the co-evolution of aerosol–cloud–radiative interactions in the southeast Atlantic region, perhaps even using machine learning capabilities found in [32].

Author Contributions

Conceptualization, O.F.A.; methodology, O.F.A.; software, O.F.A.; validation, O.F.A.; formal analysis, O.F.A.; investigation, O.F.A.; resources, O.F.A.; data curation, O.F.A.; writing—original draft preparation, O.F.A.; writing—review and editing, J.L.W. and M.A.; visualization, O.F.A. and M.A.; supervision, O.F.A.; project administration, O.F.A. and J.L.W.; funding acquisition, O.F.A. All authors have read and agreed to the published version of the manuscript.

Funding

This work was supported by the Department of Energy [grant number DE-SC0022931].

Data Availability Statement

The data in this study can be obtained from www.adc.arm.gov (accessed on 4 November 2024).

Conflicts of Interest

The authors declare no conflicts of interest.

References

  1. Pöhlker, C.; Walter, D.; Paulsen, H.; Könemann, T.; Rodríguez-Caballero, E.; Moran-Zuloaga, D.; Brito, J.; Carbone, S.; Degrendele, C.; Després, V.R.; et al. Land cover and its transformation in the backward trajectory footprint region of the Amazon Tall Tower Observatory. Atmos. Chem. Phys. 2019, 19, 8425–8470. [Google Scholar] [CrossRef]
  2. Holanda, B.A.; Franco, M.A.; Walter, D.; Artaxo, P.; Carbone, S.; Cheng, Y.; Chowdhury, S.; Ditas, F.; Gysel-Beer, M.; Klimach, T.; et al. African biomass burning affects aerosol cycling over the Amazon. Commun. Earth Environ. 2023, 4, 154. [Google Scholar] [CrossRef]
  3. Mylonaki, M.; Gini, M.; Georgopoulou, M.; Pilou, M.; Chalvatzaki, E.; Solomos, S.; Diapouli, E.; Giannakaki, E.; Lazaridis, M.; Pandis, S.N.; et al. Wildfire and African dust aerosol oxidative potential, exposure and dose in the human respiratory tract. Sci. Total Environ. 2024, 913, 169683. [Google Scholar] [CrossRef] [PubMed]
  4. Wells, C.D.; Kasoar, M.; Bellouin, N.; Voulgarakis, A. Local and remote climate impacts of future African aerosol emissions. Atmos. Chem. Phys. 2023, 23, 3575–3593. [Google Scholar] [CrossRef]
  5. Ridley, H.E.; Asmerom, Y.; Baldini, J.U.; Breitenbach, S.F.; Aquino, V.V.; Prufer, K.M.; Culleton, B.J.; Polyak, V.; Lechleitner, F.A.; Kennett, D.J.; et al. Aerosol forcing of the position of the intertropical convergence zone since AD 1550. Nat. Geosci. 2015, 8, 195–200. [Google Scholar] [CrossRef]
  6. Kang, S.M.; Xie, S.P.; Deser, C.; Xiang, B. Zonal mean and shift modes of historical climate response to evolving aerosol distribution. Sci. Bull. 2021, 66, 2405–2411. [Google Scholar] [CrossRef]
  7. Formenti, P.; D’aNna, B.; Flamant, C.; Piketh, S.J.; Schepanski, K.; Waquet, F.; Auriol, F.; Brogniez, G.; Burnet, F.; Chaboureau, J.-P.; et al. The aerosols, radiation and clouds in Southern Africa field campaign in Namibia: Overview, illustrative observations, and way forward. Bull. Am. Meteorol. Soc. 2019, 100, 1277–1298. [Google Scholar] [CrossRef]
  8. Zuidema, P.; Redemann, J.; Haywood, J.; Wood, R.; Piketh, S.; Hipondoka, M.; Formenti, P. Smoke and clouds above the Southeast Atlantic: Upcoming field campaigns probe absorbing aerosol’s impact on climate. Bull. Am. Meteorol. Soc. 2016, 97, 1131–1135. [Google Scholar] [CrossRef]
  9. Zuidema, P.; Alvarado, M.; Chiu, C.; de Szoeke, S.; Fairall, C.; Feingold, G.; Zhu, P. Layered Atlantic Smoke Interactions with Clouds LASIC Science Plan: DOE Office of Science Atmospheric Radiation Measurement (ARM) Program. 2015. Available online: http://www.osti.gov/scitech/servlets/purl/1232658 (accessed on 2 May 2024).
  10. Zhang, J.; Zuidema, P. Sunlight-absorbing aerosol amplifies the seasonal cycle in low-cloud fraction over the southeast Atlantic. Atmos. Chem. Phys. 2021, 21, 11179–11199. [Google Scholar] [CrossRef]
  11. Mari, C.H.; Cailley, G.; Corre, L.; Saunois, M.; Attié, J.L.; Thouret, V.; Stohl, A. Tracing biomass burning plumes from the Southern Hemisphere during the AMMA 2006 wet season experiment. Atmos. Chem. Phys. 2008, 8, 3951–3961. [Google Scholar] [CrossRef]
  12. Adebiyi, A.A.; Zuidema, P. The role of the southern African easterly jet in modifying the southeast Atlantic aerosol and cloud environments. Q. J. R. Meteorol. Soc. 2016, 142, 1574–1589. [Google Scholar] [CrossRef]
  13. Adebiyi, A.A.; Akinsanola, A.A.; Ajoku, O.F. The Misrepresentation of the Southern African Easterly Jet in Models and Its Implications for Aerosol, Clouds, and Precipitation Distributions. J. Clim. 2023, 36, 7785–7809. [Google Scholar] [CrossRef]
  14. Jenkins, G.S.; de Castro, V.; Cunha, B.; Fontanez, I.; Holzworth, R. The evolution of the wave-one ozone maximum during the 2017 LASIC field campaign at Ascension Island. J. Geophys. Res. Atmos. 2021, 126, e2020JD033972. [Google Scholar] [CrossRef]
  15. Sedlacek III, A.J.; Lewis, E.R.; Onasch, T.B.; Zuidema, P.; Redemann, J.; Jaffe, D.; Kleinman, L.I. Using the black carbon particle mixing state to characterize the lifecycle of biomass burning aerosols. Environ. Sci. Technol. 2022, 56, 14315–14325. [Google Scholar] [CrossRef]
  16. Uin, J.; Salwen, C.; Senum, G.; Hayes, C. aosuhsas (01). Oak Ridge National Laboratory (ORNL), Oak Ridge, TN (United States). Atmospheric Radiation Measurement (ARM) Archive; Oak Ridge National Laboratory (ORNL), Oak Ridge, TN (United States). Atmospheric Radiation Measurement (ARM) Data Center, 2014. Available online: https://adc.arm.gov/discovery/#/results/instrument_code::aosuhsas/dataLevel::01 (accessed on 4 November 2024).
  17. Koontz, A.; Stephen, S.; Rebecca, T. aosco. b1. Oak Ridge National Laboratory (ORNL), Oak Ridge, TN (United States). Atmospheric Radiation Measurement (ARM) Archive; Oak Ridge National Laboratory (ORNL), Oak Ridge, TN (United States). Atmospheric Radiation Measurement (ARM) Data Center, 2016. Available online: https://adc.arm.gov/discovery/#/results/instrument_code::aosco/dataLevel::b1 (accessed on 4 November 2024).
  18. Koontz, A.; Flynn, C.; Shilling, J. aoppsap1flynn1h. c1. Oak Ridge National Laboratory (ORNL), Oak Ridge, TN (United States). Atmospheric Radiation Measurement (ARM) Archive; Oak Ridge National Laboratory (ORNL), Oak Ridge, TN (United States). Atmospheric Radiation Measurement (ARM) Data Center, 2021. Available online: https://adc.arm.gov/discovery/#/results/instrument_code::aoppsap1flynn1h (accessed on 4 November 2024).
  19. Randles, C.A.; Da Silva, A.M.; Buchard, V.; Colarco, P.R.; Darmenov, A.; Govindaraju, R.; Smirnov, A.; Holben, B.; Ferrare, R.; Hair, J.; et al. The MERRA-2 aerosol reanalysis, 1980 onward. Part I: System description and data assimilation evaluation. J. Clim. 2017, 30, 6823–6850. [Google Scholar] [CrossRef]
  20. Stein, A.F.; Draxler, R.R.; Rolph, G.D.; Stunder, B.J.; Cohen, M.D.; Ngan, F. NOAA’s HYSPLIT atmospheric transport and dispersion modeling system. Bull. Am. Meteorol. Soc. 2015, 96, 2059–2077. [Google Scholar] [CrossRef]
  21. Giles, D.M.; Sinyuk, A.; Sorokin, M.G.; Schafer, J.S.; Smirnov, A.; Slutsker, I.; Eck, T.F.; Holben, B.N.; Lewis, J.R.; Campbell, J.R.; et al. Advancements in the Aerosol Robotic Network (AERONET) Version 3 database–automated near-real-time quality control algorithm with improved cloud screening for Sun photometer aerosol optical depth (AOD) measurements. Atmos. Meas. Tech. 2019, 12, 169–209. [Google Scholar] [CrossRef]
  22. NASA/LARC/SD/ASDC, Calipso Lidar Level 2 Aerosol Profile, V4-51. Available online: https://doi.org/10.5067/CALIOP/CALIPSO/CAL_LID_L2_05kmAPro-Standard-V4-51 (accessed on 4 November 2024).
  23. Che, H.; Segal-Rozenhaimer, M.; Zhang, L.; Dang, C.; Zuidema, P.; Dobracki, A.; Sedlacek, A.J., III; Coe, H.; Wu, H.; Taylor, J.; et al. Cloud processing and weeklong ageing affect biomass burning aerosol properties over the south-eastern Atlantic. Commun. Earth Environ. 2022, 3, 182. [Google Scholar] [CrossRef]
  24. Dezfuli, A.; Ichoku, C.M.; Bosilovich, M.G. Bosilovich. Large-scale climate features control fire emissions and transport in Africa. Geophys. Res. Lett. 2024, 51, e2024GL110179. [Google Scholar] [CrossRef]
  25. Luo, J.; Zhang, Y.; Zhang, Q.; Wang, F.; Liu, J.; Wang, J. Sensitivity analysis of morphology on radiative properties of soot aerosols. Opt. Express 2018, 26, A420–A432. [Google Scholar] [CrossRef] [PubMed]
  26. Luo, J.; Zhang, Y.; Zhang, Q. The Ångström exponent and single-scattering albedo of black carbon: Effects of different coating materials. Atmosphere 2020, 11, 1103. [Google Scholar] [CrossRef]
  27. Eck, T.F.; Holben, B.N.; Reid, J.S.; Dubovik, O.; Smirnov, A.; O’neill, N.T.; Slutsker, I.; Kinne, S. Wavelength dependence of the optical depth of biomass burning, urban, and desert dust aerosols. J. Geophys. Res. Atmos. 1999, 104, 31333–31349. [Google Scholar] [CrossRef]
  28. Chazette, P.; Flamant, C.; Totems, J.; Gaetani, M.; Smith, G.; Baron, A.; Landsheere, X.; Desboeufs, K.; Doussin, J.F.; Formenti, P. Evidence of the complexity of aerosol transport in the lower troposphere on the Namibian coast during AEROCLO-sA. Atmos. Chem. Phys. 2019, 19, 14979–15005. [Google Scholar] [CrossRef]
  29. Ajoku, O.; Norris, J.; Miller, A.J. Observed monsoon precipitation suppression caused by anomalous interhemispheric aerosol. Clim. Dyn. 2019, 54, 1077–1091. [Google Scholar] [CrossRef]
  30. Lee, L.A.; Reddington, C.L.; Carslaw, K.S. On the relationship between aerosol model uncertainty and radiative forcing uncertainty. Proc. Natl. Acad. Sci. USA 2016, 113, 5820–5827. [Google Scholar] [CrossRef]
  31. Choudhury, G.; Block, K.; Haghighatnasab, M.; Quaas, J.; Goren, T.; Tesche, M. Pristine oceans are a significant source of uncertainty in quantifying global cloud condensation nuclei. Atmos. Chem. Phys. 2025, 25, 3841–3856. [Google Scholar] [CrossRef]
  32. Hu, A.V.; Kabala, Z.J. Predicting and Reconstructing Aerosol–Cloud–Precipitation Interactions with Physics-Informed Neural Networks. Atmosphere 2023, 14, 1798. [Google Scholar] [CrossRef]
Figure 1. Daily averaged total number concentration measured at Ascension Island for 2016 and 2017 southern Africa biomass burning seasons. The peak of the burning season spans from July to October.
Atmosphere 16 00997 g001
Figure 2. Daily averaged aerosol number concentration (left) and carbon monoxide mixing ratios (right) measured at Ascension Island for 2017 southern Africa biomass burning season.
Atmosphere 16 00997 g002
Figure 3. Evolution of aerosol size distribution as measured by the Atmospheric Radiation Measurement Mobile Facility on site at Ascension Island.
Atmosphere 16 00997 g003
Figure 4. Meridionally averaged ozone mixing ratio for 21–23 August 2017 at 0600 UTC, 1200 UTC and 1800 UTC. Data is averaged between 5 °S and 15 °S. Gray stars in each image represent locations with the steepest vertical mixing ratio gradients.
Atmosphere 16 00997 g004
Figure 5. Same as Figure 4, but for 24–26 August.
Atmosphere 16 00997 g005
Figure 6. Aerosol optical depth overlaid with 700 mb winds at 1800 UTC for 21–26 August. The high-pressure system is highlighted on the 26th with a bold “H”. The red star represents the location of Ascension Island. Reference arrows. The reference arrow represents a wind intensity of 10 meters per second.
Atmosphere 16 00997 g006
Figure 7. Same as Figure 6 but only for 26 August at 0600 UTC (left) and 1200 UTC (right). The high-pressure system is highlighted on the 26th with a bold “H”.
Atmosphere 16 00997 g007
Figure 8. Hybrid Single-Particle Lagrangian Trajectory back trajectories initiated at Ascension Island. HYSPLIT trajectories are coupled with Global Data Assimilation System meteorological data, allowed to run for 5 days, and are initiated at 2 km (red), 2.5 km (dark blue), 3 km (green) and 3.5 km (light blue).
Atmosphere 16 00997 g008
Figure 9. Aerosol absorption coefficients measured at 464 nm, 528.6 nm and 648.3 nm wavelengths (left) and black carbon fraction at 520 nm (right) as measured by the Atmospheric Radiation Measurement Mobile Facility 1 at Ascension Island. Units for light absorption coefficient and BC fraction are Mm−1 and ng m−3, respectively.
Atmosphere 16 00997 g009
Figure 10. Ground-based AOD (top) and angstrom exponent measurements obtained from AERONET for August 2017. AOD values are broken down into their fine-mode and coarse-mode components. Missing information from this AERONET site does not impact the study period.
Atmosphere 16 00997 g010
Figure 11. Vertical aerosol subtype (top left) represented by different colors and corresponding satellite swath (right) for 25 August 2017 provided by CALIOP. The blue portion of the satellite swath corresponds with the coordinates of plotted aerosol subtypes. The vertical feature mask (bottom left) also includes the presence of clouds (cyan and magenta).
Atmosphere 16 00997 g011
Figure 12. Same as Figure 11, but for 26 August 2017.
Atmosphere 16 00997 g012
Disclaimer/Publisher’s Note: The statements, opinions and data contained in all publications are solely those of the individual author(s) and contributor(s) and not of MDPI and/or the editor(s). MDPI and/or the editor(s) disclaim responsibility for any injury to people or property resulting from any ideas, methods, instructions or products referred to in the content.