Article

Impact of Spatial Resolution on River Flow Simulation Based on the Total Runoff Integrating Pathway (TRIP) Model

1
Department of Atmospheric Sciences, Kongju National University, Gongju 32588, Republic of Korea
2
Earth Environment Research Center, Kongju National University, Gongju 32588, Republic of Korea
3
Forecast Bureau, Korea Meteorological Administration, Seoul 07062, Republic of Korea
*
Authors to whom correspondence should be addressed.
Atmosphere 2025, 16(9), 1083; https://doi.org/10.3390/atmos16091083
Submission received: 27 June 2025 / Revised: 23 August 2025 / Accepted: 11 September 2025 / Published: 15 September 2025
(This article belongs to the Section Atmospheric Techniques, Instruments, and Modeling)

Abstract

Although the impact of spatial resolution on river flow simulation has been examined in several studies, unresolved uncertainties remain regarding parameter sensitivity and the applicability of different routing models. This study investigated the resolution dependency of the total runoff integrating pathway (TRIP) river routing model while focusing on East Asia. With the increasing spatial resolution of Earth system models (ESMs), understanding the effects of resolution changes on river discharge characteristics is essential for conducting accurate hydrological simulations. In this study, we conducted sensitivity experiments using the TRIP model at resolutions of 0.5°, 1°, and 0.125° while considering idealized and real-case scenarios. The results indicate significant improvements in the representation of river networks and discharge dynamics at higher resolutions, highlighting the need for parameter adjustments, particularly with respect to flow velocity and meandering factors. Parameters were optimized based on matching the travel time of runoff from precipitation sources to river mouths. The optimized parameters yielded consistent river storage and discharge results across different resolutions, enhancing the reliability of high-resolution hydrological modeling. Our study highlights the importance of resolution-aware modeling in improving the simulations of hydrological processes in different climate systems. Notably, our study can serve as a foundation for future interdisciplinary studies on climate modeling, river discharge and flow simulations, and hydrogeology.

1. Introduction

In recent decades, East Asia has experienced rapid socioeconomic changes driven by significant economic growth, leading to increased urbanization; this has resulted in large populations concentrated in cities and an expansion in agricultural lands to support these urban areas. As a result, the demand for water resources for direct urban consumption and agricultural irrigation has increased sharply. Urbanization leads to not only increased water demand but also changes in land-use patterns, impacting regional hydrological cycles [1]. Furthermore, urban expansion can reduce natural water retention capacity, exacerbating water scarcity and management issues. These problems are expected to worsen in the future, owing to climate change [2].
These challenges are particularly pronounced in rapidly urbanizing regions, such as East Asia. This region is one of the most rapidly urbanizing areas globally, with the expansion of urban infrastructure and increasing agricultural activities resulting in complex effects on the regional climatic systems and hydrological cycles. Zhu et al. [3] investigated the impact of urbanization on the lakes, nearby rivers, and groundwater in the North China Plain, revealing that rivers and lakes are the primary groundwater recharge sources that are influenced by human activities. Li et al. [4] concluded that agricultural groundwater extraction leads to declining groundwater levels; groundwater aquifers are subsequently recharged by river water.
Understanding inland hydrological dynamics, such as soil moisture and river discharge, is crucial for the efficient use of water resources. These factors are highly sensitive to regional environmental conditions, including land-use, vegetation, soil characteristics, terrain, and watershed properties. Regional climate generally interacts intricately with terrestrial hydrological cycles. Unlike earlier studies that viewed hydrological processes as passive climate outcomes, recent studies revealed that continental freshwater reservoirs have an active influence on regional climate systems [5,6,7,8,9,10].
Novel studies based on Earth system models (ESMs) are required to gain a deeper understanding of the hydrological characteristics and interactions between various natural components [11]. Note that ESMs simulate the interactions between land, oceans, and the atmosphere, enabling the analysis of the hydrological features within a climate system. Recent advances in computing technology facilitate the development of high-resolution ESMs [12]. In particular, high-resolution models have been proven to be effective in capturing the spatial heterogeneity of hydrological processes [13]; these models allow for the precise delineation of river networks, tributary systems, and floodplains Recent studies have further advanced high-resolution hydrological modeling and routing: Towler et al. [14] benchmarked continental-scale, high-resolution models such as Weather Research and Forecasting Hydrological modeling system (WRF-Hydro) and National Hydrologic Model version 1.0 (NHMv1.0); Boeing et al. [15] evaluated the accuracy of drought simulations in Germany using the Mesoscale Hydrologic Model (mHM) against observations; and Hanasaki et al. [16] applied the H08 Global Water Resources Model (H08) at an ultra-fine resolution on Kyushu Island, explicitly incorporating human water management activities. Collectively, these efforts underscore the necessity of evaluating river routing models under increasing resolutions—an objective central to the present TRIP study. However, transitioning to higher resolutions can also lead to unexpected model behaviors. Elements representing spatial flow (e.g., river discharge and flow) require careful treatment, as they interact across multiple grids within an ESM. Thus, parameter optimization is crucial to ensure consistency with observations and accurately represent regional hydrological characteristics.
In this study, we investigated the resolution dependency and parameter characteristics of the total runoff integrating pathway (TRIP) model for the context of East Asia. The TRIP model is a river routing model that can convert runoff into river discharge, using a global river network [17,18,19,20]. The TRIP model has been extensively employed in hydrological research and climate change scenario production coupled with atmospheric models. With the recent increase in atmospheric model resolutions, there is an emerging need to correspondingly enhance the resolution of the TRIP model. However, most existing applications have been conducted at coarse (1°) or mid-resolution (0.5°) scales, leaving uncertainties about how resolution influences tributary representation, discharge timing, and parameter sensitivity (e.g., flow velocity and meandering factor). Without systematic evaluation across resolutions, the reliability of TRIP applications in high-resolution ESMs remains unclear. This knowledge gap motivates our study, which directly assesses resolution dependency and develops a resolution-aware calibration framework. High-resolution modeling is particularly important for capturing detailed river structures and accurately representing flow dynamics, but it requires careful adjustment of parameters such as flow velocity and meandering factors to ensure consistency across scales.
Given these challenges, this study is motivated by a fundamental question: “What is required to ensure consistent hydrological interpretation of river routing models as spatial resolution increases?” To address this research aim, we advance the TRIP framework in three distinct ways, each designed to directly test how spatial resolution affects discharge timing, tributary representation, and parameter sensitivity. First, we employ both idealized and real-case experiments, allowing us to separately analyze pure routing mechanisms and their application under realistic meteorological conditions. Second, we introduce a resolution-aware calibration approach in which the meandering factor is systematically adjusted to compensate for resolution-induced path-length biases and to maintain consistent travel times across scales. Third, we construct a new high-resolution (0.125°) TRIP dataset for East Asia, which explicitly resolves river curvature and tributary structures. Within this framework, we further optimized the parameters to reflect the watershed characteristics of major Chinese rivers, including the Yangtze and Yellow rivers, thereby evaluating the applicability and predictive accuracy of the model in a region characterized by complex hydrological environments, which directly supports our central objective of clarifying how resolution affects river discharge simulations and parameter calibration.
To clearly demonstrate the impact of resolution, we adopted a comparative evaluation strategy involving idealized experiments with artificial precipitation and real-case experiments based on observed precipitation events. Section 2 describes the structure of the model and experimental settings used in this study, Section 3 discusses the results of the idealized and real-case scenarios considered in this work. Section 4 summarizes the major findings and future research directions of this study.

2. Materials and Methods

2.1. River Routing Model

In this study, the TRIP model [18] was used to analyze the characteristics of surface runoff in East Asia across different resolution grids. Note that the TRIP model is a simple river routing model that converts the runoff generated in each grid into river discharge, based on the global river network. This process accounts for the runoff transmission between grids, using the information on flow direction. In general, the TRIP model is based on a simple reservoir with surface runoff ( Q i n ) as the input and river discharge ( Q o u t ) as the output. The change in river storage ( S ) in the reservoir can be expressed as follows:
d S d t = Q i n Q o u t ;   Q o u t = v τ d S
where v [m s−1] is the effective velocity, d [m] is the river length, τ [dimensionless] is the meandering factor representing river curvature, S [kg m−2] is the river storage, and Q [kg s−1] denotes river discharge.
The TRIP model was developed by the Institute of Industrial Science (IIS) at the University of Tokyo (TKU) [17]. The TKU provides 1° and 0.5° directional data constructed using the Earth topography five-minute grid (ETOPO5) global digital elevation map (DEM) [21]. These data were validated in numerous previous studies [19,20,22]. In this study, we used directional data from the Northwest Territories Geological Survey (NTGS), along with the TKU data, to operate the TRIP model (at a resolution of 0.125°).
Figure 1 presents the river direction data acquired from the TKU and NTGS datasets at various resolutions. At the resolution of 1° (Figure 1a,c), coastal and major river features were simplified, while at the resolution of 0.5° (Figure 1b,d), these features were distinct. Notably, at the resolution of 0.125° (Figure 1e), high-resolution data allowed for a more detailed representation of coastal and lowland structures along the eastern coast of China, the Korean Peninsula, and Japan. The NTGS data with resolutions of 1° and 0.5° depicted the coastlines of the Korean Peninsula and Japan less accurately than the TKU data. However, this issue was alleviated with increasing resolution, as the 0.125° data aligned well with the actual coastline features. This demonstrates that higher resolution can enable models to better capture the fine structures of river networks.
In addition to the river direction data, river sequence data were required to run the TRIP model. The river sequence data for the study region were generated by reprocessing the river direction data. First, all the non-ocean grids were initialized with a value of 1. Then, the sequence values were propagated downstream to one of the eight surrounding grids, based on the river direction information. This process was repeated; the resulting sequence value represented the total number of upstream grids for a given grid. Figure 2 presents the river sequence data generated for each resolution (based on the river direction data). Grids with significantly higher sequence values than their neighboring cells indicate locations where runoff from a larger number of upstream grids converges, and the linkage of such grids delineates the primary structure of the river network. The river sequence distributions between the TKU and NTGS data were similar for the resolutions of 1° and 0.5° (Figure 2a–d). The major flows of the Yangtze and Yellow rivers and their associated tributaries in the two datasets were relatively consistent. Compared to low-resolution data, high-resolution data (Figure 2e) provided a more detailed representation of the river networks in the region, depicting the main flows and tributaries of the Yangtze and Yellow rivers with more clarity. This level of detail can significantly affect the calculations of river discharge and storage. Additionally, the river flow features in the Korean Peninsula and Japan, which were not represented effectively in the low-resolution data, appeared more distinct in the high-resolution data (Figure 2e).

2.2. Atmospheric Forcing Data

To simulate land surface models, including river routing models such as TRIP, meteorological information would be required to serve as atmospheric forcing. In this study, we used high-resolution (T126, approximately 100 km) downscaled data (hereafter referred to as DA126) produced by Kim and Hong [23] as the atmospheric forcing data. The DA126 data were generated using the Global/Regional Integrated Model System (GRIMs) [24]. For the large-scale initial and boundary conditions of the GRIMs model, we used the six-hour National Centers for Environmental Prediction (NCEP)/Department of Energy (DOE) reanalysis-II [25] data for 1979–2014. The dynamic global downscaling method applies spectral nudging techniques that are used only for wavelengths exceeding 2000 km. The reliability of the DA126 data has been validated in previous studies [23,26]. Since the spatial resolution of the atmospheric forcing data (approximately 100 km) differed from that of the land surface model grid (0.125° to 1°), bilinear interpolation was applied to remap the DA126 forcing variables onto the target model grid. This ensured spatial consistency between the meteorological inputs and the land surface grid resolution.

2.3. Experiment Design

We used the Joint U.K. Land Environment Simulator (JULES) to execute and optimize the TRIP model. Note that JULES can be used as the land surface scheme for the Met Office Unified Model (UM) [27] or as a standalone application. The TRIP model was integrated with JULES and processed internally within the system. It received the runoff results generated by JULES as input and calculated the river flow rates. Subsequently, the river flow rates and redistributed runoff produced by the TRIP model were transferred back to JULES.
Before conducting high-resolution experiments, we carried out an idealized experiment. For the idealized experiment, we utilized the 1°-resolution input data; for the TRIP model, the data for three different resolutions (1°, 0.5°, and 0.125°) were integrated with the JULES data, executed over a seven-day period. Artificial precipitation was simulated over a region spanning from 100–109° E to 25–35° N. This region, located in the upstream areas of the Yangtze and Yellow rivers, was identified as the optimal location for analyzing the river flow characteristics at the regional scale. In this experiment, the river direction and sequence data provided by the NTSG were used to configure the TRIP model for 0.125° resolution, thereby ensuring a more accurate representation of the river flow and runoff characteristics at high resolutions. The idealized experiment was conducted with uniform initial conditions, including zero river storage and default soil moisture values. No infiltration process was activated in order to isolate the effect of precipitation on river routing.
Based on the results of the idealized experiment, the modified parameters were applied to conduct a real-case experiment. The real-case experiment was performed during 20–27 August 2014, during which substantial precipitation was observed in inland China. Therefore, this experiment was also conducted to analyze the effects of heavy rainfall on river flow simulations. Unlike the idealized setup, the real-case simulation incorporated actual meteorological forcings, realistic initial soil moisture, and active infiltration processes, allowing for a more realistic representation of hydrological dynamics under heavy precipitation conditions.

3. Results

3.1. Idealization Experiment

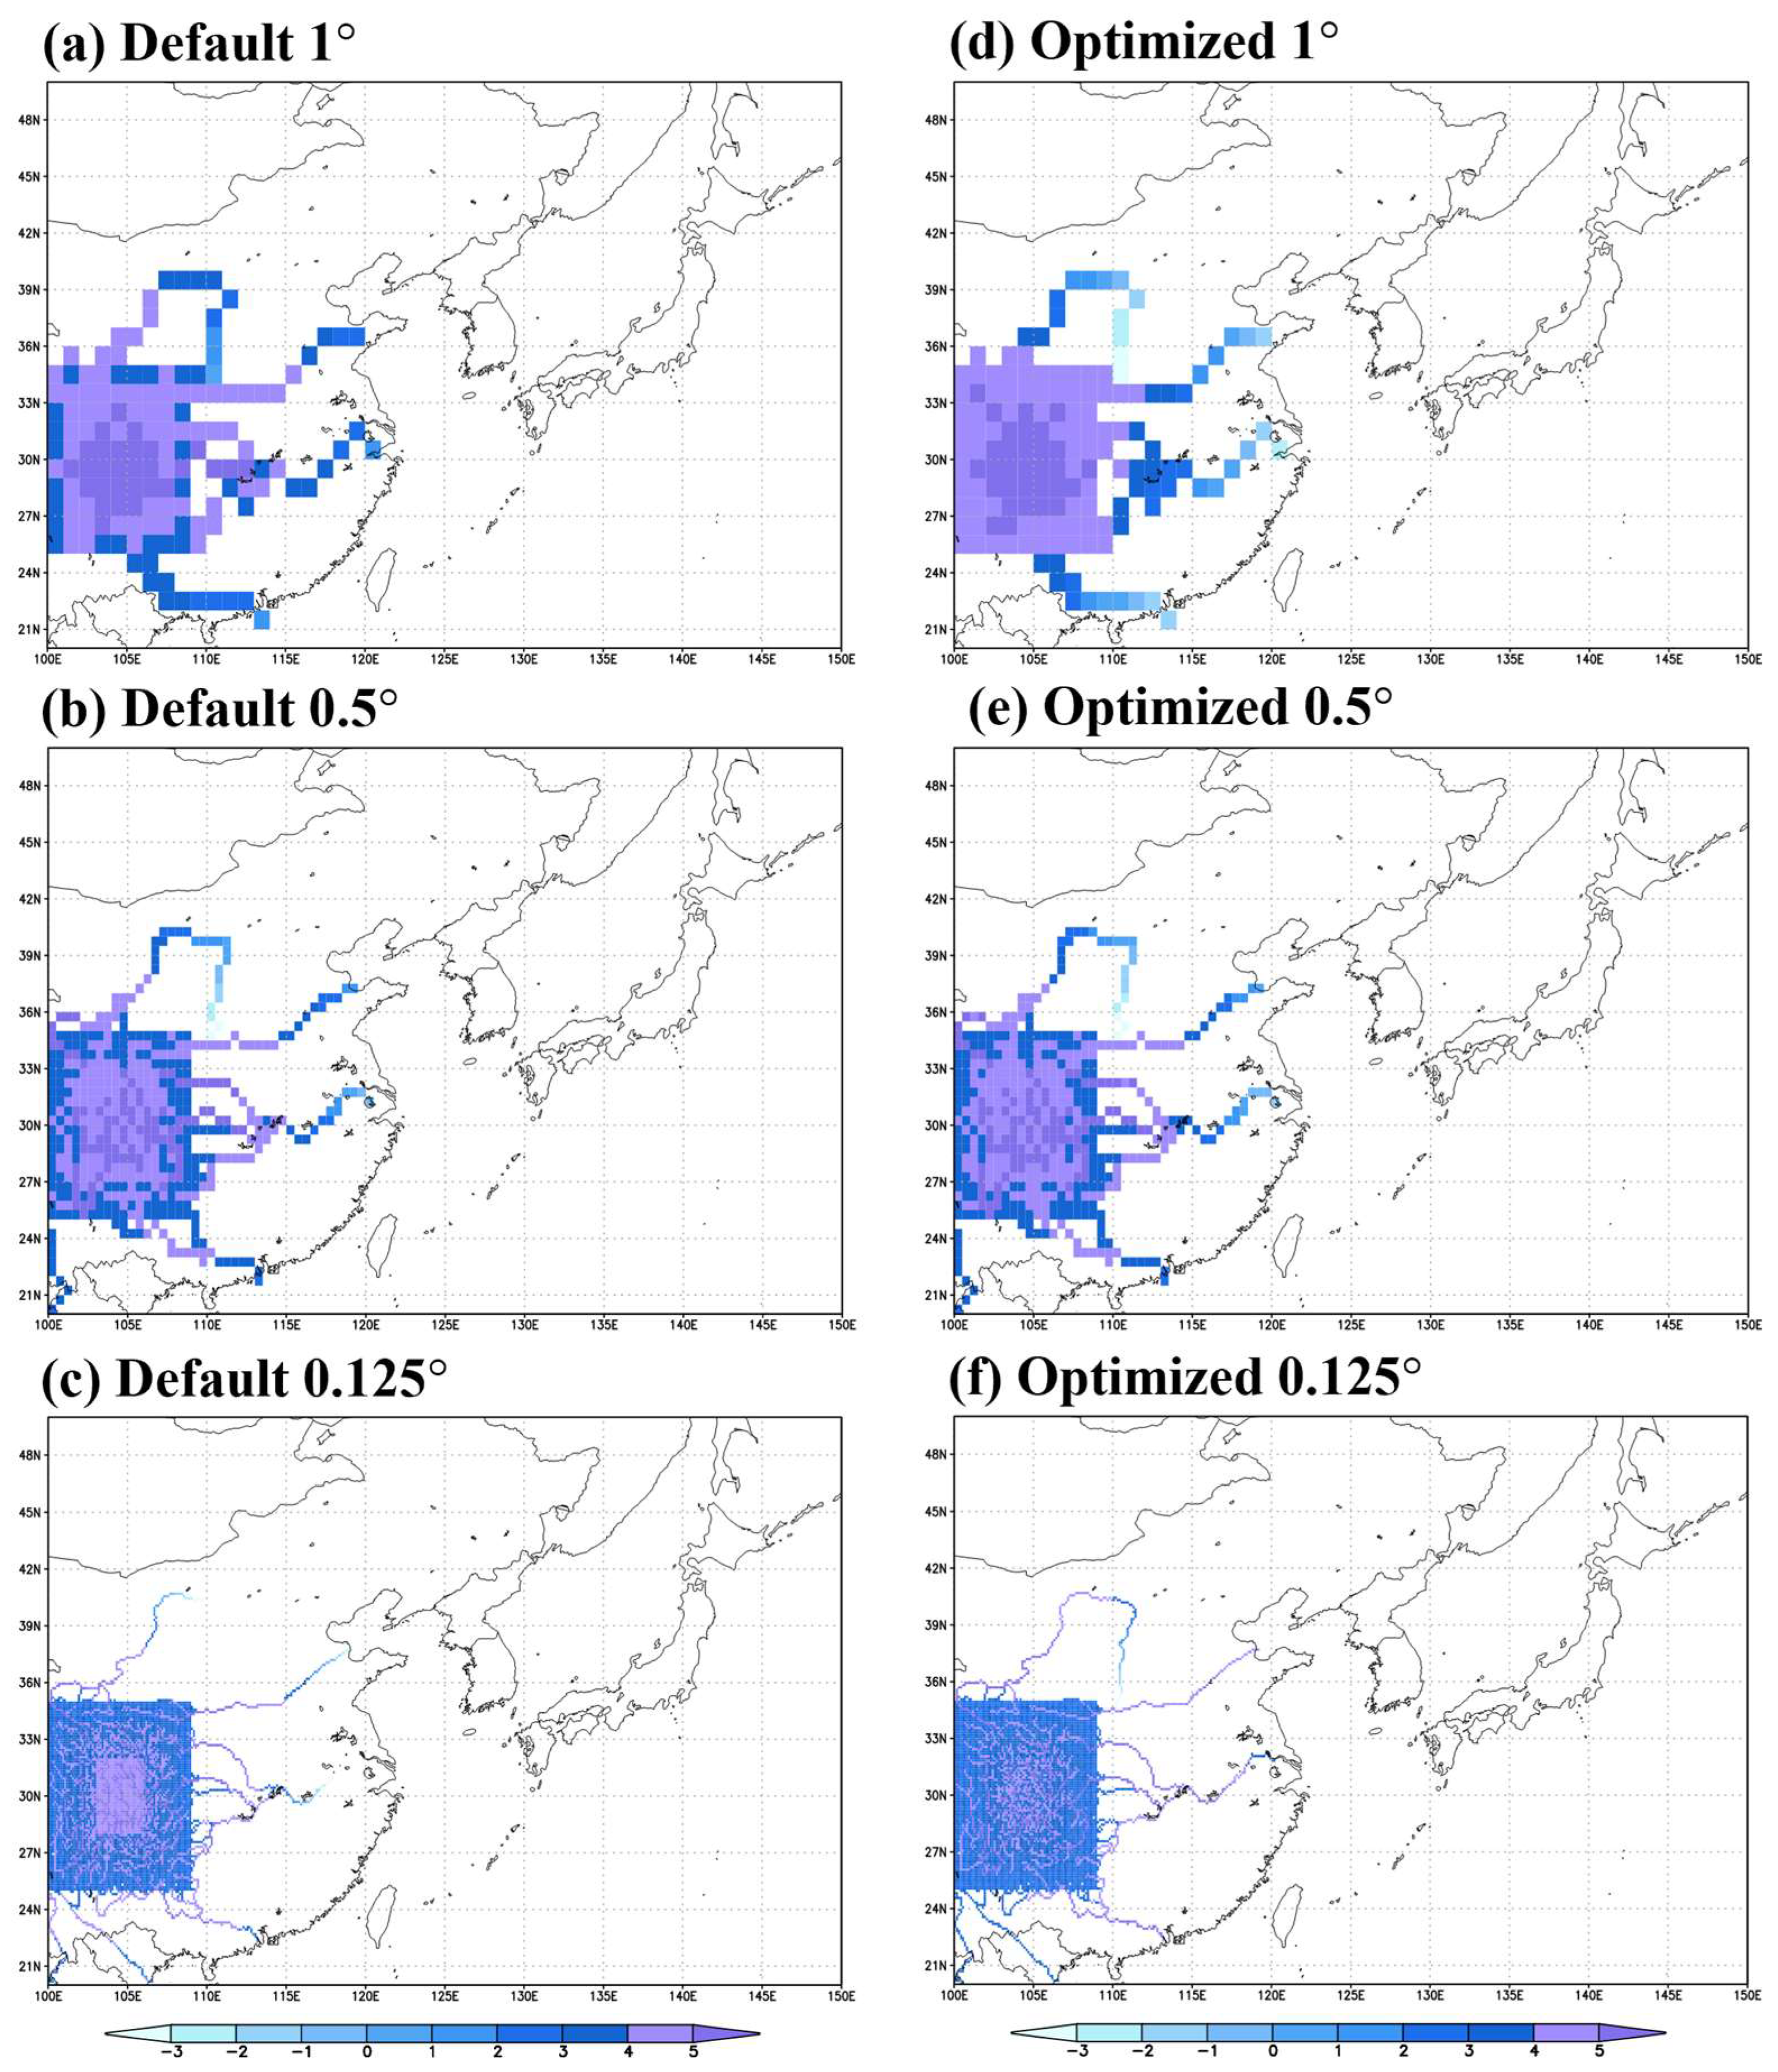
Prior to conducting experiments using real-case scenarios, we performed idealized experiments using the NTSG data (Figure 2) to optimize the river characteristics across different resolutions. This preliminary step was designed to isolate the direct effects of spatial resolution on routing performance, discharge timing, and parameter sensitivity, thereby providing a controlled baseline for interpreting the real-case experiments in the context of our central objective. The results of the experiments conducted using the default values of river speed and meandering factor (set to 0.4 in the JULES model) are shown in Figure 3a–c. Due to artificial precipitation in inland China, the river storage values in the upper regions of the Yangtze and Yellow Rivers, which were initially set to zero in our experiment, changed considerably. Even in areas without precipitation, the river storage values increased because of excess runoff that did not drain locally and subsequently propagated to the downstream grids. The 7-day integration results indicated that the grids with higher river storage values than their surroundings were well-connected, with the distribution of these connected grids closely matching the river flow path (Figure 2). These flow lines extended from the precipitation area in inland China to the Yellow Sea through river mouths.
Although the overall shapes of major rivers were similar across all resolutions, higher spatial resolutions revealed more detailed river structures. At lower resolutions, the river regions were sparsely represented by single grids, while at higher resolutions, the main streams and tributaries were expressed in greater detail. Significant differences were observed in the river flow paths. For instance, a part of a tributary of the Yellow River flowed northeast of the precipitation area, reaching 40° N, and then flowed southeastward. This tributary eventually merged with the Yellow River mainstream, but its representation varied with the resolution. At the resolution of 1°, the river was shown to merge directly with the main stream, while at higher resolutions, the river flow was observed to be slower, extending the tributary representation to approximately 40° N at 0.125° resolution (Figure 3a–c).
Previous TRIP model experiments assumed a constant flow velocity of 0.5 m s−1 and a meandering factor of 1.4 for 1° resolution [17]. The meandering factor represents the degree of river curvature and directly influences the effective length of the flow path, thereby affecting the simulated flow velocity and discharge timing. In this study, we optimized the default values of the flow velocity and meandering factor included in the JULES model (Table 1). In the TRIP model, river discharge was determined by the flow velocity, and river storage was calculated based on the discharge. Note that to achieve consistent river storage values across different resolutions, flow velocities must be similar. Therefore, instead of directly controlling the effective velocity, the meandering factor was adjusted according to the resolution. The optimization was performed by taking the default 0.5° TRIP run as the reference and defining travel time at the river mouth as the first time step when river storage changed from zero to a nonzero value. For the 1° and 0.125° simulations, the flow velocity was fixed at 0.5 m s−1, and the meandering factor was iteratively reduced until the simulated travel times matched the 0.5° reference. Specifically, we calibrated the meandering factor by matching the timing of river discharge peaks at the river mouths, ensuring that the arrival times of runoff from upstream precipitation areas were consistent across all resolutions. Additionally, spatial discharge distribution patterns were assessed to ensure that tributaries and mainstream flows were realistically represented. We assumed that higher resolutions would express river shapes that would not be represented at lower resolutions. Thus, the meandering factor was reduced from 1.4 for 1° resolution to 0.525 and 0.24 for 0.5° and 0.125° resolutions, respectively. This optimization was based on qualitative alignment of travel time and peak discharge timing, rather than formal statistical optimization, as the primary objective of this study was to examine resolution-dependent behavior.
The rationale for this resolution-dependent correction can be explained through the scaling relationship in TRIP, where travel time (T) is proportional to the product of the meandering factor ( τ ) and path length (L) divided by flow velocity (v), i.e., T ∝ τ L/v. As resolution increases, the grid explicitly resolves more curvature and tributaries, leading to longer path lengths. To preserve consistent travel times under a fixed velocity, the meandering factor must therefore decrease. Sensitivity tests further confirmed that both τ and v adjustments produce broadly similar effects on discharge and storage (Figures S1 and S2 in Supplementary). However, since velocity is a physical property of river hydraulics and should not vary solely with spatial resolution, adjusting the meandering factor is the more theoretically consistent and physically justified approach.
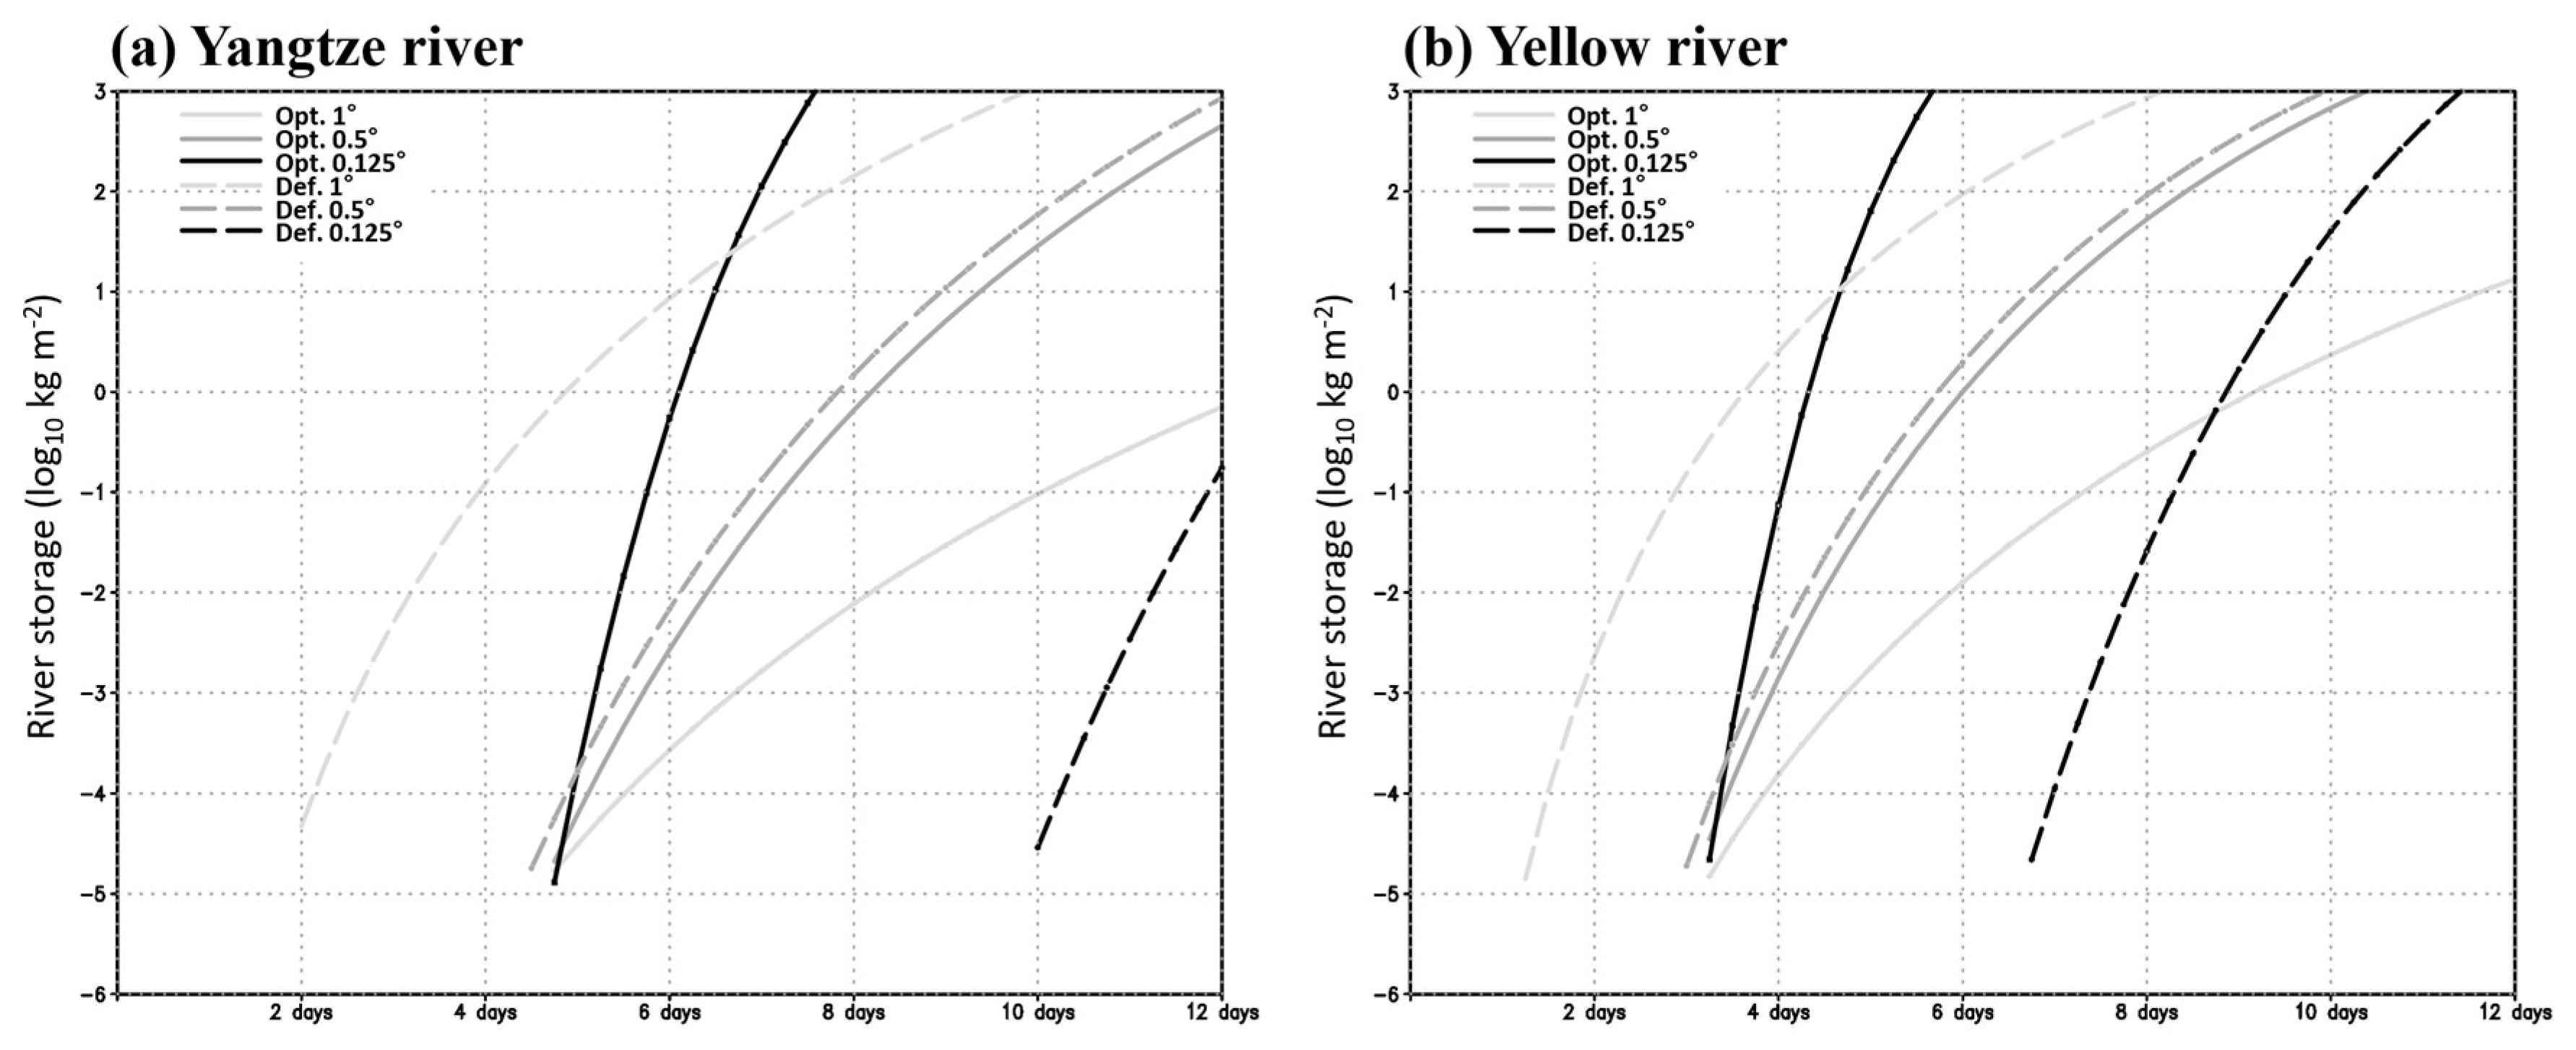
Figure 4 illustrates the time series of the river storage values at the river mouth grids. Before optimizing the river speed and meandering factor, the timing of the river storage occurrence varied with the resolution. For example, with respect to the mouth of the Yangtze River, river storage could be first observed after two days of integration at the resolution of 1°; however, at resolutions of 0.5° and 0.125°, river storage could be first observed after 4.5 and 10 days, respectively. The flow velocity decreased with increasing resolution, requiring more time for the water to reach the river mouth. In the 1°-resolution experiment using the values of Oki and Sud [17], the time required for artificial precipitation to travel from the source area to the river mouth was 4.8 and 3.2 days for the Yangtze and Yellow rivers, respectively. The results for 0.5° and 0.125° resolutions were adjusted to those for 1° resolution to achieve a consistent timing of the first occurrence of river storage. Consequently, at the resolution of 0.125°, the Yangtze River reached the river mouth approximately 4 days earlier than the period noted before the optimization (Figure 4). A similar adjustment effect was observed in the case of the Yellow River. This premature arrival at finer resolutions indicates an underestimation of travel time, which, if uncorrected, could lead to biases in peak discharge timing and reduce the reliability of flood forecasts. By aligning travel times across resolutions, optimization ensures more consistent and hydrologically meaningful simulations. Moreover, differences in the timing and volume of freshwater inflow also influence air–sea interactions in the Yellow Sea when simulated with a coupled atmosphere–ocean–TRIP framework, highlighting the broader climatic implications of these corrections.
The 7-day integration results with the optimized parameters are shown in Figure 3d–f. The simulated river shape was not significantly different from that observed in previous experiments. However, the magnitude and distribution of river storage values were more consistent across resolutions when compared to the experiments that used the default river parameters. In particular, the tributary of the Yellow River showed consistent river storage values across all resolutions, extending northeastward near 40° N before meandering southward to merge with the main stream.

3.2. Real Case Experiment

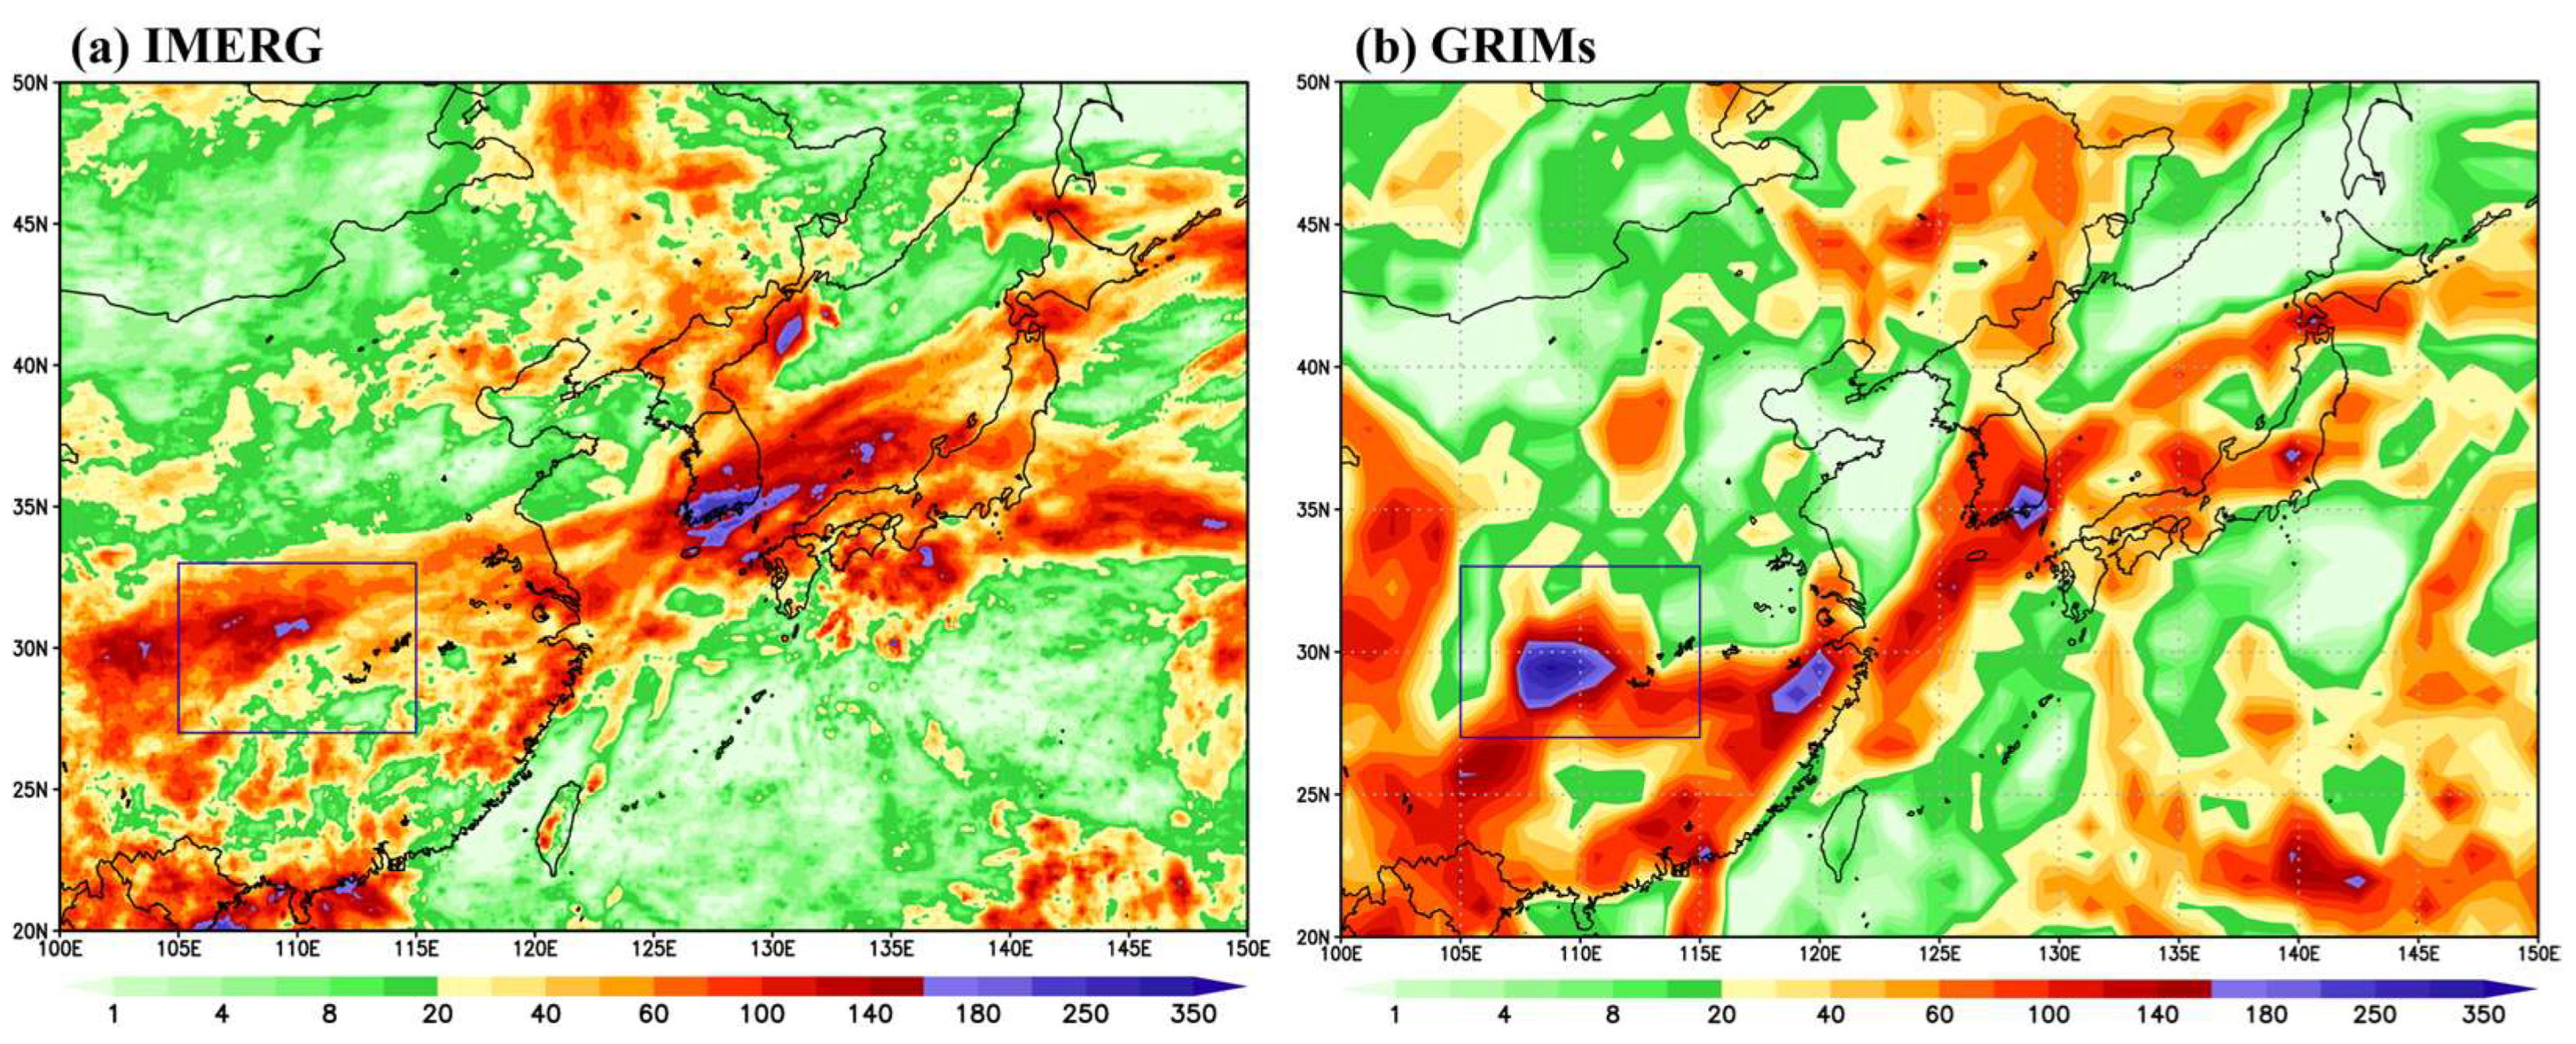
An experiment was conducted by applying a modified effective flow velocity and meandering factor. Figure 5 presents the 7-day accumulated precipitation from both the Integrated Multi-satellitE Retrievals for Global Precipitation Measurement (IMERG) observational dataset and the GRIMs simulation, the latter of which was used as the input data for the TRIP model. From 20 August 2014, over the course of one week, the midstream region of the Yangtze River (27–33° N, 105–115° E; black solid box) recorded approximately 180 mm of precipitation in the IMERG dataset, whereas the GRIMs simulation produced more than 350 mm in the same region. This precipitation band extended from inland China, across the East China Sea, to the southern part of the Korean Peninsula. The heavy precipitation pattern substantially influenced changes in river storage and discharge, with the precipitation being continuously distributed along the river flow path to the East China Sea. It is noteworthy that GRIMs clearly overestimated the precipitation compared to the IMERG dataset, which may have contributed to differences in simulated hydrological responses.
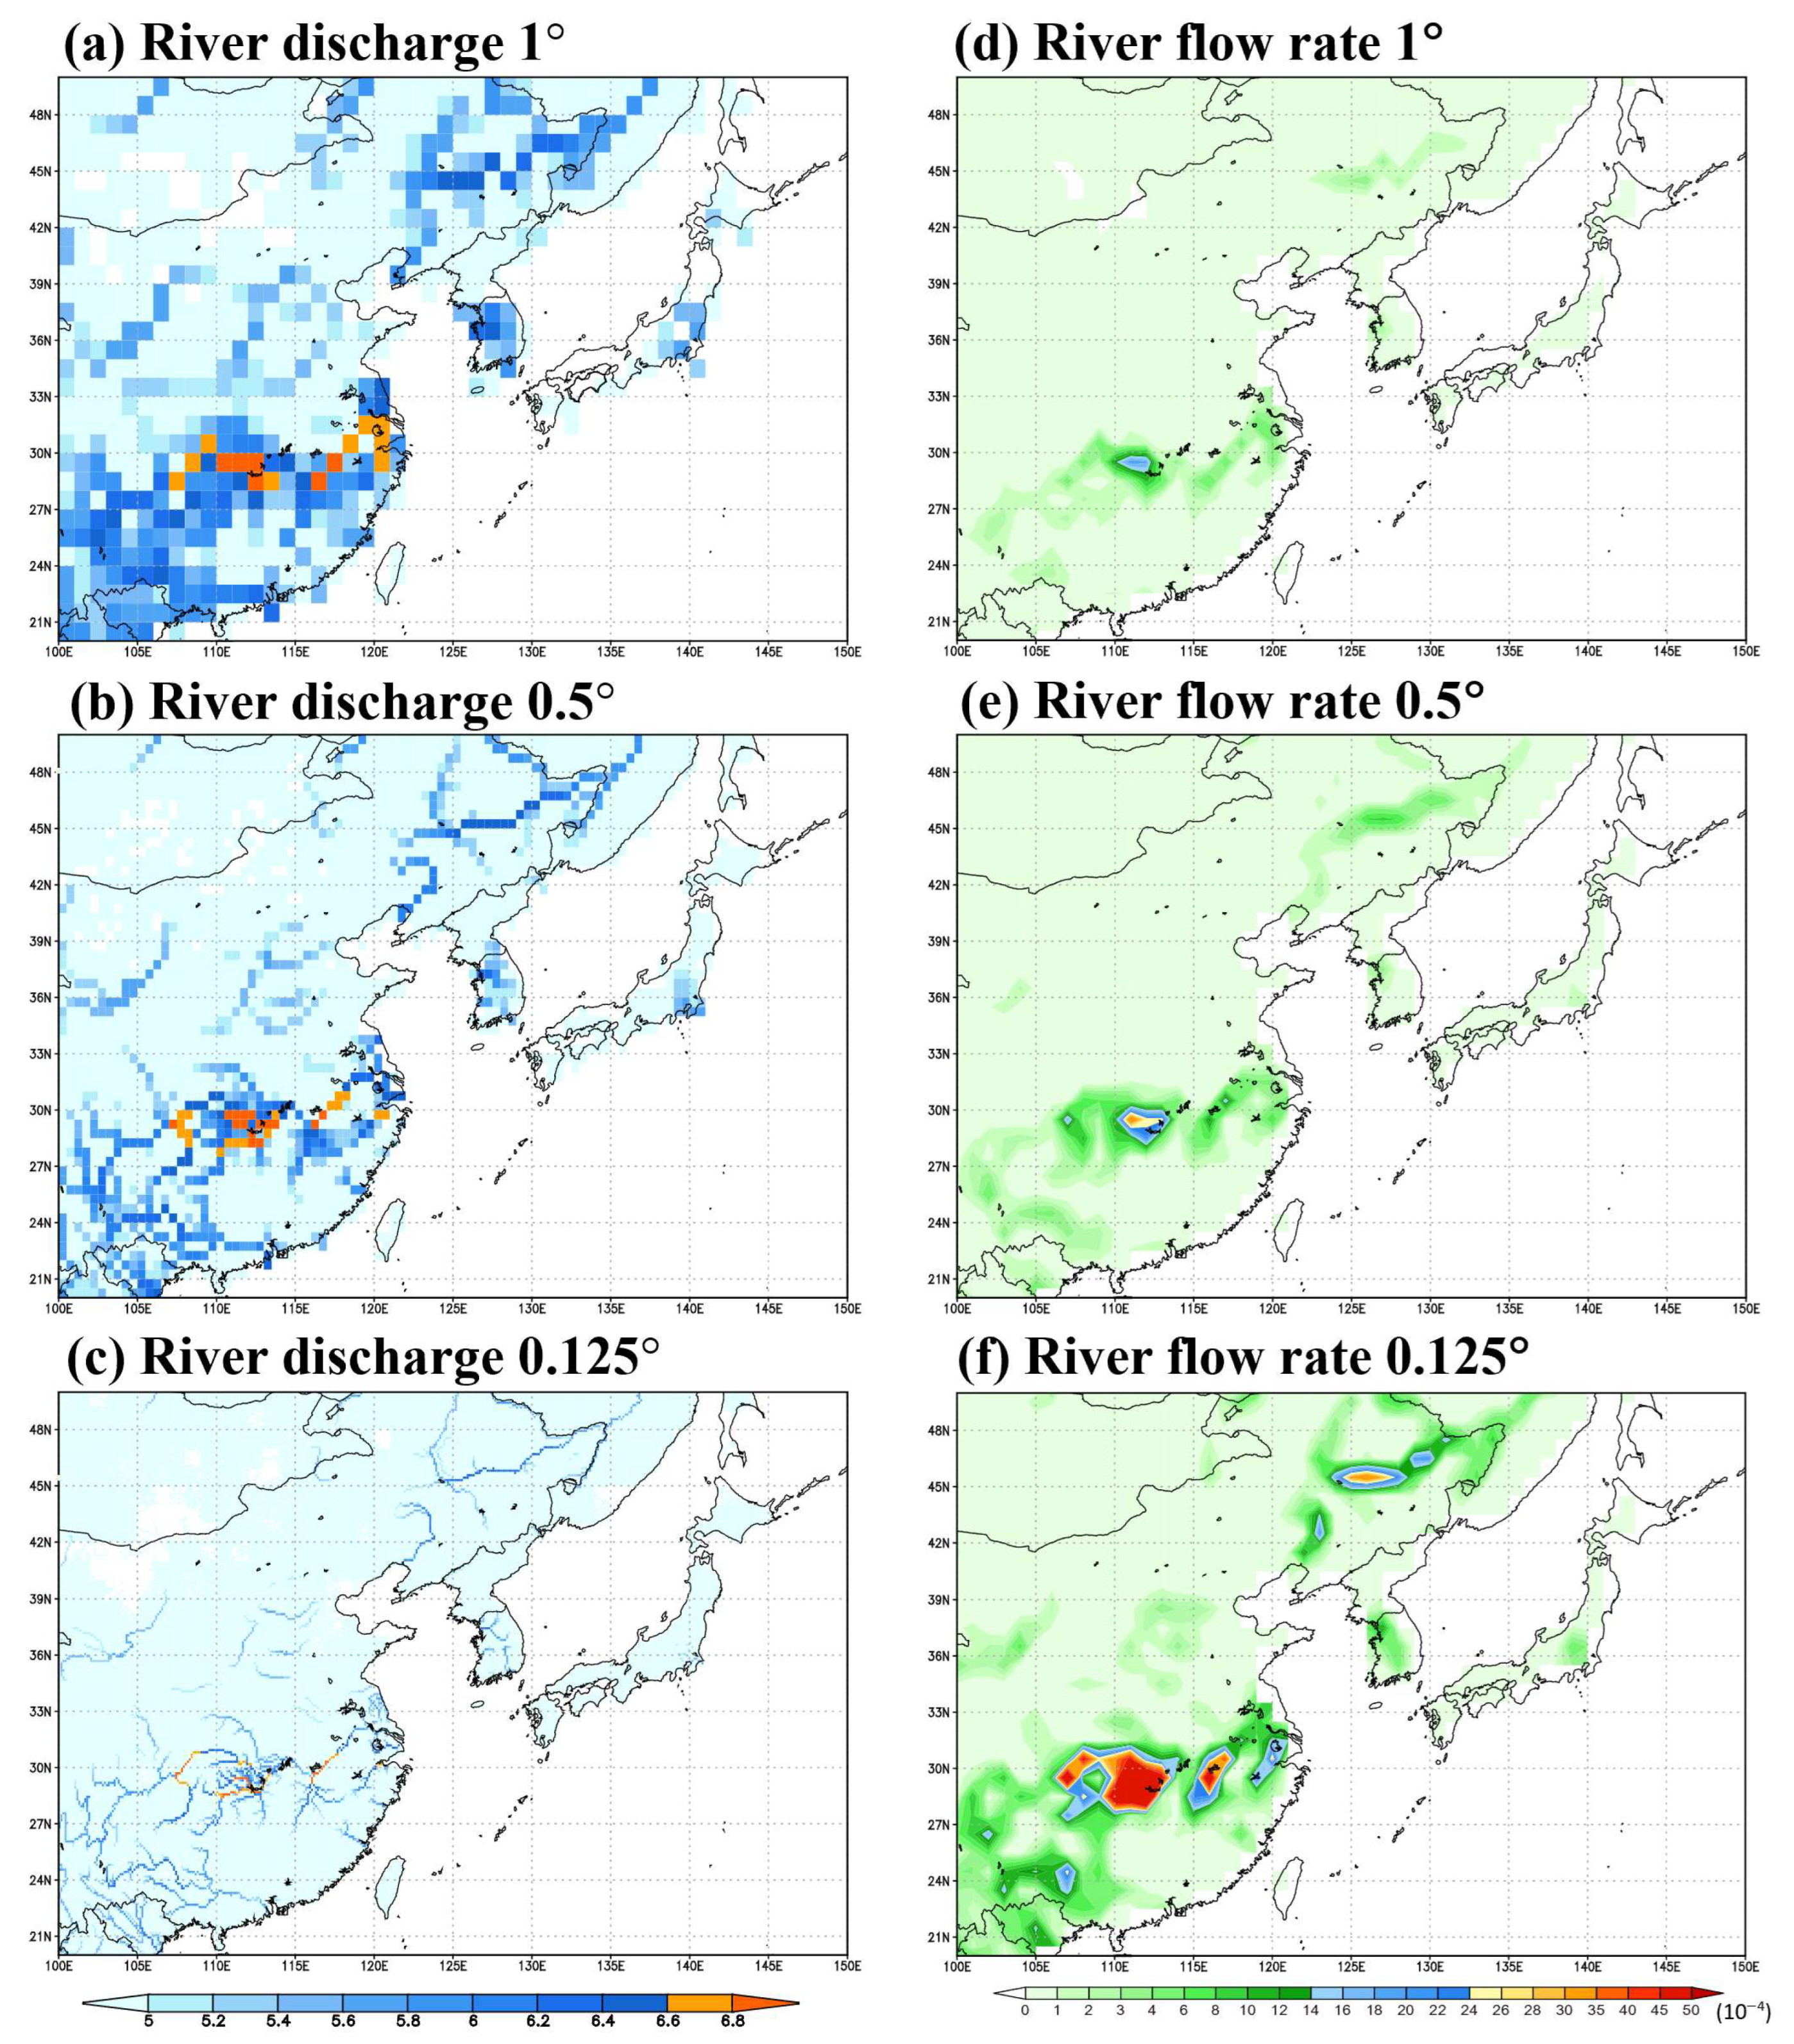
Figure 6 presents the simulation of the river discharge and river flow rate calculated using the TRIP model coupled with the JULES model (1° resolution) across different resolutions of the TRIP model.
Grid cells with higher discharge than their surroundings represented areas where runoff converged due to heavy precipitation, forming patterns that resembled river channels. This pattern was not clearly represented in the low-resolution simulation but became more distinct as the spatial resolution increased, especially in terms of how river discharge aligned with the actual river morphology. Along the Yangtze River, grid cells with discharge exceeding 6.6 log10 kg s−1 appeared downstream of the high-precipitation region. When converted into standard units, this indicates that more than 11 million tons of water flow through a single grid per hour. While similar discharge magnitudes were found in the same general regions across all resolutions, the high-resolution simulation captured finer details of the river network based on the river sequence data. Notably, in the TRIP model with 1° resolution, the Korean Peninsula was represented by several grids, whereas in the experiment at 0.125° resolution, major river basins, such as those of Han, Geum, and Nakdong, became more clearly represented and aligned with their actual geographical morphology.
The river flow rate calculated using JULES, based on the river discharge data acquired from the TRIP model, varied with the TRIP resolution. When coupled with the 1°-resolution TRIP model, the maximum flow rate in the JULES model was approximately 0.002 (km m−2 s−1). However, in the experiment conducted using the TRIP model with the resolution of 0.125°, the maximum flow rate increased to 0.008, representing a four-fold increase in the flow rate in the heavy precipitation region (Figure 6d–f). The river flow-rate results modeled using the TRIP model coupled with the JULES model with a resolution of 0.5° displayed relatively distinct detailed structures in the spatial representation of river flow (Figure S3); however, the overall magnitude depicted only a small difference compared with the results obtained with the JULES model with a resolution of 1°. This difference may be attributed to the changes in the resolution of the TRIP model; at lower resolutions, the runoff within a single grid was implicitly treated as river flow, whereas at higher resolutions, the runoff was explicitly represented as the flow between different grids. In particular, in the 0.125° TRIP experiment coupled with the 1° JULES model, the finely resolved inter-grid flows simulated by TRIP, which were not decomposed at lower resolutions, were aggregated into the coarser JULES grid, concentrating the subgrid-scale runoff transfer and amplifying the simulated river flow rate. These results demonstrated that in the regions with heavy precipitation, higher resolution improved the spatial details of river flow and discharge.
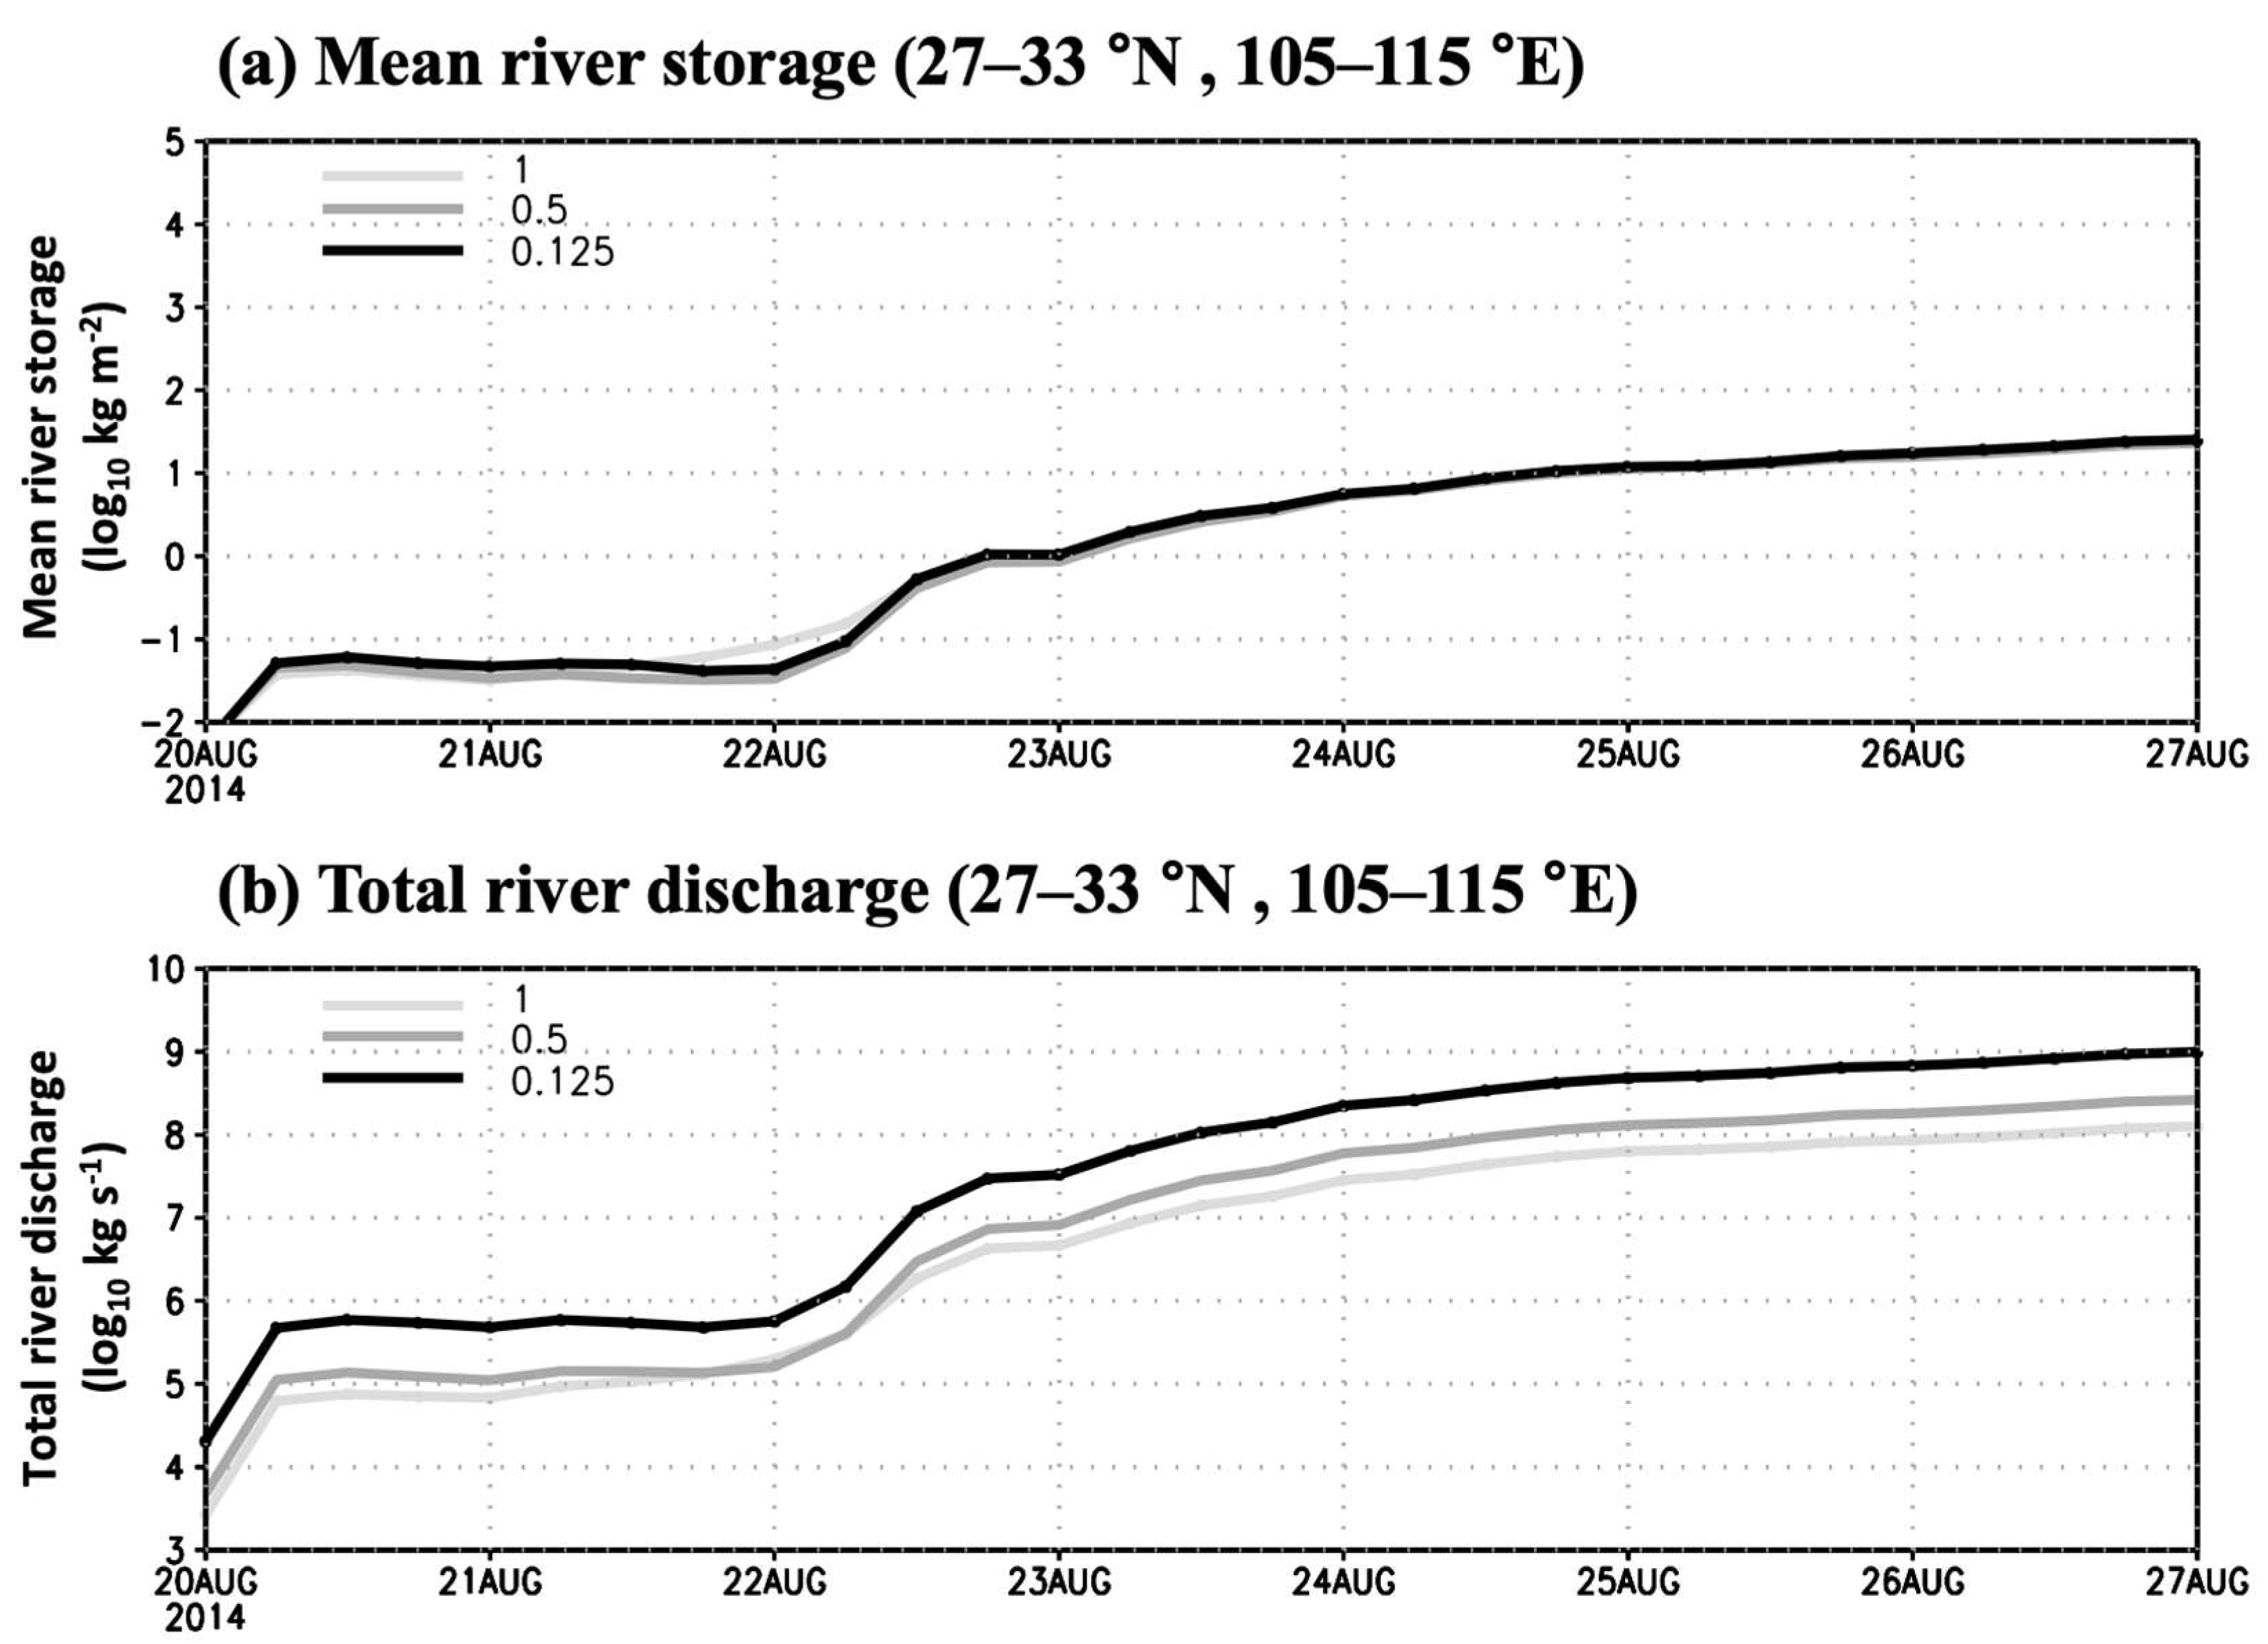
Figure 7 presents the temporal variations in the river storage and total discharge in the heavy precipitation region. After precipitation on August 22, the river storage increased sharply, displaying a similar pattern across all resolutions. Unlike the mean river storage, which depicted only small differences across the different resolutions, the total discharge exhibited significant variations. The total discharge at 0.125° resolution was approximately 10 times larger than that observed at 1° resolution and six times larger than that noted at 0.5° resolution. This discrepancy can be partly attributed to the explicit representation of tributaries and sub-basins at finer resolutions, which increases the number of flow pathways and reduces aggregation effects inherent in coarse grids. In addition, resolution-dependent adjustments of velocity and meandering factor may introduce scaling artifacts that amplify discharge magnitude. Thus, the observed differences are not solely the result of improved detail but also reflect structural and scaling sensitivities of the TRIP model. Moreover, the differences in the total discharge, with respect to different resolutions, remained relatively consistent after the heavy precipitation event; this indicates the stability of the simulations at higher resolutions.
These results demonstrate that in regions with heavy precipitation, higher resolutions can capture the variations in runoff and river storage more accurately than lower resolutions. Specifically, the results in Figure 6 and Figure 7 highlight the ability of high-resolution modeling to enhance the spatial details of river flow, thereby improving the representation of basin-specific characteristics.

4. Discussion

In this study, we evaluated the impact of spatial resolution on river discharge simulations, using the TRIP model coupled with the JULES land surface model. To assess the river flow characteristics in the study region across various resolutions, experiments were conducted using grid resolutions of 1°, 0.5°, and 0.125°.
The idealized experiments demonstrated that, while the overall river structures were consistent across the simulations at all resolutions, Figure 4 highlights resolution-dependent travel time shifts, which necessitated optimization of the meandering factor for consistency. Figure 6 and Figure 7, which already incorporate optimized parameters, further show that finer resolutions improved the representation of tributaries and mainstream flows, while still exhibiting larger variability in discharge and storage compared to coarse grids. These results indicate that although default parameter values (e.g., fixed river speed and meandering factors) cause notable discrepancies, such issues can be effectively mitigated through resolution-dependent calibration, ensuring consistent river dynamics across resolutions.
A real-case experiment, conducted over a short period, while considering a single precipitation event in inland China, indicated that high-resolution modeling could not only capture the finer spatial details of the river system, but also exhibit increased total river discharge and flow rates. These findings are consistent with previous studies that emphasize the importance of spatial resolution in hydrological modeling [28,29]. This study, however, extends prior research by quantitatively evaluating the effects of parameter optimization across resolutions through both idealized and real-case experiments.
Nevertheless, this approach was limited to a single short-term case, which constrains the generalization of the results. Further studies incorporating a wider range of precipitation events and longer simulation periods are needed to validate the robustness of the model’s performance. Extending the analysis to diverse hydro-climatic regimes, such as snowmelt- or drought-dominated basins, will be essential to fully assess the general applicability of the resolution-dependent parameter corrections. While the scaling property of TRIP is intrinsic and not specific to rainfall-driven conditions, broader testing across contrasting hydrological contexts will provide stronger evidence for its universality.
In addition, we acknowledge another limitation related to observational validation. While illustrative comparisons with observed hydrographs can provide useful insights into model behavior, we did not include such comparisons as a formal validation metric in this study. This decision was made because TRIP, even at 0.125° resolution, does not explicitly resolve individual river channels, dams, or water regulation structures. As a result, discrepancies inevitably arise between the modeled natural runoff and the observed discharge that is heavily influenced by anthropogenic controls. Therefore, while such comparisons are informative, they cannot be regarded as definitive validation. Future work integrating high-resolution routing schemes and water management processes will be required to enable more robust model verification against observed streamflow.
Recent studies have emphasized that parameter optimization is essential when applying hydrological models at high resolutions [30,31]. In particular, Kmoch et al. [13] reported that high-resolution eco-hydrological parameters significantly enhance the representation of spatial hydrological variability. Our findings also support the conclusions of Clark et al. [11], who highlighted the importance of improving the representation of hydrological processes in Earth System Models (ESMs). Our study differs from these approaches by focusing on resolution-aware calibration of river routing parameters—specifically, the systematic adjustment of the meandering factor to ensure consistent discharge timing across resolutions. This complements past efforts by operationalizing parameter optimization within routing schemes, thereby extending the applicability of high-resolution ESMs to more reliable river discharge simulations.
Through sensitivity experiments, this study established the necessity of parameter adjustments, including the use of effective velocity and meandering factors, to ensure the reliability and accuracy of river discharge simulations at varying resolutions. These findings provide critical insights into the role of spatial resolution in the modeling of hydrological processes, emphasizing the importance of tailored parameterization in enhancing the accuracy of ESM simulations.
In practical terms, improving the resolution-dependent parameterization of river routing has several implications. First, it enables river discharge models to maintain consistent river characteristics even as atmospheric models move toward higher spatial resolutions, ensuring that increased resolution does not introduce artificial discrepancies in flow representation. Second, the approach enhances climate impact assessments, as robust discharge simulations are essential for evaluating the hydrological consequences of climate variability and change. Finally, for water resources management, the ability to simulate discharge consistently across scales strengthens the utility of large-scale hydrological and Earth System Models in supporting long-term planning and adaptation strategies. However, higher resolutions inevitably increase computational cost and parameter sensitivity, and existing parameterizations may not always be directly applicable. While 0.125° resolution was the finest scale tested in this study, we do not consider it a definitive limit. The usefulness of even finer grids should be evaluated in future research as computational resources expand, to assess whether additional resolution gains meaningfully improve hydrological accuracy.

Supplementary Materials

The following supporting information can be downloaded at: https://www.mdpi.com/article/10.3390/atmos16091083/s1, Figure S1: Time series of (top) mean river discharge (log10 kg s−1) and (bottom) mean river storage (log10 kg m−2), area-averaged over 27–33° N and 105–115° E. Results are shown for TRIP models coupled with JULES at 1° (left) and 0.125° (right) resolutions. Blue to red contours indicate variations of the meandering factor from 0.1 to 2.0, with river flow velocity fixed at 0.5 m s−1., Figure S2: Same as Figure S1, but for sensitivity tests with river flow velocity varying from 0.1 to 2.0 m s−1 (blue to red contours), and the meandering factor fixed at 0.5. Figure S3: River flow rate after seven days of simulation using the TRIP model at three spatial resolutions: (a,d) 1°, (b,e) 0.5°, and (c,f) 0.125°. All simulations were conducted with optimized parameters and coupled with the Joint U.K. Land Environment Simula-tor (JULES) at a fixed resolution of 0.5°. The color bar for river flow rate represents values in kg m−2 s−1.

Author Contributions

Conceptualization, E.-C.C. and Y.-J.L.; data curation, M.K. and U.-Y.B.; formal analysis, M.K. and U.-Y.B.; funding acquisition, E.-C.C.; investigation, M.K.; methodology, M.K. and E.-C.C.; supervision, E.-C.C.; visualization, M.K.; writing—original draft preparation, M.K. and U.-Y.B.; writing—review and editing, E.-C.C. All authors have read and agreed to the published version of the manuscript.

Funding

This work was funded by the Korea Meteorological Administration Research and Development Program under Grant (RS-2024-00403386). Also, this research was supported by the Specialized university program for confluence analysis of Weather and Climate Data of the Korea Meteorological Institute (KMI), funded by the Korean government (KMA).

Institutional Review Board Statement

Not applicable.

Informed Consent Statement

Not applicable.

Data Availability Statement

The data used in this study are partially available from public sources and partially upon request. The directional data from the Total Runoff Integrating Pathways (TRIP) model provided by the Institute of Industrial Science, The University of Tokyo (TKU), are openly available at: https://hydro.iis.u-tokyo.ac.jp/~taikan/TRIPDATA/TRIPDATA.html (accessed on 2 December 2024). The global flow direction data provided by the Northwest Territories Geological Survey (NTGS), derived from HydroSHEDS and Hydro1k, can be accessed at: http://files.ntsg.umt.edu/data/DRT/upscaled_global_hydrography/by_HydroSHEDS_Hydro1k/flow_direction (accessed on 3 January 2025). Additional datasets generated and/or analyzed during the current study, including the newly produced 0.125° high-resolution input data, are available from the corresponding author upon reasonable request.

Conflicts of Interest

The authors declare no conflicts of interest.

Abbreviations

The following abbreviations are used in this manuscript:
TRIPTotal runoff integrating pathways
JULESJoint UK Land Environment Simulator
ESMEarth system model
NTGSNorthwest Territories Geological Survey
IMERGIntegrated Multi-satellitE Retrievals for Global Precipitation Measurement
GRIMsGlobal/Regional Integrated Model system
NCEPNational Centers for Environmental Prediction
DOEDepartment of energy
ETOPO5Earth topography five-minute grid
DEMDigital elevation map
UMMet Office Unified Model

References

  1. Seto, K.C.; Güneralp, B.; Hutyra, L.R. Global forecasts of urban expansion to 2030 and direct impacts on biodiversity and carbon pools. Proc. Natl. Acad. Sci. USA 2012, 109, 16083–16088. [Google Scholar] [CrossRef]
  2. He, C.; Tian, J.; Zhang, Q.; Wu, J.; Li, J. Future global urban water scarcity and potential solutions. Nat. Commun. 2021, 12, 4667. [Google Scholar] [CrossRef] [PubMed]
  3. Zhu, M.; Wang, S.; Kong, X.; Zheng, W.; Feng, W.; Zhang, X.; Yuan, R.; Song, X.; Sprenger, M. Interaction of surface water and groundwater influenced by groundwater over-extraction, waste water discharge and water transfer in Xiong’an New Area, China. Water 2019, 11, 539. [Google Scholar] [CrossRef]
  4. Li, Z.; Fang, Y.; Meng, B.; Guo, H.; Du, X. Identification of groundwater—Surface water interaction using combined hydraulic and hydrogeochemical methods. Water 2024, 16, 2777. [Google Scholar] [CrossRef]
  5. Pielke, R.A., Sr. Influence of the spatial distribution of vegetation and soils on the prediction of cumulus convective rainfall. Rev. Geophys. 2001, 39, 151–177. [Google Scholar] [CrossRef]
  6. Boucher, O.; Myhre, G.; Myhre, A. Direct human influence of irrigation on atmospheric water vapour and climate. Clim. Dyn. 2004, 22, 597–603. [Google Scholar] [CrossRef]
  7. Koster, R.D.; Sud, Y.C.; Guo, Z.; Dirmeyer, P.A.; Bonan, G.; Oki, T.; Cox, P.; Davies, H.; Gordon, C.T.; Kanae, S.; et al. Regions of strong coupling between soil moisture and precipitation. Science 2004, 305, 1138–1140. [Google Scholar] [CrossRef]
  8. Cook, B.I.; Bonan, G.B.; Levis, S. Soil moisture feedbacks to precipitation in southern Africa. J. Clim. 2006, 19, 4198–4206. [Google Scholar] [CrossRef]
  9. Seneviratne, S.I.; Corti, T.; Davin, E.L.; Hirschi, M.; Jaeger, E.B.; Lehner, I.; Orlowsky, B.; Teuling, A.J. Investigating soil moisture—Climate interactions in a changing climate: A review. Earth-Sci. Rev. 2010, 99, 125–161. [Google Scholar] [CrossRef]
  10. Guillod, B.P.; Orlowsky, B.; Miralles, D.G.; Teuling, A.J.; Seneviratne, S.I. Reconciling spatial and temporal soil moisture effects on afternoon rainfall. Nat. Commun. 2015, 6, 6443. [Google Scholar] [CrossRef]
  11. Clark, M.P.; Fan, Y.; Lawrence, D.M.; Adam, J.C.; Bolster, D.; Gochis, D.J.; Hooper, R.P.; Kumar, M.; Leung, L.R.; Mackay, D.S.; et al. Improving the representation of hydrologic processes in Earth System Models. Water Resour. Res. 2015, 51, 5929–5956. [Google Scholar] [CrossRef]
  12. Wedi, N.P. Increasing horizontal resolution in numerical weather prediction and climate simulations: Illusion or panacea? Philos. Trans. R. Soc. A Math. Phys. Eng. Sci. 2014, 372, 20130289. [Google Scholar] [CrossRef]
  13. Kmoch, A.; Kanal, A.; Astovar, A.; Kull, A.; Virro, A.; Partel, M.; Sepp, K. EstSoil-EH: A high-resolution eco-hydrological modelling parameters dataset for Estonia. Earth Syst. Sci. Data 2021, 13, 83–97. [Google Scholar] [CrossRef]
  14. Towler, E.; Foks, S.S.; Dugger, A.L.; Dickinson, J.E.; Essaid, H.I.; Gochis, D.; Viger, R.J.; Zhang, Y. Benchmarking high resolution hydrologic model performance of long-term retrospective streamflow simulations in the contiguous United States. Hydrol. Earth Syst. Sci. 2023, 27, 1809–1825. [Google Scholar] [CrossRef]
  15. Boeing, F.; Rakovec, O.; Kumar, R.; Samaniego, L.; Schrön, M.; Hildebrandt, A.; Rebmann, C.; Thober, S.; Müller, S.; Zacharias, S.; et al. High resolution drought simulations and comparison to soil moisture observations in Germany. Hydrol. Earth Syst. Sci. 2022, 26, 5137–5161. [Google Scholar] [CrossRef]
  16. Hanasaki, N.; Matsuda, H.; Fujiwara, M.; Hirabayashi, Y.; Seto, S.; Kanae, S.; Oki, T. Toward hyper resolution global hydrological models including human activities: Application to Kyushu island, Japan. Hydrol. Earth Syst. Sci. 2022, 26, 1953–1975. [Google Scholar] [CrossRef]
  17. Oki, T.; Sud, Y.C. Design of Total Runoff Integrating Pathways (TRIP)—A global river channel network. Earth Interact. 1998, 2, 1–37. [Google Scholar] [CrossRef]
  18. Oki, T.; Nishimura, T.; Dirmeyer, P. Assessment of annual runoff from land surface models using Total Runoff Integrating Pathways (TRIP). J. Meteorol. Soc. Japan. Ser. II 1999, 77, 235–255. [Google Scholar] [CrossRef]
  19. Alkama, R.; Decharme, B.; Douville, H.; Becker, M.; Cazenave, A.; Sheffield, J.; Voldoire, A.; Tyteca, S.; Le Moigne, P. Global evaluation of the ISBA-TRIP continental hydrological system. Part I: Comparison to GRACE terrestrial water storage estimates and in situ river discharges. J. Hydrometeorol. 2010, 11, 583–600. [Google Scholar] [CrossRef]
  20. Mouri, G.; Minoshima, D.; Golosov, V.N.; Chalov, S.R.; Seto, S.; Yoshimura, K.; Nakamura, S.; Oki, T. Probability assessment of flood and sediment disasters in Japan using the Total Runoff-Integrating Pathways model. Int. J. Disaster Risk Reduct. 2013, 3, 31–43. [Google Scholar] [CrossRef]
  21. National Geophysical Data Center. Data Announcement 88-MGG-02, Digital Relief of the Surface of the Earth; NOAA, National Geophysical Data Center: Boulder, CO, USA, 1988. Available online: https://www.ngdc.noaa.gov/mgg/global/relief/ETOPO5/TOPO/ETOPO5 (accessed on 2 December 2024).
  22. Oki, T.; Agata, Y.; Kanae, S.; Saruhashi, T.; Yang, D.; Musiake, K. Global water resources assessment under climatic change in 2050 using TRIP. IAHS Publ. 2003, 280, 124–133. [Google Scholar]
  23. Kim, J.-E.; Hong, S.-Y. A global atmospheric analysis dataset downscaled from the NCEP–DOE reanalysis. J. Clim. 2012, 25, 2527–2534. [Google Scholar] [CrossRef]
  24. Hong, S.-Y.; Park, H.; Cheong, H.C.; Kim, J.-E.; Koo, M.-S.; Jang, J.; Ham, S.; Hwang, S.O.; Park, B.K.; Chang, E.C.; et al. The Global/Regional Integrated Model System (GRIMs). Asia-Pac. J. Atmos. Sci. 2013, 49, 219–243. [Google Scholar] [CrossRef]
  25. Kanamitsu, M.; Ebisuzaki, W.; Woollen, J.; Yang, S.-K.; Hnilo, J.J.; Fiorino, M.; Potter, G.L. NCEP-DOE AMIP-II Reanalysis (R-2). Bull. Am. Meteorol. Soc. 2002, 83, 1631–1644. [Google Scholar] [CrossRef]
  26. Chang, E.-C.; Yeh, S.-W.; Hong, S.-Y.; Kim, J.-E.; Wu, R.; Yoshimura, K. Study on the changes in the East Asian precipitation in the mid-1990s using a high-resolution global downscaled atmospheric data set. J. Geophys. Res. Atmos. 2014, 119, 2279–2293. [Google Scholar] [CrossRef]
  27. Walters, D.N.; Boutle, I.A.; Brooks, M.E.; Melvin, T.; Stratton, R.A.; Vosper, S.B.; Wells, H.; Williams, K.D.; Wood, N.; Allen, T.; et al. The Met Office Unified Model Global Atmosphere 6.0/6.1 and JULES Global Land 6.0/6.1 configurations. Geosci. Model Dev. 2017, 10, 1487–1520. [Google Scholar] [CrossRef]
  28. Cortés-Salazar, N.; Vásquez, N.; Mizukami, N.; Mendoza, P.A.; Vargas, X. To what extent does river routing matter in hydrological modeling? Hydrol. Earth Syst. Sci. 2023, 27, 3505–3524. [Google Scholar] [CrossRef]
  29. Munier, S.; Decharme, B. River network and hydro-geomorphological parameters at 1/12° resolution for global hydrological and climate studies. Earth Syst. Sci. Data 2022, 14, 2239–2258. [Google Scholar] [CrossRef]
  30. Liu, X.; Kan, G.; Ding, L.; He, X.; Liu, R.; Liang, K. Improving the performance of hydrological model parameter uncertainty analysis using a constrained multi-objective intelligent optimization algorithm. Water 2023, 15, 2700. [Google Scholar] [CrossRef]
  31. Koutroulis, A.G.; Grillakis, M.G.; Mathison, C.T.; Burke, E.J. River parametrisation of the JULES land surface model for improved runoff routing at the global scale. In Proceedings of the EGU General Assembly 2021, Online, 19–30 April 2021. [Google Scholar] [CrossRef]
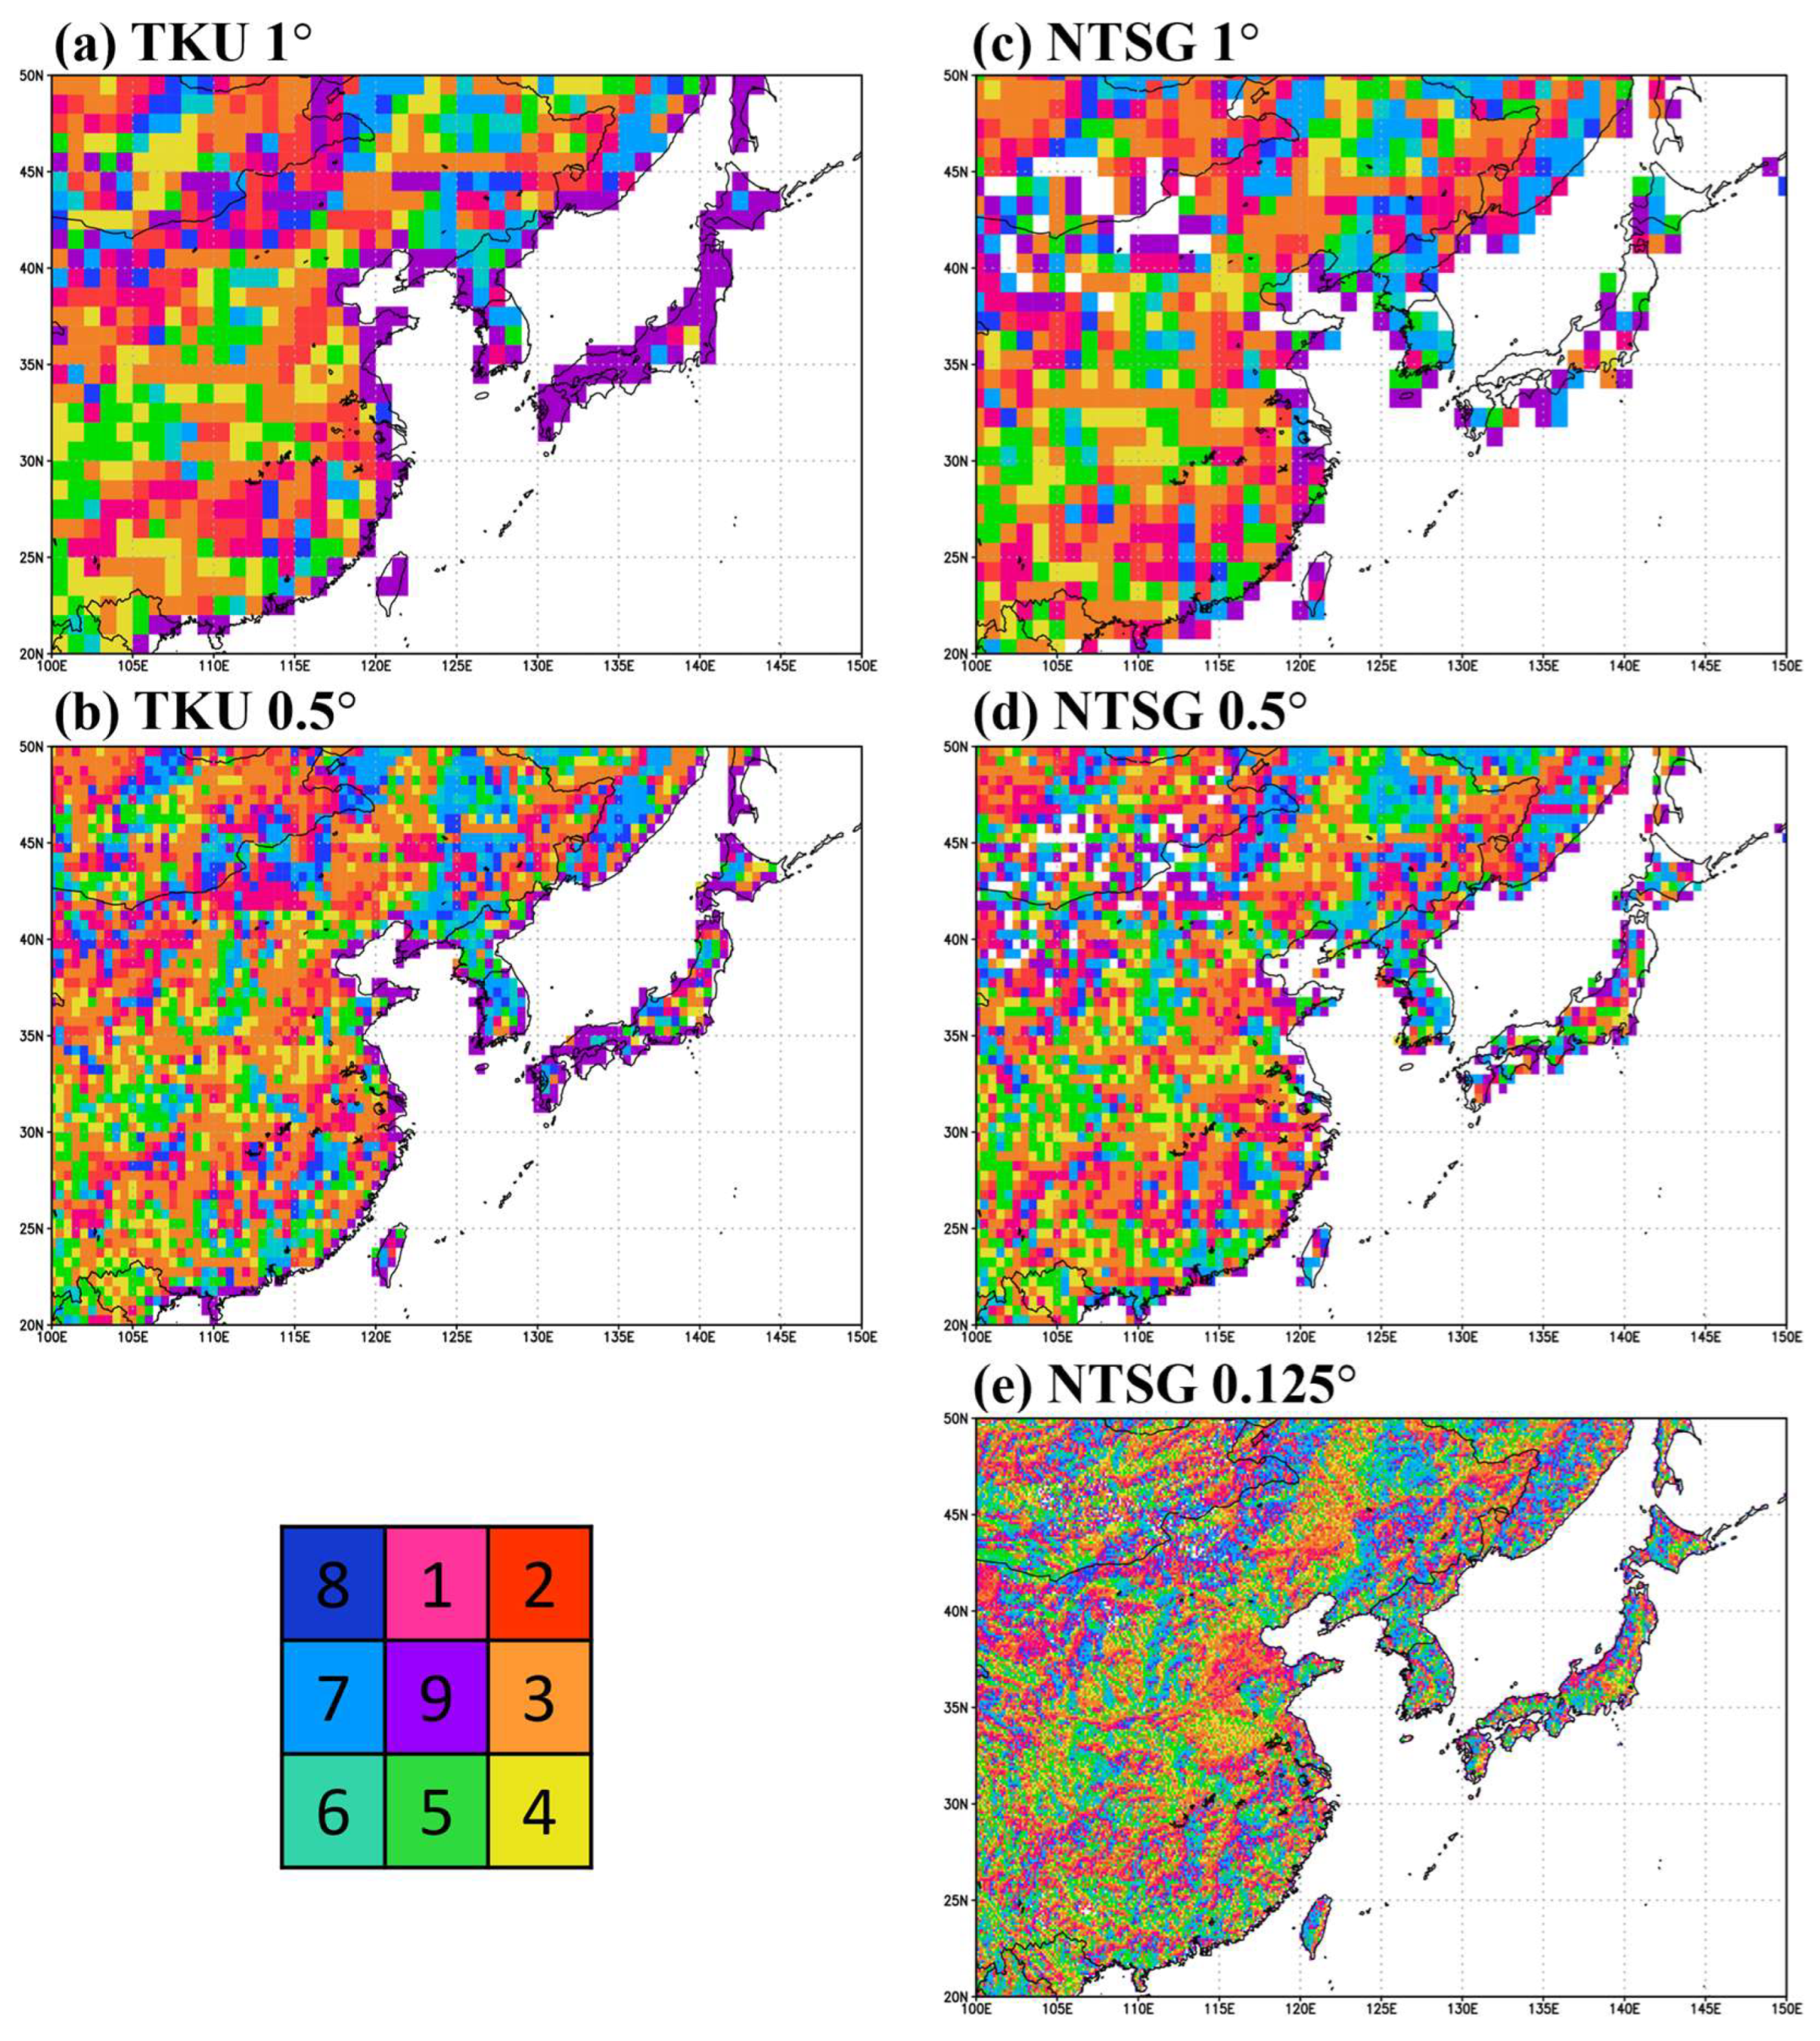
Figure 1. Terrain direction data used for the total runoff integrating pathway (TRIP) model with respect to the different resolutions: (a,c) 1°, (b,d) 0.5°, and (e) 0.125°, while considering the University of Tokyo (TKU; left column) and Northwest Territories Geological Survey (NTGS; right column) datasets.
Atmosphere 16 01083 g001
Figure 2. River sequence data for the TRIP model for different resolutions: (a,c) 1°, (b,d) 0.5°, and (e) 0.125°, with respect to the TKU (left column) and NTGS (right column) datasets.
Atmosphere 16 01083 g002
Figure 3. Seven-day forecast of river storage (log10 kg m−2) from idealized experiments using TRIP at three spatial resolutions: (a,d) 1°, (b,e) 0.5°, and (c,f) 0.125°. Results are shown for simulations with the default parameters (left; using the original velocity and meandering factor values from Oki and Sud, 1998 [17]) and with the optimized parameters (right; using adjusted meandering factors calibrated to align discharge timing across resolutions).
Atmosphere 16 01083 g003
Figure 4. Time series of the occurrence of river storage (log10 kg m−2) at the river mouth grid cells of the (a) Yangtze River (31.749° N, 121.117° E) and (b) Yellow River (37.776° N, 119.070° E).
Atmosphere 16 01083 g004
Figure 5. Seven-day accumulated precipitation (mm) for the period starting on 20 August 2014 (00:00 UTC) over East Asia: (a) IMERG observational dataset and (b) GRIMs model simulation, which was used as input data for the TRIP model. The black box denotes the geographical region of focus for this study.
Atmosphere 16 01083 g005
Figure 6. River discharge (left) and river flow rate (right) after seven days of simulation using the TRIP model at three spatial resolutions: (a,d) 1°, (b,e) 0.5°, and (c,f) 0.125°. All simulations were conducted with optimized parameters and coupled with the Joint U.K. Land Environment Simulator (JULES) at a fixed resolution of 1°. The color bar for river discharge represents log10 values (kg s−1), and that for river flow rate represents values in kg m−2 s−1.
Atmosphere 16 01083 g006
Figure 7. Temporal variations in the (a) mean river storage (log10 kg m−2) and (b) total river discharge (log10 kg s−1) in the heavy precipitation region (27–33° N, 105–115° E) (see the black solid box in Figure 5).
Atmosphere 16 01083 g007
Table 1. Parameters that affected the river flow characteristics at different resolutions in the total runoff integrating pathway (TRIP) model, along with the default and optimized values for flow velocity and meandering factor for 1°, 0.5°, and 0.125° resolutions.
Factor0.5°0.125°
Default valueRiver speed0.40.40.4
Meandering0.40.40.4
Optimized valueRiver speed0.50.50.5
Meandering1.50.5250.24
Disclaimer/Publisher’s Note: The statements, opinions and data contained in all publications are solely those of the individual author(s) and contributor(s) and not of MDPI and/or the editor(s). MDPI and/or the editor(s) disclaim responsibility for any injury to people or property resulting from any ideas, methods, instructions or products referred to in the content.